1. Introduction
Louisiana (USA) faces a perilous future due to a combination of climate-driven rising sea levels and a subsiding coastal territory. This situation threatens towns and cities, natural-resource based economic activity, and extensive infrastructure. Similar conditions exist in other locations around the world. Louisiana is somewhat distinct since for more than half a century, cartographers and scientists have been tracking the disappearing littoral landscape. These maps have provided a valuable view of previously unseen conditions, and in response policy makers and government bodies have mobilized efforts to try to transform an uncertain future into a sustainable one. This paper analyzes the emergence of cartographic visualizations of the coastal land loss situation in Louisiana and considers how those maps have been used to transform a virtually invisible environmental process into a major focus for state investments. The central lesson learned from this enduring process is that public awareness and public policy rested on a foundation of dramatic geographic depictions of a changing environment.
Early cartographic renditions of the Louisiana coast are vague in their delineation of the shore. There are no bold headlands, no stark cliffs, no tall forests, no obvious indigenous settlements. Rather than impressive topography, the coast is mostly a vast low-lying marsh where it is difficult to distinguish where water ends and land begins. The blurry boundary has been an element in the long-standing debate about LaSalle’s failure to return to the Mississippi River in 1685 [
1,
2]. The shoreline, while not invisible, was largely unpopulated and conspicuously overlooked by early European explorers and colonists. In Mississippi and Alabama, French established settlements near the beach, while in Louisiana, the principal settlement was some 100 miles upstream on the firm banks of the Mississippi River, admittedly taking advantage of a portage that provided ready access to Lake Pontchartrain—in reality a large bay with a marshy fringe.
Nearly three centuries after French settlement in coastal Louisiana, the threat of losing what had been ignored has become the state’s high-profile official “crisis” [
3,
4]. What was dismissed by early European explorers and cartographers as insignificant is now the centerpiece of the state’s most ambitious public works spending program. Billions of dollars are dedicated to salvaging a frazzling coastline. Indeed, the budget to offset the disappearing littoral landscape eclipses all other state investments in the coming half century—and reaches a sum well beyond the funds available. State officials estimate a somewhat conservative
$50 billion dollars to implement the restoration program [
3,
4]. What has transformed this invisible landscape into the cause celebré? How has the state been able to sell an expensive program that acknowledges rising sea levels in a climate-change skeptical region? How have state officials advanced a plan that touts a sustainable future to a populace adverse to planning and the concept of sustainability? How has it been inserted into the popular geographical imaginations of residents and policy makers? I will trace this transition and use a series of late twentieth century maps as the subject of analysis. Specifically, I will examine how depictions of land loss changed since the early 1980s and how corresponding developments in ecological science and public policy along with dramatic hazard events shaped understanding of the possibilities for coastal renewal, and how the combination of all these elements contributed to the emerging discussion about coastal restoration. This discussion demonstrates how effective cartographic presentations can expose critical issues facing coastal societies in other regions of the world and motivate efforts toward more sustainable policies.
2. Making the Coast Invisible
European explorers traversed the Gulf Coast and selected sites for early outposts on headlands in protected bays such as Pensacola and Mobile. Tierra firma mattered as did the advantages of safe harborage and military defense. The murky bayous and shallow bays surrounded by marsh in what became Louisiana offered no such site advantages. Nonetheless, control of the Mississippi River basin thoroughly offset any disadvantages of the French colony’s unappealing coast. By the time the U.S. acquired Louisiana in 1803, settlers had expanded across the inland, natural levees of south Louisiana, while largely avoiding the neighboring marshes. Only the displaced Houma Indians, escaped slaves, and a few other marginalized groups found refuge in the coastal wetlands. Geographical depictions of the region expose the neglect of this avoided expanse.
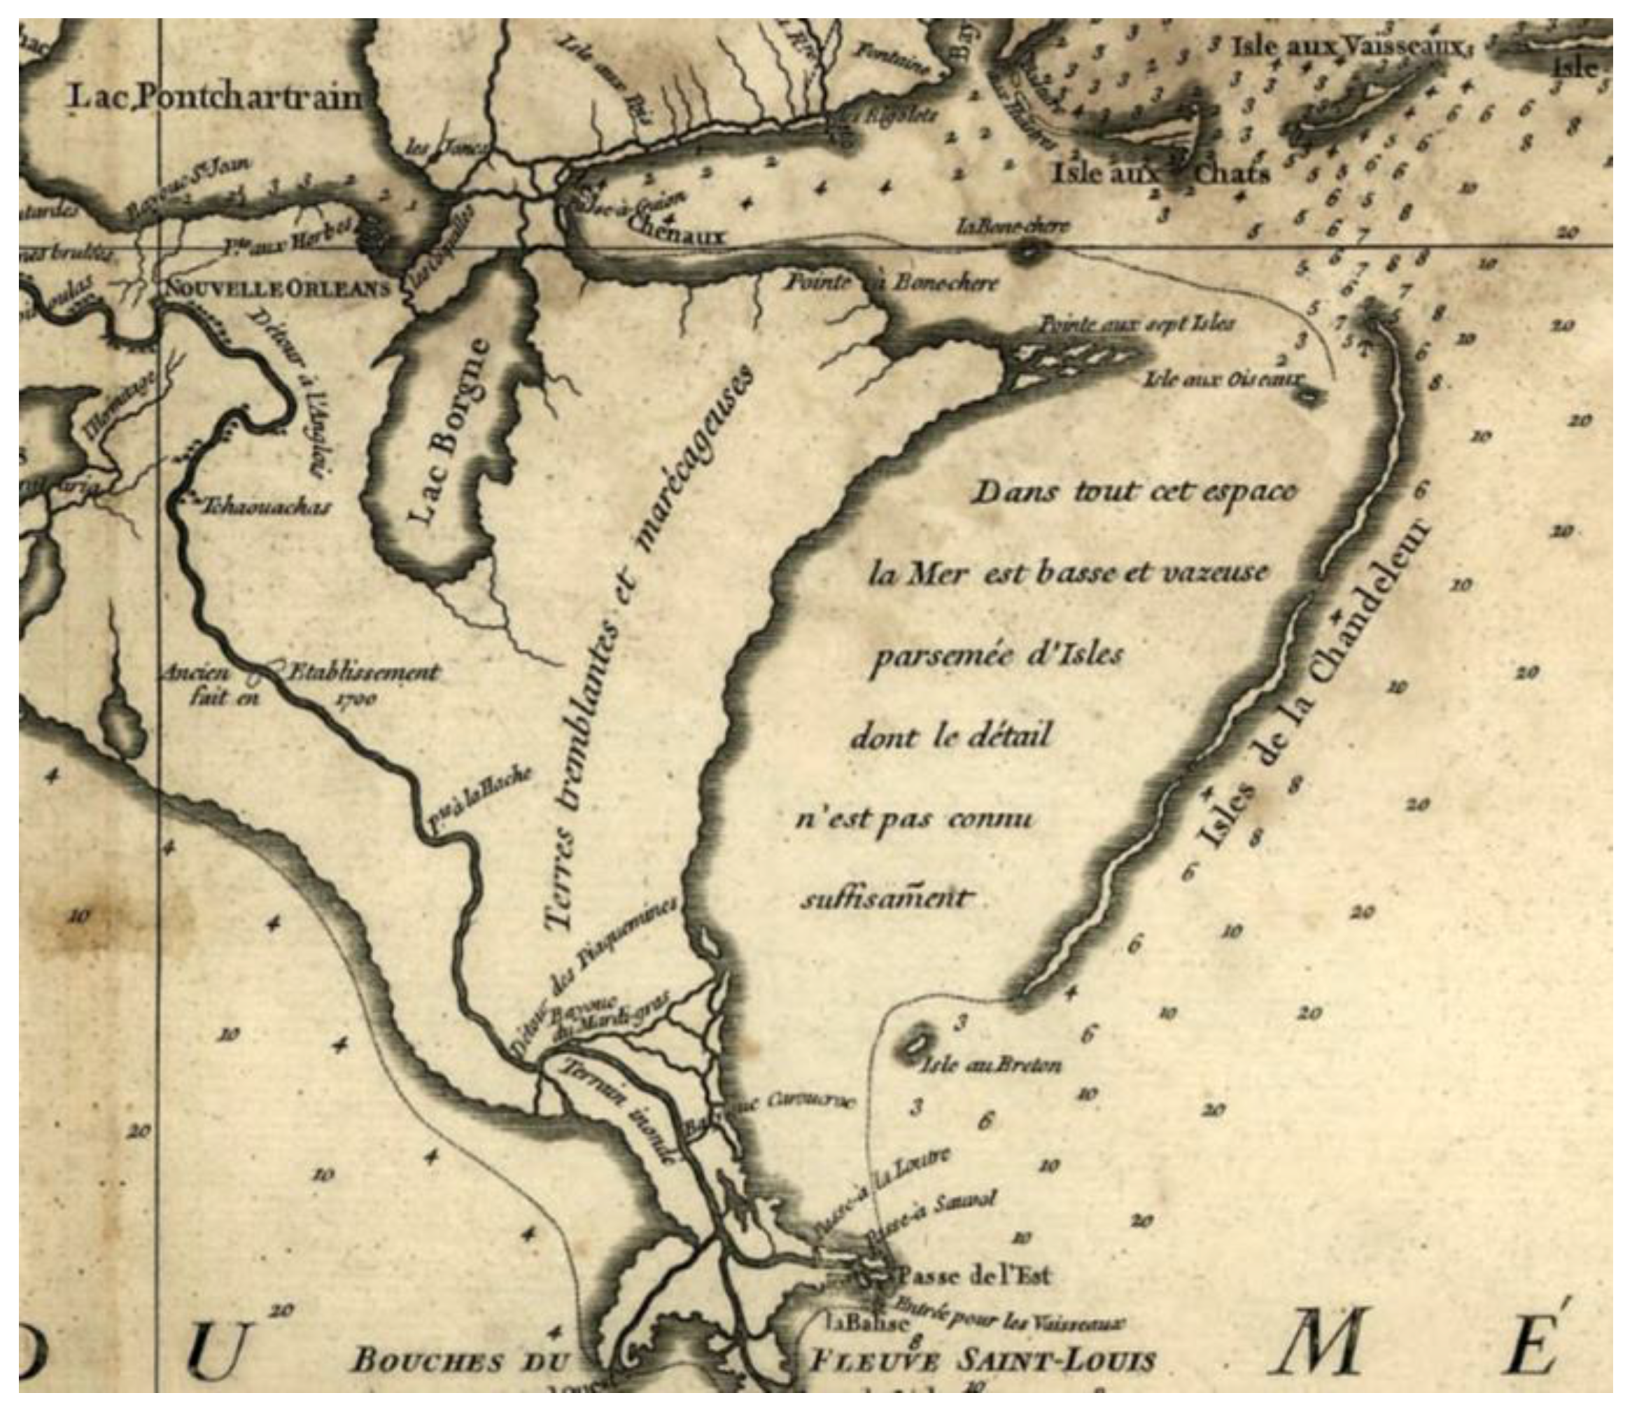
Colonial cartography indicates vague knowledge of the shoreline. It shows an uncertain border between land and sea with much of the coastal territory labeled as wetlands. In 1747, French cartographers used the term
terre basse inondeé—low flooded land. Terms such as marshy islands, lagoons, and broken land appear in a 1770s map. While
terre tremblant et marecageuses (or shaking land and marsh) is affixed on the Biloxi Marsh in the 1750s (
Figure 1). This territory was not a primary attraction to European colonizers. Contemporary notions of marsh were at odds with European settlement and economic pursuits. Europeans viewed them as worthless, unless drained and reclaimed for productive purposes [
5,
6].
In 1817, William Darby observed that most early European accounts of the lower delta yield little accurate information. He is highly critical and notes that “little knowledge of Louisiana can be gained from the perusal of works published in Europe” [
7] (p. iv). His own description of the coastal region is exceptionally thin on detail. He reports that to the southwest of the Mississippi River there exists “another intermixture of bayous, lakes, woods, and morasses” that terminates in the Gulf of Mexico [
7] (pp. 41–42). He describes the numerous bayous and distributaries that course through the coastal region, but dismisses the areas away from the waterways as “too monotonous to demand much detailed description; mostly morass, devoid of trees, and sunk to nearly the level of the high tide” [
7] (p. 51). He points out much of the area of St. Bernard Parish as “one vast grassy marsh interspersed with lakes” [
7] (p. 52).
After the American Civil War (1861–1865), Samuel Lockett embarked on a tour to update the state’s geography. His account of the coastal parishes in the 1870s highlights the cultivated lands along the bayous and rivers. He notes that extensive, but unoccupied marshes made Terrebonne Parish one of the state’s largest political units [
8] (p. 116). For St. Bernard Parish, he observes that much of it is “low, flat sea marsh subject to tidal overflow” [
8] (p. 119–120). Likewise for Plaquemines Parish he dismisses the marshes: “An enumeration of these multitudinous islands and sheets of water would add nothing to the foregoing description of the parish” [
8] (p. 120). Although he acknowledges that sportsmen frequented the marshes for hunting and fishing, this territory nonetheless was of little significance in his account.
In the early twentieth century, a burst of conservation efforts raised the value and visibility of the coastal wetlands. National organizations such as the Audubon Society were active in campaigns to protect birds of plume and migratory waterfowl which were declining in number due to intensive commercial hunting. Local sportsmen, most notably the wealthy businessman Edward McIllhenny, lobbied for the state acquisition of marshes to serve as refuges for migratory waterfowl. McIllhenny also was effective in leading the charge for conservation laws at the state level and in recruiting national foundations to purchase and set aside vast tracks of marsh. These state changes parallel national conservation policies that sought to preserve some wetlands as habitat for migratory waterfowl. Some 300,000 acres of wetland in southwest Louisiana became protected refuges by the late 1930s [
8,
9,
10,
11]. This greatly restricted access by commercial fishermen and hunters to the wetlands commons. Yet, those pursuing natural resource-based livelihoods and sport hunters comprised a relatively small number and setting aside wetlands remained the priority over restoration.
The principal nineteenth century geographical compilations underscore the lack of attention given to the coastal marshes [
7,
8]. Protection as refuges raised their visibility among sportsmen, as did limited, and largely unsuccessful, attempts to drain wetlands to expand agriculture, but they remained invisible to the majority of the state’s residents. They were beyond the imaginary pale.
3. Mapping Land Loss
Louisiana’s concern with its coastal wetlands soared in importance during the Tidelands controversy of the 1950s. Seeking to maintain maximum offshore oil revenue, the state battled with the federal government over the outer boundary of the state’s territorial limits—which defined the area subject to state severance taxes. Early measurements of a retreating shoreline threatened to decrease the offshore mineral reserves that the state could tax. One of the first systematic attempts to map shoreline change appeared in 1957—authored by James Morgan and Philip Larimore, a coastal scientist and a cartographer, respectively [
12]. Based on a comparison of the shore shown in navigational charts and topographic maps at intervals from 1812 to 1954, it indicates that portions of the southeast coast experienced retreat of 16 to 62 feet per year [
12]. The distance of retreat reflected the concern over the potential loss of oil revenues. These early maps triggered no ecological alarms even though the message was a clear warning, and few beyond the coastal science community took note, particularly after the Tidelands issues was settled finally in 1975 [
13,
14]. Nonetheless, a vigorous research effort focused on changing coastal conditions was underway and would continue.
Several related issues converged over the next 10–15 years that gave the land loss issue greater prominence. At the national scale, policies and judicial decisions that protected wetlands transformed what had long been considered wastelands into highly valued ecosystems [
15,
16,
17,
18,
19]. Alongside the recasting of wetlands as desirable ecosystems, restoration ecology came into play as scientists sought ways to rehabilitate degraded wetlands or to create new ones [
20,
21]. In Louisiana, geographers and ecologists assembled more detailed maps which recast the problem of land loss as one of declining acres of critical habitat and not just the retreat of taxable ocean bed. Within the context of national policy concern for preserving wetlands, restoration offered hope for reversing the disappearance of Louisiana’s coastal marshes.
Early wetland policy in the U.S. favored the draining of wetlands, principally for agriculture [
15]. Fear of miasmas in the Midwest and the urge to convert wetlands to farm land, propelled a massive land drainage effort in the late nineteenth and early twentieth centuries [
16]. As a consequence, the lower 48 states lost approximately 53 percent of their wetlands—or about 117 million acres—due to hydrologic alterations between the 1780s and 1980s [
17]. Despite a rising aesthetic fascination with swamps in the later nineteenth century, marshes remained a setting for re-engineering by drainage [
5,
16]. During the second half of the twentieth century, the emergence of wetland science uncovered important functions of wetlands to store flood waters, recharge groundwater, purify pollution, support recreation, sustain biodiversity and critical habitats, and more [
15,
19,
20]. This knowledge, aligned with emerging public support for environmental protection in the 1960s, propelled wetlands into a more favorable position in public policy [
9,
19].
The passage of the Federal Clean Water Act of 1972, and subsequent court rulings on the extent of the controversial Section 404 which dealt with wetlands, recast federal policy in lasting ways. In 1975, a federal district court concluded that the “waters of the United States” were not limited to navigable waters, but included waters distant from major waterways and also isolated waters [
15,
19]. This decision expanded the provisions of the Clean Water Act to include wetlands. Ultimately, with the development of regulations and amendments to the Clean Water Act, the Corps of Engineers gained authority to permit or deny wetland development [
15,
19]. Wetland filling and drainage slowed dramatically as a result and wetland mitigation arose as a tool for creating offsets for developers intent on draining wetlands. Following the initial federal legislation there was a surge in the study of creation and restoration of wetlands and research remained well above previous levels through the 1980s [
20]. Historian Linda Martin, in fact, declares the 1972 act was the first to be used to require mitigation [
21,
22]. Compensatory mitigation, as she refers to it, enables the sacrifice of one place along with the restoration of another. An outcome of this approach was widespread research about and experiments in restoration.
Through a combination of protection policies, wetland mitigation, and restoration, the pace of wetland loss nationally fell from 458,000 acres per year between the 1950s and the 1970s to only 58,500 acres per year between 1980 and 1997 [
19] (pp. 46–47). There were even modest gains in certain types of wetlands [
20] (p. 1). Public policies drove this turn around. Since the 1990s, farmers have set aside over 2 million acres in wetland reserves [
23], to say nothing of the extensive coastal restoration efforts in Louisiana [
3,
4]. Jointly, wetlands preservation and restoration ecology provided a framework to advance the analysis of land loss in Louisiana, and the state’s coastal marshes assumed greater public significance.
4. Making the Invisible Visible
Beginning in the early 1970s, geographer Sherwood “Woody” Gagliano spearheaded several projects that more accurately measured the rate of land loss than preceding efforts. Along with collaborators, he produced a steady stream of reports based on careful historical analysis of sequential coastal maps and aerial photographs. Among his earliest works was an article that mapped the areas losing land most rapidly, and which recommended restoration as a “cure” to the problem [
24]. He traced shoreline loss by comparing areas depicted in sequential topographic maps produced by the U.S. Geological Survey since the 1890s (
Figure 2). Based on his measurements, he reported that Louisiana had been losing an average of 16.5 square miles per year for the preceding 25–30 years [
24]. He shifted the unit of measure from a linear measure or miles-of-retreat to a spatial measure of acres/year, which became the standard in subsequent discussions. This adjustment set aside the concerns prompted by the Tidelands controversy about offshore oil revenues and replaced it with attention to the wetlands themselves. The new emphasis was on a complex ecological territory or habitat for multiple plants and animals. The map also shows areas of land gain, notably areas in the Atchafalaya Basin were sedimentation was filling inland lakes. The presentation of areas of both gain and loss, in black and white, did little to spark widespread concern since one appears to offset the other. By showing both, the map indicates the creation of new wetlands was possible, even in the face of massive losses. Gagliano was unambiguous in his overall assessment. He states that there was a “progressive landward march” of the coast and that “major estuaries were undergoing rapid and drastic changes” [
24] (p. 1773).
His detailed observations also revealed that some of the small subdeltas of the active Mississippi River delta had experienced some cyclic land building. Based on this observation, he recommends the installation of structures, known as diversions, that would allow river water to flow through the levees into adjacent wetlands and deliver sediment to targeted areas thereby mimicking the natural land-building processes and restoring portions of the deteriorating wetlands. Although he uses the term restoration, he does not appear to draw on the ecological restoration scholarship of the time [
21]. Nonetheless, restoration using diversions assumes an ability to set ecological systems in motion that would continue over time. Hence, this early recommendation reflected larger conversations with restoration ecology and most notably a strategy to use nature to rebuild the wetlands of coastal Louisiana that persists, in a modified form, to the present [
20,
21].
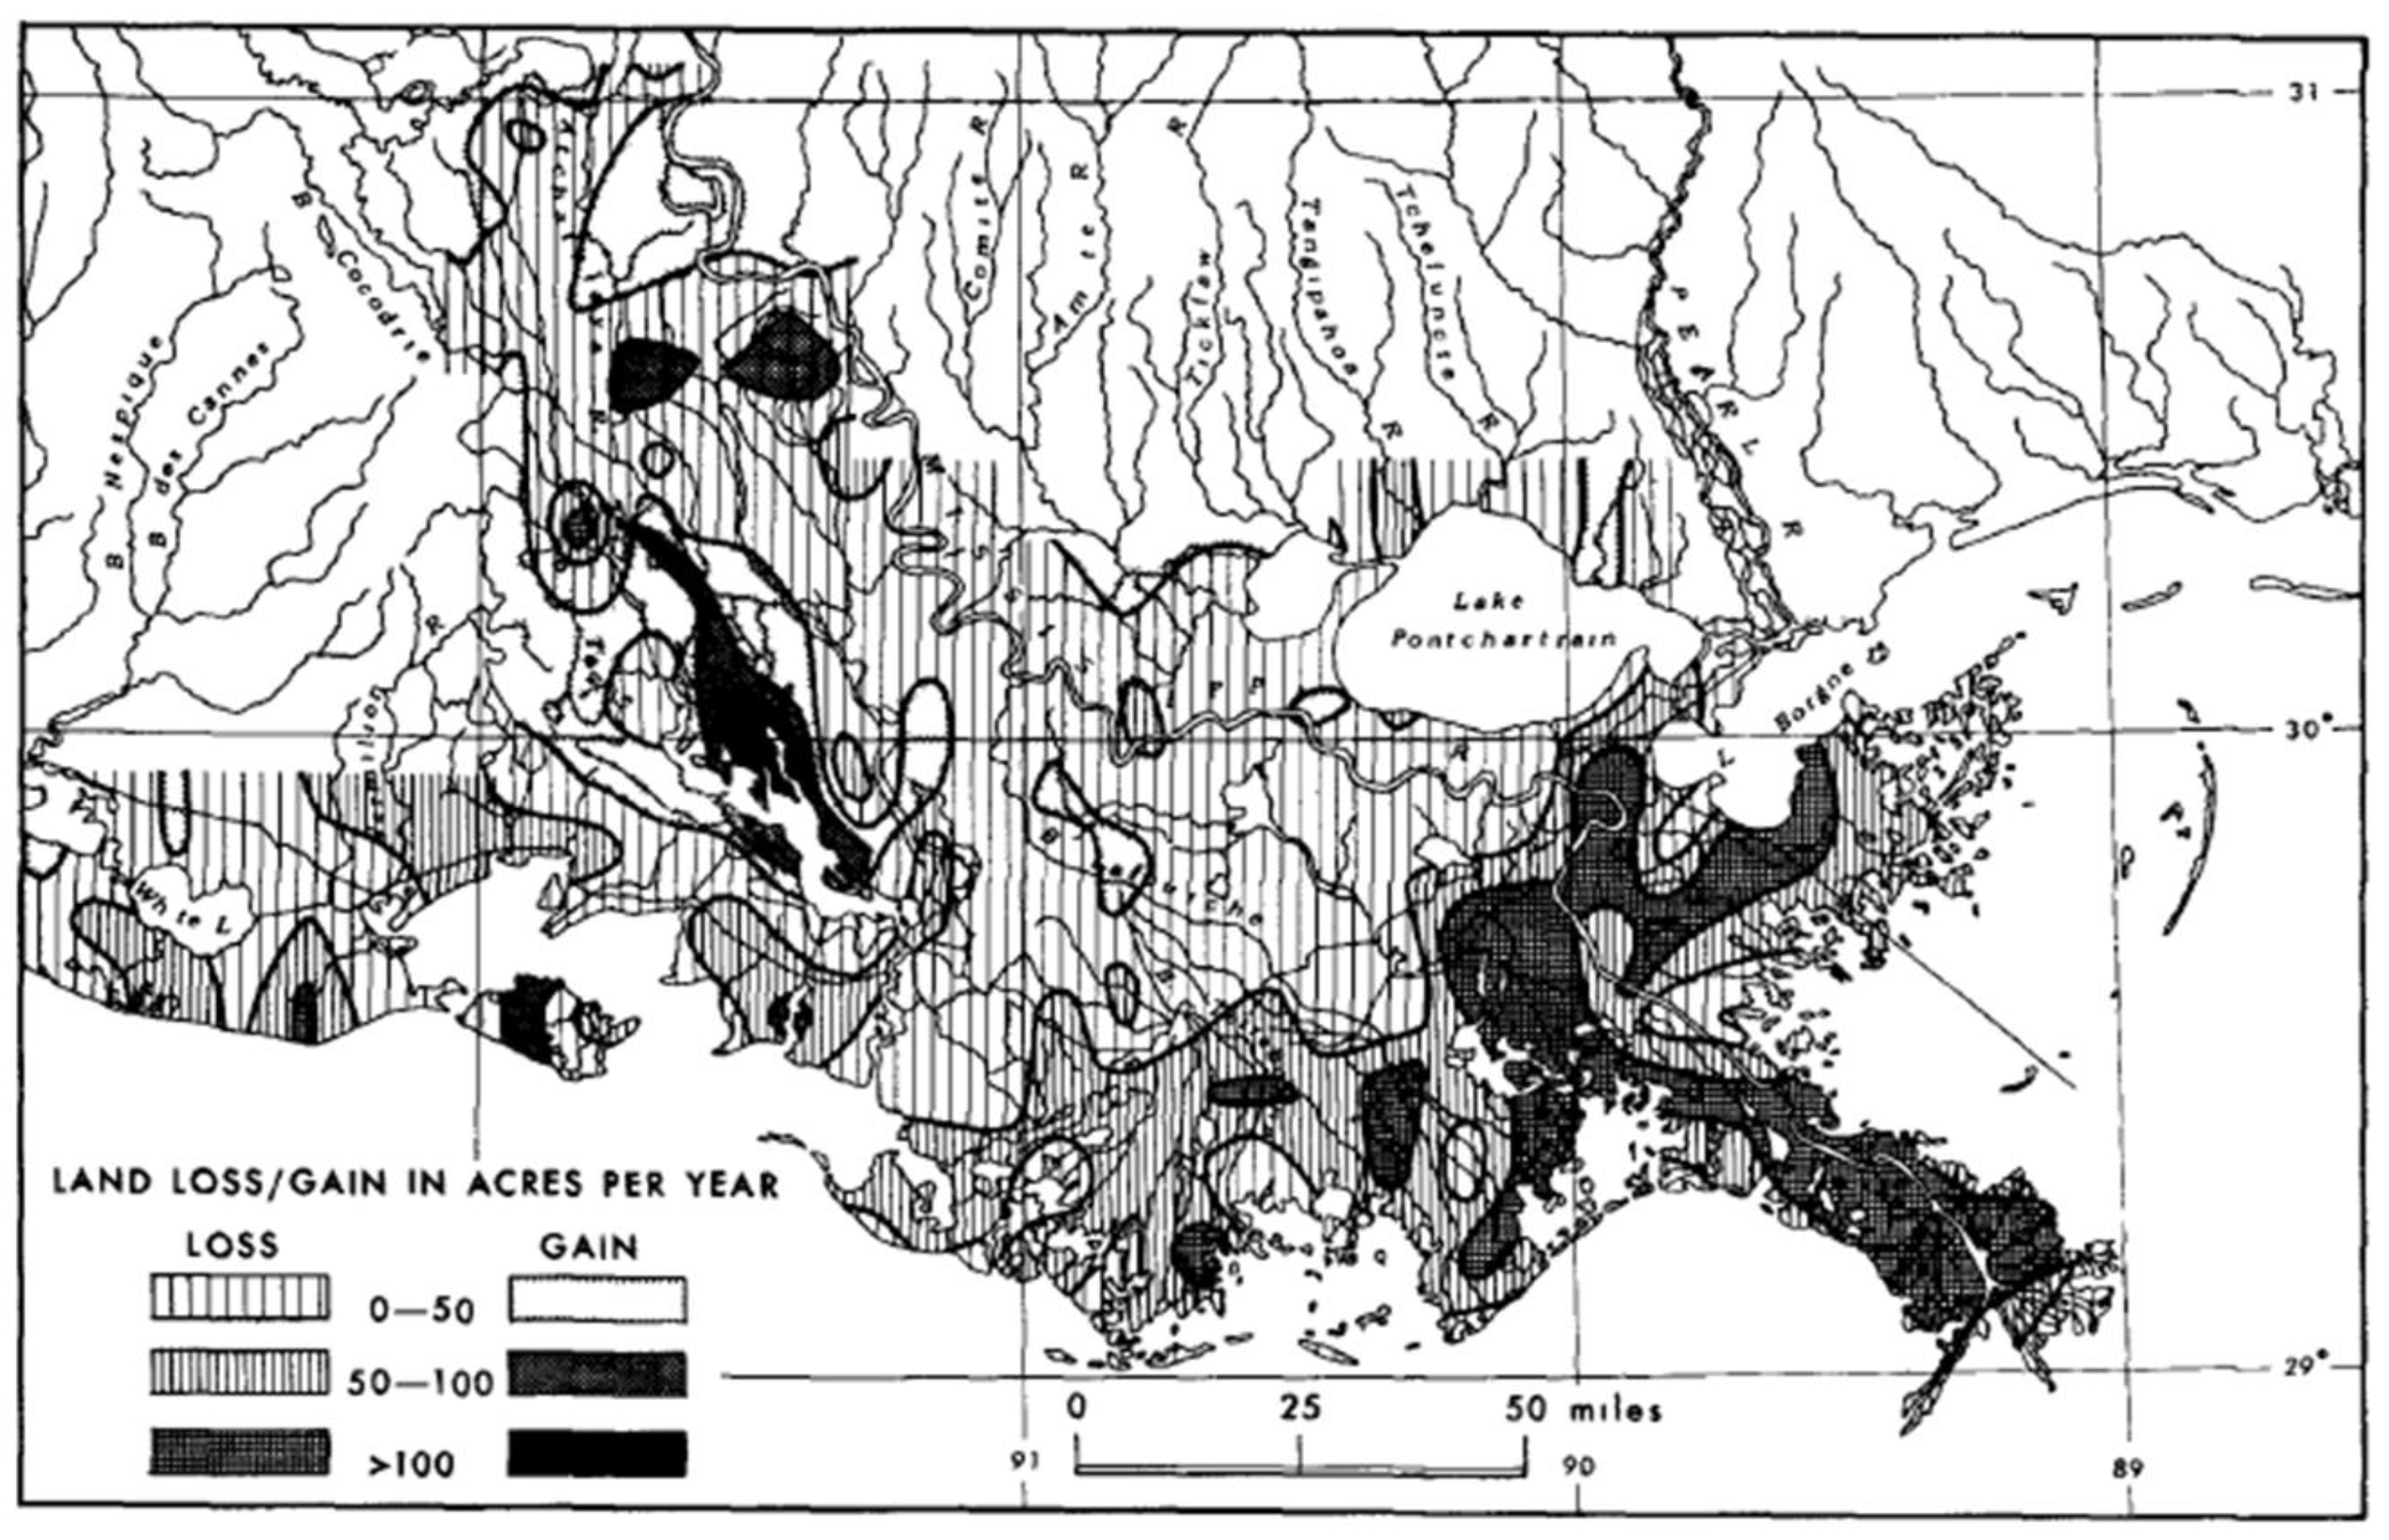
In a subsequent assessment of land loss, Gagliano and his associates plot only areas of loss (
Figure 3). Their 1981 map of loss between 1955 and 1978, based on sequential aerial photography, clearly depicts serious rates of land loss in the lower delta [
25]. It also reveals substantial loss inland. The research team went another step and projected land loss in to the future, using medical terminology to report the “life expectancy” of four coastal parishes. The anticipated life span ranged from a mere 52 years to 205 years. The projections of loss relied on basic notions of ecological progression—change that could be forecast based on current conditions and processes. The discussion by the early 1980s focused largely on local processes—subsidence and canal dredging and the associated deterioration of wetlands—as opposed to climate change or sea level rise. After more than a decade researching and reporting on this problem, with little public policy response, Gagliano’s concluded forcefully: “A great natural catastrophe is occurring in the deltaic plain of coastal Louisiana” [
25] (p. 298). It also reflected his frustration in compelling public officials to take effective action up to that point in time. Nonetheless, this presentation marks something of a turning point. The efforts of Gagliano and others had raised the wetlands into a more visible position and the maps provided a persuasive summation of a process that was too slow to observe otherwise. The political inaction that frustrated Gagliano began to change in the ensuing years.
5. From Academic Observation to Public View
During the next decade, there was a decided shift from largely academic interest to public attention, and ultimately government action. Aided by a flurry of environmental legislation in the 1960s and 1970s, a favorable public attitude toward protecting natural resources, along with formal programs dedicated to preserving wetlands [
11], a coalition of academics, fishermen, environmental advocacy organizations, and public officials galvanized efforts to arrest coastal land loss. And maps of land loss provided a consistent visualization of the disappearing coast.
In 1987,
Newsweek magazine ran an article on Louisiana’s land loss and included a version of a map prepared by the Louisiana Geological Survey which contrasted the “coastline today” with the “land area after erosion” [
26] (p. 54). The supporting article reports that the state was losing some 60 square miles a year or an acre every 14 min. This illustration in a national publication indicates some of the efforts by Louisiana scientists was beginning to reach a wider audience.
The Coalition to Restore Coastal Louisiana (CRCL) produced the first comprehensive overview of the coastal problem in 1989 along with recommendations for dealing with the situation [
27]. It contained a modified version of the 1981 map by Gagliano and his associates. It expressed land loss in four general categories which included “severe” and “very severe.” It indicated that the lower river delta, Lafourche, and Terrebonne parishes were in dire circumstances. The report updated the life expectancy for the lower delta and projected it would disappear during the next two centuries. The report sought to set out a “citizens’ program for saving the Mississippi River delta region” [
27]. This effort took a deliberate approach to engaging with a broader public. It recruited comments and participation from environmental groups, fishermen, and civic and faith-based organizations [
28]. While much of the report drew on scientific observations done by Gagliano and many others at the forefront of studying the problem, it sought to bring that knowledge to a wider audience in order to activate public policy change.
The report revealed, again, the frustration of the scientific community in its opening passage: “Few natural areas have been studied more with less result” [
27] (p. 1). At the same time, it declared this was a critical moment for taking steps to remedy the land loss while also elevating the problem to the national level by proclaiming Louisiana’s wetlands constituted 40 percent of the country’s coastal marsh [
27] (p. 1).
The coalition and its report on the state’s coastal situation contributed to action on the public policy front. Louisiana’s congressional delegation had been active on coastal restoration legislation efforts in the 1980s, but with few accomplishments, although they were beginning to achieve greater success. Congressional hearings in 1989 and 1990 led to the passage of the so-called Breaux Act or the Coastal Wetlands Protection, Planning, and Restoration Act (CWPPRA, Public Law 101-646, Title III). Senator John Breaux’s files contain numerous maps of the wetland loss including a map of land loss prepared by the U.S. Fish and Wildlife Service in 1989 and the CRCL plan [
27,
29]. In congressional hearings in 1990, Louisiana’s elected officials positioned the state’s littoral marshes within the larger context of national attention to wetlands. They also presented compelling testimony about the scale of Louisiana’s wetlands at the national level. Breaux reminded his colleagues that Louisiana contained about 80 percent of the country’s wetlands and that they were a national resource [
30] (pp. 3–5). He also underscored that wetland loss resulted from levee building to protect vast portions of the nation’s interior from river floods [
30] (p. 3). Congressman Billy Tauzin emphasized the significance of Louisiana oil and gas to the nation’s energy supply as he pointed out the impact of canals that contributed to land loss. He also squarely situated the situation in the arena of climate change. He asserted that Louisiana was taking a hit from “global warming” and sea level rise—or as he put it: consequences of “global industrialization” [
30] (p. 13). While Tauzin’s comments seem striking in 2018, in an era before active campaigns to discredit climate change science, this politician drew on prevailing scientific consensus. Paul Kemp, executive director of the Coalition to Restore Coastal Louisiana, proclaimed that the coastal wetlands were a “national treasure” [
30] (p. 270). The other state senator, J. Bennett Johnston, warned that it was time to stop talking and time to take action [
30] (p. 1). When passed, the act specifically dedicated funds to coastal restoration and began a protracted effort to delay the losses and reverse the receding coastline. The real accomplishment of Senator Breaux was the provision that dedicated 70 percent of the funds raised by CWPPRA to Louisiana wetland preservation and restoration with the balance being spent in other states [
31]. Although there is no record of use of the maps in the testimony, the message from these cartographic depictions in Breaux’s papers and the supportive studies, along with public involvement, were beginning to gain traction in policy deliberations.
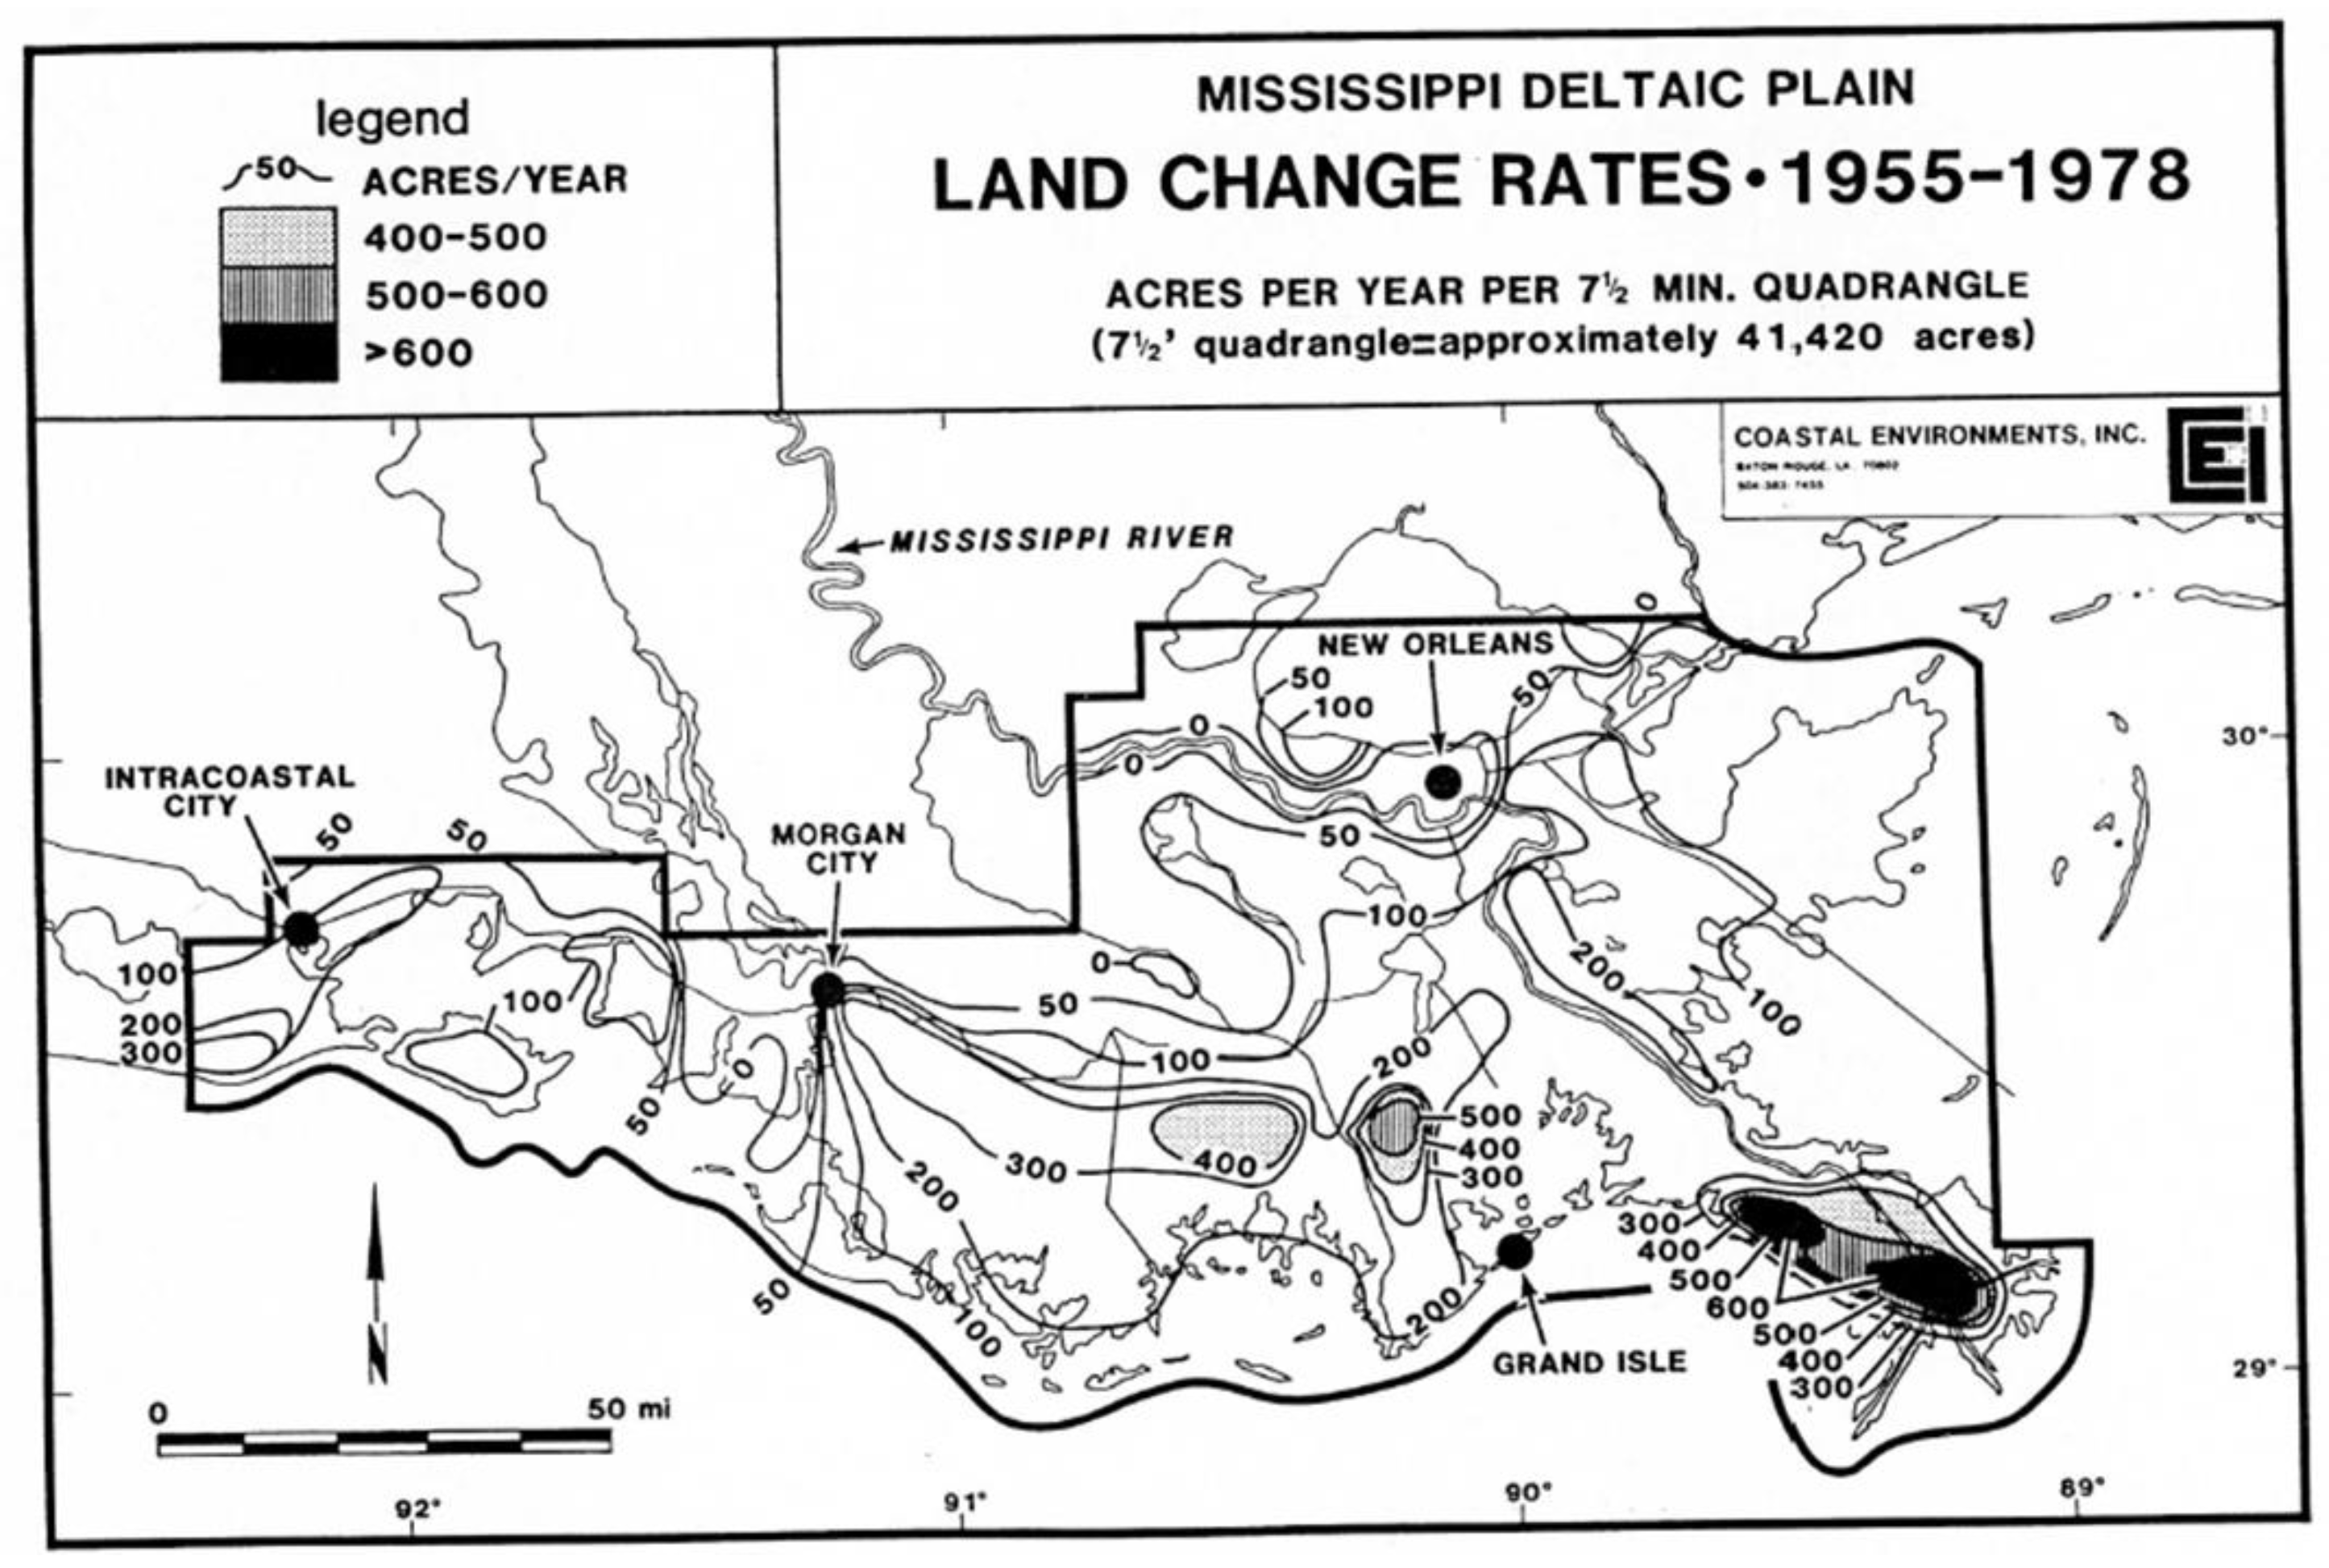
Members of Congress drew on maps compiled by multiple branches of the Department of Interior since the late 1970s. Both the Fish and Wildlife Service (F&WS) and U.S. Geological Survey (USGS) issued maps of maps of land loss. Breaux consulted the F&WS’s maps [
29], and the USGS’s recently created National Wetland Research Center in Lafayette began adding to the cartographic tracings of this process. Its 1990 map, which merges analysis of aerial photographs with digital satellite images, indicates that the basins in the Lafourche/Terrebonne coastal units were suffering the most severe land loss in the years 1956–1990, as was the case in the period from 1956–1978 [
29,
32]. This report illustrates spatial variation across the coastal region and also indicates the rate of loss was largely consistent since the mid-1950s. But the cartographic presentation which used large drainage basins with numbers superimposed on them was not compelling in terms of public appeal.
The CWPPRA legislation called for a task force to develop a “comprehensive approach to restore and prevent the loss of coastal wetlands in Louisiana” [
33] (p. 1). Responding to this legislative mandate, the task force released a report in 1993 that reoriented cartographic presentations from historical land lost to land that would be lost (
Figure 4). In addition, it displayed the disastrous future in bold red—without explaining its methods for projecting this loss [
33] (p. 8). The report notes the value of the wetlands in terms of fisheries and flood protection, and observes that the loss of the littoral marshes would cost the American taxpayer [
33] (p. 7). The task force also presents its restoration plan which includes the familiar diversions, barrier island restoration, shoreline protection, and hydrologic modifications. The impact of restoration efforts, in terms of land gain or loss offset remained completely imaginary at this point in time.
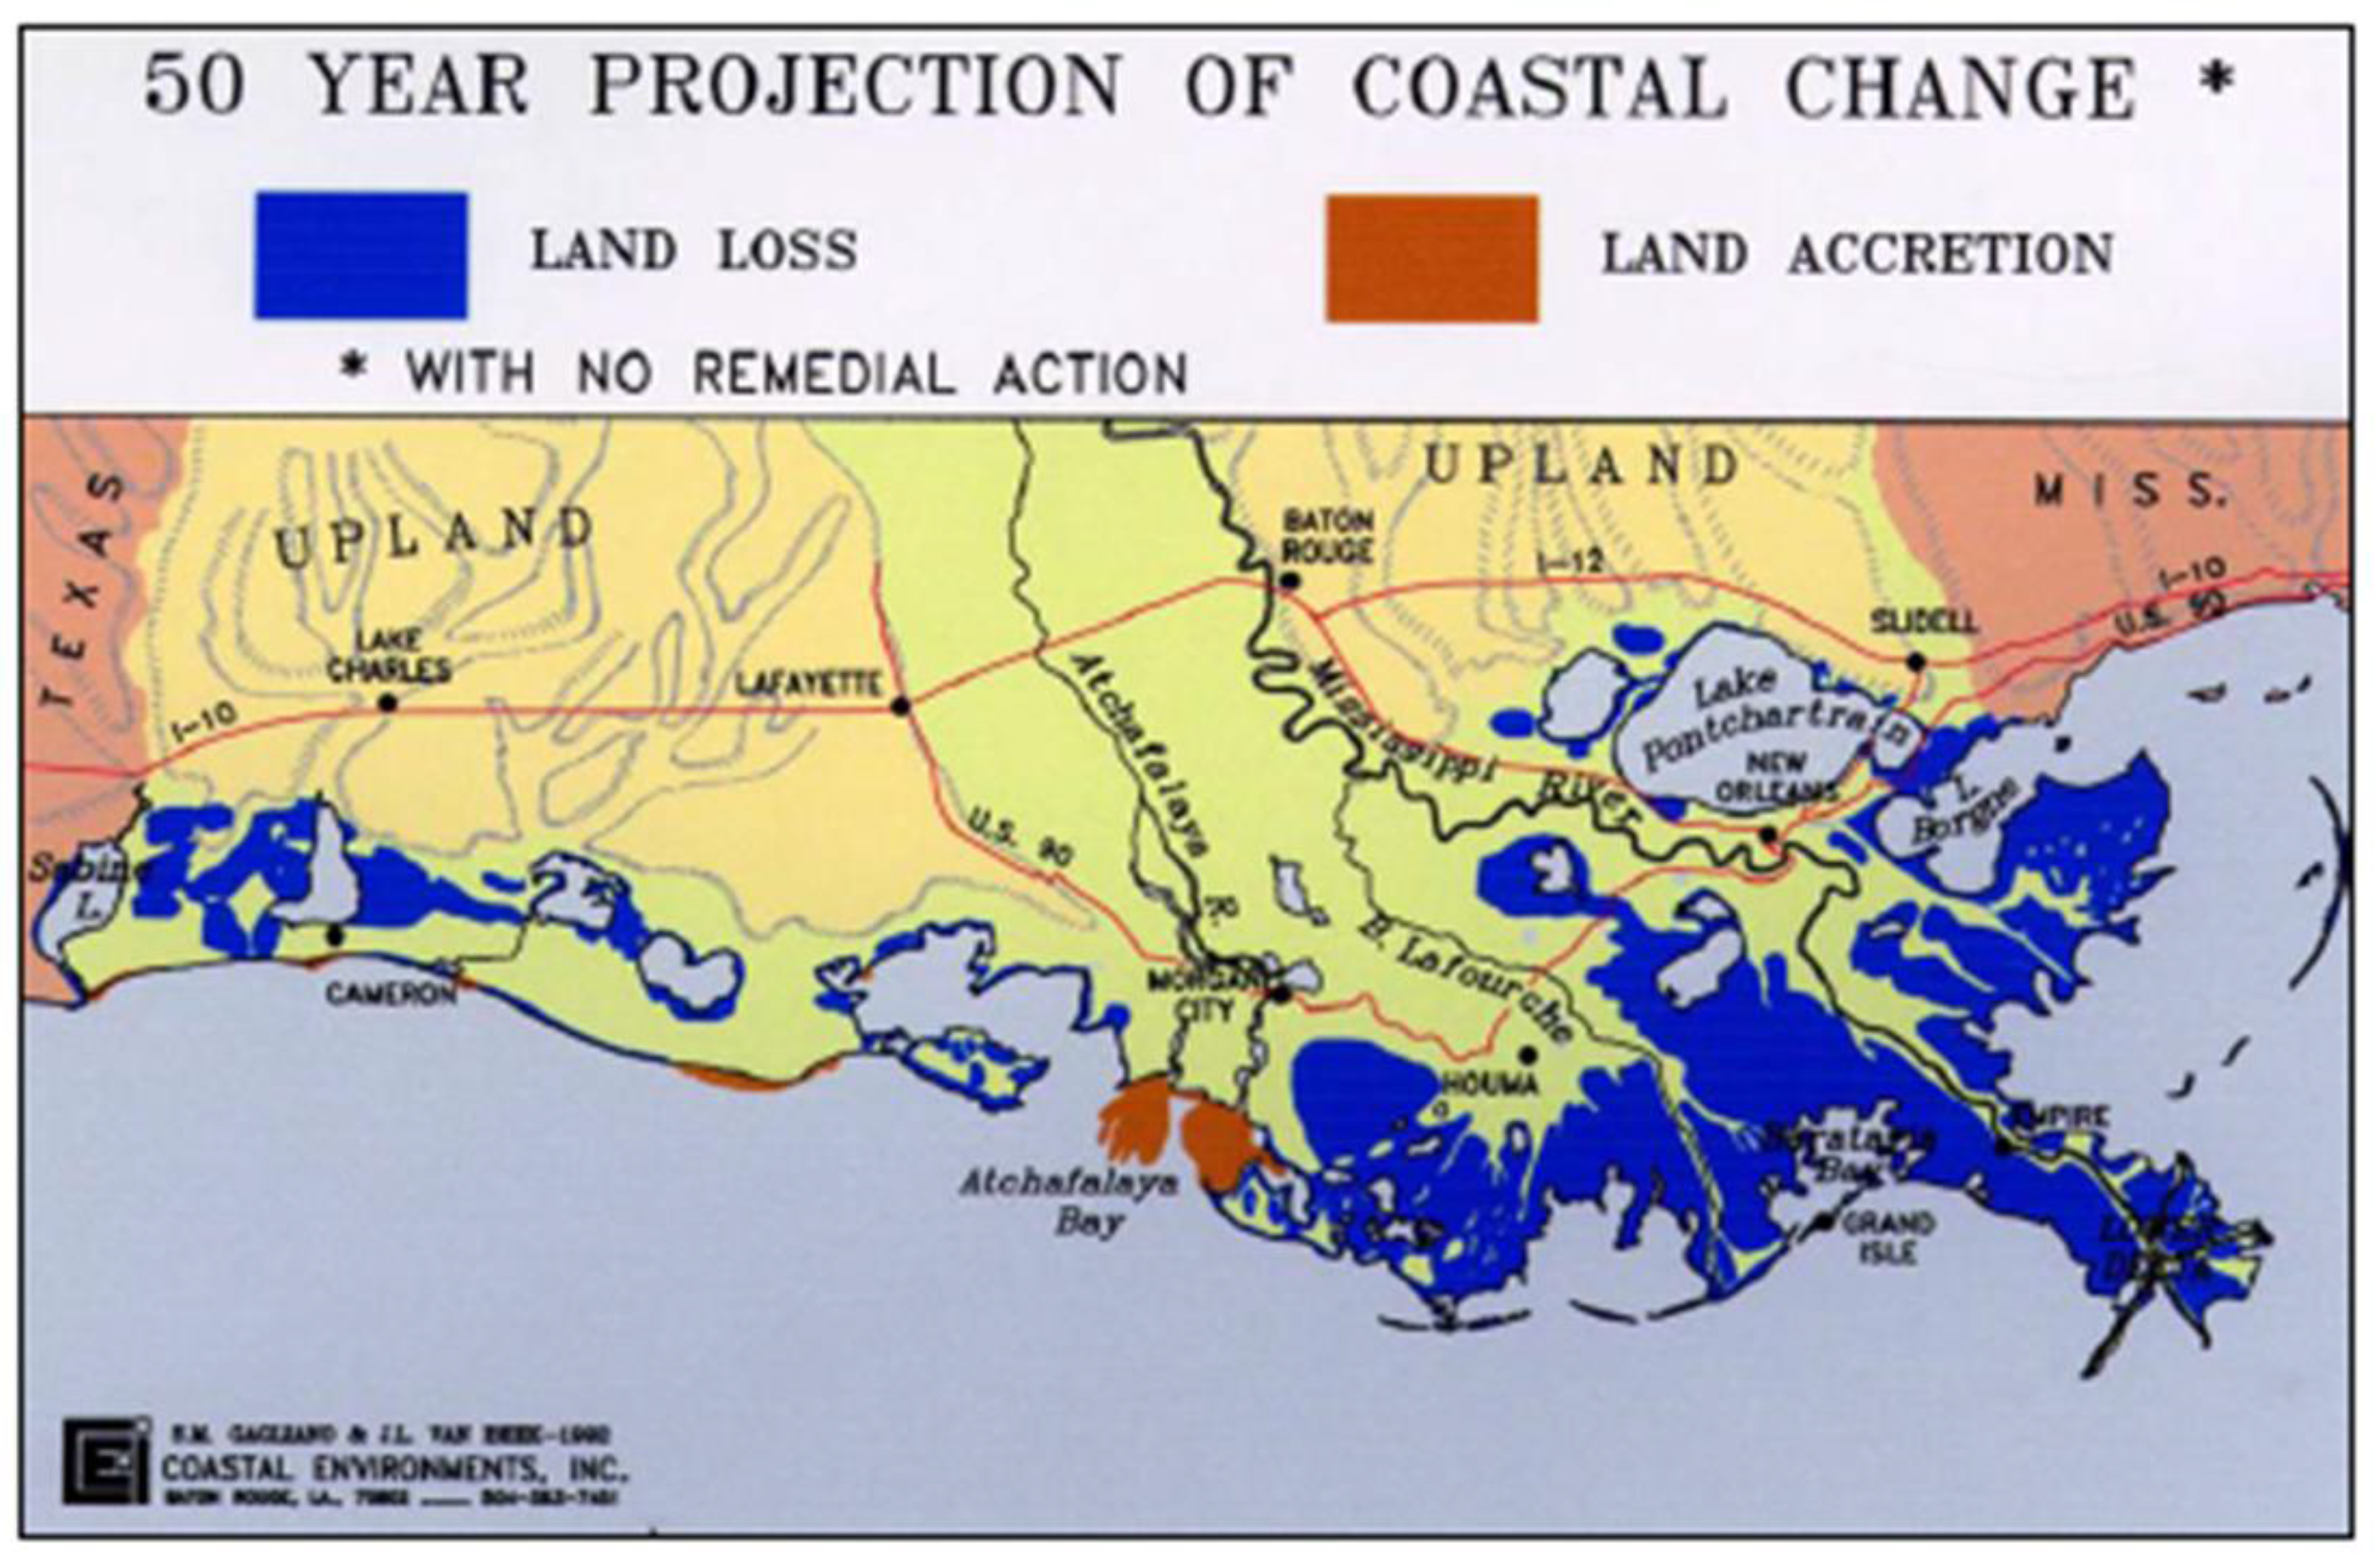
In 1994, Gagliano once again presents a rendition of his group’s research on land loss and blends historical loss and projected loss [
34] (
Figure 5). This much simplified version shows broad swaths of the coast experiencing land loss, and modest areas enjoying gain. The color presentation and the single categories for loss and gain do not reveal the variation in the pace of loss noted by the USGS, but they offer an unambiguous image of conditions beyond the view of most residents and plant an image in the collective mind of the state’s citizens. And the report that contained this presentation advanced a more nuanced program for restoration that was attuned to the different environmental conditions across the coast. It outlined several options in addition to diversions. Among them were restoring barrier islands, managing wetlands and reefs, and also levees and “leaky barriers” [
34]. There was no projection of how much land would be gained through restoration. The colorful treatment was partly a reflection of dropping costs of color reproduction, but contributed to more effective cartographic communication.
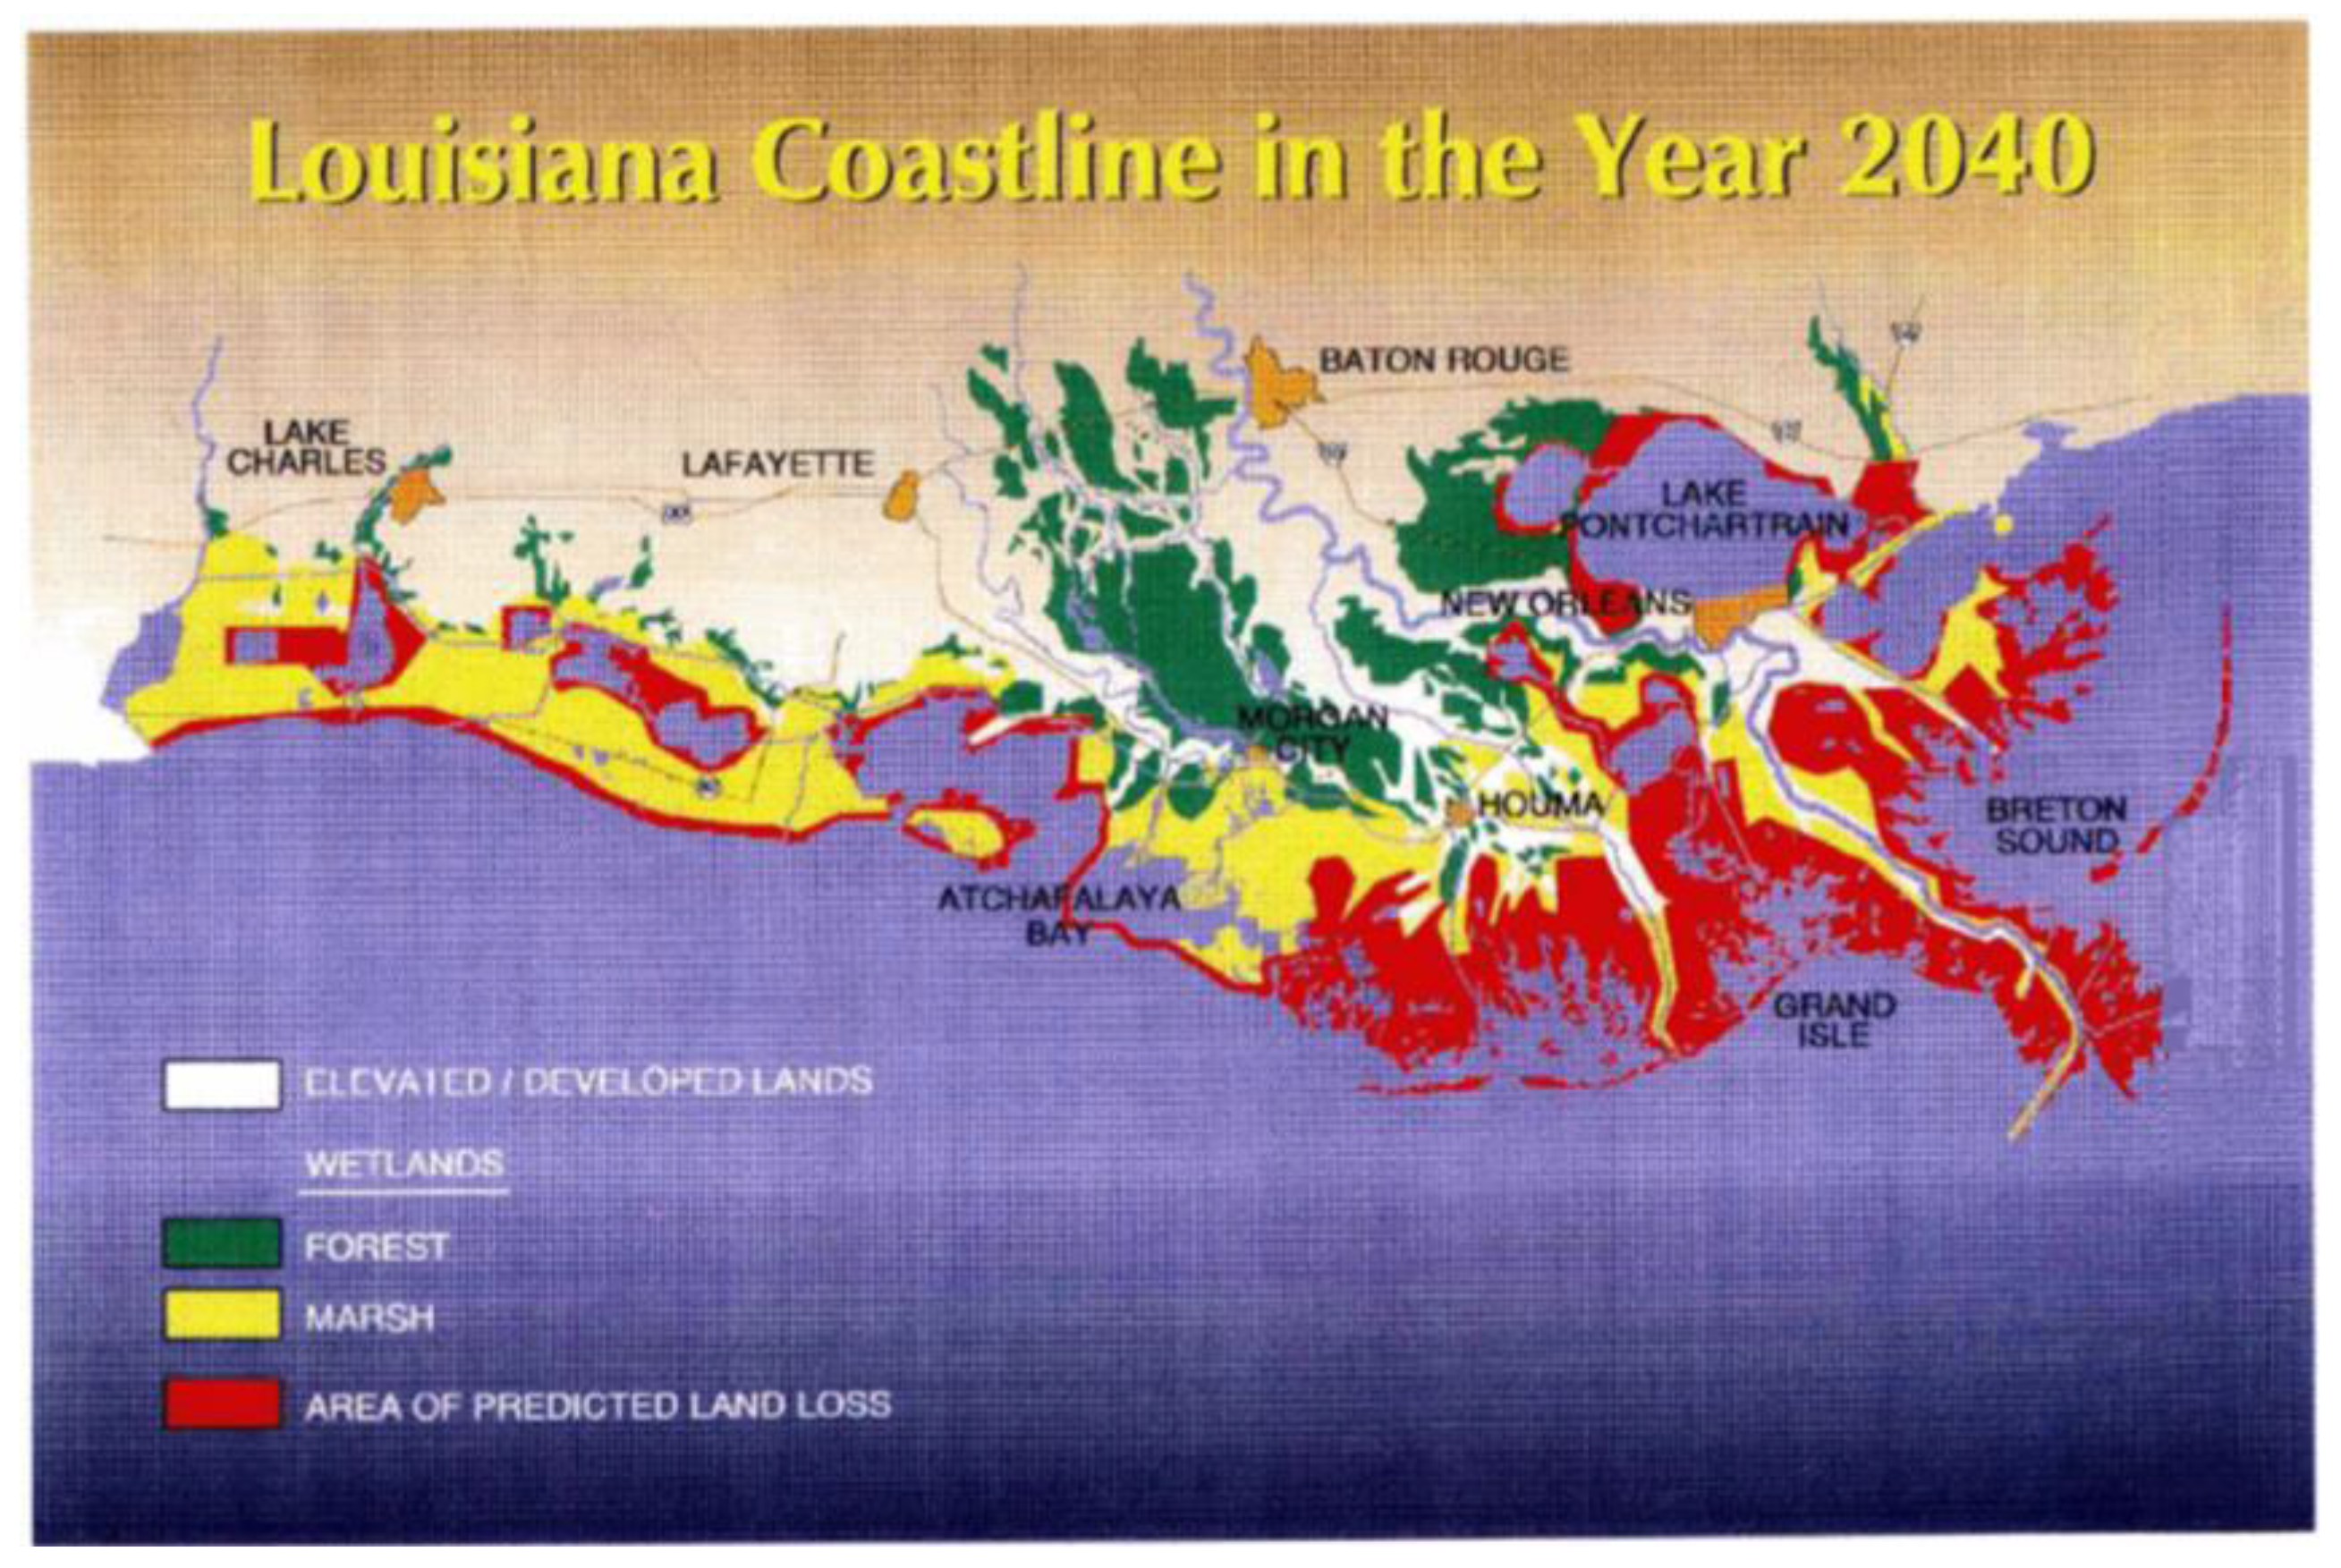
A landmark report released in 1998 solidified the depiction of projected land lost with its simple representation of what was anticipated by 2050 (
Figure 6) [
35]. This report claimed to offer a new approach, to present a single unified plan for restoring the coast as a sustainable ecosystem that protects the environment, economy, and culture of the region. Yet, the map of land loss, as most before it, fails to include the presence of people or economic activity. The absence of a human presence greatly simplifies the situation, and suggests that restoration is limited to manipulation of the biophysical environment. Its maps of restoration projects contain much more detail than previous efforts and seeks to maintain a coastwide program.
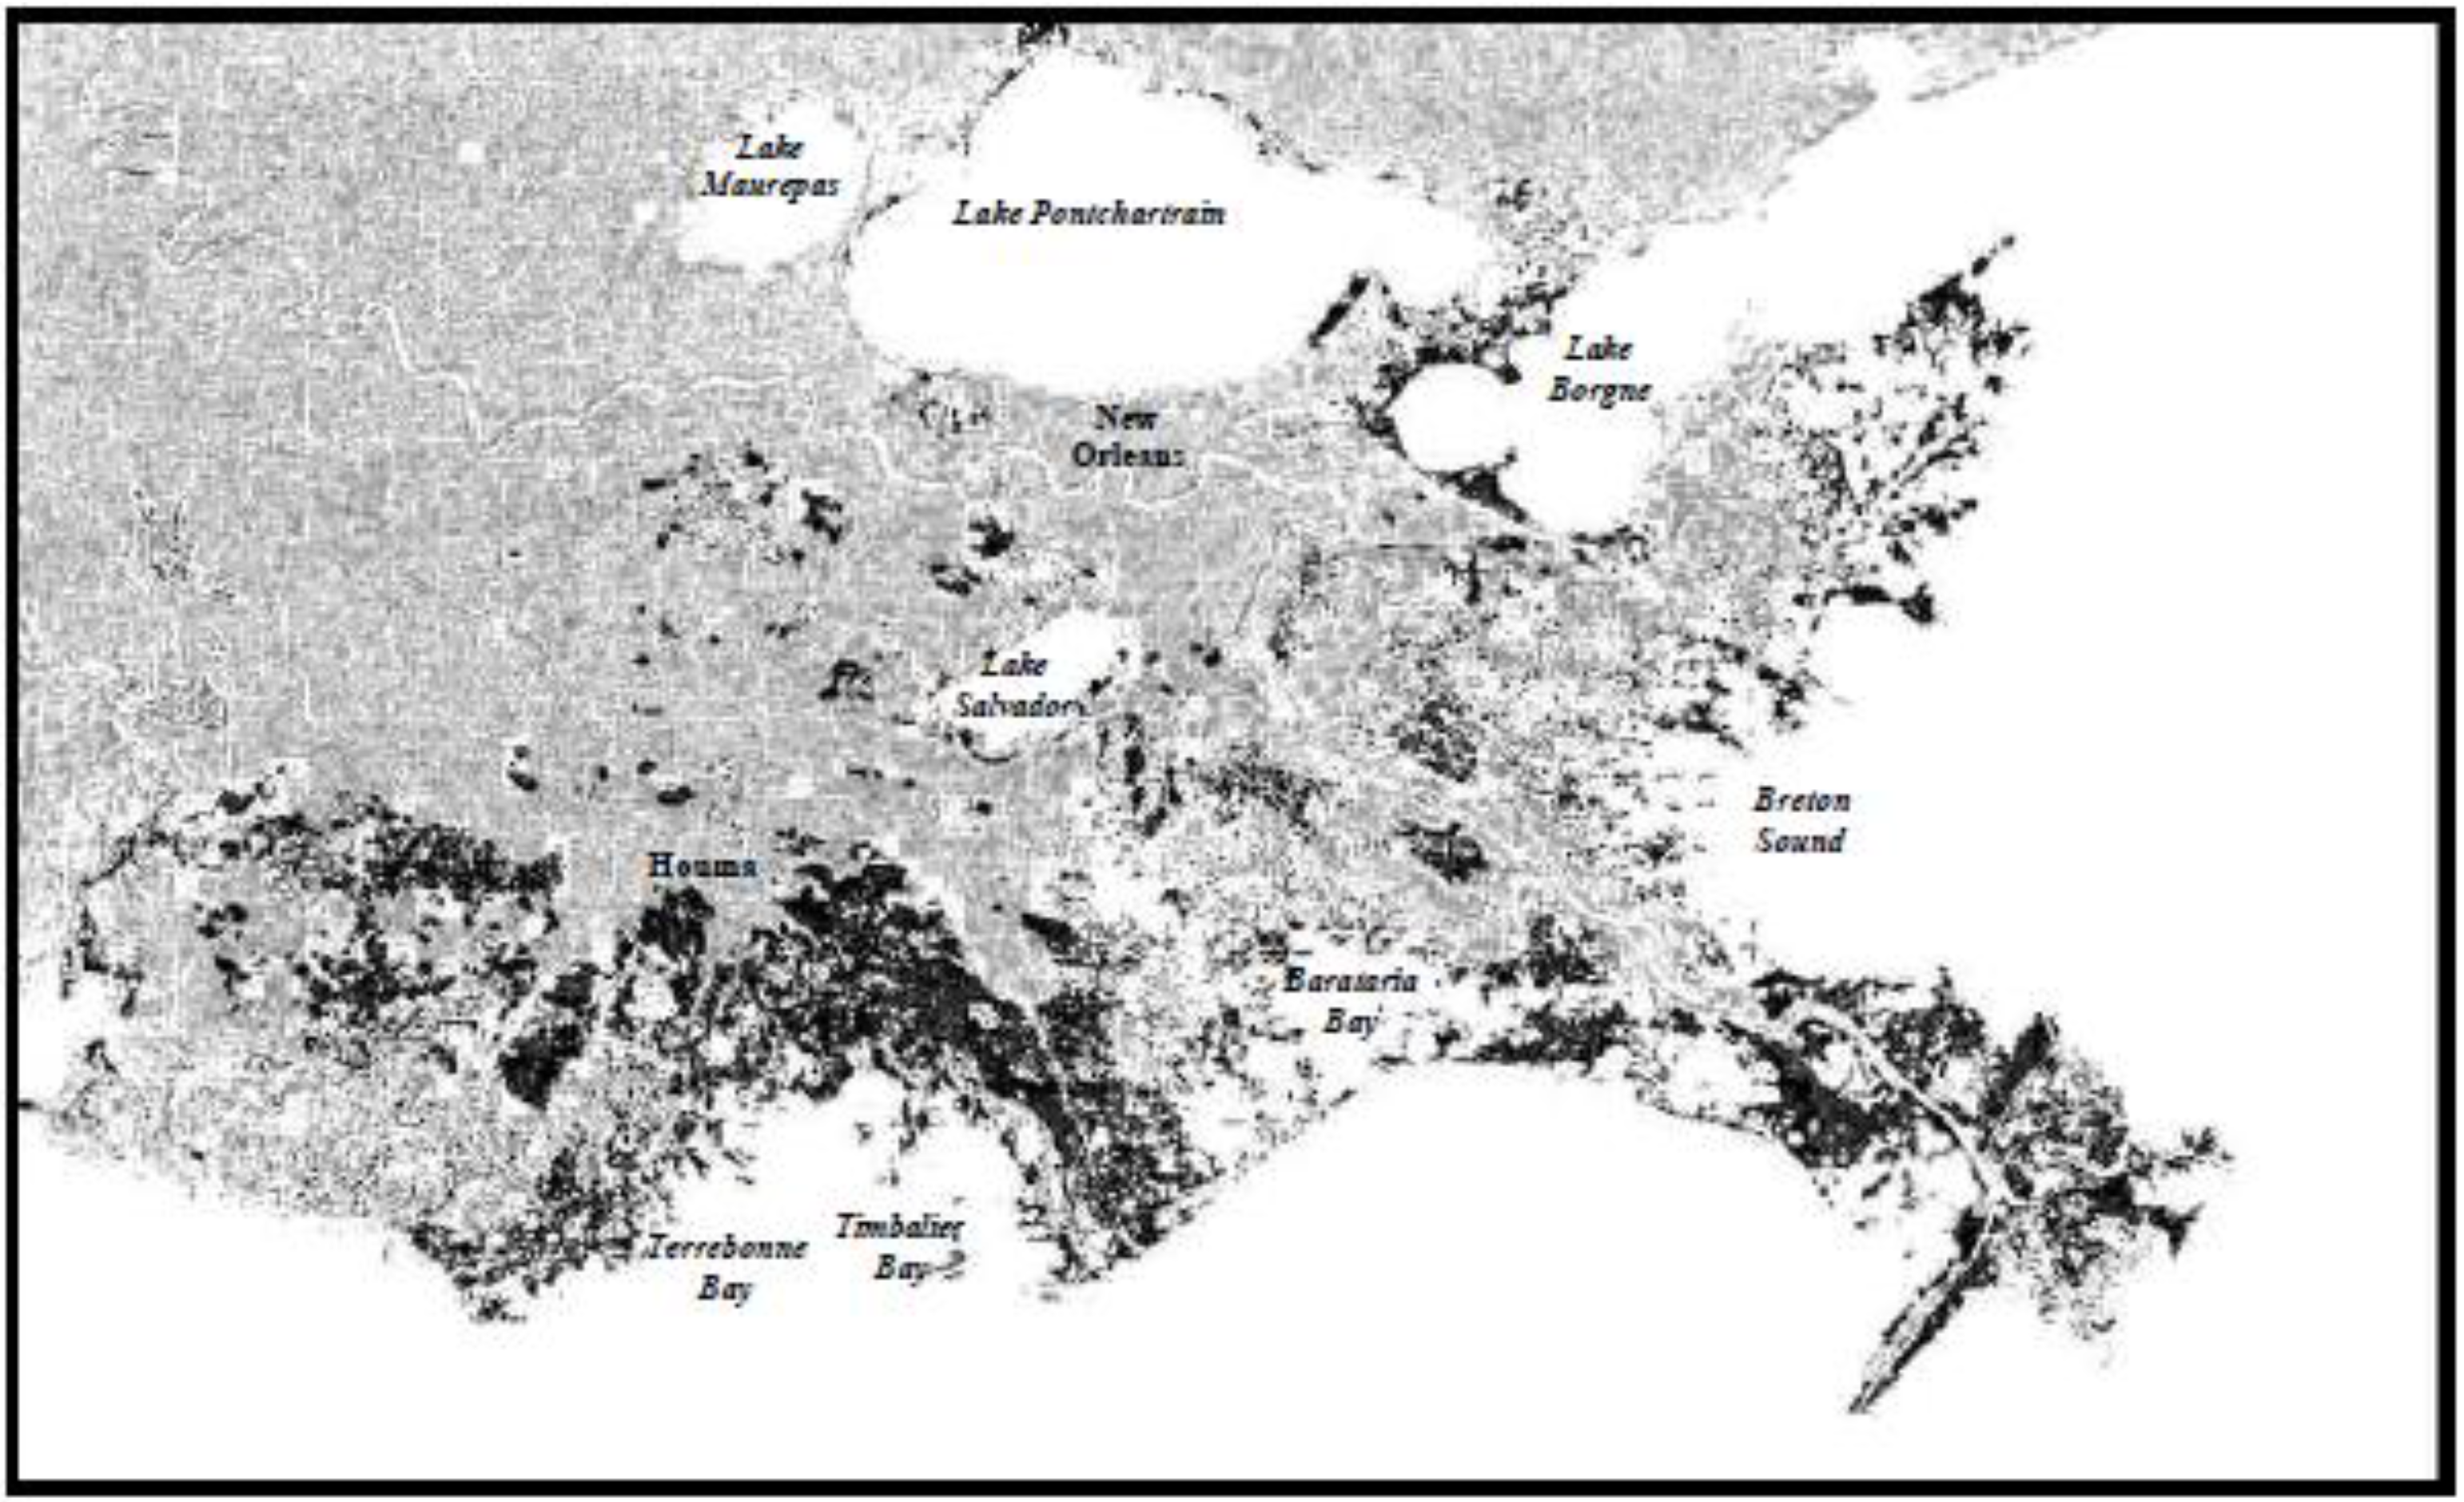
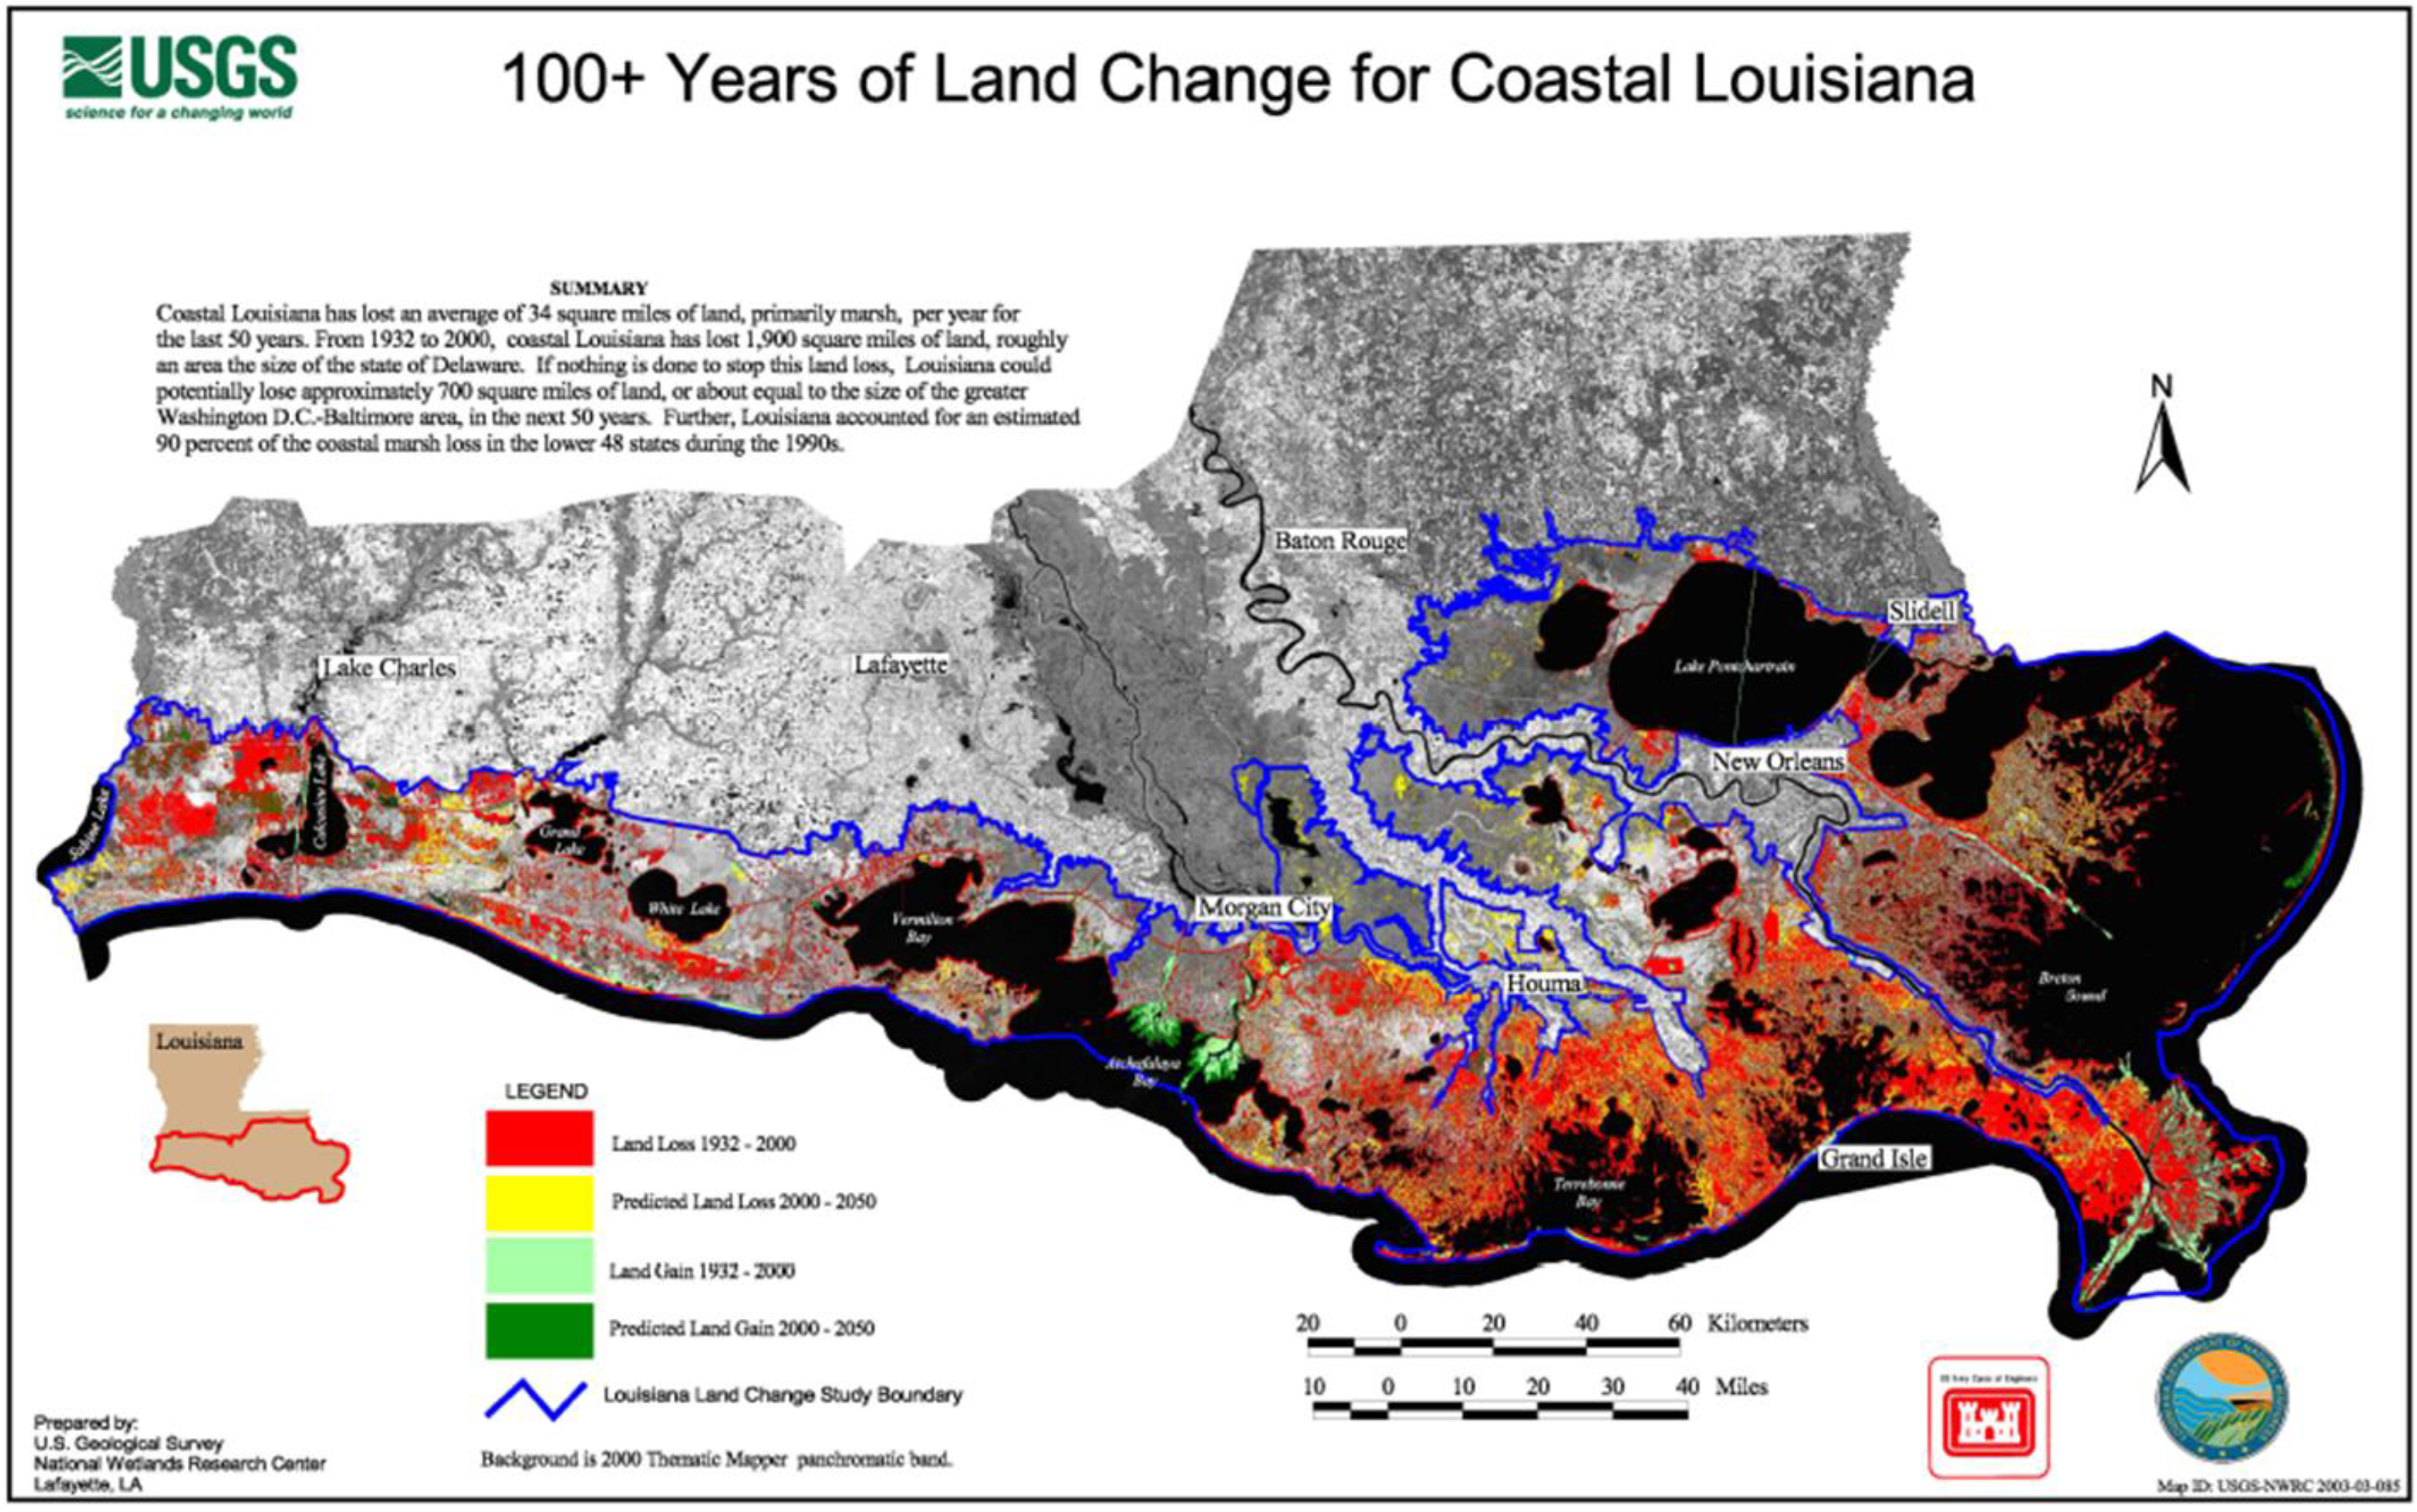
For more than two decades scholars and agency personnel had been presenting similar versions of a future that offered little hope for the coastal ecology and to a lesser extent coastal residents and their livelihoods. The USGS became a leading authority on mapping land loss and projecting future losses (
Figure 7). Academics, agency personnel, and policy makers had embraced the basic concept of land loss. Conveying this to the public remained a challenge. The USGS and Louisiana officials sought a more comprehensible measure for public consumption. Around 2000, John Barras a geographer with the USGS, calculated the rate of loss as approximately a football field per hour. While cautioning that this could oversimplify the situation, he acknowledged it could be useful in public outreach [
36]. The Louisiana Department of Natural Resources used the rate in public discussions and news media picked up on the catchy measure.
In 2002, a coalition of businesses, foundations, and environmental organizations set out to elevate public concern with the land loss crisis and adopted the measure along with a campaign to retitle the coastal marshes as “America’s Wetlands” [
38]. By inserting “America” for Louisiana, this public relations effort quite effectively asserted a national dimension to the problem—reflecting the 1990’s congressional testimony that declared they were a national treasure. Merging the new title with the football-field metric captured wide public interest [
39]. When offering an updated land loss map in 2017, a USGS geographer pointed out that he continued using the measure, while also updating it, because the public could relate to it [
40]. The land loss conversation truly expanded to all levels of society when this terminology gained acceptance—with all its misconceptions. When an authority declares that the state is losing a football field an hour—which sounds like a threat to the sacred turf in Tiger Stadium on LSU’s campus—it had a resonance previously unknown. No red-hued swaths of projected land loss could compare with this dire forecast.
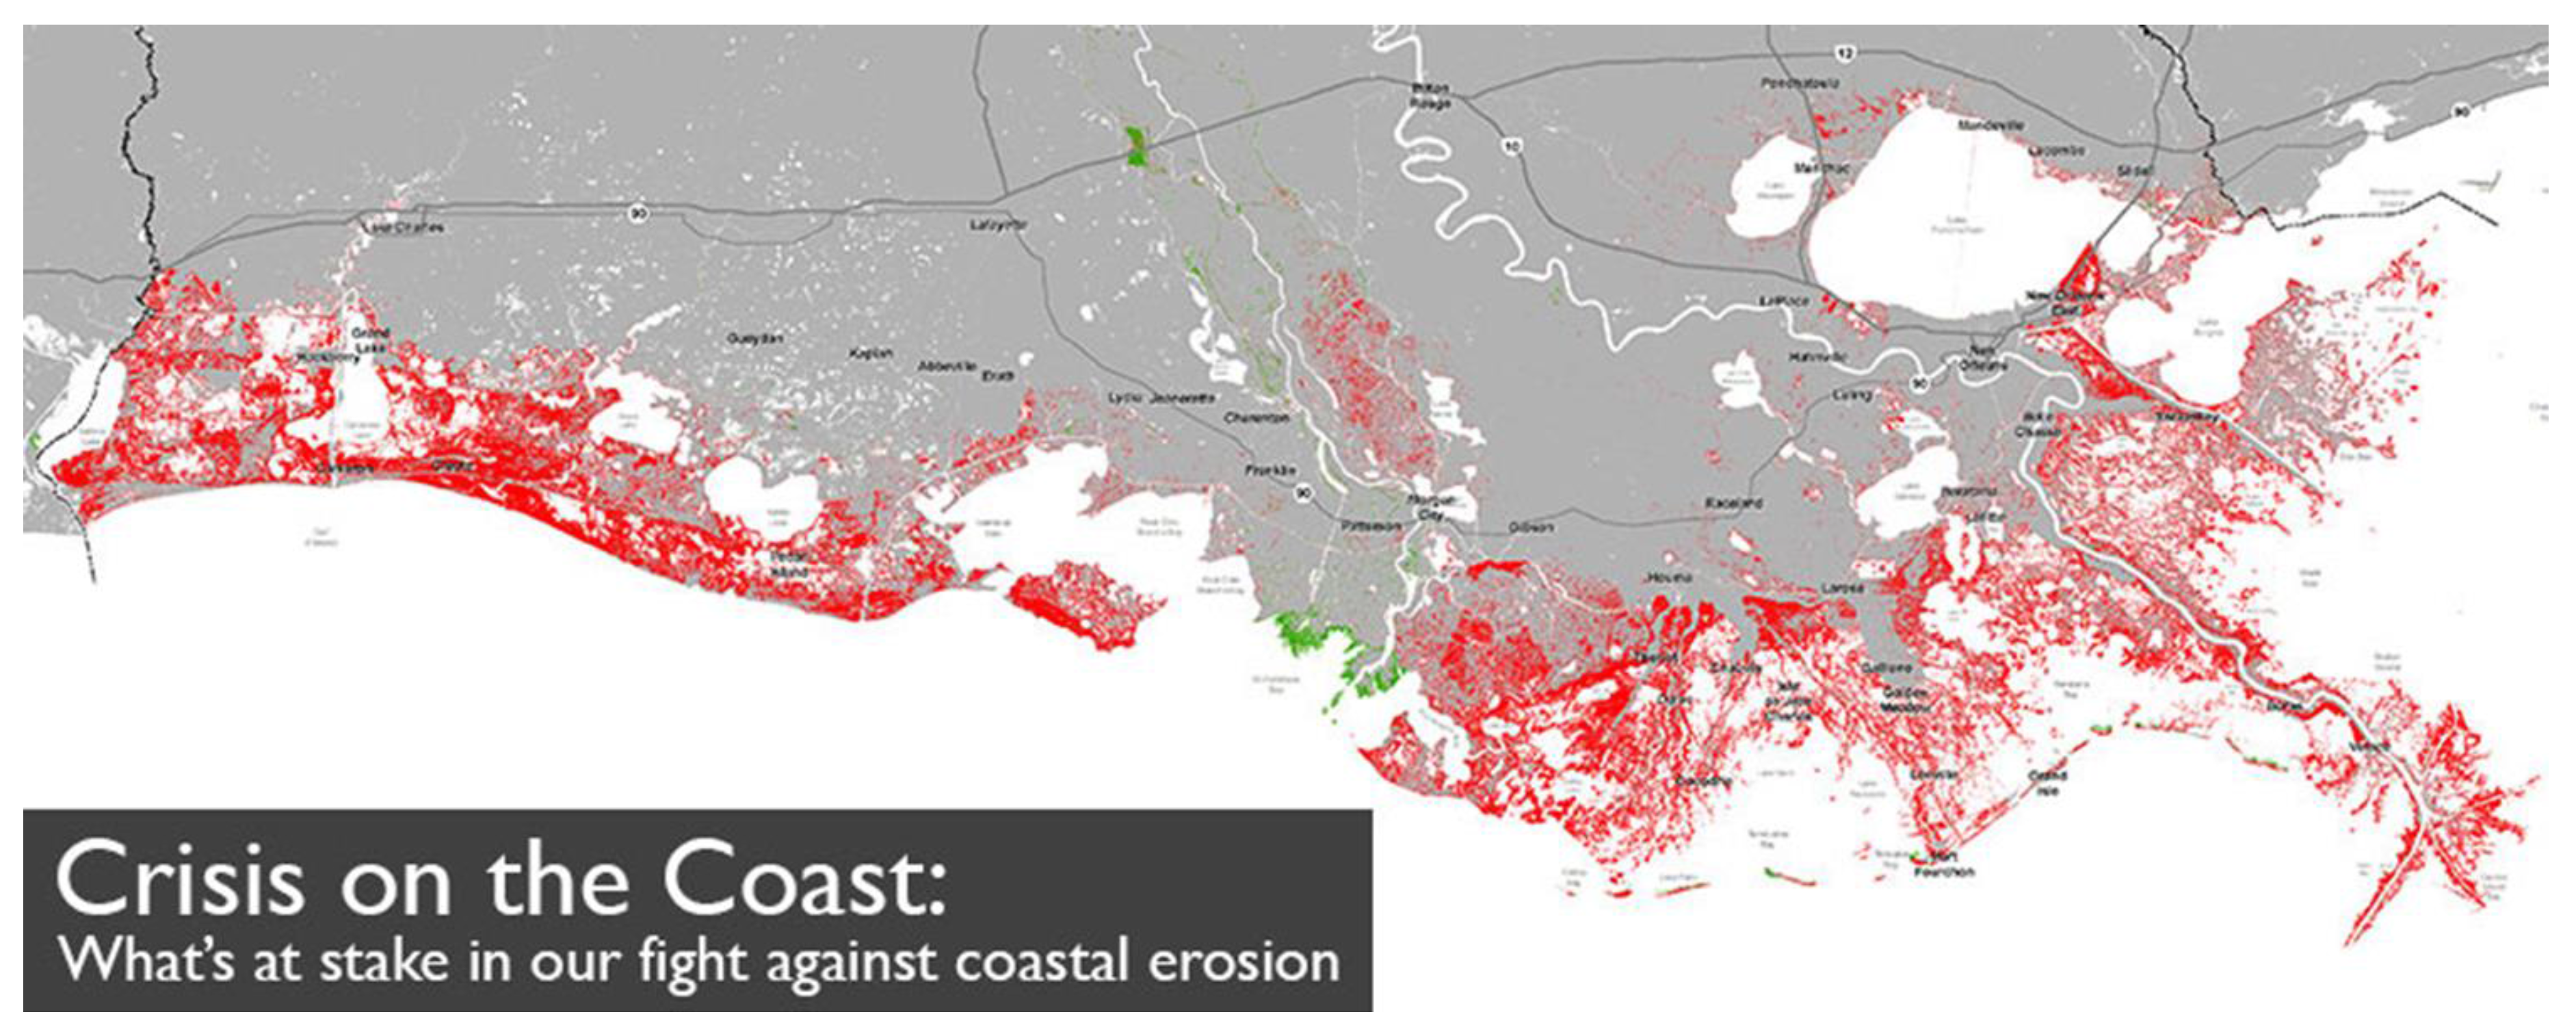
Following Hurricane Katrina in 2005, Louisiana reorganized and centralized its coastal restoration efforts in the newly formed Coastal Protection and Restoration Agency (CPRA). It produces a plan every five years and its 2012 plan declared land loss as the “coastal crisis” and an “ongoing catastrophe” (
Figure 8) [
3] (pp. 16, 21). The CPRA has numerous advisory groups and engages in public outreach, but the planning is largely done by agency professionals and contractors, with public input limited to responding to plans in advanced stages. There are numerous environmental and citizens’ advocacy groups that support the state’s planning process, although there are also critics among the oyster and shrimp harvesters and academics. The CRCL still exists and has been joined by numerous other national and local organizations in voicing concern with the coastal issue. While gaining public support, the plan acknowledges climate change as a factor, but does not foreground this process as a major factor in sea level rise [
3,
4].
In its projection of future losses, based on modeling that considered a range of environmental uncertainties, not past land loss rates, it used the dramatic red color to indicate land areas likely to disappear. The areas in red are truly alarming even to the casual viewer. The agency’s presentation of the restoration efforts is more comprehensible and visually appealing than prior depictions, but it fails to show the projected achievements of restoration projects and largely dismisses people. Despite asserting that restoration is central to the coastal region’s society and economy, the mapping of future losses reveals virtually nothing about social or economic losses [
3,
4]. In its 2017 plan, the state agency follows similar methods to achieve a consistent presentation of future losses: red to highlight the projected loss, and broad stroke coloring to show the placement of land restoration [
4].
The remarkable cartographic transition that occurred over the decades since the first scientific measurements of land loss was the shift from historical loss, to projected loss. The two most recent master plans report on the area of land loss in simple numbers, not as cartographic representations. The numbers are impressive. In 2012, the state reported that Louisiana had lost 1880 square miles since 1930 [
3] (p. 16), and in 2017, the master plan observes that the state lost “more than 1800 square miles between 1932 and 2010”—in effect discounting the total and not even updating it [
4] (p. 2). In the two-page spread showing projected land loss, the plan projects that an additional 2250 square miles could be lost in the coming 50 years. It spotlights the future threat, not the historical losses. This calls on readers to imagine a future that in even more perilous than the present. This has proven effective in the public arena.
7. Conclusions
The great accomplishment of the cartographic depictions of coastal land loss has been threefold. Representations of past loss pushed a largely unseen landscape into public view. It transformed a remote, unpopulated, and long dismissed swath of coastal marsh into the foreground of multiple public discussions. Rising interest in remote wetlands as scenic resources along with attention to what we now refer to as “ecosystem services” has broadened public interest. Protection and restoration programs, aided by contemporaneous public policies that placed high value on protecting ecological resources and even restoring those that had been diminished by human action, became dominant outcomes that flowed from the mapping of a disappearing shore. This is a step towards sustainable policies.
The second aspect was the elevation of coastal land loss as a national political issue by the state’s congressional delegation and the successful passage of federal legislation in 1990. The federal legislation launched deliberate restoration projects funded by both state and federal programs and spurred more investment in research on the processes that produced loss and those that could offset it. Presented as a process to protect and restore a valuable but disappearing ecosystem, and not a response to climate change, the ultimate objective aligns with current global climate change concerns. Collectively, the research and restoration programs, along with expanding outreach efforts by local and national NGO’s sustained public interest and visibility. Sustainability has become a stated goal of the state’s programs—although one subject to criticism due to the plan huge costs, energy demands, and projected inability to stay apace with rising sea levels in the long run [
45].
Finally, both the maps of past loss and those of future loss made all too apparent that the coast was a dynamic landscape. The digital versions, however, have largely dropped the historical views. The state’s shore was in constant change and recognition of this situation spurred efforts to restore this susceptible setting. It also made clear that coasts, in an era of seal-level rise, are not solid, permanent foundations for society. Even if they are the basis for highly productive ecosystems that provide numerous resources, they are subject to degradation and loss. This is the ultimate message for the larger global climate change community, and this underscores the need to pursue policies that promote and deliver sustainability.
Southern Florida, coastal Virginia, and the Houston metropolitan area, in particular, share similar, albeit not identical, characteristics. They are also home to much larger urban populations that face the threats associated with global climate change. Effective communication of risk using maps that portray a combination of projected physical losses, threats to social and economic systems, and their presentation over a prolonged period of time may prove effective in driving policies that embrace sustainability. While the Louisiana maps neglected social and economic landscapes, their visualizations provided a basis to impel policy makers to launch programs aimed at creating a more sustainable shore.

