Article

Identification of Nitrogen, Phosphorus, and Potassium Deficiencies Based on Temporal Dynamics of Leaf Morphology and Color

1
Institute of Applied Remote Sensing and Information Technology, College of Environmental and Resource Sciences, Zhejiang University, Hangzhou 310058, China
2
College of Ocean Science and Engineering, Shanghai Maritime University, Shanghai 201306, China
*
Authors to whom correspondence should be addressed.
Sustainability 2018, 10(3), 762; https://doi.org/10.3390/su10030762
Submission received: 10 February 2018 / Revised: 8 March 2018 / Accepted: 8 March 2018 / Published: 10 March 2018

Abstract

:
Non-destructive nutrition diagnosis provides effective technological support for agricultural sustainability. According to the plant nutrition mechanism, leaf characteristics displays different changing trends under nitrogen (N), phosphorus (P), and potassium (K) nutrition stress. In this study, the dynamic capture of rice leaf by scanning was used to research the changing regulation of leaf characteristics under nutrition stress. The leaf characteristics were extracted by mean value and regionprops functions in MATLAB, and the leaf dynamics were quantified by calculating the relative growth rate. Stepwise discriminant analysis and leave one out cross validation were applied to identify NPK deficiencies. The results indicated that leaves with N deficiency presented the lowest extension rate and the fastest wilt rate, followed by P and K deficiencies. During the identification, both morphological and color indices of the first incomplete leaf were effective indices for identification, but for the third fully expanded leaf, they were mainly color indices. Moreover, the first incomplete leaf had comparative advantage in early diagnosis (training accuracy 73.7%, validation accuracy 71.4% at the 26th day after transplantation), and the third fully expanded leaf generated higher accuracy at later stage. Overall, dynamic analysis expanded the application of leaf characteristics in identification, which contributes to improving the diagnostic effect.

1. Introduction

The overuse of nitrogen (N), phosphorus (P), and potassium (K) fertilizers has become a common phenomenon in field management, which has also led to serious environmental pollution and resource waste. Therefore, timely and precisely nondestructive diagnosis is necessary for precision management of fertilization and agricultural sustainability. Hyperspectral imaging analysis and digital image processing analysis are the most widely used techniques in nondestructive nutrition diagnosis. As the method integrates spectroscopy and imaging technologies, hyperspectral imaging analysis has attracted a great deal of attention in various study areas, such as plant nutrition diagnosis [1], water detection [2], and quality evaluation [3]. However, the strict requirements of the measurement environment and the high cost of the equipment make it difficult to generalize in the field [4]. Alternatively, digital image processing technology is capable of extracting spectral, morphological, and texture characteristics from digital images [5,6,7], and its effectiveness for nutrition diagnosis has been examined in various studies [8,9,10,11]. Compared to hyperspectral imaging technology, digital image processing technology has the advantages of being inexpensive, easy to operate, and portable for practical applications, especially in the field. Given the above, digital image processing technology is more suitable to be generalized and applied in practice.
However, the sampling time in nutrition diagnosis has traditionally been arranged at major growth stages, such as the tillering stage, jointing stage and booting stage [4,12]. Such data are intermittent and incomplete and are not sufficient for the further exploration of sensitive characteristics. Leaf chlorosis, a typical symptom results from NPK deficiency, is traditionally assessed by leaf color at certain stages [8,13], but the dynamic nature of chlorosis, which is valuable for data mining, is difficult to be quantified by intermittent information. Moreover, when exposed to nutrition deficiency, the stress symptoms are keys to nutrition diagnosis [13,14]. However, it takes time for stress symptoms to become noticeable, which imposes time restrictions on nutrition diagnosis to some extent. According to the plant growth mechanism, the influence of NPK deficiencies on leaf growth embody stress symptoms and the temporal dynamics of stress symptoms (the formation and development of stress symptoms) [15]. These dynamic characteristics, which can be captured at any growth phase, are able to reduce the time restriction on diagnosis and improve the diagnostic effect, but they are also difficult to be quantified by intermittent information. Given the above, continuous and complete leaf information, which can be acquired by continuous monitoring, is particularly necessary for the exploration of effective characteristics and improvement of diagnostic effect.
In recent years, continuous monitoring has been applied in many studies to uncover plant phenotypic responses to different environmental stresses [16,17,18,19]. Studies conducted by Zhang et al. [20] and Neilson et al. [16] showed that temporal dynamics of leaf morphology and color differed with nutrition supplies during leaf extension. These results provide evidence for the feasibility of applying incomplete leaves in nutrition diagnosis and further imply that nutrition deficiency can be identified by dynamic features at an early stage. In addition to the incomplete leaf, fully expanded leaves also carry important dynamic characteristics for nutrition diagnosis. The nutrition stress symptoms resulting from NPK deficiencies appear primarily on fully expanded leaves, especially the older leaves [9]. In this sense, the dynamic characteristics of fully expanded leaves are particularly important for the identification of sensitive characteristics. Therefore, the dynamic characteristics of different leaf positions (including the incomplete leaf and fully expanded leaves) represent valuable information for the further study of nutrition diagnosis.
Generally, the continuous monitoring of rice leaves provides detailed leaf information to identify sensitive characteristics, which is helpful to collect plant information more targeted in the following work. The application of dynamic characteristics in nutrition diagnosis allows us to explore the diagnostic effects at any stage, helping us to achieve satisfactory diagnostic effects as early as possible. In general, the goals of this article are to (i) analyze the temporal dynamics of leaf morphology and color under NPK deficiencies, (ii) find effective dynamic indices and optimal leaf position for identification, and (iii) identify NPK deficiencies using dynamic indices.

2. Materials and Methods

2.1. Experiment Materials

The experiment was carried out in 2014 and 2015 at ZiJinGang campus of Zhejiang University (30°179 N, 120°059 E) in Hangzhou, China. Hydroponics with a nutrient solution formula from the International Rice Research Institute (IRRI) was applied to cultivate rice plants. Seedlings of ZheYou-NO.1 were transplanted into 5L polyvinyl chloride pots that contained different levels of nutrient solution. Four nutrition treatments of N deficiency, P deficiency, K deficiency, and normal supply were arranged in this experiment. There were four levels of nutrient applications (extreme deficiency, severe deficiency, moderate deficiency, and mild deficiency) in each treatment, except for normal treatment: N (NH4NO3: 0 mg/L (N1), 28.60 mg/L (N2), 57.20 mg/L (N3), 85.70 mg/L (N4)); P (NaH2PO4·2H2O: 0 mg/L (P1), 12.60 mg/L (P2), 25.20 mg/L (P3), 37.80 mg/L (P4)); K (K2SO4: 0 mg/L (K1), 22.30 mg/L (K2), 44.70 mg/L (K3), 67.00 mg/L (K4)); normal (NH4NO3: 114.30 mg/L, NaH2PO4·2H2O: 50.40 mg/L, K2SO4: 89.30 mg/L). In total, 13 nutrient levels with five replicates at each level were designed in this trial. The nutrient solution was replaced every two weeks.

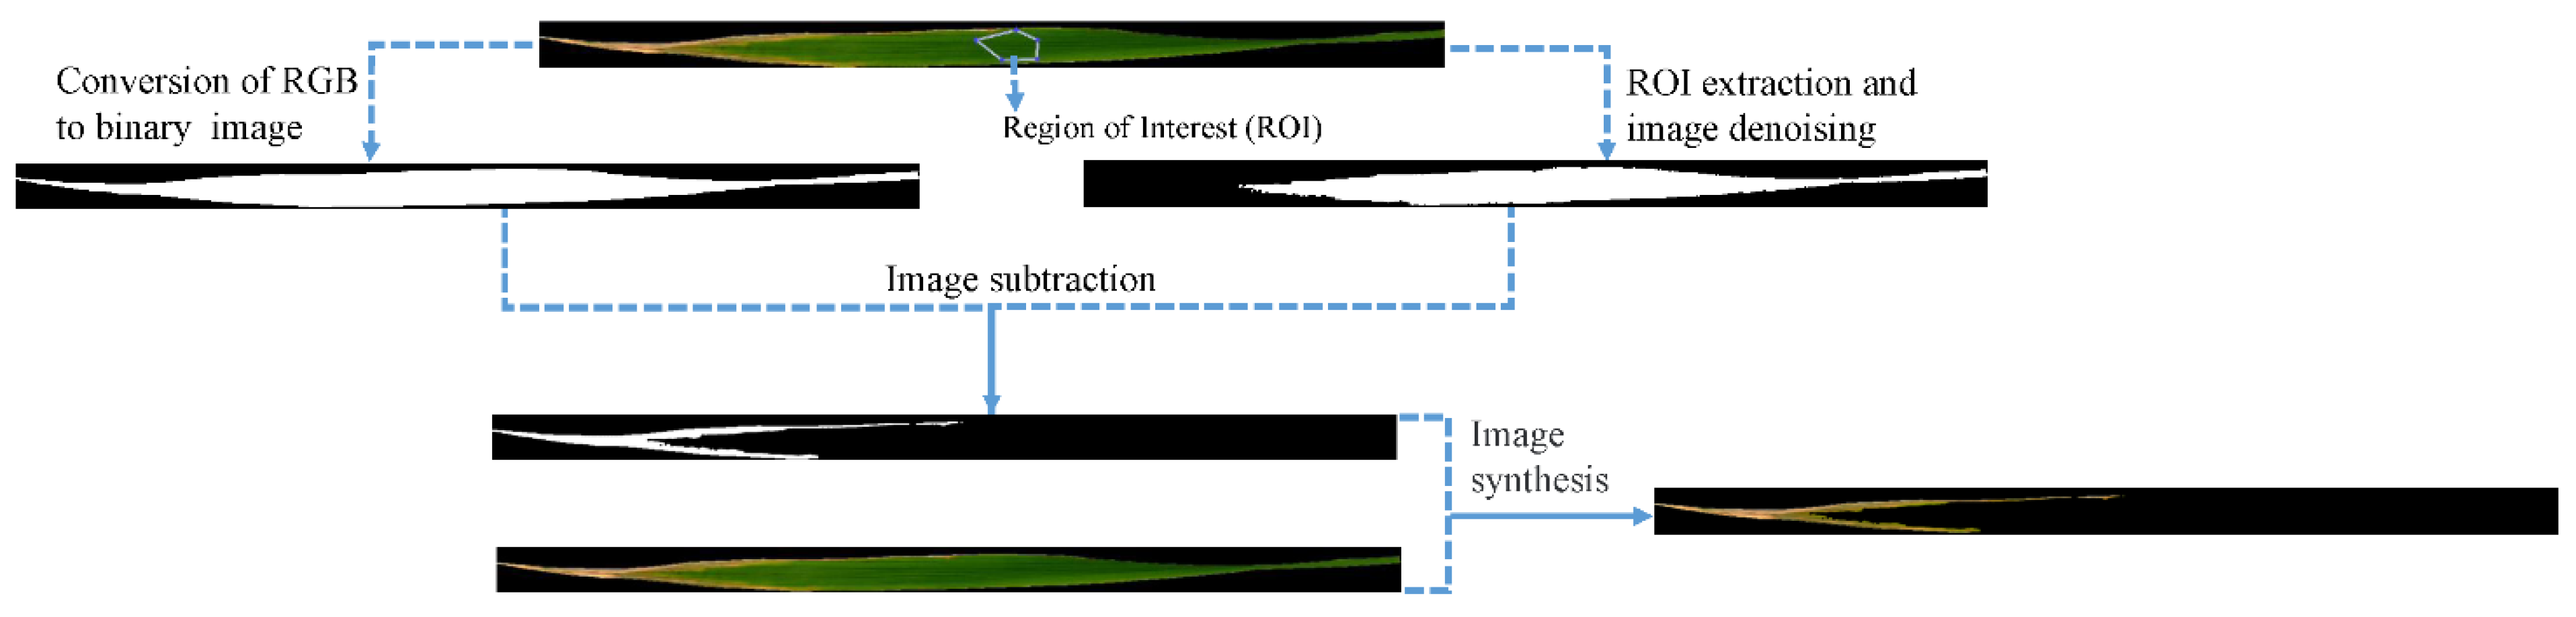
2.2. RGB Image Acquisition and Processing

Considering the influence of light and the operator, a desk scanner (EPSON GT20000, Epson Inc., Suwa, Nagano prefecture, Japan) was taken to collect rice leaf images, and the scanning was implemented in a closed environment minimized external effects [9,21]. From 20 days after the seedlings were transplanted (DAT20, DAT: days after transplantation) to DAT44 (in 2014 and 2015), the top four leaves (the first incomplete leaf and the three younger fully expanded leaves from the top of the plant: the first, second, and third fully expanded leaves) were marked with labels and scanned every three days to ensure that the image information is from the same leaf. The image resolution was set to 300 dpi (dots per inch), and all captured images were saved in the tag image file format (TIFF). Finally, data acquisition was conducted nine times, and there were 4281 leaf images in total.
All leaf images were processed in MATLAB 2013b (MathWorks Inc., Natick, MA, USA), and mean value and regionprops functions were used to calculate the characteristics of leaf color and morphology. Mean function was used to calculate the average value of the elements, and regionprops function was used to calculate the properties of image regions such as the area, perimeter, eccentricity, rectangularity, etc. Because the results of some morphological indices were presented in the form of pixels, a conversion must be performed to obtain the actual result. The resolution of leaf image was 300 dpi, which means one inch contains 300 pixels, and since one inch equals to 2.54 cm, the length of one pixel equals to 2.54/300 cm In this sense, the actual area (cm2) was calculated as the sum of all pixels within the range of the leaf multiplied by (2.54/300)2, and the actual length (cm) was calculated by multiplying the pixel number by 2.54/300.

2.3. Dynamic Analysis of Leaf Responses to NPK Deficiency in Different Leaf Positions

During the life cycle of rice leaves, significant dynamics mainly exist in the process of leaf extension and senescence. Accordingly, rice leaves can be categorized into two types: the first incomplete leaf, which embodies the extension process, and the fully expanded leaves (the three younger fully expanded leaves from the top of the plant: the first, second, and third fully expanded leaves), which embody the senescence process. Hence, analysis of leaf dynamics would be carried out in the above two aspects. According to previous studies, there are many indices that are capable of revealing the dynamic changes of leaf morphology and color [4,12,22]. However, considering the purpose of dynamic analysis is to find the difference among NPK treatments in morphological and color variations, we only need two appropriate indices of morphology and color to display the distinctions between different treatments that could be helpful for identification. Therefore, these two indices would be selected based on the dynamic nature of rice leaf and previous studies.
The first incomplete leaf: According to our observation, significant changes could be observed both in morphological and color characteristics during the leaf extension, but the morphological changes are more obvious. Among various types of morphological characteristics, leaf area is suitable for reflecting the overall information of leaf morphology [16,17], and the temporal dynamics of leaf area generally embody the influence of NPK deficiencies on leaf extension. Therefore, to make a more targeted analysis, the leaf area would be applied in dynamic analysis.
Fully expanded leaves: The color dynamics at the leaf senescence stage are more notable than morphological dynamics in the fully expanded leaves. Therefore, an appropriate color index is needed to display the color variation of different treatments. According to previous studies, the normalized red index (NRI) has been successfully used in nutrition diagnosis [6,23,24]. Hence, NRI would be applied to display leaf color responses to NPK deficiencies during leaf senescence.
In general, the temporal dynamics leaf area in the first incomplete leaf and NRI in the fully expanded leaves are applied to reveal the leaf responses to NPK deficiencies at the extension and senescence stages, respectively.

2.4. Quantification of Dynamic Characteristics

There are two main steps in the quantification of dynamic characteristics. The first step is the quantification of leaf morphological and color characteristics. As shown in Table 1, there are 22 indices (nine morphological indices and 13 color indices) that have been proven to be effective in previous studies and are selected to quantify leaf characteristics [4,12,22]. The final step is the quantification of dynamic changes of the above indices according to Equation (1).
In addition, considering that leaf chlorosis is the typical symptom caused by NPK deficiencies, segmentation of the chlorotic part and quantification of chlorotic characteristics is carried out during the first step. The specific segmentation process is shown in Figure 1 [25]. First, a region of interest (ROI) was selected to extract the green part, and image subtraction was carried out between the entire leaf and the extracted green part (both of them had been converted into binary images) to get the non-green part (the chlorotic part). The reason we chose the green part as ROI rather than the chlorotic part was that the chlorotic part was smaller at early stage, and its color heterogeneity make it difficult to select a representative ROI. Finally, since the acquired chlorotic part was shown in binary image, image synthesis was carried out to restore its original RGB (red green blue) information for the quantification of various characteristics.
Relative growth rate (RGR) is an essential parameter for evaluating plant growth status and is widely used in botany studies [17,18,26]. In this paper, we expand the application of RGR to quantify dynamic changes of leaf morphological and color characteristics. RGR is calculated according to Hunt [27].
RGR = ( lnW 2 lnW 1 ) / ( t 2 t 1 )
where W1 and W2 are the initial and final values of indices form Table 1 at the beginning (t1) and end (t2) of the measurement period, respectively (Equation (1)).
For further exploration of the optimal sampling interval and diagnostic time, RGR was calculated with a 3-day interval and a 6-day interval in time order. However, due to the senescence of old leaves, some data are missing in the late stage. Consequently, there are seven datasets calculated at three-day intervals (named P1–P7 data set) and three datasets calculated at six-day intervals (named P1′–P3′ data set) that are applied in the discriminant analysis.

2.5. Identification Method

Discriminant analysis has been successfully applied in many studies [28,29,30] and is capable of identifying NPK deficiencies. Because amounts of indices will be used in classification and not each of them is effective, feature selection is needed to optimize the dataset, and a minimum number of indices will be applied in discrimination. Therefore, stepwise discriminant analysis (SDA) [28] with leave one out cross validation (LOOCV) was taken to identify NPK deficiencies. By using the SDA-LOOCV, the optimal indices would be used to establish discriminant model and its effectiveness would be validated thoroughly. This process was performed in IBM SPSS Statistics 22 (IBM, Armonk, NY, USA).
The operating steps of SDA were as follows: from all the input indices, the SDA chose one index at a time that has the most significant discriminant ability. Then, the next index was selected based on the discriminant ability of integrating these selected indices. If the discriminate ability increased after inputting the new index, SDA would go on to find the next new one. Oppositely, when the new input index weakened the discriminant ability of previous indices, SDA would remove the disable one by assessing all the previous selected indices, and the SDA would continue to find new index until there was no important index that should be excluded.
The mechanism of LOOCV were as follows: this method supposes M samples of data separated into M groups, one sample is selected as validation data, and the rest samples are training data. Then, we can acquire M models. The algorithm stopped when each sample had been selected as validation data. The average classification accuracy from these M models represents the discriminant ability of the data [9].
To further assess the effectiveness of dynamic indices for identification, 10 datasets (seven datasets calculated with three-day intervals, three datasets calculated with six-day intervals) are combined in time order. In total, there were 18 datasets of each leaf position, concluding “single dataset” and “combined datasets,” specific information is shown in Table 2.

3. Results

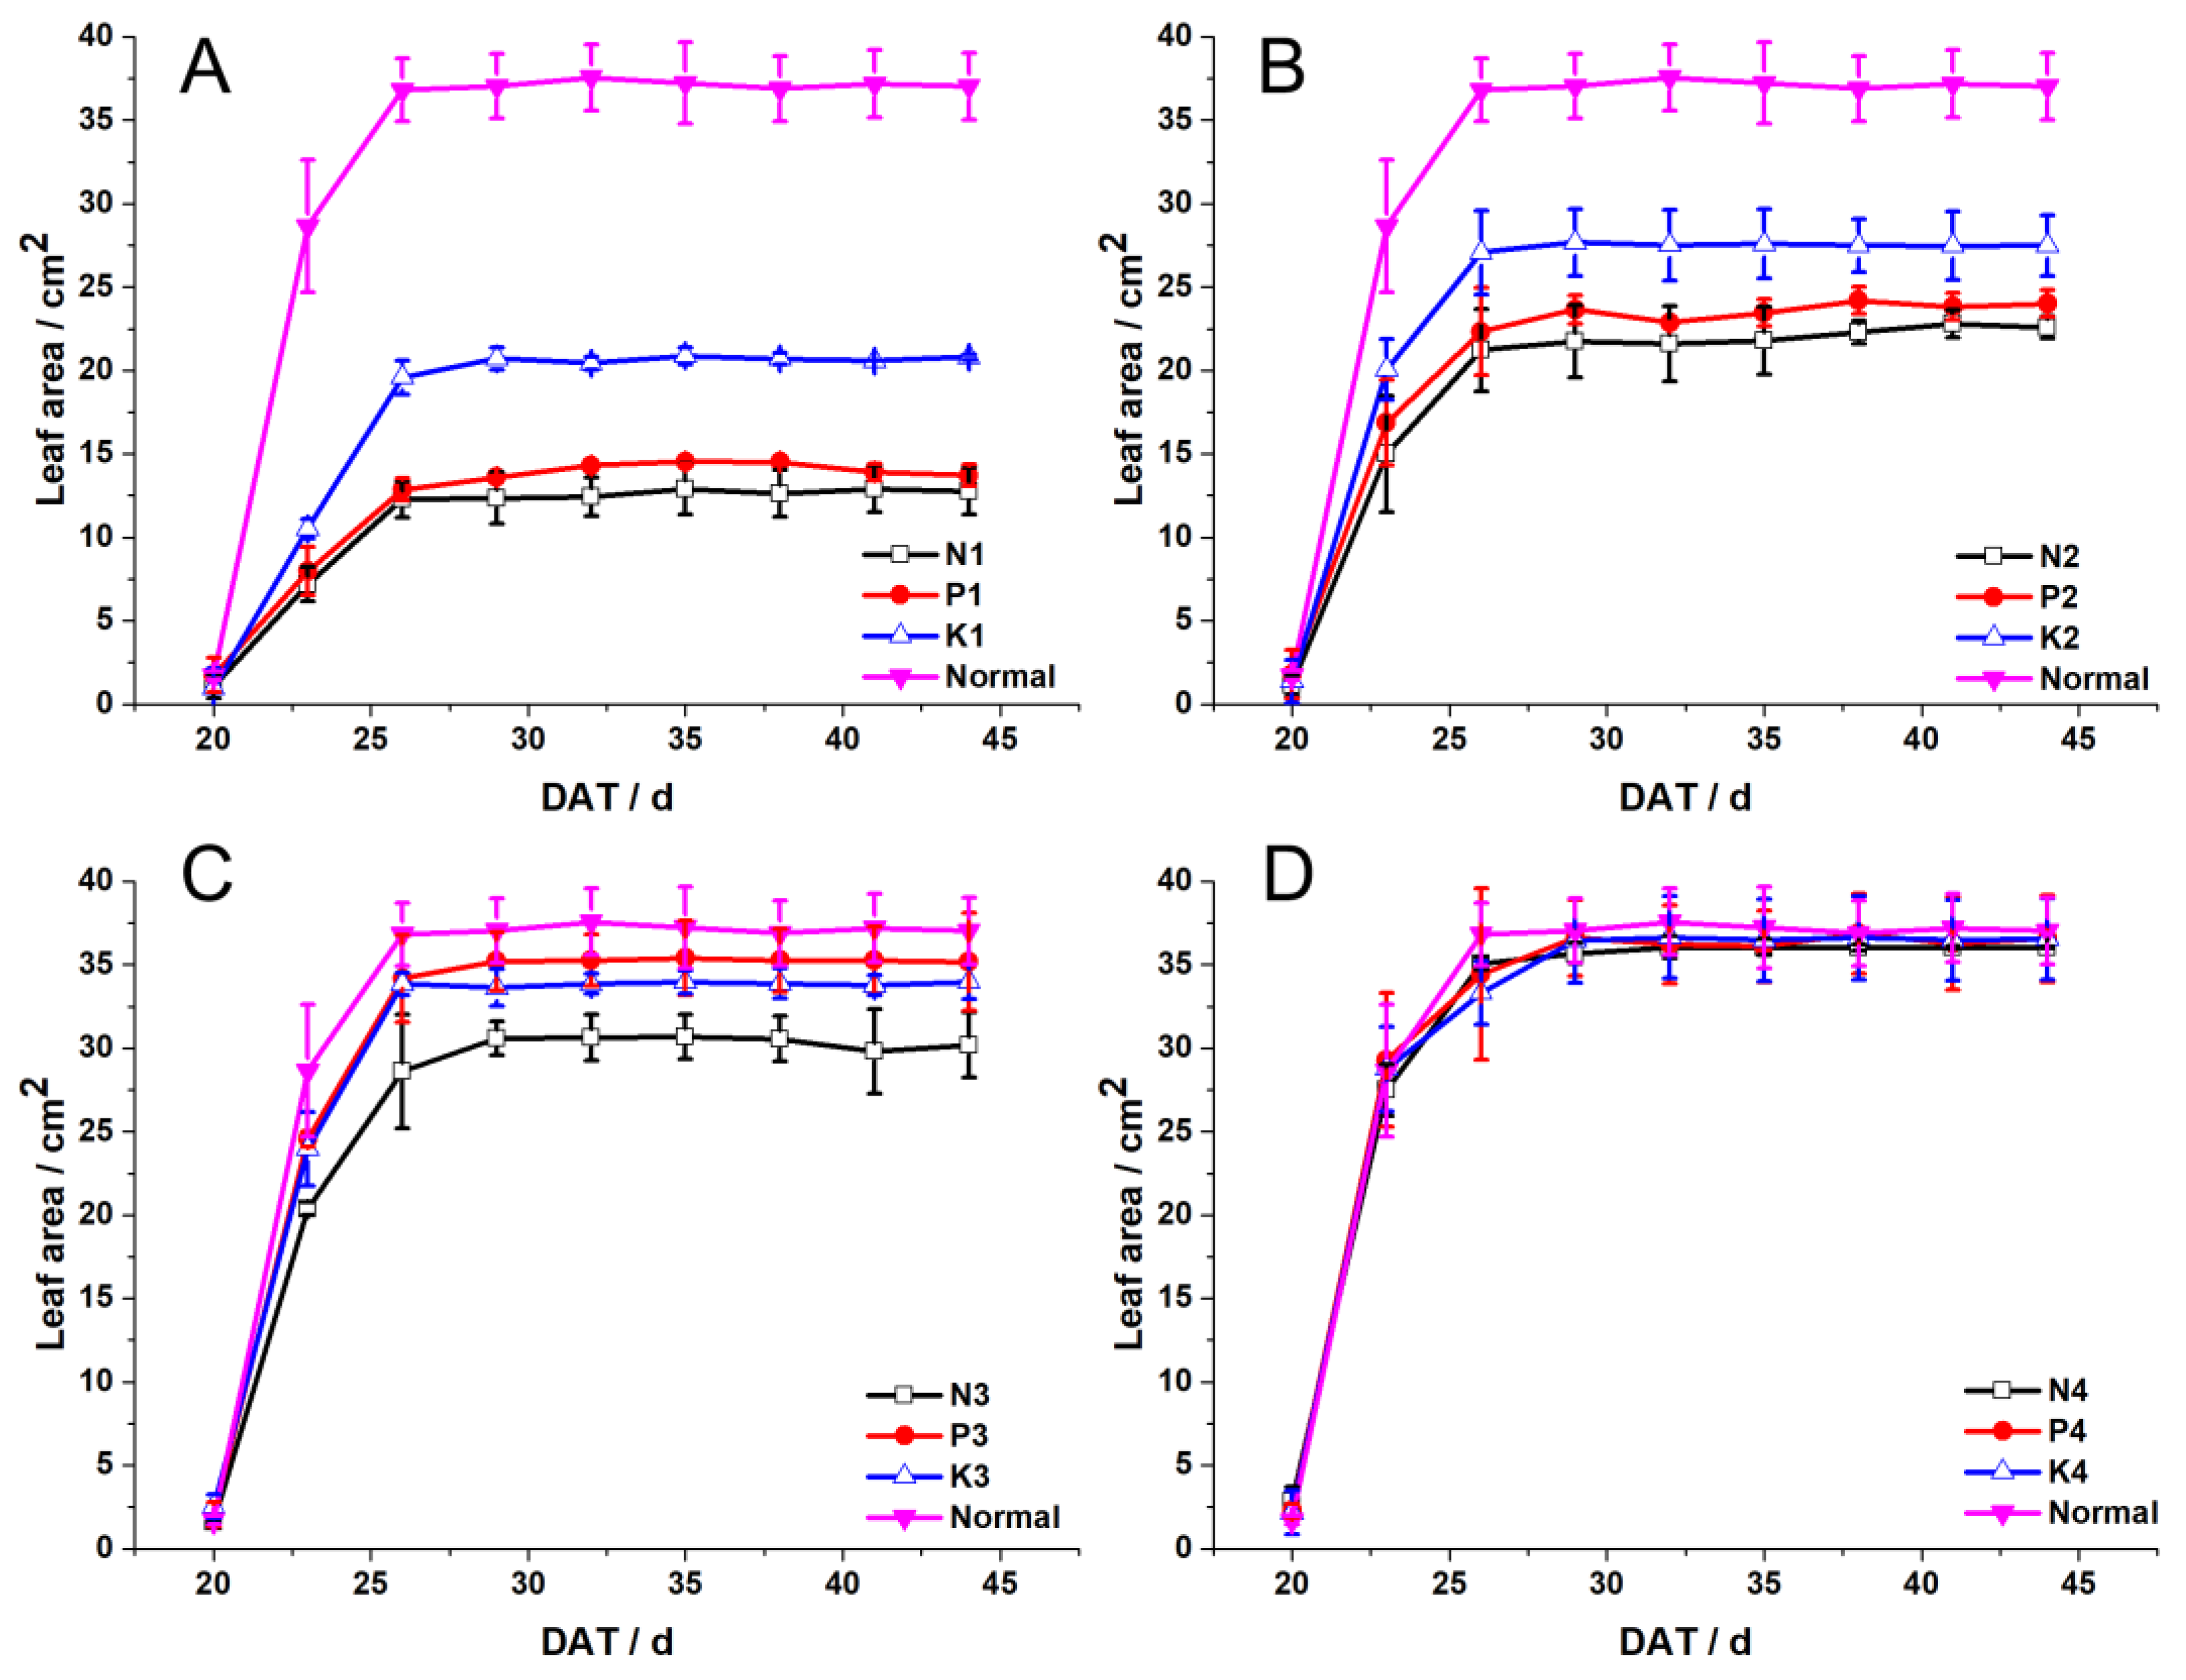
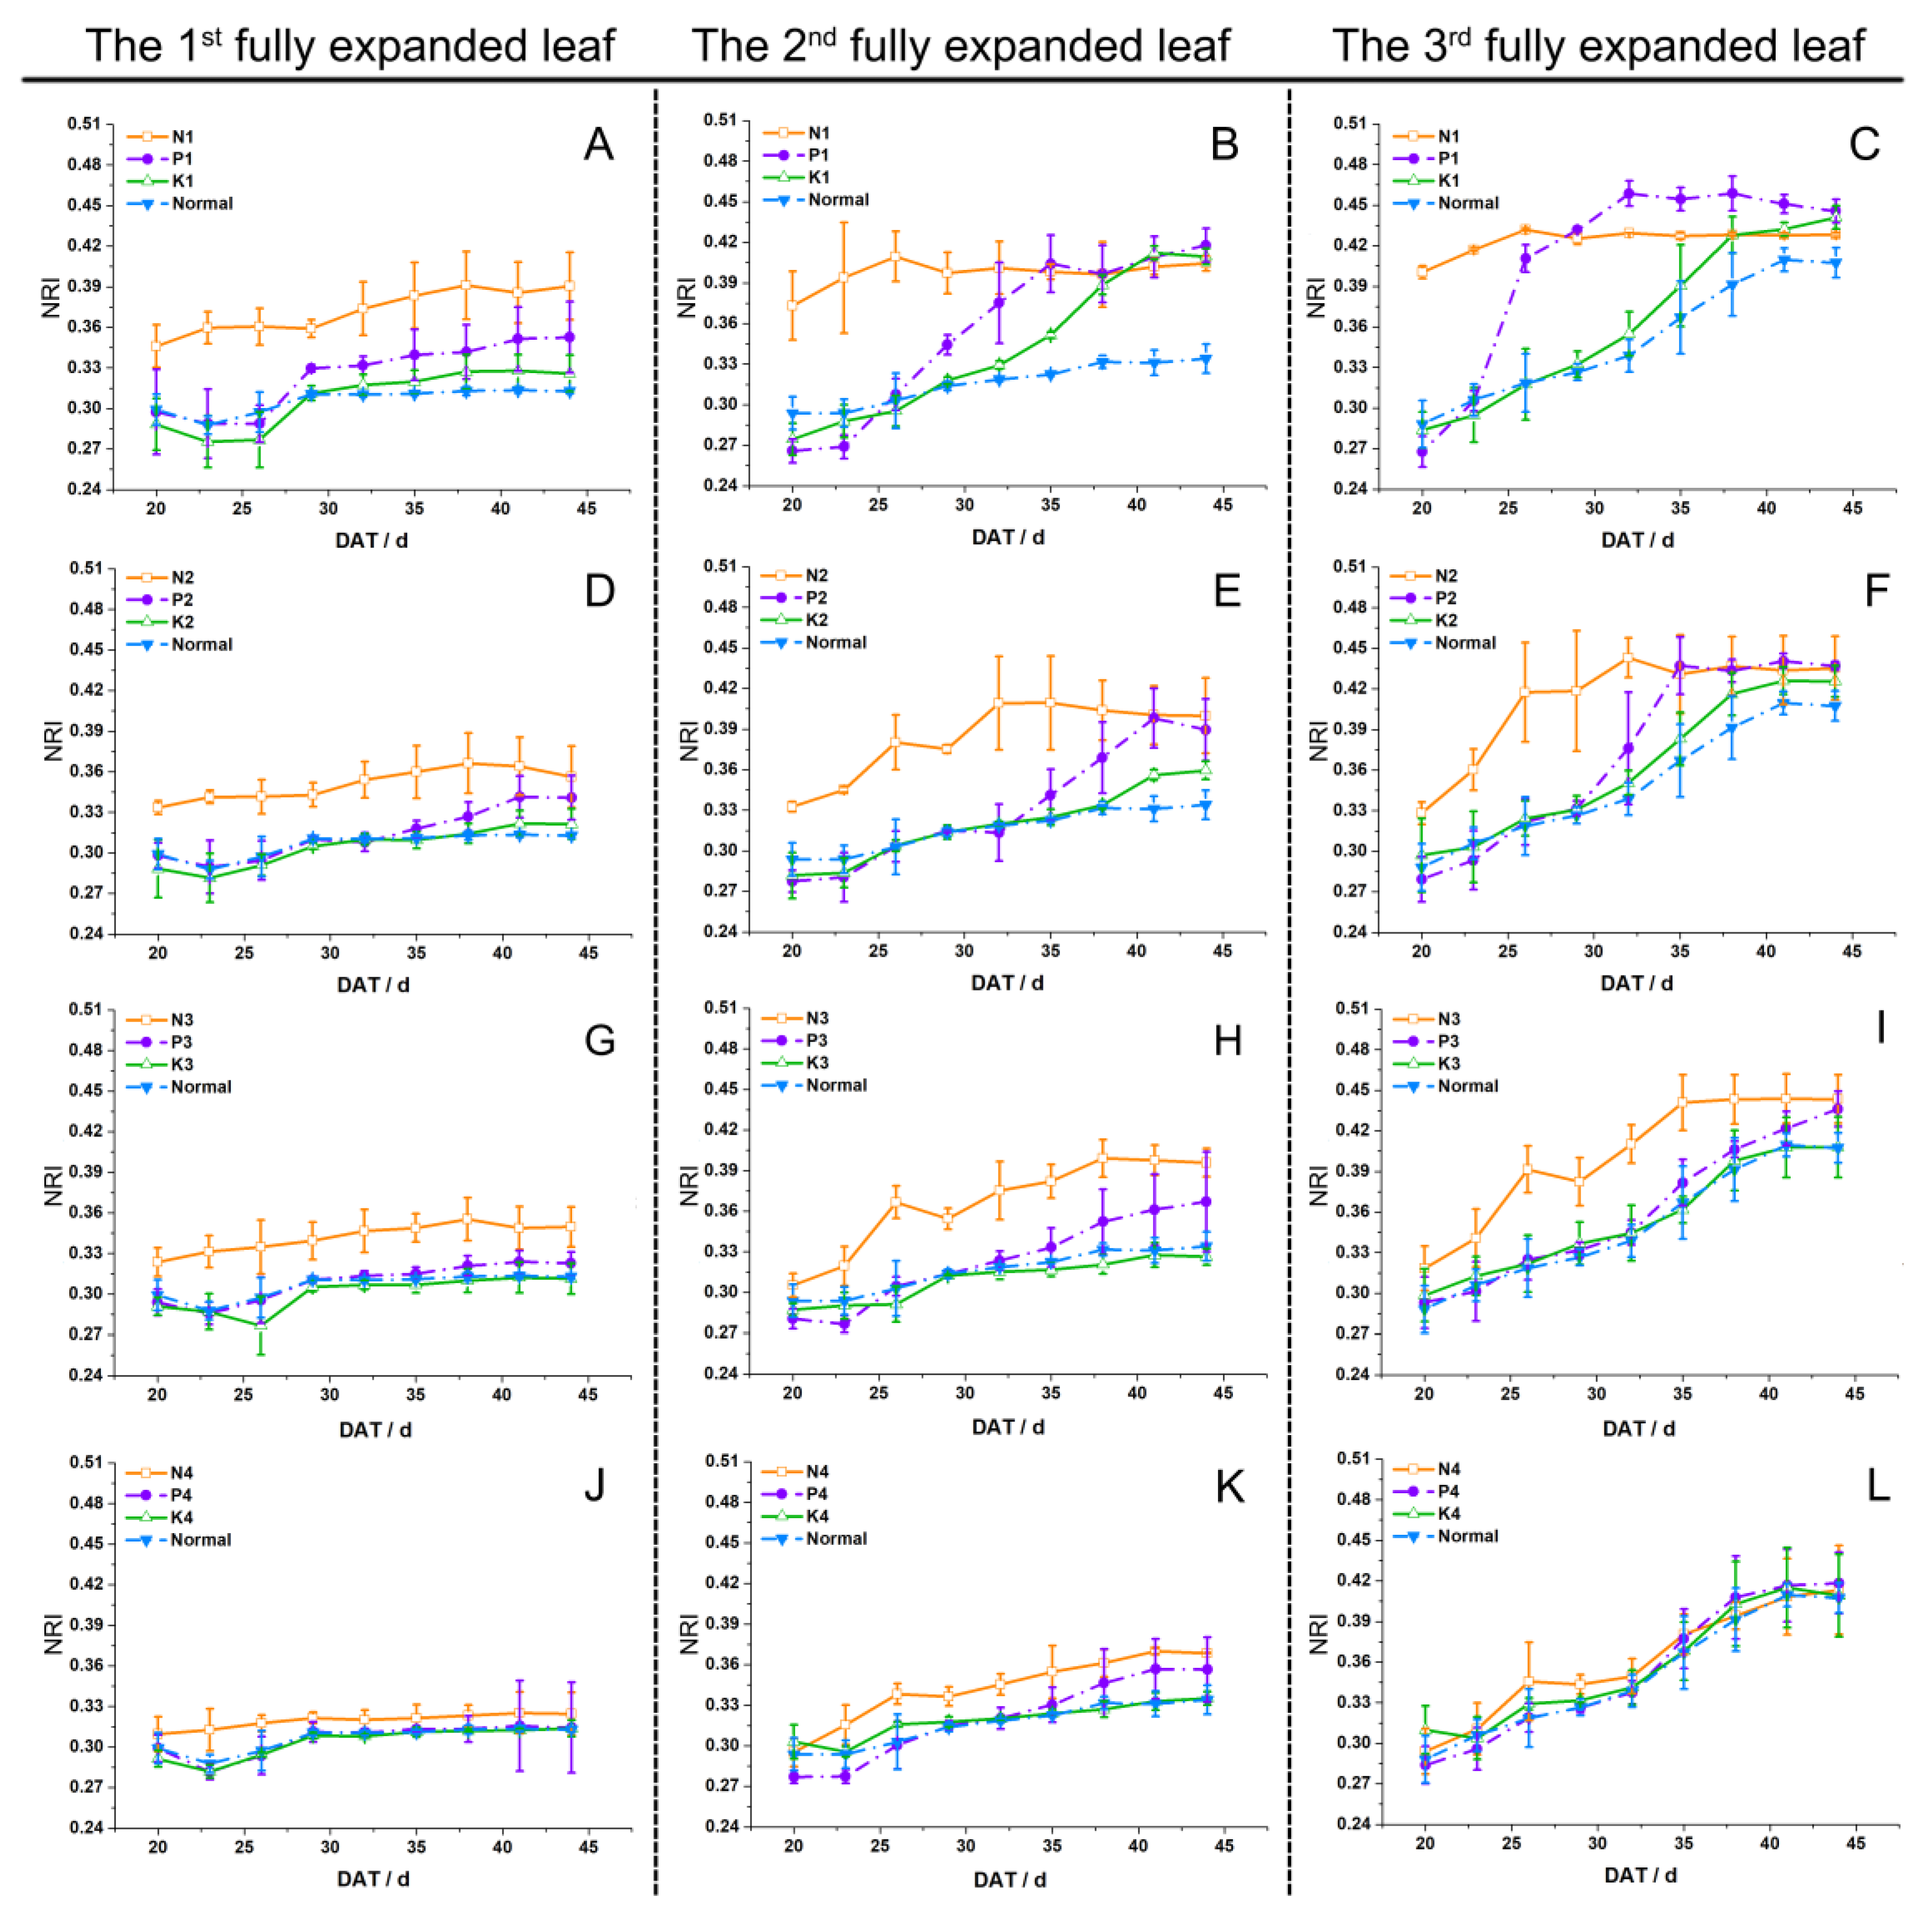
3.1. Leaf Responses of the First Incomplete Leaf and Fully Expanded Leaf to NPK Deficiencies

The first incomplete leaf: As shown in Figure 2, the changing process of leaf area could be divided into two stages: leaf area increased at the first stage and remained the steady value at the second stage. At the first stage (extension stage), it took approximately 10 days to reach the peak of leaf area, and the first six days is the vigorous growth phase. In the second stage, the rice leaf fully expanded, and no obvious changes were observed in the leaf area.
Obviously, compared to NPK deficiency, leaves with normal nutrition supply expanded faster and ended with a larger leaf area. When exposed to nutrition stress, clear differentiation in leaf extension rates can be observed among NPK treatments, and this differentiation differed with the level of nutrition deficiency. With extreme and severe levels of deficiency (Figure 2A,B), the leaf extension rates were similar in the N and P treatments, which were also smaller than in the K treatment. With a moderate level of nutrition deficiency (Figure 2C), the leaf extension rate of the P treatment was close to that of the K treatment, and both were larger than that of the N treatment. Furthermore, when exposed to a mild level of nutrition deficiency (Figure 2D), there was no significant difference in the extension rate between NPK treatments. Across the four levels of nutrition deficiencies, the differentiation in extension rates among the four treatments decreased with increasing nutrition supplies.
The fully expanded leaves: As shown in Figure 3, an overall increasing trend of NRI was observed in all treatments and was maintained at a steady value (terminal point) when the rice leaf became fully withered. Apparently, color variation in the third fully expanded leaf was the most significant, and it was the earliest to reach the “terminal point,” followed by the second and first fully expanded leaf, respectively. Meanwhile, across the four levels of nutrition deficiencies, leaves with lower nutrition supplies produced faster NRI increasing rates and reached the “terminal point” earlier than leaves with higher nutrition supplies.
In addition, clear differentiations in color variations can also be observed among the four treatments. It can be seen that the NRI value of NPK treatments increased faster and arrived at the “terminal point” earlier than that of normal treatment. For NPK treatments, leaves in the N treatment produced a higher NRI value and reached the “terminal point” earlier than those in the P and K treatments. Moreover, the NRI of P and K treatments displayed broadly similar variations in the initial period but increased with different rates in the later period: leaves with P deficiency showed faster increasing rates and reached the “terminal point” earlier than those with K deficiency. Overall, the differences between the four treatments in NRI variations decreased with the increasing nutrition supply.
In general, whether in different leaf positions or in different levels of nutrition deficiencies, the temporal dynamics of leaf characteristics differed among NPK treatments, which laid a foundation for identification. During leaf growth, obvious changes in leaf features are mainly embodied in the process of leaf extension and senescence. Across the four leaf positions, the leaf characteristics of the first incomplete leaf and the third fully expanded leaf displayed more significant variations than the first and second fully expanded leaves, which means that the first incomplete leaf and the third fully expanded leaf were the optimal leaves to reflect the dynamic nature of leaf extension and senescence, respectively. Therefore, the first incomplete leaf and the third fully expanded leaf were further applied in feature selection and the identification of NPK deficiencies.

3.2. Selection of Optimal Indices

After the quantification of dynamic characteristics according to Equation (1), differences between the four treatments could be observed in RGR value of various indices. The summary of descriptive analysis for RGR value of different indices of the first incomplete leaf, the first, second, and third fully expanded leaves were shown in Tables S1–S4 (Supplementary Materials).
Due to the large amount of indices, selection of optimal indices were needed for further analysis. As listed in Table 3, by using the SDA, only a few morphological and color indices were selected for discriminant analysis.
For the first incomplete leaf, morphological indices were mainly selected in datasets at the early stage (P1, P2, P3, P1′, and P2′), but for datasets at the late stage, they were mainly composed of color indices (P5, P6, P7, and P3′). For further exploration of effective indices, selected indices were ranked based on the number of times that the index was selected. Among all the selected indices, LA, LP, and CI outperformed the other morphological indices, and R, IKAW, and IPCA outperformed the other color indices.
Unlike the first incomplete leaf, the selected morphological indices of the third fully expanded leaf distributed dispersedly in the whole study period, and the distinctions among different treatments were mostly identified by color indices. In addition to the whole leaf feature, indices calculated from the chlorotic part (CLA, CR, CG, and CB) were repeatedly selected for discriminant analysis. According to the ranking of selected indices, R (including CR), B (including CB), NGI, NBI, and IKAW performed better in color indices, and CLA, LL, AC, and LP performed better in morphological indices.

3.3. Identification of NPK Deficiency

To determine the optimal leaf position and the corresponding diagnostic time, a comparison of diagnostic accuracy between the first incomplete leaf and the 3rd fully expanded leaf was carried out. Table 4 displays the optimal leaf position, which produced higher accuracy during the same period. The results showed that the validation accuracy of combined datasets is approximately 70–100%, which is significantly higher than that of single datasets (validation accuracy is approximately 60–80%). Moreover, the results indicated that the first incomplete leaf had higher accuracy at the beginning stage (single dataset P1 and P1′) and the final stage (single dataset P7 and combined datasets P1′–P3′), while the third fully expanded leaves performed better at the other stages.
Using the first incomplete leaf, datasets calculated with six-day intervals achieved higher accuracy than those with three-day intervals, especially the P1′ data set (calculated with a 6-day interval), which produced a validation accuracy of 71.4% on DAT26, which was significantly higher than the other contemporary data sets. In contrast, by using the third fully expanded leaf, higher accuracy can be observed in datasets calculated with three-day intervals (validation accuracy is approximately 60–90%) rather than with six-day intervals (validation accuracy is approximately 70%). In particular, the combined datasets, which were calculated by a three-day interval, generated the best validation accuracy 96.8% at DAT41.

4. Discussion

4.1. Different Influence of NPK Deficiencies on Leaf Extension and Senescence

According to plant physiology, the NPK deficiency results in plant growth inhibition and leaf chlorosis. Consequently, rice plants with NPK deficiencies exhibited a lower leaf extension rate and exhibited smaller leaf areas than those with normal nutrition supply (Figure 2). Moreover, the morphological variations in the first incomplete leaf suggest that the influence of N deficiency on leaf extension was larger than P and K deficiencies, which is in good agreement with previous studies [31]. Furthermore, the results also indicate that the extreme and severe levels of P deficiency have a larger influence on leaf extension than the same level of K deficiency, but the influence of P and K deficiencies are not discriminating under moderate or mild level of deficiency. Overall, N deficiency has the biggest effect on leaf extension followed by P and K deficiencies.
In addition to the morphological dynamics, the color variations in the third fully expanded leaf also reveal the distinct influence of NPK deficiencies. As reported in previous studies, there is a negative correlation between NRI and nitrogen content, which means that the greener leaf produces the lower NRI [6,23]. Accordingly, with the development of leaf wilt, rice leaves gradually lose green, and the NRI increased with time. It is known that leaf chlorosis caused by NPK deficiencies accelerates the process of leaf senescence [32]. Therefore, leaf color of NPK treatments reach the “terminal point” earlier than that of normal treatment. Besides, distinct color variations among NPK treatments also indicate that leaf chlorosis results from NPK deficiencies have different influences on leaf senescence. The bigger the influence, the faster the leaf senescence. In this sense, the influence of NPK deficiencies on leaf senescence from large to small in proper order are N deficiencies, P deficiencies, and K deficiencies, respectively, which is consistent with the conclusion drawn from morphology dynamics.

4.2. Quantification Method of Dynamic Indices

To our knowledge, leaf characteristics at a certain time, which we call the “absolute value” in this paper, were the main focus in current studies. For instance, leaf characteristics at tillering stage, jointing stage, and booting stage are widely used in nutrition diagnosis [4,24,33]. However, the “absolute value” cannot properly reflect the dynamic nature of rice leaves. To apply the dynamic nature of leaf extension and senescence in the discrimination of NPK deficiency, “relative value,” which refers to changing rate, is needed to quantify dynamic changes in leaf morphology and color. Studies conducted by Neilson et al. [16] and Poire et al. [17] demonstrated plant phenotypic responses to different nutrition supplies by calculating the RGR of leaf area, clear differentiation in RGR between different treatments were revealed in the result, which provided further evidence for the feasibility of applying RGR in nutrition diagnosis. Moreover, Poire et al. [17] further calculated the RGR at the early stage and late stage and found that the difference between early and late RGR increased with increasing nutrition supply. These results provide a valuable reference for further identification of different levels of nutrition deficiency.

4.3. Effectiveness of the Dynamic Nature of Different Leaf Positions in Identification

According to plant nutrition science, different leaf morphology could be observed in rice leaves when exposed to NPK deficiencies. Rice plant with P deficiency produces narrower leaves when compare to that with N and K deficiencies, and plant with K deficiency produces bigger leaves than with N deficiency (Figure 2). Accordingly, during the leaf extension, dynamic indices calculated from leaf morphology such as LL, LW, LA, and LP are selected into discriminant analysis and effectively identified NPK deficiency. Likewise, a plant with N deficiency presents light green leaves, with P deficiency shows dark green leaves, and with K deficiency the leaves present scorched margin. In this sense, distinct color variations could be observed among the NPK treatments during leaf growth. Consequently, color indices such as NRI, NGI, R, and IKAW are selected into discriminant analysis to identify NPK deficiency.
As mentioned before, the dynamic nature of the first incomplete leaf is mainly embodied in the extension process (early stage), and for the third fully expanded, the dynamic nature is mainly reflected in the senescence stage (late stage). Consequently, the first incomplete leaf performs better at the beginning stage, and the 3rd fully expanded leaf generates higher accuracy at later stages. Moreover, it also implies that the mechanisms of using the first incomplete leaf and the third fully expanded leaf in identification are different; thus, the optimal indices differ between these two leaves. For the first incomplete leaf, obvious variations in morphology and color can be observed during the extension process. Therefore, for identification based on the dynamic nature of leaf extension, the morphological and color indices would be ideal indicators. Unlike the first incomplete leaf, morphological indices of the 3rd fully expanded leaf, which were selected for discriminant analysis, were sporadically distributed at different stages. This finding implies that the performance of morphological indices is not steady. Accordingly, for identification based on the dynamic nature of senescence, color indices would be ideal indicators. In addition, the results also showed that dynamic indices calculated from the chlorotic part (CLA, CR, CG, and CB) took an important place in feature selection of the 3rd fully expanded leaf (Table 3), which means exploring the dynamic nature of leaf chlorosis contributes to the improvement of the diagnostic effect.
In previous studies, the third fully expanded leaf has been considered as the ideal indicator of plant nutrition status [9,14], but incomplete leaves have seldom been used in nutrition diagnosis because of the instability of leaf features. In this paper, the dynamic characteristics of these two leaves are applied in the identification of NPK deficiencies and produce satisfactory identification effects. By using the first incomplete leaf in identification, the P1’ dataset produced a validation accuracy above 70% at DAT26, which was earlier than previous studies [22,33,34]. Although this accuracy is not as high as that of previous studies, it demonstrates the feasibility of early diagnosis by using dynamic characteristics, providing valuable reference for the improvement of diagnostic effect. In addition, the diagnostic results also indicated that the dataset calculated at six-day intervals achieved higher accuracy than at three-day intervals. Therefore, for identification based on the dynamic nature of leaf extension, a longer time interval in quantification would be more effective. In contrast, by using the third fully expanded leaf, datasets calculated at three-days intervals achieved better results, especially the combined datasets. This means that short intervals in quantification are more effective for identification based on the dynamic nature of leaf senescence.

4.4. Future Work

In this paper, we identified the NPK deficiency by dynamic characteristics of rice leaf that made a foundation for the further nutrition diagnosis. According to previous studies [4,24], the relationship between leaf features and plant nutrition content could help in fertilization management. Therefore, we will establish the diagnostic model by exploring the relationship between the dynamic characteristics and plant nutrition content in the further work, thus helping field management.
Besides, there are lots of factors that affect rice growth in the field, such as water content, nutrition content, and temperature. Exploring the mechanism of plant responses to different environmental stress by dynamic analysis could help us to identify characteristic symptoms and understand the dynamic nature of plant growth and the mechanism of adaptation to various stress. Based on the exploration of the effects of single stress, we could further identify the nutrition deficiency when plants expose to multiple stress.
In addition, the dynamic nature of leaf extension and senescence are the mainly focus in this paper, hence we applied the first incomplete leaf and the third fully expand leaf in identification. To some extent, the other fully expanded leaves such as the first and second fully expanded leaves also embodied the distinctions between the four treatments (Figure 3), which could be useful for the identification. In this sense, further exploration on the dynamic nature of fully expanded leaves would be our next work, thus helping us to identify sensitive characteristics to improve our diagnostic effect.
Moreover, since the plant status changed during the day, the capture of plant information at different times would be distinct. Therefore, in the following work, sampling at a fixed time such as the 10:00–14:00 every day would contribute to the punctual measurement.

5. Conclusions

In this paper, from dynamic analysis to identification of NPK deficiencies, distinct leaf responses to NPK deficiencies have been uncovered in the incomplete leaf and fully expanded leaves, and the effectiveness of dynamic characteristics for identification have been examined at different growth stages. The main conclusions drawn from this study are as follows:
(i) NPK deficiencies have different influences on leaf extension and senescence. Temporal dynamics of leaf morphology and color in the first incomplete leaf and the fully expanded leaves collectively indicated that N deficiency had the biggest influence on leaf extension and senescence, followed by P and K deficiency.
(ii) The optimal indices for identification varied between the first incomplete leaf and the 3rd fully expanded leaf. By using the first incomplete leaf, both the morphological and color indices can be ideal indicators for identification. However, for the third fully expanded leaf, effective indices are mainly extracted from color characteristics.
(iii) The performance of the first incomplete leaf and the third fully expanded leaf in identification differed with time. The first incomplete leaf performed better at the leaf extension stage, which contributes to improving the effect of early diagnosis, and the third fully expanded leaf performed better at the leaf chlorosis stage.
Generally, dynamic analysis provides new thoughts and methods for nutrition diagnosis to improve the diagnostic effect, which contributes to environmental protection and agricultural sustainability.

Supplementary Materials

The following are available online at https://www.mdpi.com/2071-1050/10/3/762/s1, Table S1. Summary of descriptive analysis for relative growth rate (RGR) of different indices in the first incomplete leaf; Table S2. Summary of descriptive analysis for RGR of different indices in the first fully expanded leaf; Table S3. Summary of descriptive analysis for RGR of different indices in the second fully expanded leaf; Table S4. Summary of descriptive analysis for RGR of different indices in the third fully expanded leaf.

Acknowledgments

This study was financed by grants from the National Natural Science Foundation of China (Grant No.31172023) and the Zhejiang Postdoctoral Sustentation Fund of China (Grant No. BSH1502132).

Author Contributions

This manuscript is approved by all authors for publication. Yuanyuan Sun, Ke Wang, and Lisu Chen conceived of and designed the experiments; Cheng Tong and Shan He made contribution to the data acquisition and analysis; Yuanyuan Sun wrote the paper; Ke Wang and Lisu Chen helped to revised it.

Conflicts of Interest

No conflict of interest exits in the submission of this manuscript.

References

  1. Liu, Y.; Qiang, L.; He, S.; Yi, S.; Liu, X. Prediction of nitrogen and phosphorus contents incitrus leavesbased on hyperspectral imaging. Int. J. Agric. Biol. Eng. 2015, 8, 80–88. [Google Scholar]
  2. Rapaport, T.; Hochberg, U.; Shoshany, M.; Karnieli, A.; Rachmilevitch, S. Combining leaf physiology, hyperspectral imaging and partial least squares-regression (PLS-R) for grapevine water status assessment. ISPRS J. Photogramm. Remote Sens. 2015, 109, 88–97. [Google Scholar] [CrossRef]
  3. Xu, S.; He, J.; Ma, Y.; Liang, H.; Liu, G.; He, X. Research Progress of Hyperspectral Imaging Technology for Nondestructive Detection of Fruit Qualit. Food Res. Dev. 2013, 34, 4–8. [Google Scholar]
  4. Wang, Y.; Wang, D.; Shi, P.; Omasa, K. Estimating rice chlorophyll content and leaf nitrogen concentration with a digital still color camera under natural light. Plant Methods 2014, 10, 36–46. [Google Scholar] [CrossRef] [PubMed]
  5. Wang, Y.; Wang, D.; Zhang, G.; Wang, J. Estimating nitrogen status of rice using the image segmentation of G-R thresholding method. Field Crop. Res. 2013, 149, 33–39. [Google Scholar] [CrossRef]
  6. Wang, Y.; Wang, D.; Zhang, G.; Wang, C. Digital camera-based image segmentation of rice canopy and diagnosis of nitrogen nutrition. Trans. Chin. Soc. Agric. Eng. 2012, 28, 131–136. (In Chinese) [Google Scholar]
  7. Sakamoto, T.; Shibayama, M.; Kimura, A.; Takada, E. Assessment of digital camera-derived vegetation indices in quantitative monitoring of seasonal rice growth. ISPRS J. Photogramm. Remote Sens. 2011, 66, 872–882. [Google Scholar] [CrossRef]
  8. Chen, L.; Lin, L.; Cai, G.; Sun, Y.; Huang, T.; Wang, K.; Deng, J. Identification of Nitrogen, Phosphorus, and Potassium Deficiencies in Rice Based on Static Scanning Technology and Hierarchical Identification Method. PLoS ONE 2014, 9, e11320011. [Google Scholar] [CrossRef] [PubMed]
  9. Chen, L.; Wang, K. Diagnosing of rice nitrogen stress based on static scanning technology and image information extraction. J. Soil Sci. Plant Nutr. 2014, 14, 382–393. [Google Scholar] [CrossRef]
  10. Li, Y.; Chen, D.; Walker, C.; Angus, J. Estimating the nitrogen status of crops using a digital camera. Field Crop. Res. 2010, 118, 221–227. [Google Scholar] [CrossRef]
  11. Wang, Y.; Wang, D.; Zhang, G. Nitrogen Status Diagnosis of Rice Based on a Digital Camera. Chin. Agric. Sci. Bull. 2012, 28, 111–117. (In Chinese) [Google Scholar]
  12. Saberioon, M.; Amin, M.; Aimrun, W.; Gholizadeh, A.; Rahim Anuar, A. Assessment of colour indices derived from conventional digital camera for determining nitrogen status in rice plants. J. Food. Agric. Environ. 2013, 11, 655–662. [Google Scholar]
  13. Shi, Y. Rice Nutrition Diagnosis and Modeling Based on Digital Image. Doctoral Dissertation, Zhejiang University, Hangzhou, China, 2011. (In Chinese). [Google Scholar]
  14. Chen, L. Rice Nutrition Identification and Diagnosis Based on Machine Vision Technology. Doctoral Dissertation, Zhejiang University, Hangzhou, China, 2014. (In Chinese). [Google Scholar]
  15. Qi, W.; Wang, C.; Guo, X. Study on plant behavior perception based on computer vision: A review. Jiangsu Agric. Sci. 2017, 45, 20–26. (In Chinese) [Google Scholar]
  16. Neilson, E.; Edwards, A.; Blomstedt, C.; Berger, B.; Moller, B.; Gleadow, R. Utilization of a high-throughput shoot imaging system to examine the dynamic phenotypic responses of a C4 cereal crop plant to nitrogen and water deficiency over time. J. Exp. Bot. 2015, 66, 1817–1832. [Google Scholar] [CrossRef] [PubMed]
  17. Poiré, R.; Chochois, V.; Sirault, X.; Vogel, J.; Watt, M. Digital imaging approaches for phenotyping whole plant nitrogen and phosphorus response in Brachypodium distachyon. J. Integr. Plant. Biol. 2014, 56, 781–796. [Google Scholar] [CrossRef] [PubMed]
  18. Tackenberg, O. A new method for non-destructive measurement of biomass, growth rates, vertical biomass distribution and dry matter content based on digital image analysis. Ann. Bot. 2007, 99, 777–783. [Google Scholar] [CrossRef] [PubMed]
  19. Humplík, J.; Lazár, D.; Husičková, A.; Spíchal, L. Automated phenotyping of plant shoots using imaging methods for analysis of plant stress responses—A review. Plant Methods 2015, 11, 29. [Google Scholar] [CrossRef] [PubMed]
  20. Zhang, Y.; Tang, L.; Liu, X.; Liu, L.; Cao, W.; Zhu, Y. Modeling Dynamics of Leaf Color Based on RGB Value in Rice. J. Intergr. Agric. 2014, 13, 749–759. [Google Scholar]
  21. Qin, G.; Jinson, D.; Cha, L.; Yuanyuan, S.; Ke, W.; Zhang, S. Diagnosis of Rice Nitrogen Nutrition Based on Spectral and Shape Characteristics of Scanning Leaves. Trans. Chin. Soc. Agric. Mach. 2012, 43, 170–174. (In Chinese) [Google Scholar]
  22. Saberioon, M.; Amin, M.; Anuar, A.; Gholizadeh, A.; Wayayok, A.; Khairunniza-Bejo, S. Assessment of rice leaf chlorophyll content using visible bands at different growth stages at both the leaf and canopy scale. Int. J. Appl. Earth Obs. Geoinf. 2014, 32, 35–45. [Google Scholar] [CrossRef]
  23. Li, L.; Zhang, M.; Ren, T.; Li, X.; Cong, R.; Wu, L.; Lu, J. Diagnosis of N nutrition of rice using digital image processing technique. J. Plant Nutr. Fertil. 2015, 21, 259–268. (In Chinese) [Google Scholar]
  24. Chen, J.; Yao, X.; Huang, F.; Liu, Y.; Yu, Q.; Wang, N.; Xu, H.; Zhu, Y. N status monitoring model in winter wheat based on image processing. Trans. Chin. Soc. Agric. Eng. 2016, 32, 163–170. (In Chinese) [Google Scholar]
  25. Gonzalez, R.; Woods, R. Digital Image Processing Using MATLAB, 2nd ed.; Pearson Education North Asia Limited: Hong Kong, China, 2002. [Google Scholar]
  26. Harbur, M.; Owen, M. Light and growth rate effects on crop and weed responses to nitrogen. Weed Sci. 2004, 52, 578–583. [Google Scholar] [CrossRef]
  27. Hunt, R. Plant Growth Curves: The Functional Approach to Plant Growth Analysis; Edward Arnold: London, UK, 1982. [Google Scholar]
  28. Xiong, X.; Yu, L.; Yang, W.; Liu, M.; Jiang, N.; Wu, D.; Chen, G.; Xiong, L.; Liu, K.; Liu, Q. A high-throughput stereo-imaging system for quantifying rape leaf traits during the seedling stage. Plant Methods 2017, 13, 7. [Google Scholar] [CrossRef] [PubMed]
  29. Xu, Y.; Yang, J.; Lu, J.; Yu, D. An efficient renovation on kernel Fisher discriminant analysis and face recognition experiments. Pattern Recognit. 2004, 37, 2091–2094. [Google Scholar] [CrossRef]
  30. Na, W.; Ke, W.; Xie, R.; Lai, J.; Ming, B.; Li, S. Maize Leaf Disease Identification Based on Fisher Discrimination Analysis. Sci. Agric. Sin. 2009, 42, 3836–3842. (In Chinese) [Google Scholar]
  31. Ingestad, T. Nitrogen Stress in Birch Seedlings. Physiol. Plant 1979, 45, 149–157. [Google Scholar] [CrossRef]
  32. Mengel, K.; Kirkby, E. Principles of Plant Nutrition; The International Potash Institute (IPI): Bern, Switzerland, 1987. [Google Scholar]
  33. Du, L.; Gong, W.; Shi, S.; Yang, J.; Sun, J.; Zhu, B.; Song, S. Estimation of rice leaf nitrogen contents based on hyperspectral LIDAR. Int. J. Appl. Earth Obs. 2016, 44, 136–143. [Google Scholar] [CrossRef]
  34. Inoue, Y.; Sakaiya, E.; Zhu, Y.; Takahashi, W. Diagnostic mapping of canopy nitrogen content in rice based on hyperspectral measurements. Remote Sens. Environ. 2012, 126, 210–221. [Google Scholar] [CrossRef]
Figure 1. Segmentation of chlorotic part in rice leaf. ROI: region of interest. RGB image mean an image that contains red, green, and blue color channels.
Sustainability 10 00762 g001
Figure 2. Temporal dynamics of leaf area in the first incomplete leaf. (A) (N1, P1, and K1) represents the extreme level of nitrogen, phosphorus, and potassium (NPK) deficiency treatments; (B) (N2, P2, and K2) represents the severe level of NPK deficiency treatments; (C) (N3, P3, and K3) represents the moderate level of NPK deficiency treatments; (D) (N4, P4, and K4) represents the mild level of NPK deficiency treatments; Normal represents the normal nutrition supplement treatment. DAT represents days after transplantation and “d” means days. In (AC), the leaf area of the four treatments showed significant difference (p < 0.05); in D, the difference in leaf area between the four treatments were not significant (p > 0.05). Statistical comparison was performed using one-way ANOVA (analysis of variance).
Sustainability 10 00762 g002
Figure 3. Color responses of different fully expanded leaves to four levels of NPK deficiencies. (AC) which contained N1, P1, and K1 represent extreme levels of nutrition deficiencies, DEF, which contained N2, P2, and K2 represent severe levels of nutrition deficiency, GHI, which contained N3, P3, and K3 represent moderate levels of nutrition deficiency, and JKL, which contained N4, P4, and K4 represent mild levels of nutrition deficiency. Normal represents the normal nutrition supplement treatment. DAT represents days after transplantation, and “d” means days. In (AE,GI), the normalized red index (NRI) of the four treatments showed significant difference during the study period (p < 0.05); in (F,K), the NRI of the four treatments also showed significant difference at the study period (p < 0.05) except for two sampling times (p > 0.05); in (J,L), the difference in NRI between the four treatments were not significant (p > 0.05). Statistical comparison was performed using one-way ANOVA (analysis of variance).
Sustainability 10 00762 g003
Table 1. Indices calculated from different leaf characteristics.
Category IndexFormula
Morphological indicesLeaf width (LW)
Leaf length (LL)
Leaf area (LA or CLA)
Leaf perimeter (LP)
Eccentricity (EC)Eccentricity = AxisLengthlong/AxisLengthshort
Rectangularity (RE)Rectangularity = Areaobject/Areabounding-box
Area convexity (AC)Area convexity = Area/Convex Area
Circularity (CI)Circularity = Rinscribedcircle/Rexcircle
Form factor (FF)Form fact = Perimeter/(4*√Area)
Color indicesRed (R or CR)
Green (G or CG)
Blue (B or CB)
Hue (H)
Saturability (S)
Brightness (BR)Bightness = 0.3*R + 0.6*G + 0.1*B
Normalized red index (NRI)NRI = R/(R + G + B)
Normalized green index (NGI)NGI = G/(R + G + B)
Normalized blue index (NBI)NBI = B/(R + G + B)
Dark green color index (DGCI)DGCI = {(Hue − 60)/60 + (1−Saturation) + (1 − Brightness)}/3
Green-red vegetation index (GRVI)GRVI = (G − R)/(G+R)
Kawashima index (IKAW)IKAW = (R − B)/(R + B)
Principal component analysis index (IPCA)IPCA = 0.994*|R − B|+0.961*|G − B| + 0.914*|G − R|
Note: CLA: leaf area of the chlorotic part; CR: red value of chlorotic part; CG: green value of chlorotic part; CB: blue value of chlorotic part.
Table 2. The combination method of data sets for identification.
CategoryDAT3 Days Interval DatasetDAT6 Days Interval Dataset
Single dataset20–23P120–26P1′
23–26P2
26–29P326–32P2′
29–32P4
32–35P532–38P3′
35–38P6
38–41P7————
Combined dataset20–26P1. P220–32P1′. P2′
20–29P1. P2. P3 (P1–P3)
20–32P1. P2. P3. P4 (P1–P4)
20–35P1. P2. P3. P4. P5 (P1–P5)20–38P1′. P2′. P3′ (P1′–P3′)
20–38P1. P2. P3. P4. P5. P6 (P1–P6)
20–41P1. P2. P3. P4. P5. P6. P7 (P1–P7)————
Note: DAT: days after transplantation, P1 represents data set calculated with three-day intervals from DAT20 to DAT23, by that analogy, we calculated P2 to P7 data sets; P1′ represents data set calculated with 6-day intervals from DAT20 to DAT26, by that analogy, we calculated P2′ and P3′ data sets.
Table 3. Indices that were selected by stepwise discrimination analysis.
Leaf PositionTime IntervalData SetSelected Indices (RGR)
The first incomplete leaf3 days intervalP1LP, R, LL, AC, EC, CI, S, IKAW
P2NRI, NBI, LW, CI, IKAW
P3LA, R, NRI, H
P4LA, GRVI
P5IPCA, IKAW, G, S
P6GRVI, DGCI
P7NRI, NGI, NBI, IKAW
6 days intervalP1′LA, G, B, NGI, DGCI, GRVI, IKAW, IPCA
P2′LP, R, FF, IKAW, IPCA
P3′R, NGI, NBI, CI, BR, H, IKAW, IPCA
The 3rd fully expanded leaf3 days intervalP1CLA, LP
P2LA, R, B, NGI, NBI, AC, RE, S, GRVI, IPCA
P3B, NRI, NGI, NBI, BR, IKAW, CR, CB
P4LP, R, B, NRI, LL, BR, H, GRVI, IPCA, CR, CB
P5G, NGI, NBI, IKAW
P6R, G, NRI, NGI, NBI, H, DGCI, GRVI, IKAW, IPCA, CB
P7H, CLA
6 days intervalP1′CLA, CG, NGI
P2′NRI, NGI, NBI, LL, GRVI, IKAW
P3′NGI, NBI, CB, CR, IKAW, IPCA, H, S, AC
Note: RGR: relative growth rate. The meaning of all the selected indices could be found in Table 1. P1 represents data set calculated with 3-day intervals from DAT20 to DAT23, by that analogy, we calculated P2 to P7 data sets. P1′ represents data set calculated with 6-day intervals from DAT20 to DAT26, by that analogy, we calculated P2′ and P3′ data sets.
Table 4. The optimal leaf position and corresponding diagnostic accuracy at each stage.
Category Time IntervalData SetOptimal LeafTraining (%)Validation (%)
Single dataset3 daysP1the first incomplete leaf67.259.7
P2the 3rd fully expanded leaf64.260.8
P3the 3rd fully expanded leaf74.271.7
P4the 3rd fully expanded leaf83.379.6
P5the 3rd fully expanded leaf69.257.1
P6the 3rd fully expanded leaf75.065.6
P7the first incomplete leaf69.963.0
6 daysP1′the first incomplete leaf73.771.4
P2′the 3rd fully expanded leaf73.269.6
P3′the 3rd fully expanded leaf80.269.1
Combined dataset3 daysP1. P2the 3rd fully expanded leaf77.568.3
P1–P3the 3rd fully expanded leaf81.777.5
P1–P4the 3rd fully expanded leaf92.688.9
P1–P5the 3rd fully expanded leaf95.192.6
P1–P6the 3rd fully expanded leaf85.992.2
P1–P7the 3rd fully expanded leaf96.896.8
6 daysP1′. P2′the 3rd fully expanded leaf83.276.8
P1′–P3′the first incomplete leaf88.583.2
Note: P1 represents data set calculated with three-day intervals from DAT20 to DAT23, by that analogy, we calculated P2 to P7 data sets. P1′ represents data set calculated with six-day intervals from DAT20 to DAT26, by that analogy, we calculated P2′ and P3′ data sets.

