1. Introduction
Due to the population agglomeration effect of urban development, many rural people are currently immigrating into urban areas. This urbanization of the population inevitably affects the urban environment, so attention should be paid to the problems and progress related to urban areas [
1]. Overall resource depletion, energy use, water use, and waste generation are closely associated with the development of cities [
2], resulting in problems such as resource shortages, biodiversity reductions, water pollution and air pollution [
3].
Since the term “sustainable development” was popularized by the Brundtland Commission [
4], the natural environment has drawn increasing attention from governments. Sustainability is not solely concerned with the environment, but also considers economic and social dimensions [
5], and the term “development” is used descriptively as well as normatively to illustrate what occurs in the societies, environments and economies of the world [
6]. Green development is commonly traced to the rise of sustainable development, but its origins are much earlier. Initially, green development was connected to political economy and was thus tied more to the distribution of power and not environmental quality [
6]. The notion of “greening development” is evidence of a paradigm shift in development thought in which the “green” principles of “endogenous development” are as follows: (a) the social unit of a culturally defined community, whose development should be rooted in its values and institutions; (b) self-reliance, meaning that each community should primarily rely on its own strength and resources; (c) social justice; and (d) ecological balance, which implies a potential awareness of the local ecosystem and global limitations about green development [
7]. As research has been conducted, the concept of environmentally responsive development, i.e., green development, have moved from the fringes of the consciousness of a few people to being an accepted topic at professional conferences and workshops, the focus of multiple internet discussion groups, and a goal of governmental planning [
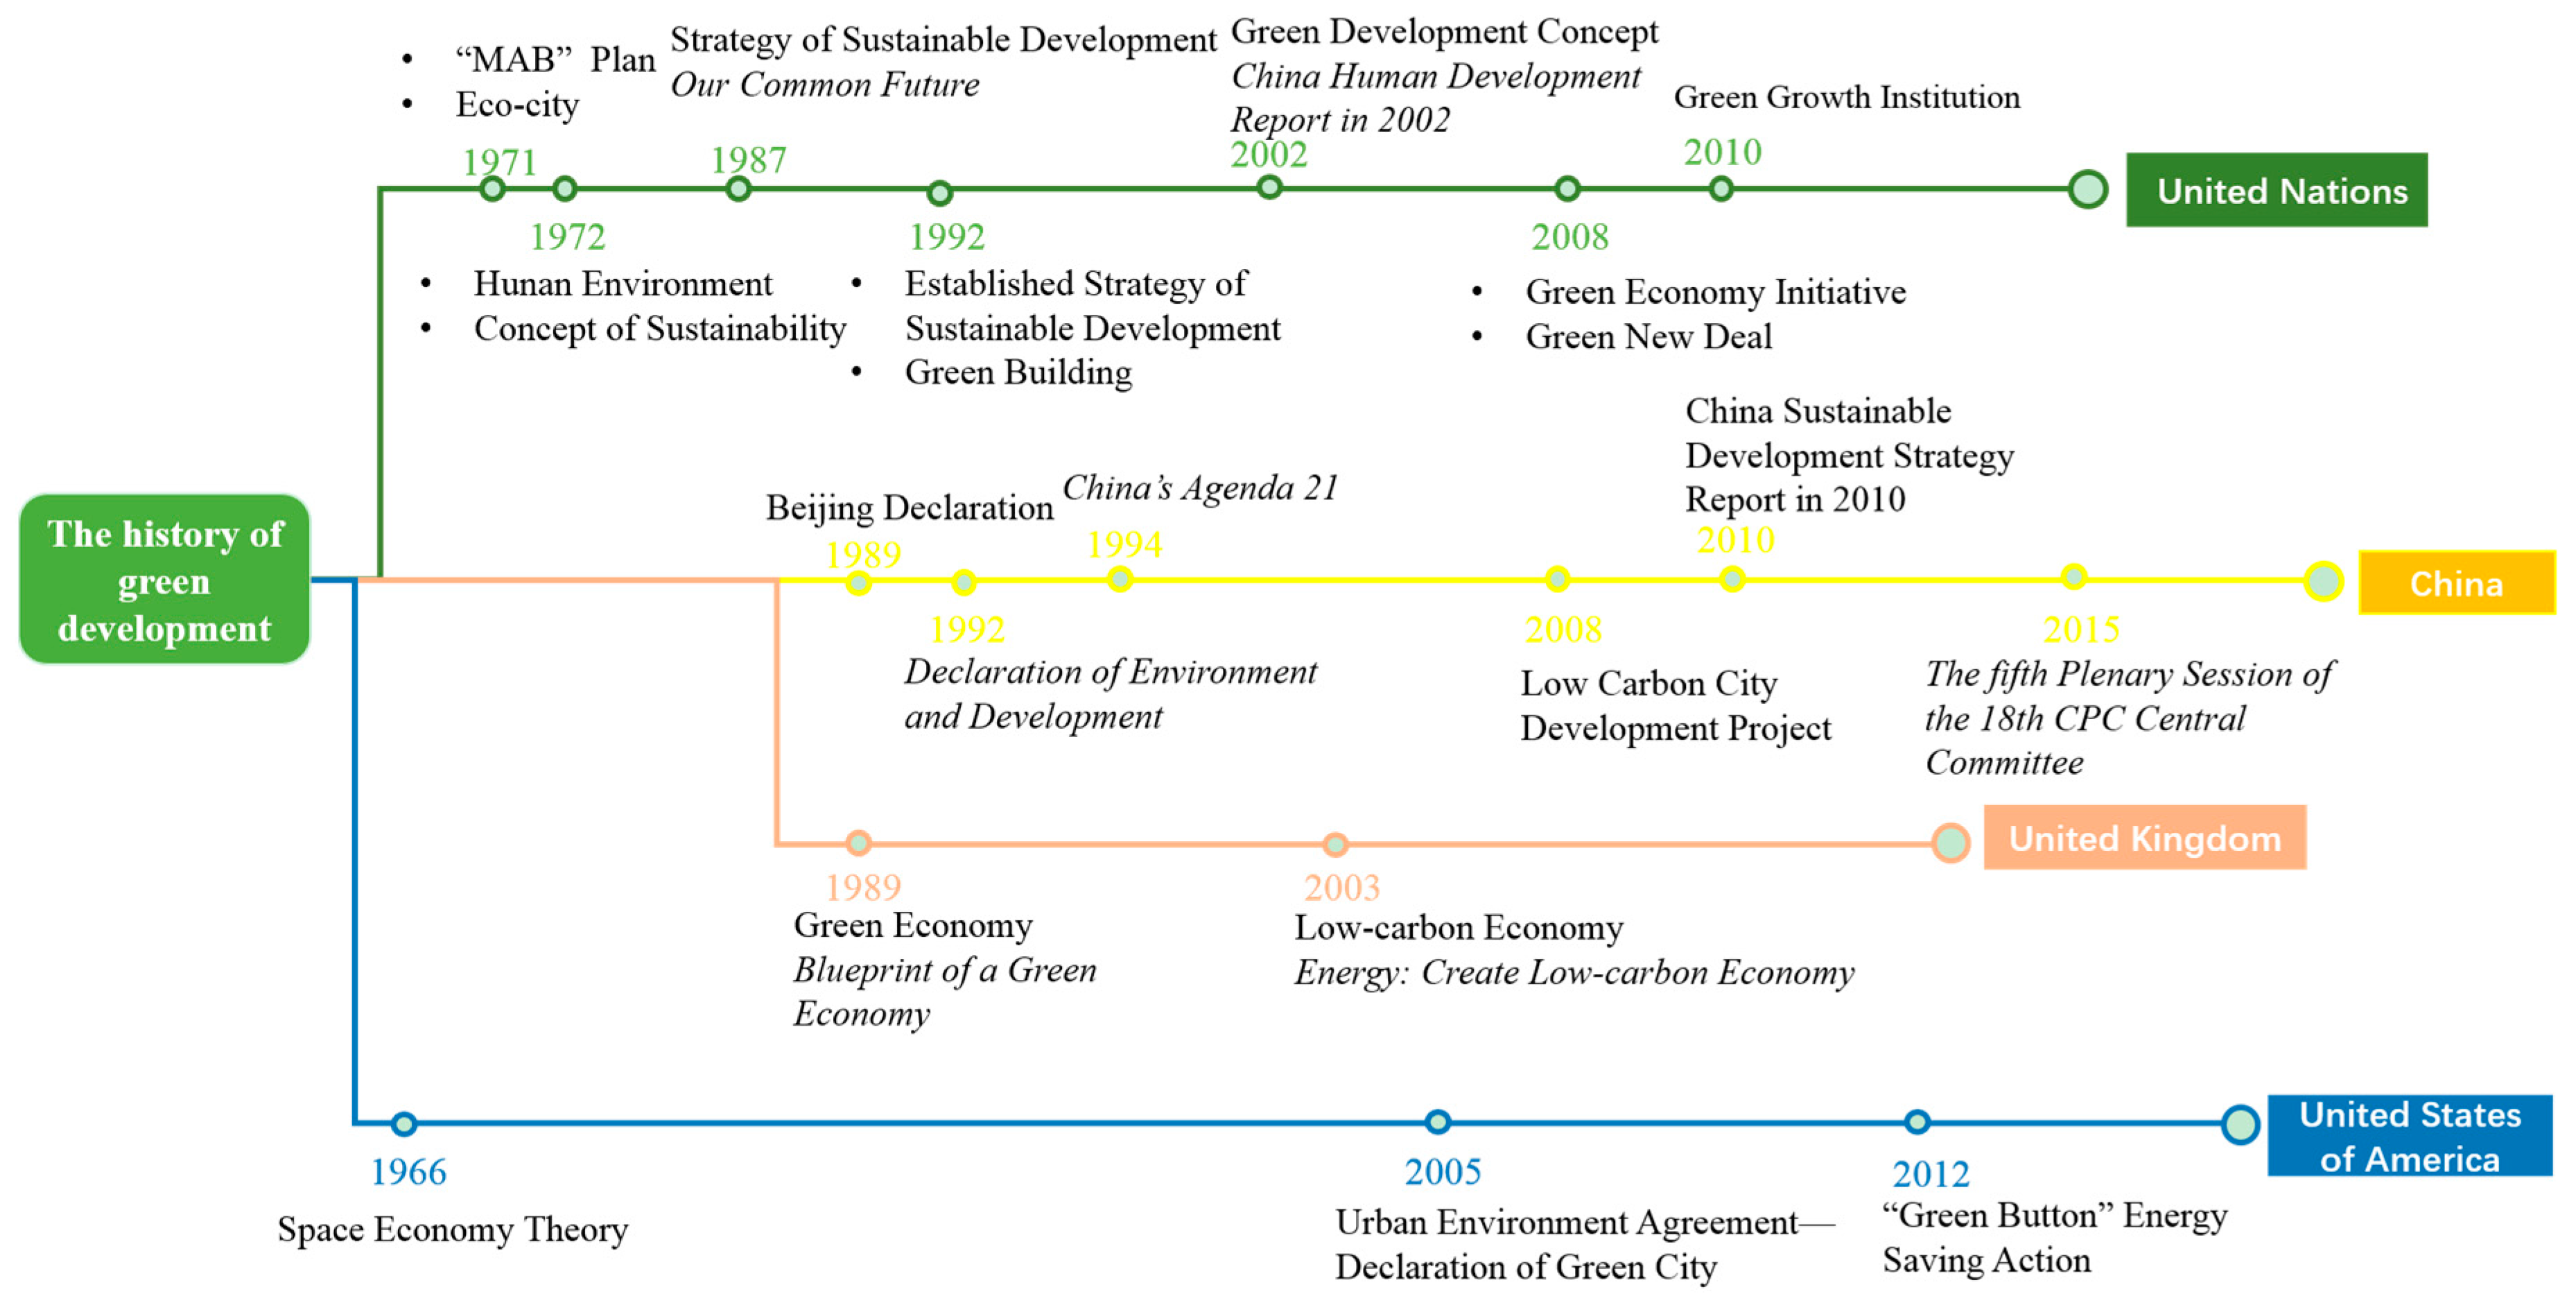
8]. It is undeniable that urban sustainable development has climbed high on the political agenda in recent decades, and the concept of green development, from which a series of related concepts has been derived, has become a popular research topic. Through the view of some relevant concept about sustainability and green development (
Figure 1), sustainable development was defined as: social and economic advance to assure human beings a healthy and productive life, but one that did not compromise the ability of future generations to meet their own needs [
9]. It can be known that sustainability was the first proposed concept to focus on the economy, resources, environment, education, equal, medical and other aspects which containing natural and humanity, both of these areas were taken the equally significance, while “green” word was burgeoning and it usually combining with economy or building, then with an emphasis on environment, the concept about green development is strengthened and extended by sustainability, which is more considering on the field of resource, environment and ecological. Therefore, Green development is an extensive concept that encompasses the urban form and the condition of social sustainability, and it also considers the balance of a social-environmental system by monitoring the development of an area. Thus, it is a mixed concept, which is enormously appealing for interdisciplinary research, that brings together many different environmental concerns under one overarching value. Green development defines a set of prevailing social concepts and clearly expresses how society values its resources, the environment, and ecology. Considering the difference of land use, lifestyle and other fields between the urban and the countryside, it’s obvious to find that the methods of green development assessment vary from region to region. In order to distinguish them explicitly, this paper focused on urban green development (UGD).
There are many relevant green development research areas that can be divided into four categories, which are as follows: the economy, the ecological environment, natural resources and energy, and social welfare. First, in the field of the economy, such as the concept of green GDP, which weights the value of nature equally in the market economy, accounting is an important system for evaluating UGD. There are currently three main green GDP accounting systems as follows: (1) the System of Integrated Environmental and Economic Accounting (SEEA), (2) the Environment and Natural Resources Accounting Project (ENRAP), and (3) the National Accounting Matrix including Environmental Accounts (NAMEA). Second, the field of ecological environment has been divided in two ways. One is to emphasize environmental impact indicators, such as environmental sustainability indices and environmental quality assessments. The Green Index was established by Bob Hall (1991) [
10], and it evaluates environmental quality through three levels of indicators (total of 256 indices) that are divided into green status indicators and green policy indicators. Another is the ecological environment category, which emphasizes representative environmental carrying capacity and ecological impact indicators. Third, the field of research into natural resources and energy is mainly focused on regional evaluation and analysis. The emergy analysis theory was developed by the American ecologist H.T. Odum (2004) [
11], and it uses the emergy conversion rate to assess the sustainability of the natural resources of an area. Fourth, many scholars studying green development evaluation focus on human happiness and social welfare. Cloutier (2013) [
12] used four indices, the Green City Index, Our Green Cities, Popular Science US City Rankings and the SustainLane US Green Rankings, to assess sustainable urban development and the happiness of the residents of many cities in US to prove that happiness and sustainable development are positively associated and that happiness may be an important component of the sustainability index value of a community.
In addition to the four main green development research areas above, many evaluation methods are used in the study of UGD. Green development or other relevant concepts have emerged due to the changing character of cities as well as the need for new conceptual and operational tools to tackle all dimensions of sustainability [
13]. Sustainable cities can be achieved by studying urban metabolism, water footprints, urban carbon, the dynamics of city growth and the interdependency of social actors, institutions, and biophysical system flows [
14]. For example, the urban metabolism concept was proposed to explain the dynamics of developing sustainable cities [
15], and in addition to assessing cities from the perspective of material flow, the perspectives of ecology, the water footprint or other ecological footprints are considered part of the spatial dimension of environmental sustainability [
16]. Based on the characterization of the system, different methods, techniques and instruments for the assessment of urban sustainability have emerged over time to help determine how cities can become more sustainable [
17]. For example, using Jining City as a case study, Li (2009) [
3] developed the Full Permutation Polygon Synthetic Indicator method by selecting 52 indicators from 4 categories, economic growth and efficiency, ecological and infrastructure construction, environmental protection, and social progress and welfare, in order to evaluate the capacity for urban sustainability. Robati (2015) [
17] defined a composite index of 10 components consisting of 16 indicators, called SUQCI, to assess the potential of a city to become sustainable, and the results showed that unsustainable urban environments are more evident in the underserved areas of a city. Cai (2009) [
18] established an assessment system with 5 subsystems (economy, society, population, resources, and the environment) and 37 indicators to evaluate sustainable urban development using a principal component analysis and then analyzed the variation among these five subsystems. Various studies implicitly emphasize the need to establish an evaluation and assessment system to pursue urban sustainability or green development. These studies describe different types of urban development assessment systems and insist that different approaches with different emphases are required for different targets.
However, it is debatable whether model cities are really as green as Liu (2009) claim [
19], so many researchers are studying how to evaluate the level of sustainability of an area, which accords with how to assess its green development. Cities must develop and implement a new type of information system, i.e., an integrated information ecosystem, that supports a holistic and multidisciplinary approach to sustainable development across all three spheres (administrative, political, and sustainability) described in the conceptual model [
20].
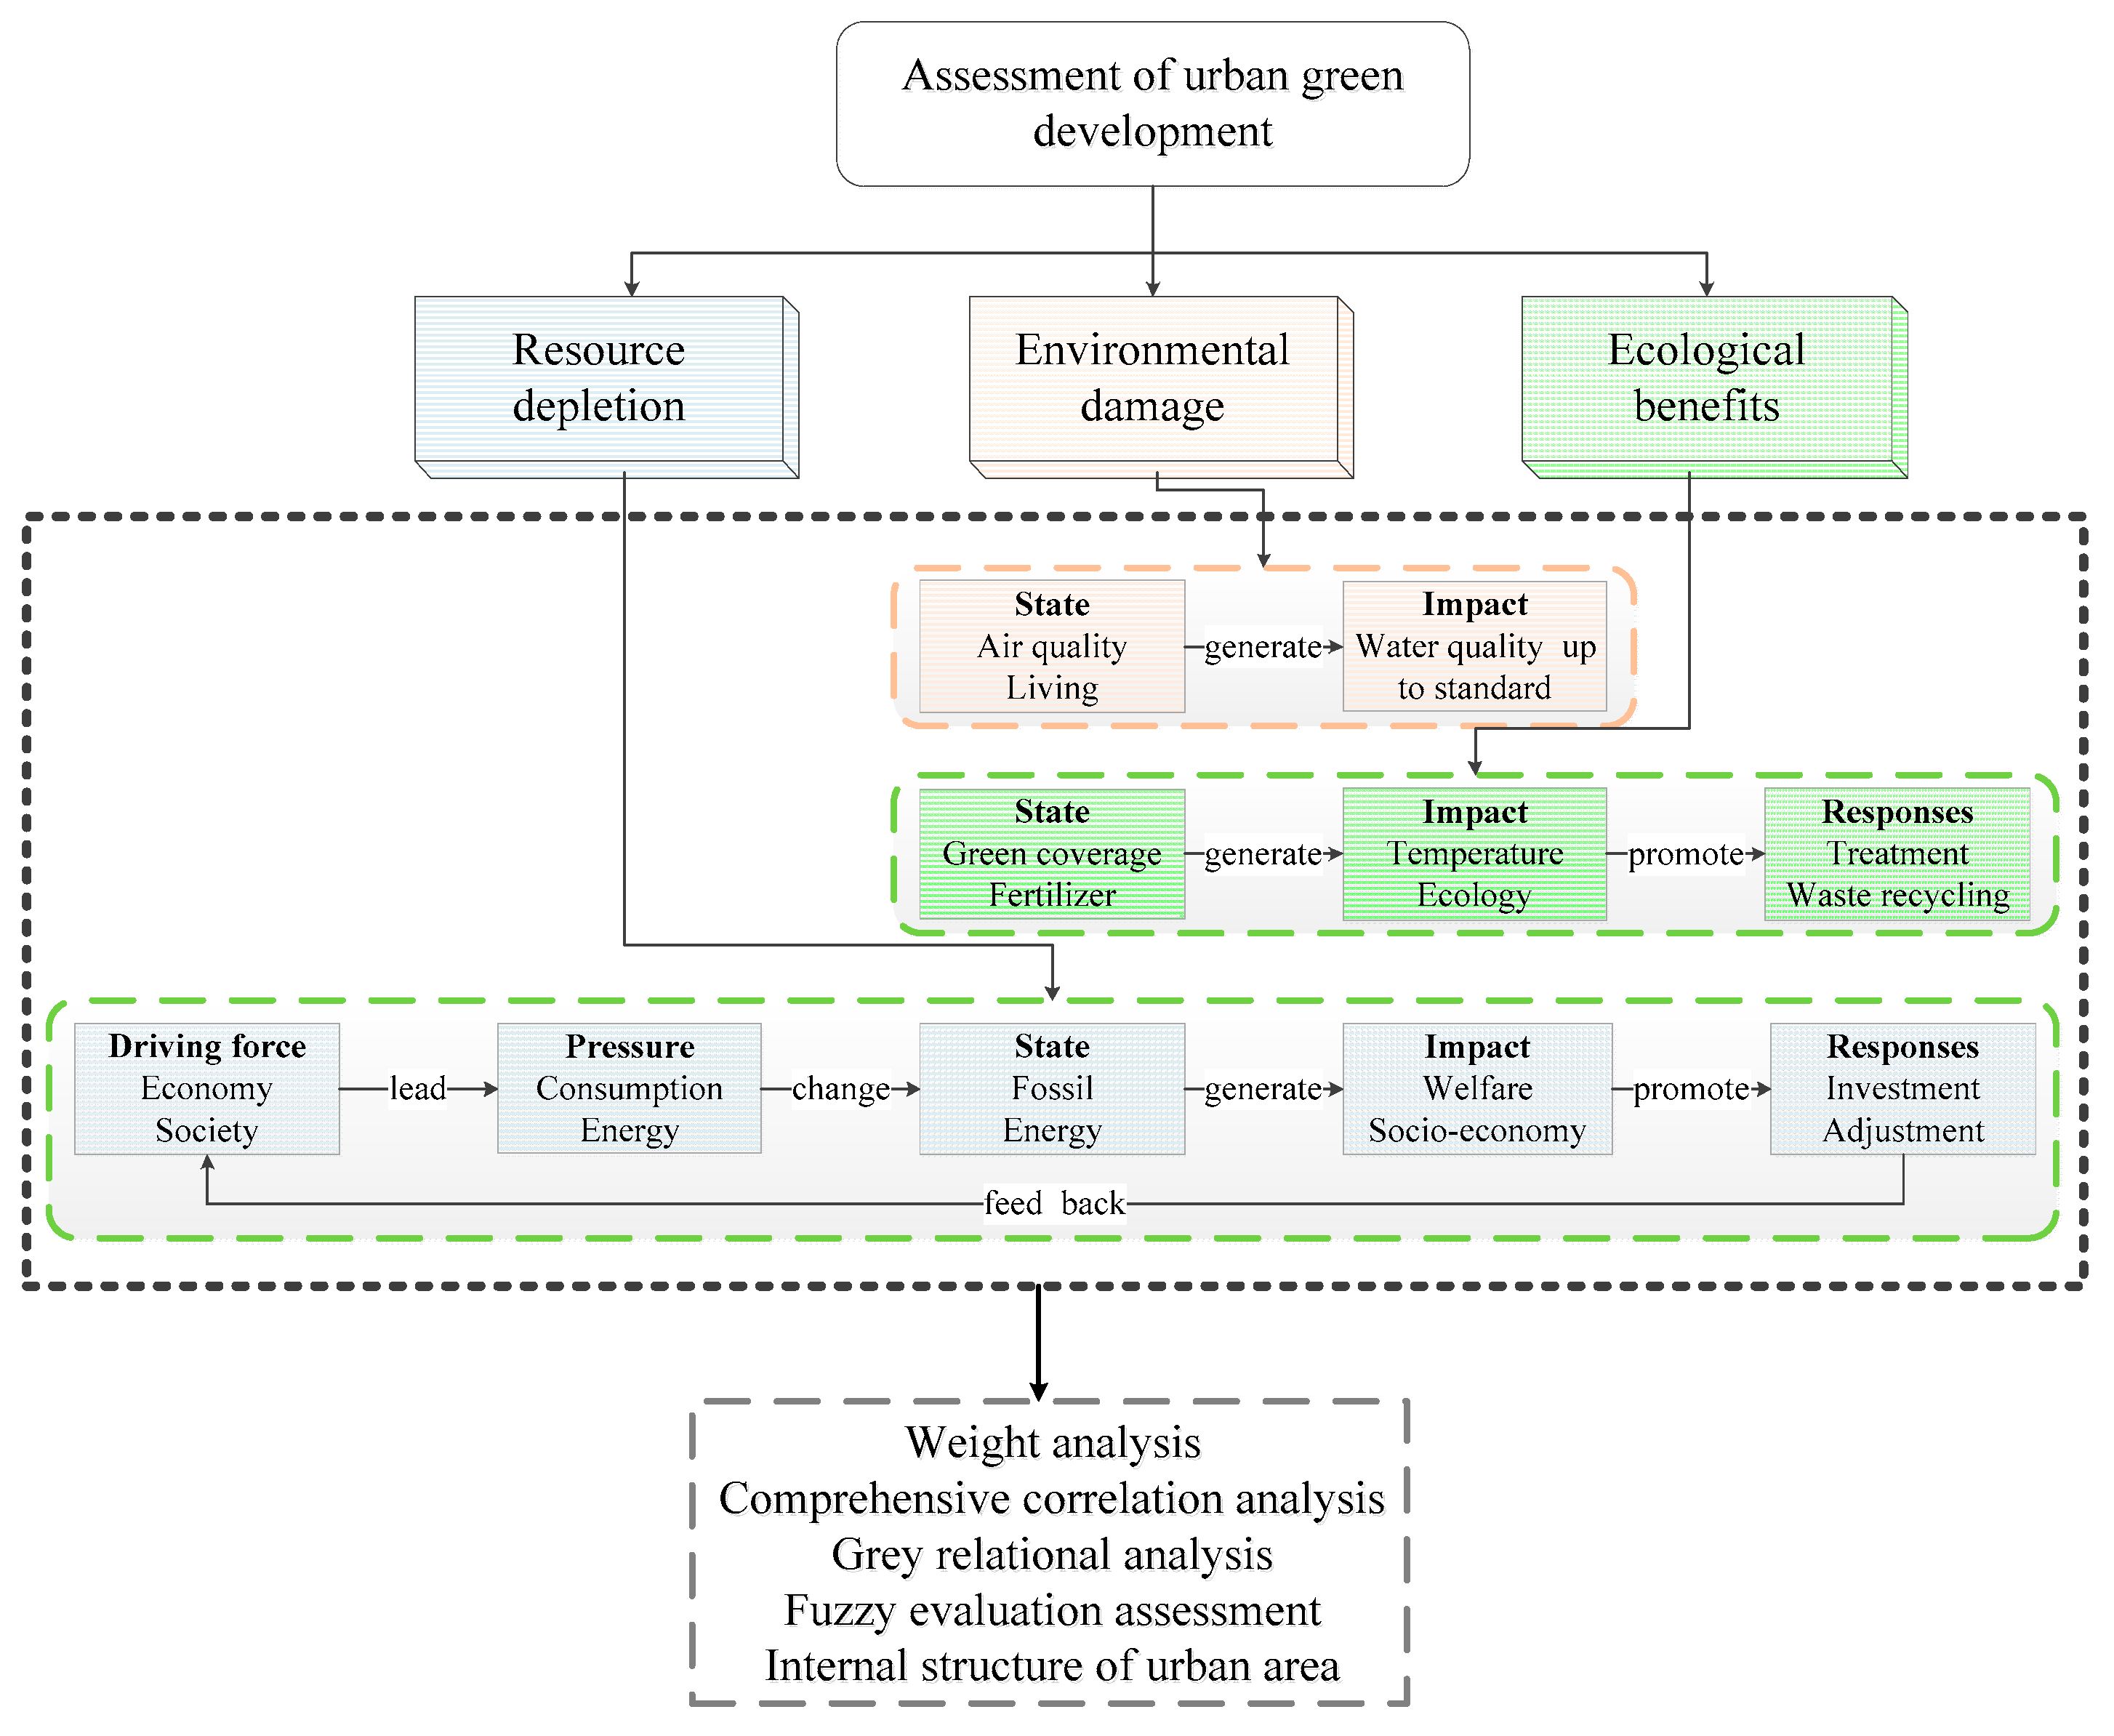
Although a variety of methods to evaluate sustainable development have diverse angles and distinctive features, a UGD evaluation system should more carefully and profoundly consider system pressures, states and feedbacks. This article uses the DPSIR model to establish a UGD evaluation system in which the indicators can be objective facts as well as to foster a holistic approach to analysis, and assess whether the current situation in a region is sustainable or to what degree it is related to UGD. Sustainability focuses equally on the economic, environmental and social dimensions of development in the same generation [
21], so UGD also has three equal dimensions, namely, resource depletion, environmental damage and ecological benefits, because cities cannot develop without energy and resources. In this paper, these factors are in the narrower meaning. Resource depletion is defined as the consumption of some substance or energy in an area that due to the labor, resource or energy rising, whose indicators containing the source, pressure and situation of the regional resource consumption. Environmental damage refers to environmental degradation that caused by human activity on direct environmental problems, these indicators mainly include the present situation of the environment, in order to analyze and compare the data conveniently, it has to process data to such indicators. Ecological benefits show the beneficial effect on the environment itself or human activities of material elements in the ecological environment, which indicator contents are including ecological or some environmental treatment. However, these factors are heavily weighted in the UGD evaluation system, which, in the conclusion of this paper, is shown to play a significant role when designing a city for social-economic stewardship. Environmental damage and ecological benefits are a direct reflection of the urban environment, encompassing the impacts of lifestyles, living conditions and the ecological health of the city. Therefore, the UGD evaluation system pays special attention to these dimensions and revaluates them as part of a process to draw conclusions and provide useful recommendations. The main purpose of the UGD evaluation is to classify indicators from multi-aspect areas. Then according to synthesize and several individual components of the entire evaluate process, it will make corresponding conclusions and suggestions.
2. Methodology
2.1. The Structure and Steps of the UGD Evaluation System
An indicator system for UGD should embody the state and influence of the processes and advancements of the city that can reflect the current state of the urban environment, the economy, and urban ecological and social construction. A model of driving forces, pressures, states, impacts, and responses (DPSIR) can be used to build assessment system [
22]. This study used it to examine the comprehensive factors, and divided them into a series of hierarchical indicators. Then, the grey-fuzzy comprehensive method [
23] was adopted to analyze a large dataset for the years 2000 to 2014 to determine temporal patterns, as shown in
Figure 2.
This figure shows three aspects (resource depletion, environmental damage, and ecological benefits) to consider in the assessment of the UGD. Then, the DPSIR model was used to classify and quantify different indicators, eventually allowing indices to be calculated to analyze the UGD tendency.
2.2. DPSIR Framework for UGD
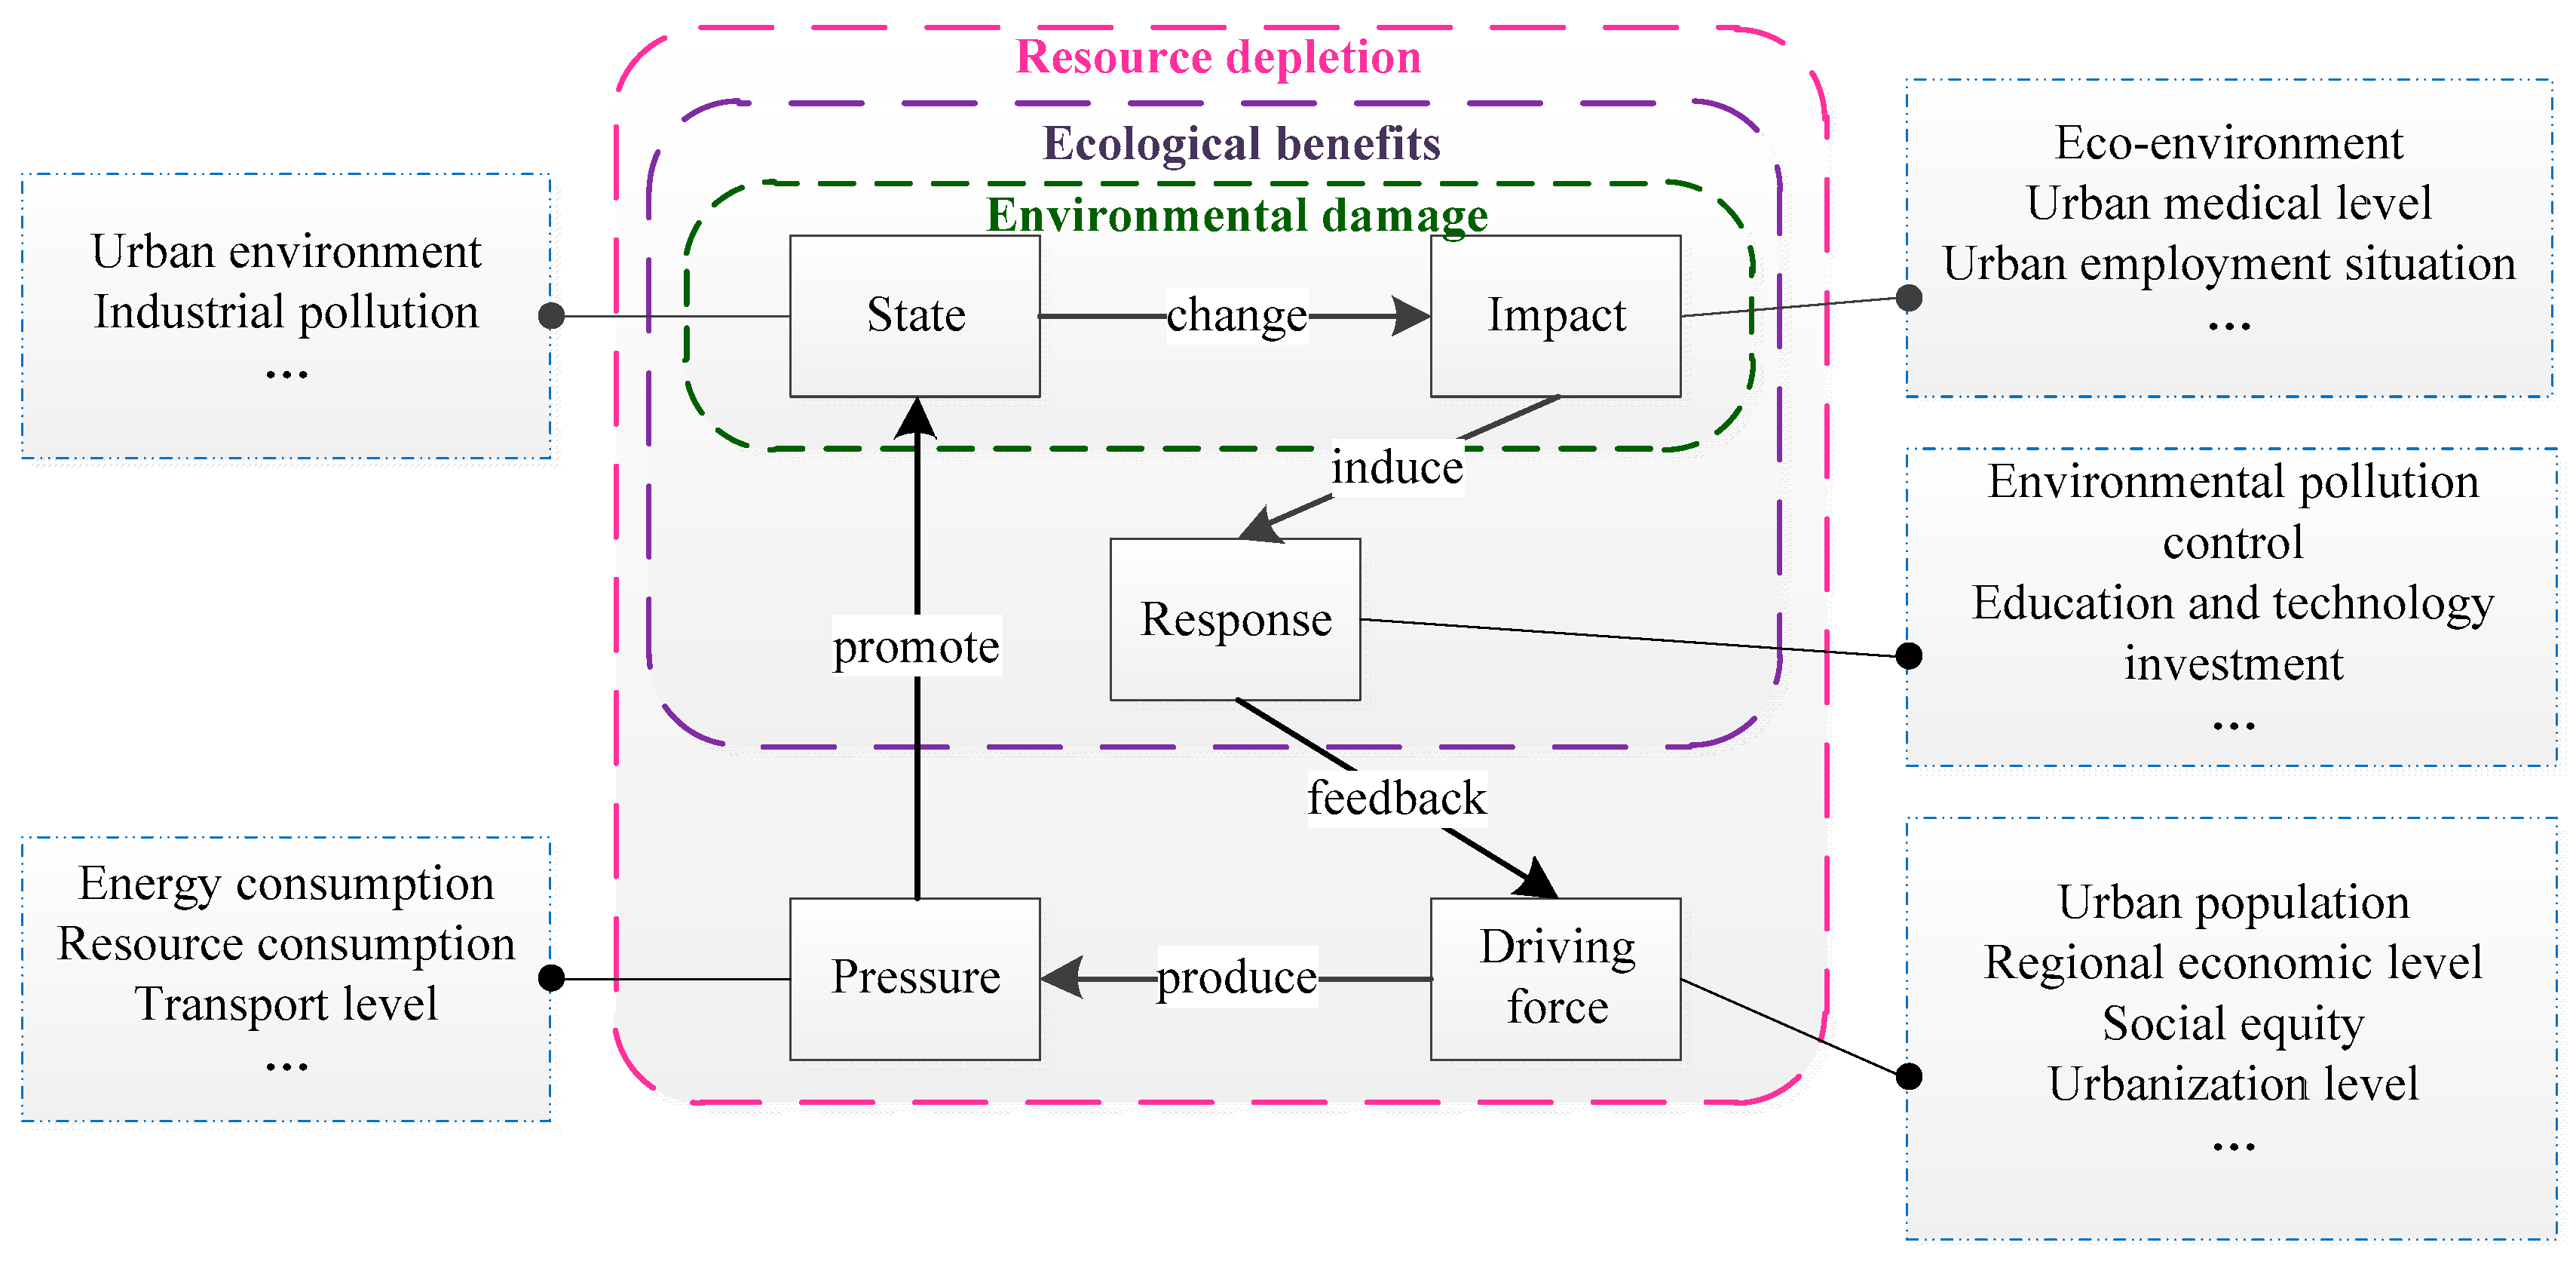
The concept of UGD emphasizes the sustainability of the economy, environment, politics and culture, so a DPSIR model was developed for UGD assessment and combined with data screening to overcome the disadvantages of data selection in existing evaluation methods. The focus of the research was on how the DPSIR framework has been used to organize sophisticated empirical scientific research and support transdisciplinary knowledge at an appropriate level for building an understanding of UGD evaluation. Specifically, DPSIR model may offer an approach to articulate the structure of the problem and serve as a template to help organize complex socio-economic research and identify viable options for managing and protecting UGD evaluation, thus increasing social adaptive capacity and resilience to exogenous drivers. In the specific case of Beijing, it is essential to investigate social and economic sectors of the urban, which are often the driving forces behind environmental degeneration. In an area, a change in state driven by anthropogenic activities impacts the ecological and societal environments, so the purpose of UGD assessment was to identify the dynamic development between the resources, environment and ecological system of an urban area. In this study, we introduced indicator selection and hierarchical comprehensive evaluation as parts of the assessment of the UGD. The DPSIR indicators follow (
Figure 3).
The DPSIR framework can be traced back to the Stress-Response framework by Statistics Canada in 1970s [
24]. Then DPSIR framework was devised in the late 1990s as a tool to report and analyze the environmental problems, which was proposed by the organization of Economic Co-operation and Development [
25]. DPSIR model has been used in many areas, such as marine environmental management, agriculture, environment, ecology, biodiversity and etc. It can be found that more and more studies on sustainable development broaden the use of DPSIR by the advantage of integrative, multidimensional assessment [
26]. Bidone (2004) [
27] take a bay basin as an experimental site to evaluate development and sustainability in coastal areas, by combining DPSIR framework and Cost-benefit analysis, and it combines sustainability indicators and defensive expenditures for the implementation of public policies. Ness (2010) [
28] using the DPSIR scheme to conceptualize the unsustainability problems, to better understand key causal chains and societal responses for particular sustainability problem areas, then take Swedish agriculture as an example. Zhao (2010) [
29] employed DPSIR framework and system dynamics methodology for better systematizing the sustainability indicators of urban residential areas, and take Nanjing as a case to assess the sustainability development of residential areas by choosing 24 indicators. It’s seeming to see there are many studies based on the DPSIR framework and combined some other methods to evaluate some concerning areas. That is explained by the fact that there are some advantages for framing DPSIR, such as the capacity to potentially describe the association between human activity and environmental problems, encourage transdisciplinary research, or act as a heuristic tool for complex system analysis [
30]. However, there are still some shortcomings about its framework. One disadvantage is that DPSIR has no explicit hierarchy of authority, so it should take the examination of the response aspect to make it quite clear. DPSIR has also criticized for concerning on causal chain, for one-to-one relationships, which would be hard to handle the real complex interrelationships [
26]. Though there are some drawback and strength in the DPSIR framework, its application can support the explanation and communication of research in an accessible and meaningful way to decision makers [
26].
In this paper of UGD, the driving forces considered in this study were linked to the social and economic factors that either increase or mitigate the pressures on green development. These indicators include the regional population size, regional economic level, Gini coefficient, and other factors that directly or indirectly influence UGD.
Pressures refer to direct anthropogenic pressures that impact green development; in other words, pressure indicators measure the impacts that human activities exert on the area, especially the depletion of resources, such as the consumption of natural resources and certain energy flow. Furthermore, environmental interventions that place a burden on the environment can be mapped based on these pressure indicators.
States are related to the current status of and trends in green development that determine the extent and magnitude of degradation. The associated indicators reflect the urban status quo and especially include the environmental situation.
Impacts are the effects that the changes in the environment have on human and non-human health, which can provide a change in environment factors. The associated indicators include the ecological environment, urban medical level, the urban employment situation, etc.
Responses are what the society perceives should be done, improved or mitigated to realize better green development. This final step in the process assesses the potential ability of different responses to prevent or reverse negative impacts or conserve natural resources.
To monitor and evaluate the level of UGD, 40 indicators based on quantitative data were selected to establish the UGD evaluation system. Then, the summary of the DPSIR framework was taken as a tool for the analysis of urban development in this paper.
2.3. Grey-Fuzzy Comprehensive Multiplication
After the UGD evaluation system was established, all the available UGD data were collected and analyzed using a complex mathematical method to perform a UGD evaluation. This research used a comprehensive grey-fuzzy analysis as follows.
♦ First, normalization of the indicator data.
After collection, the data were normalized to prevent different dimensions of the major controlling indicators from unduly influencing the evaluation, so the potential positive and negative correlations of the controlling indicators with the target had to be considered: the bigger the normalized index of data, the greater the value with its original indicator data, whereas the smaller the index, the lower the value. Since the parameters had different units, they were made dimensionless using the following equations:
Negative index:
where
. is the data matrix in which
i: 1, 2, …
n indicates the years from 2000 to 2014 and
j: 1, 2, …
m represents the 40 indicators applied to Beijing;
is the dimensionless index value; and
is the value of
jth indicator in the
ith year. To this end, reversing the negative indices converted them to positive indices. The value of
varies from 0 to 1, and the results improve as this value increases.
♦ Second, the calculation of indicator weight, the urban green development index (UGDI) and the degree of correlation among the indicators.
This study used grey relational analysis to calculate the weight of each indicator and determine the degree of correlation among the top ten highest weighted indicators; the weights were then used to calculate the UGDI. The grey relational analysis is a multivariate statistical approach within the grey systems methodology proposed by Deng [
31] that quantitatively analyses the similarity or dissimilarity of related sequences [
32]. The grey relational degree was used to determine the weight of the indicators as well as to describe the degree of correlation between a target sequence and a reference sequence.
The UGD evaluation system consists of many factors. According to the grey relational analysis, the weight of each indicator can be identified by averaging its grey relational degree from 2000 to 2014; the higher the grey relational degree, the better the indicator represents UGD and the greater its weight. The weight of each indicator emerged through a longitudinal comparison over time, and the results of a transverse comparison of the indicators revealed the association to the UGD.
For the 15 years from 2000 to 2014, the 40 indicators from each year totaled 600 data points, and each data point was standardized using Equations (1) and (2).
In the grey relational analysis model, the system feature sequence is commonly represented as follows:
Correspondingly, the correlation factor sequence is as follows:
According to the basic principle of the grey relational analysis, the correlation coefficients are calculated using the following model:
where
is the resolution coefficient, and its value is determined in accordance with a specific condition. Normally, we take
= 0.5.
Once the correlation coefficients have been calculated, the weights of the indicators are determined as follows:
In this article, the grey relational analysis model of a system feature sequence is represented as follows:
In the above formula (5), k: 1, 2, … n (n = 15) indicates the years from 2000 to 2014, and i: 1, 2, … m (m = 40), represents the 40 indicators applied to Beijing. In the above Formulas (6) and (7), is the average of the indicators over 15 years, and is the weight of the indicator.
After collecting the weights of the indicators, the UGDI was calculated from the weights and the normalized indicator data:
The UGDI of different categories is obtained by adding the values of the indices under the same classification.
However, the grey correlation degree calculation model is as follows:
In Formula (5), k: 1, 2, … n (n = 40), indicates the number of the 40 indicators applied to Beijing, and i: 1, 2, … m (m = 15) represents the years from 2000 to 2014. In the above Formulas (6) and (7), is the average of each indicator over 15 years, and . is the weight of the year. In Formula (10), is the degree of correlation among the indicators, where larger values indicate better representation of UGD by the indicator.
♦ Third, fuzzy evaluation assessment of UGD
After the weights of the indicators have been determined, fuzzy evaluation is the process of evaluating an objective utilizing set theory. The theory of fuzzy sets was proposed by Zadeh [
33] to set a class with fuzzy boundaries.
The fuzzy evaluation matrix is calculated as , in which is termed the membership function and is calculated as follows:
In this study, the evaluation set
contains 5 levels, and the factor set
has 40 factors. The fuzzy evaluation matrix of 5 factors is
, and the weight set is
.
When
and
are given, a fuzzy synthetic evaluation can be performed using the following equation:
When evaluating the UGD in Beijing from 2000 to 2014, the grade based on the UGD assessment and the likelihood of its accuracy for each year could be determined from Equation (17).
4. Results and Discussion
4.1. Weight Analysis
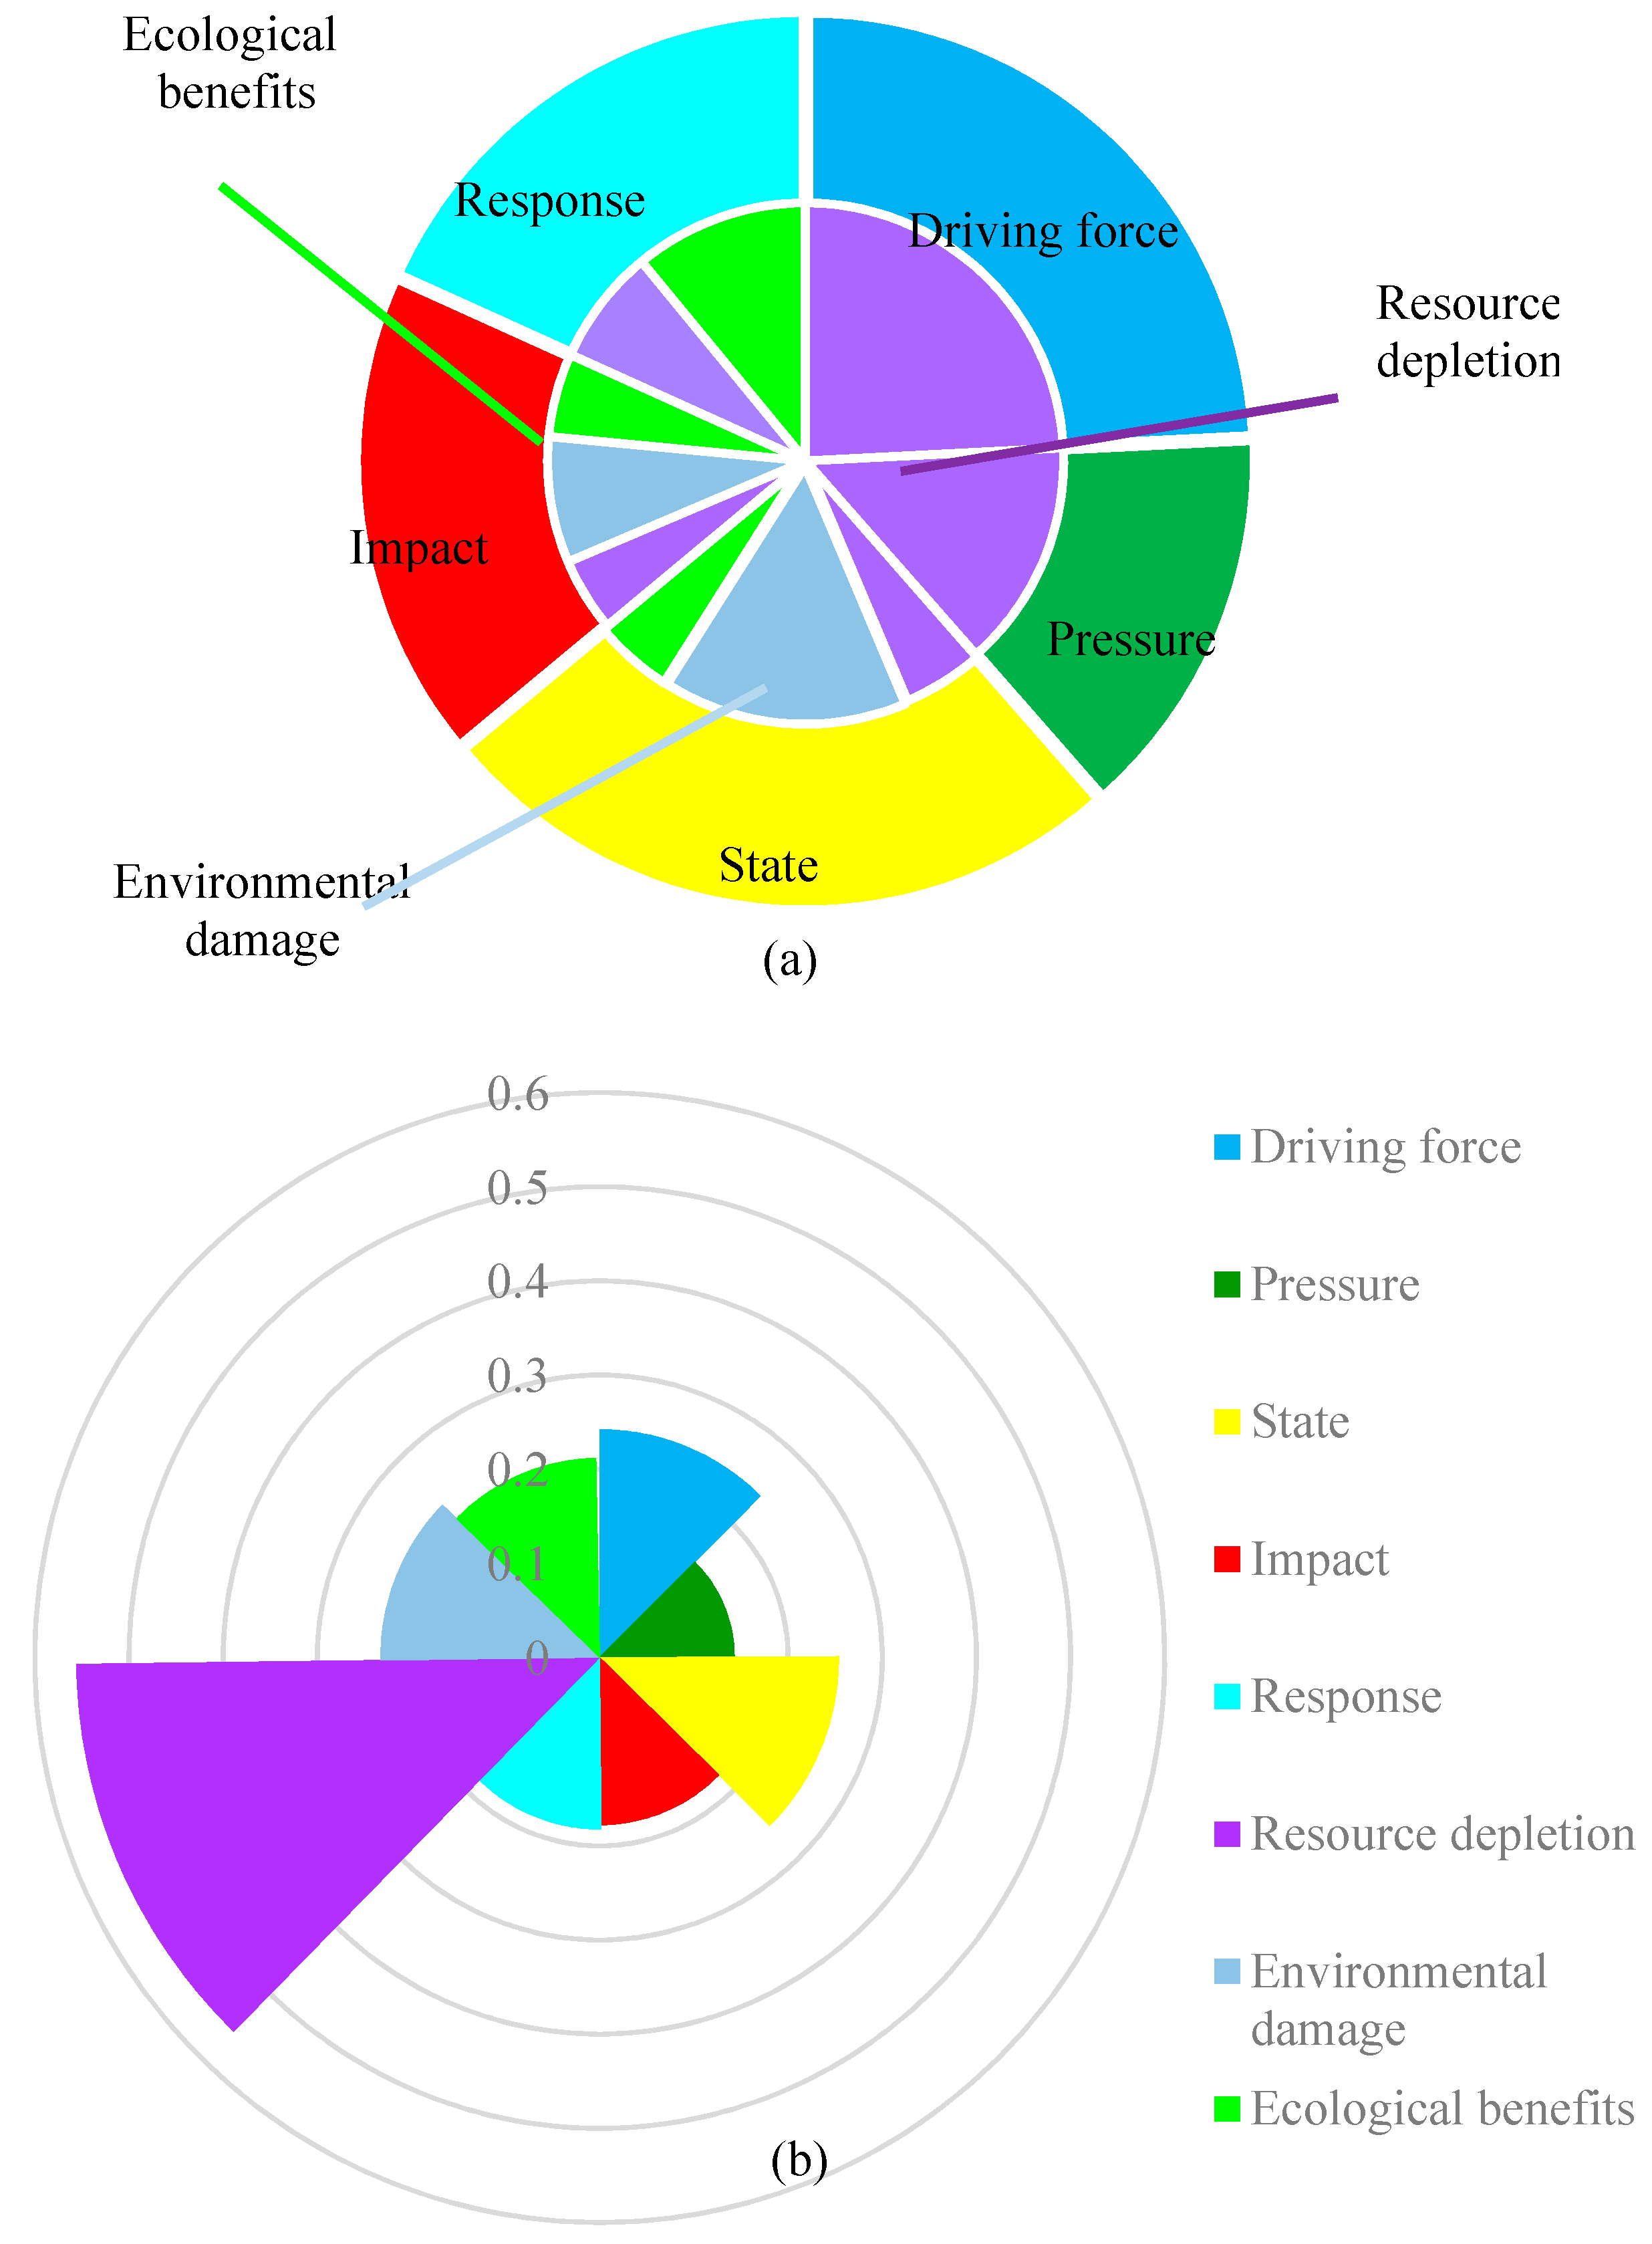
As shown in
Table 1, the UGD evaluation system was constructed by synergistically combining the 40 indicators into a series of comprehensive hierarchical indicators. In this paper, the authors combined 40 individual third-level indicators into second-level indicators (driving force, pressure, state, impact, and response) that can, in turn, be grouped into first-level indicators (resource depletion, environmental damage, and ecological benefits).
Of the second-level indicators, driving force
and state
had higher weights (see
Figure 4), which illustrates that the driving force and urban state are the key point in UGD assessment. While in the first-level indicators, resource depletion accounted for a large proportion
(see
Figure 4), which express that Beijing is a resource-consumption metropolis. Additionally, the states of cities, as described by environmental damage and ecological effects, could directly reflect the current need of cities to focus on planning and management. The driving force indicator includes GDP, income, population, the Engel coefficient, the Gini coefficient and the level of urbanization, and it combines the economic development trends of the city, the living conditions of its citizens, social equity and the overall culture. Therefore, deliberate policy interventions that harmonize the economy and society are effective. Otherwise, the state indicators include non-fossil energy depletion, industrial emission of chemical substances, the amount of agricultural fertilizer applied and environmental quality, and they directly reflect the influence of industry, agriculture and lifestyle on the urban environment. Maintaining healthy UGD requires the formulation of environmental programs and stringent laws to meet industrial and agricultural pollution emissions targets and ensure implementation.
The weight analysis not only can reveal the 40 specific indicators and comprehensive indicators weighting degree, but also can provide the indicators weight in the following comprehensive indicators analysis and fuzzy evaluation assessment. From the weight analyzing, it illustrates that Beijing can be classified as a resource-consumption metropolis. And special attention should be paid to the social, demographic and economic developments in societies as well as to the corresponding changes in lifestyle and resources depletion when evaluating UGD.
4.2. Comprehensive Indicator Analysis
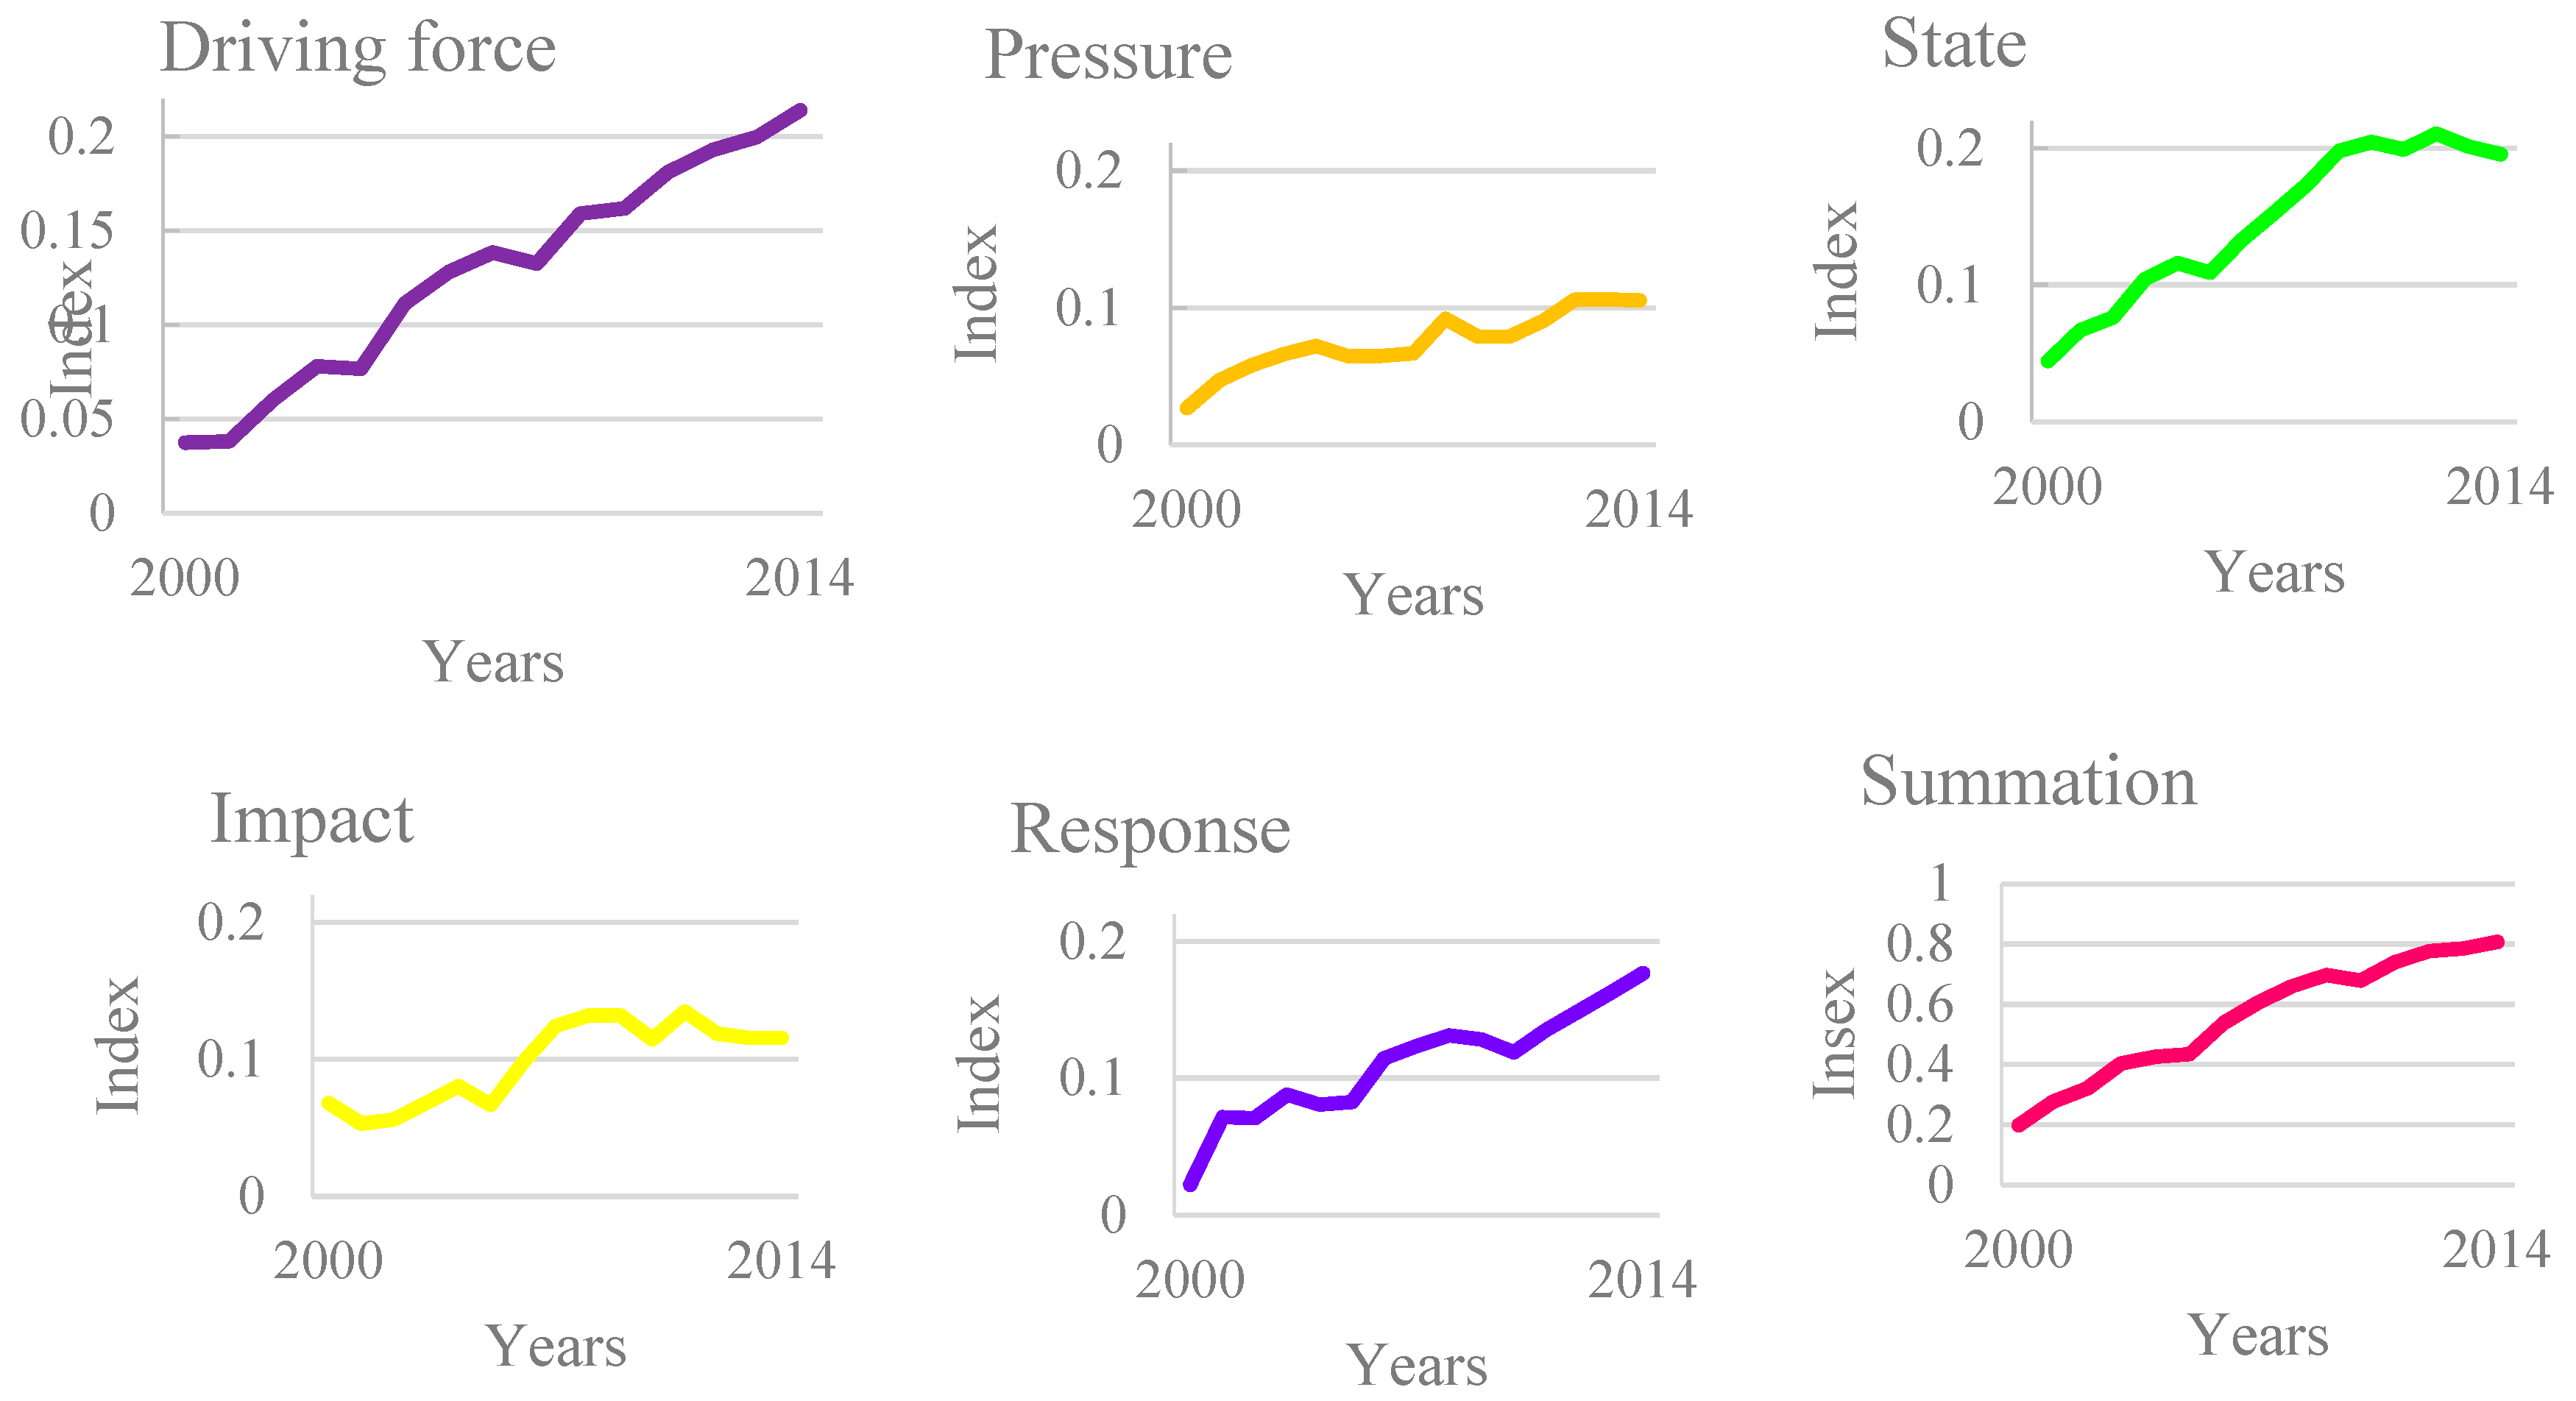
The comprehensive indicator analysis can offer the variation tendency of second-level indicators (DPSIR) and first-level indicators (three aspects) from 2000 to 2014. In order to observe the continual change of the comprehensive indicators of UGD, the data are processed accordingly. The values of the comprehensive hierarchical indicators are the sums of the values of the selected indicators, which included the weights, and the following figures (from
Figure 5,
Figure 6 and
Figure 7) show the results of these calculations. The results of the analysis of these indices are discussed below.
According to the tendency index of the second-level indicators (
Figure 5), the following conclusions can be drawn.
First, the five DPSIR indices all began at a low level; although their impacts were higher than those of the other four indices, the values of the integrated indices were all under 0.07. This illustrates that, whether due to a lack of action related to UGD or that UGD policies had not been implemented, Beijing was still on its original trajectory in 2000 (the economic development of the area was emphasized, and little attention was being paid to environmental damage or ecological fragility). On the whole, all DPSIR indices that evaluation for UGD from 2000 to 2014 ascended overall, indicating that UGD in Beijing is going to improve and to place the city on a UGD trajectory.
Second, the driving force, state and response indices increased and tended to be highly variable, while pressures and impacts changed slowly. In other words, the driving force, state and response indices exhibited synchronization, while the other two indices showed a slight delay. From 2000 to 2014, the driving forces, states and responses directly reflected the characteristics of UGD in Beijing, with the indicators of economic growth and population statistics included in driving forces, good air quality days and total carbon dioxide emissions per capita in states, environmental pollution to investment ratio and the sewage treatment rate in responses and so on, of which the change in these indicator indices would reflect UGD directly. However, the tendency of pressures and impacts was not very strong, mainly because these indicators are very indirectly related to UGD, and they have a certain delayed effect that differs from the temporal spatial feedback pattern.
Third, before 2005, UGD was growing slightly; from 2005 and 2010, it was ascending but varied drastically; and after 2010, it tended to grow steadily. Therefore, five years is an appropriate period for analyzing the growth of a city.
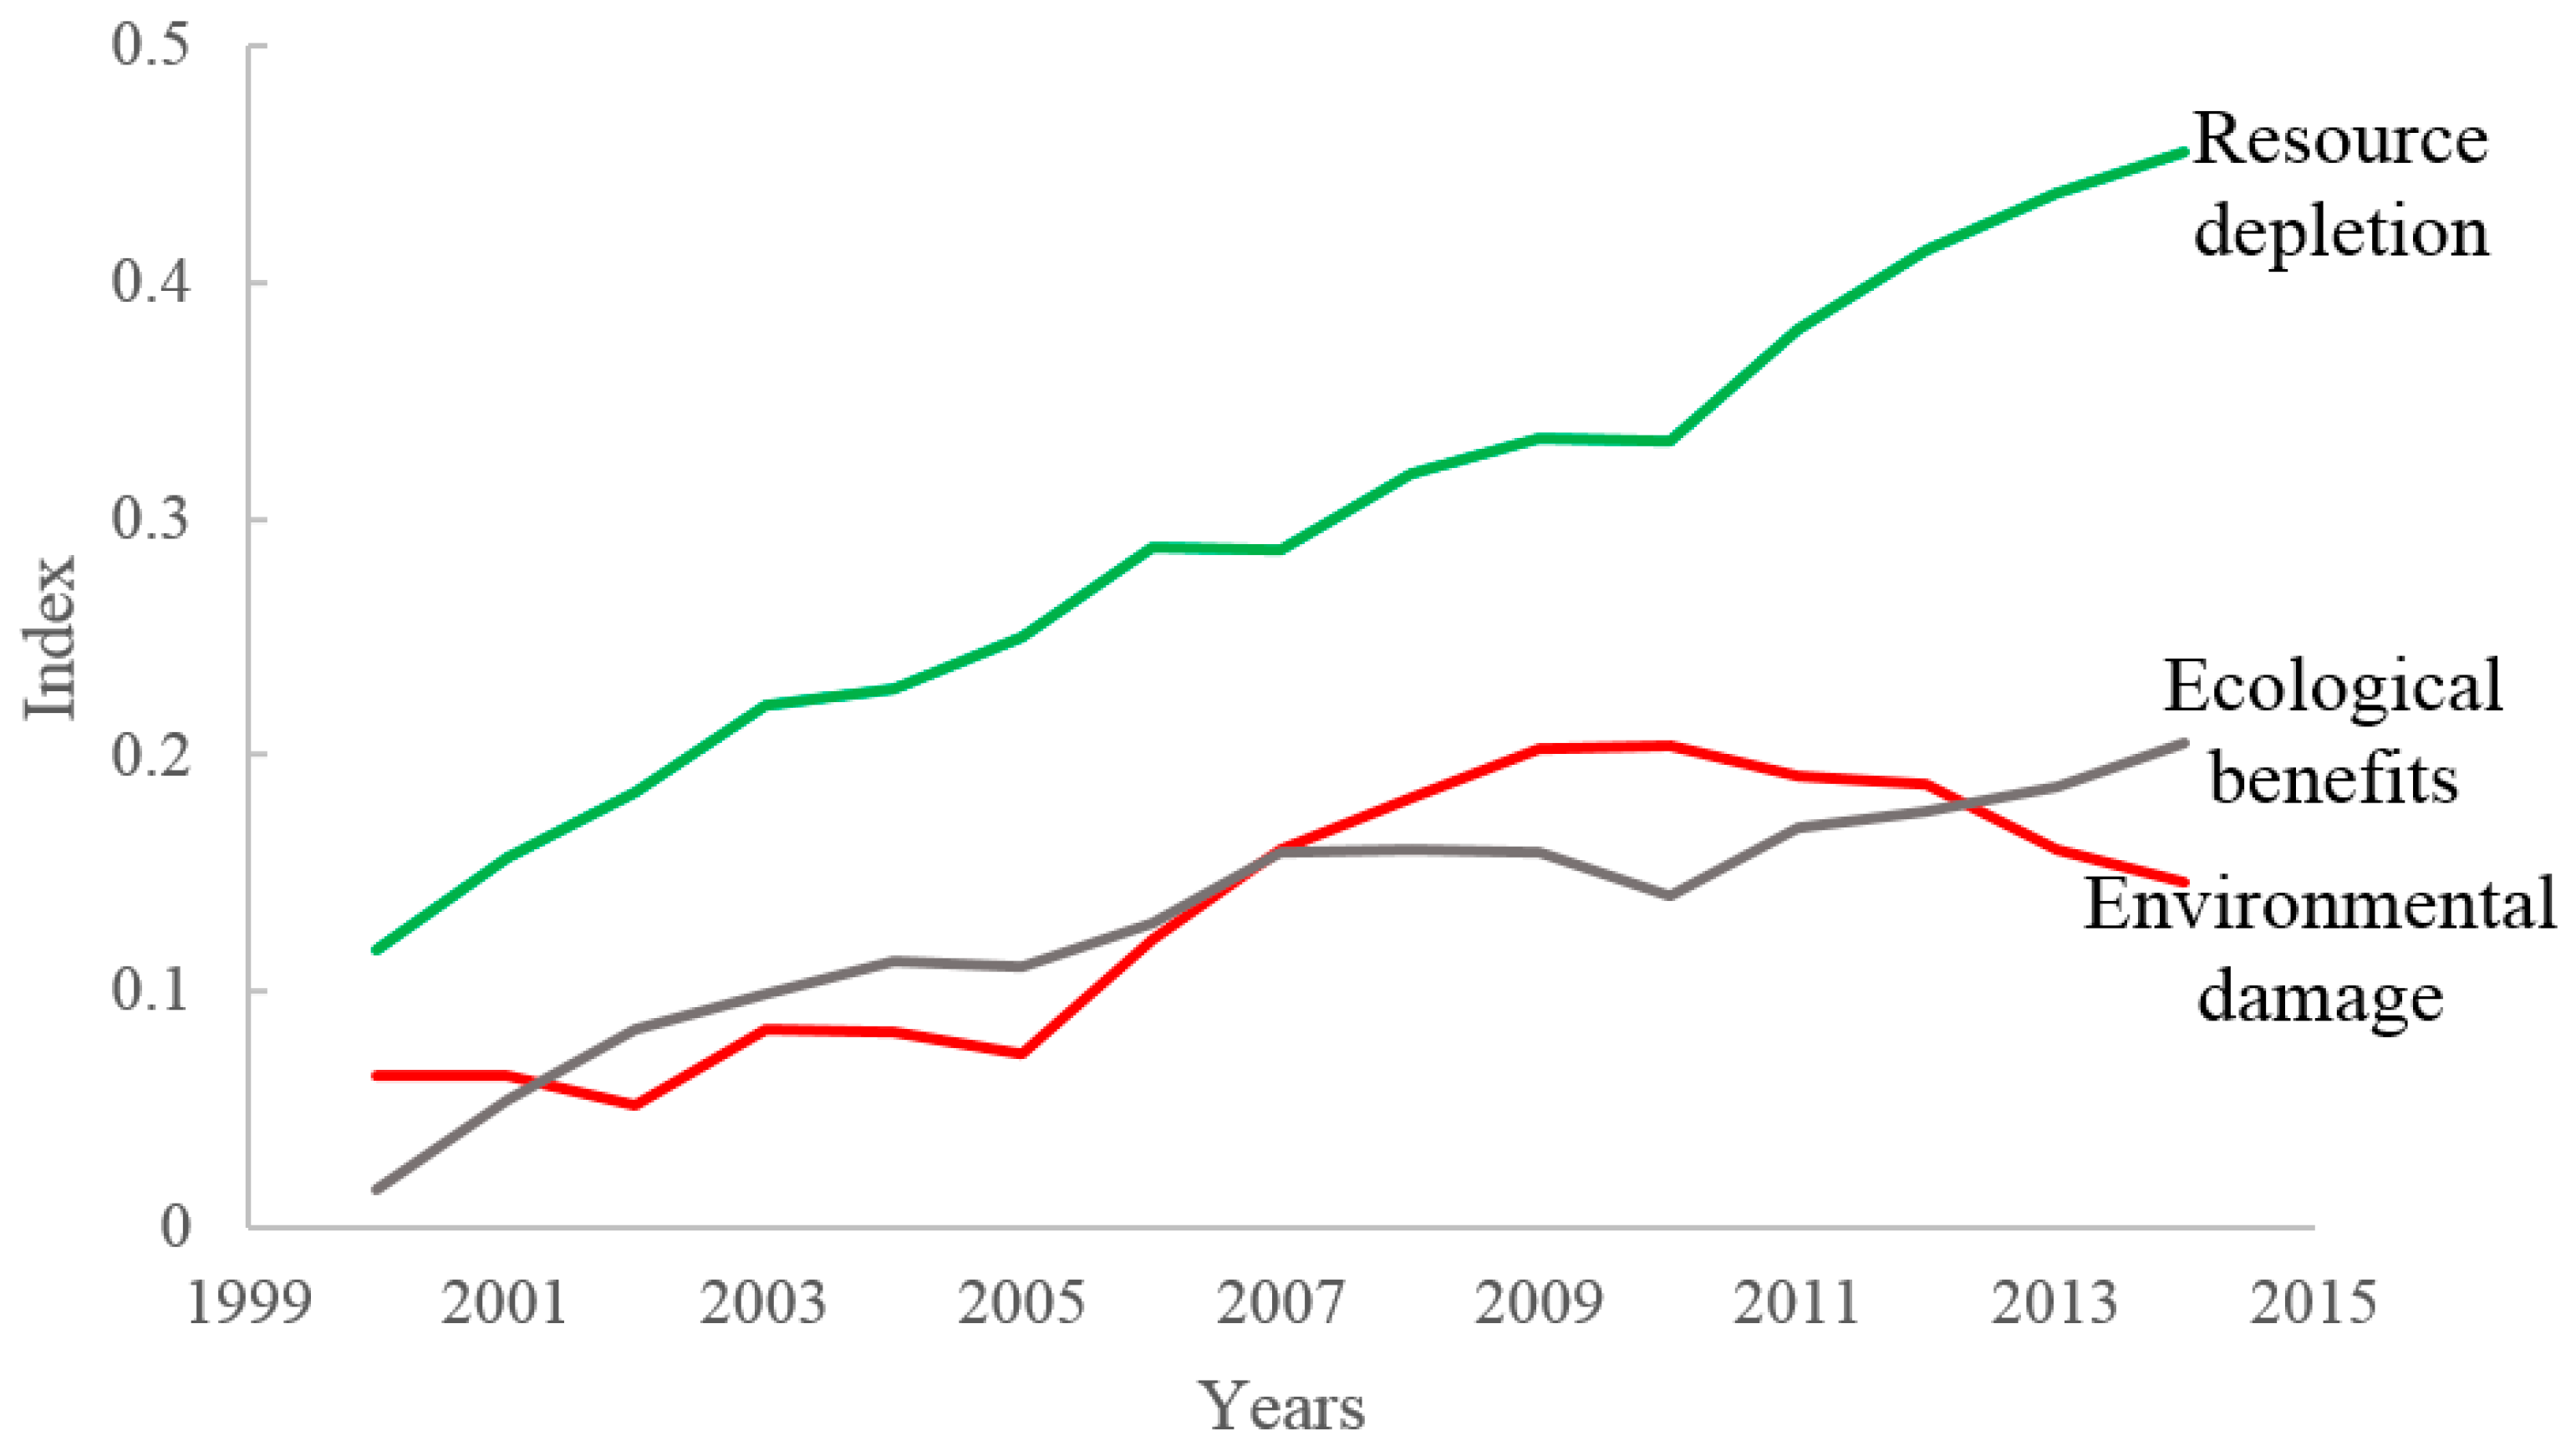
In addition to those related to the results for the second-level indices, the following conclusions can be drawn from the first-level indicators (see
Figure 6).
Initially, the environmental damage index declined from 0.2 to 0.14 after 2010, exhibiting a different tendency than that of the resource depletion index and the ecological benefits index. Therefore, the environment has obviously not done very well in the UGD process. However, according to
Figure 5, the growth of UGD improved, and the environmental damage index decreased slightly, mainly due to the contradiction between the environment and the non-transformation of industry, but it is also possible that policies supporting environmentally friendly development have had some effects.
The resource depletion index greatly increased from 0.18 to 0.64, which might be because the use of energy and resources has risen due to social and public needs. The line representing this index is higher than the others on the figure, ensuring that the urban growth model of a developing economy has remained unchanged; although the government has paid much attention to green growth, the transformation has not been easy. With time, this index may grow exponentially.
Eventually, the ecological benefits index achieved steady growth from 0.02 to 0.21, indicating that not only has green urban construction been improving, but some factors of urban lifestyles, such as sewage treatment and garbage disposal, have gradually been taken more seriously. However, it may be that the current ecological benefits depend on the way in which pollution has been managed. Meanwhile, the comprehensive indicator of ecological benefits is an indicator that has seen results only by slowly accumulated data, so the transformation from the original development model to UGD cannot be impulsive.
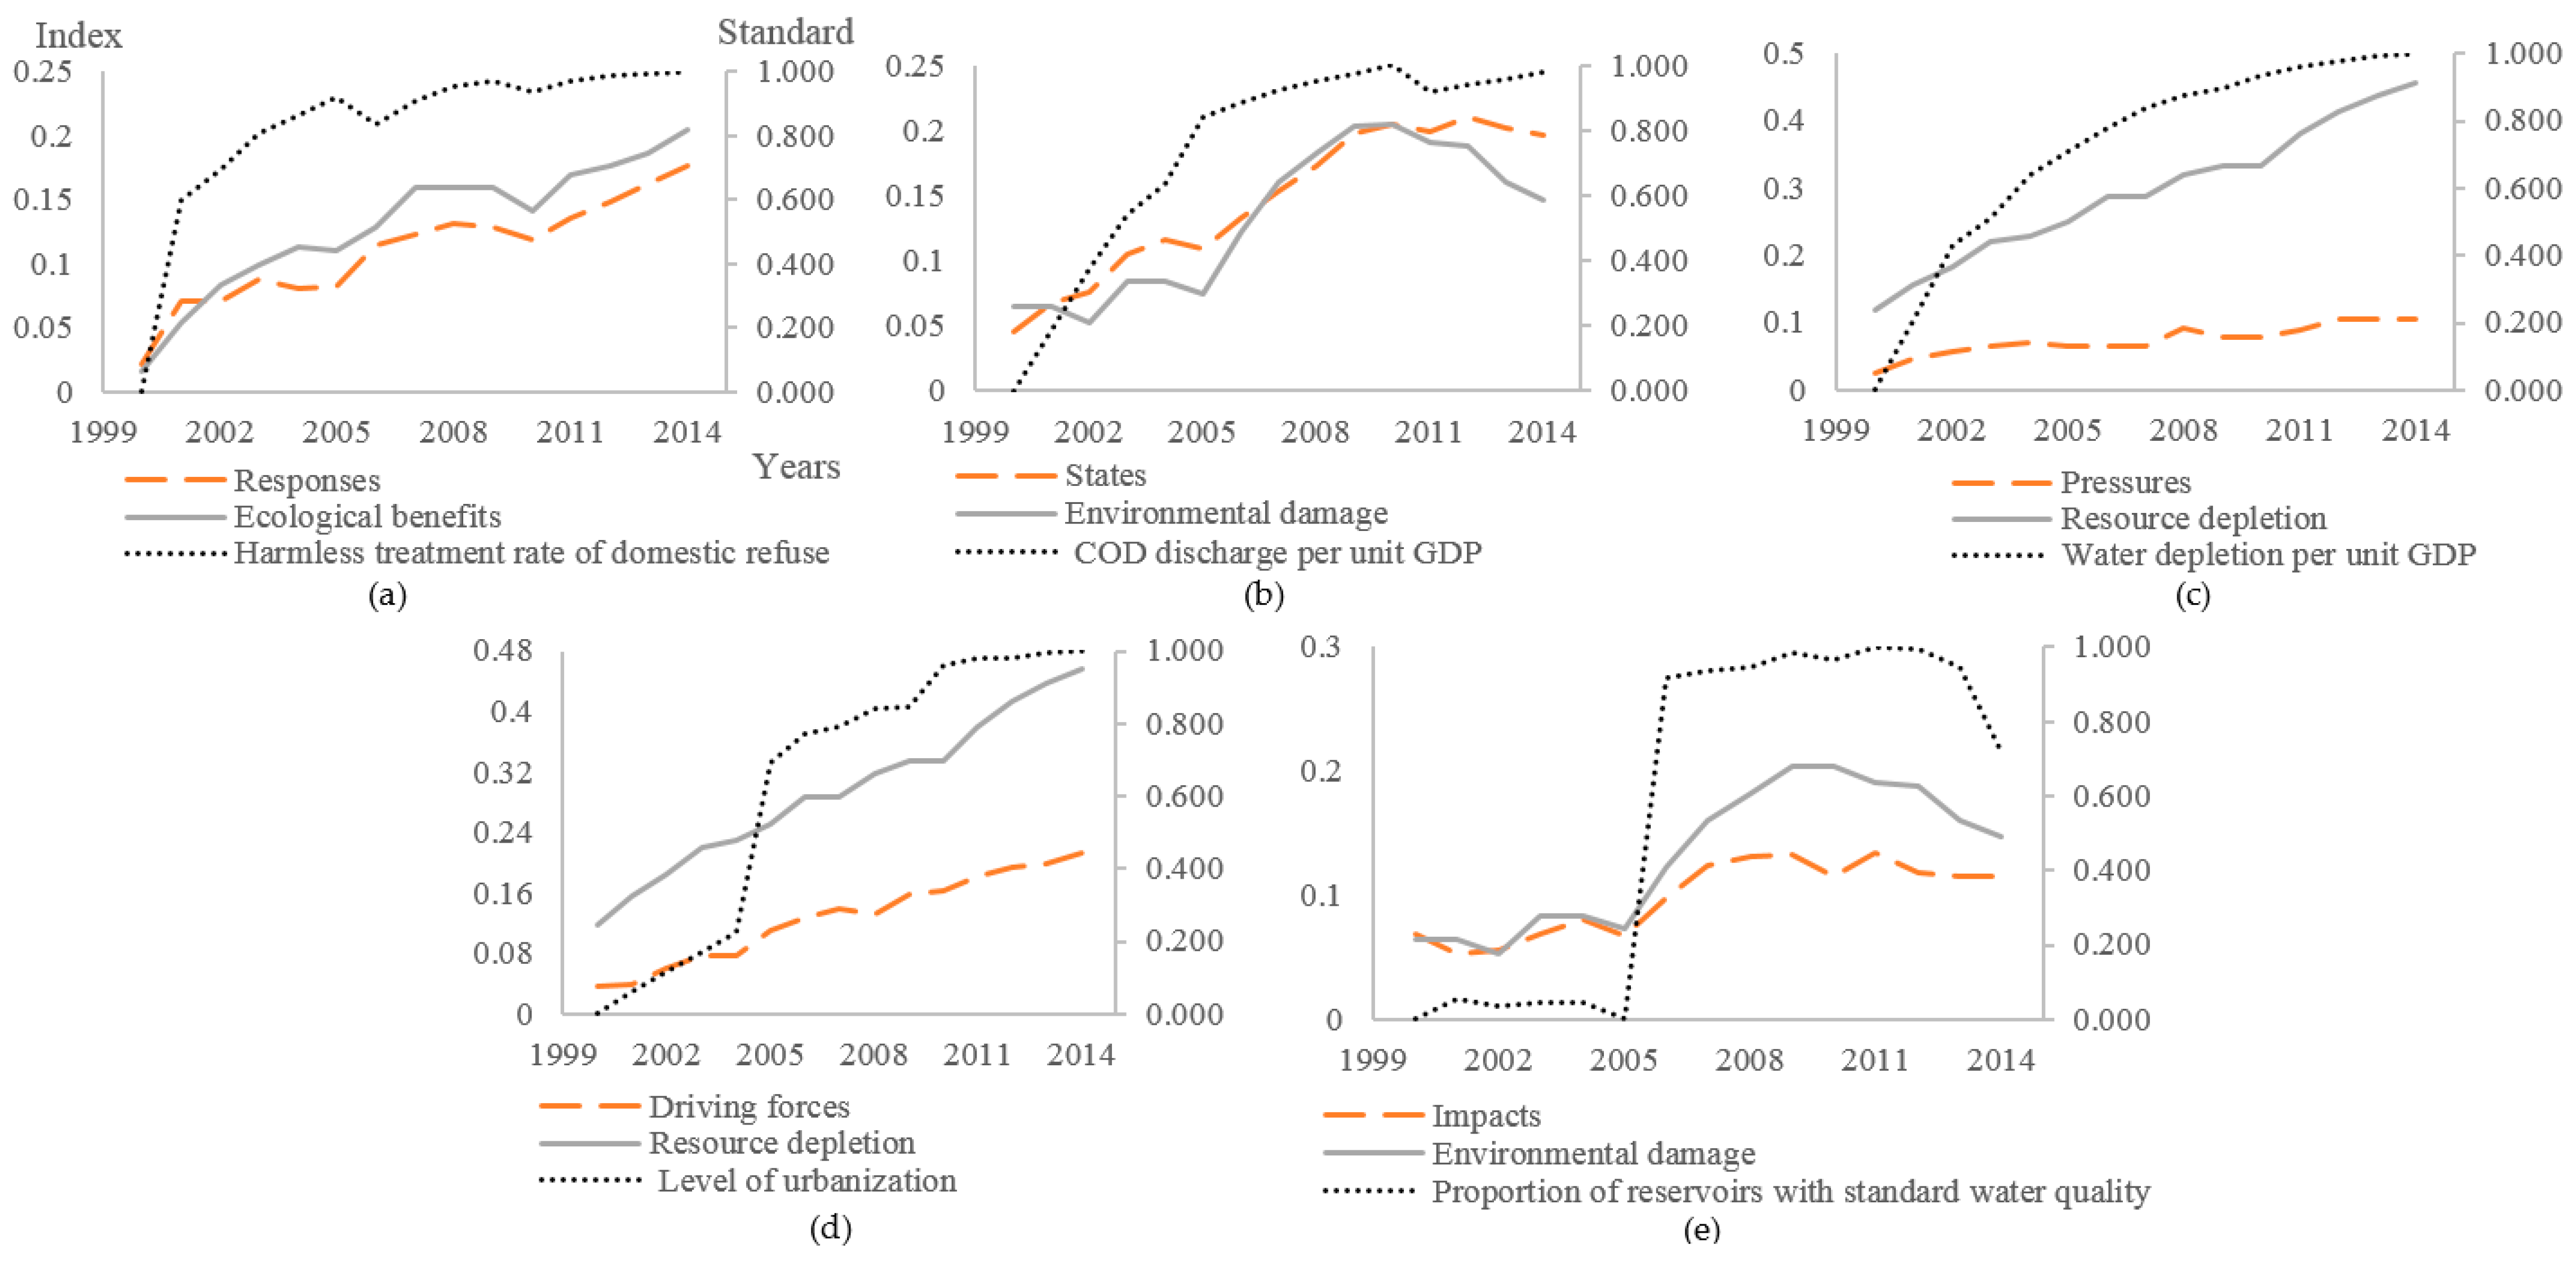
4.3. Grey Relational Analysis
Grey relational analysis is efficient for solving multiple attribute decision making, which is suitable for solving problems with complicated interrelationships between multiple factors and variables [
39]. According to the grey relational analysis, various indicators of UGD can be ranked for intimate degree. When the degree of correlation among the indicators is higher, the connection between the indicators and UGD is stronger. The top ten indicators were ranked, and from the initial diversion to the structure of the UGD evaluation, the DPSIR model and the three criteria show nearly equal divisions (see
Table 2 and
Figure 7).
As seen in
Table 2, the data in each indicator is the correlation coefficient of UGD. When sorting the data, it can be seen that the first ranking about the grey relational analysis is the harmless treatment rate of domestic refuse, which is divided to the first third-level indicator, and it belongs to the second-level model indicator of responses and the first-level indicator of ecological benefits.
Figure 7 shows that the second-level lines and first-level lines have the same fluctuation tendency, while the third-level lines fluctuate more violently. Because of the authenticity of and variability in the original data, the indicator lines fluctuate within a more sensitive range after standardization, and the second-level lines and their corresponding first-level lines fluctuate similarly. Therefore, the trends in the lines are the same as the overall trend. The reason the first-level lines are above the second-level lines is mainly because of the number of diversity indices, which will cause the baseline to be relatively large. At the same time, the rationality of the calculation makes the overall trend roughly the same, and the extent of the fluctuation has a certain sensitivity.
The top ten indicators could be divided into six aspects. The harmless treatment rate of domestic refuse, the urban Engel coefficient and the water consumption per unit GDP indicators belong to the microcosmic angle of city life, while indicators of the level of urbanization show the city state from a macroscopic angle. The indicator of research and development (R&D) expenditure intensity pertains to the innovation of urban education technology, and the COD discharge per unit GDP and the sewage treatment rate indicators are geared towards the degree of urban industrialization. The indicators of the proportion of reservoirs with standard water quality and the average regional environmental noise value are components of urban environmental quality. The ecological environmental index indicates the urban ecological condition.
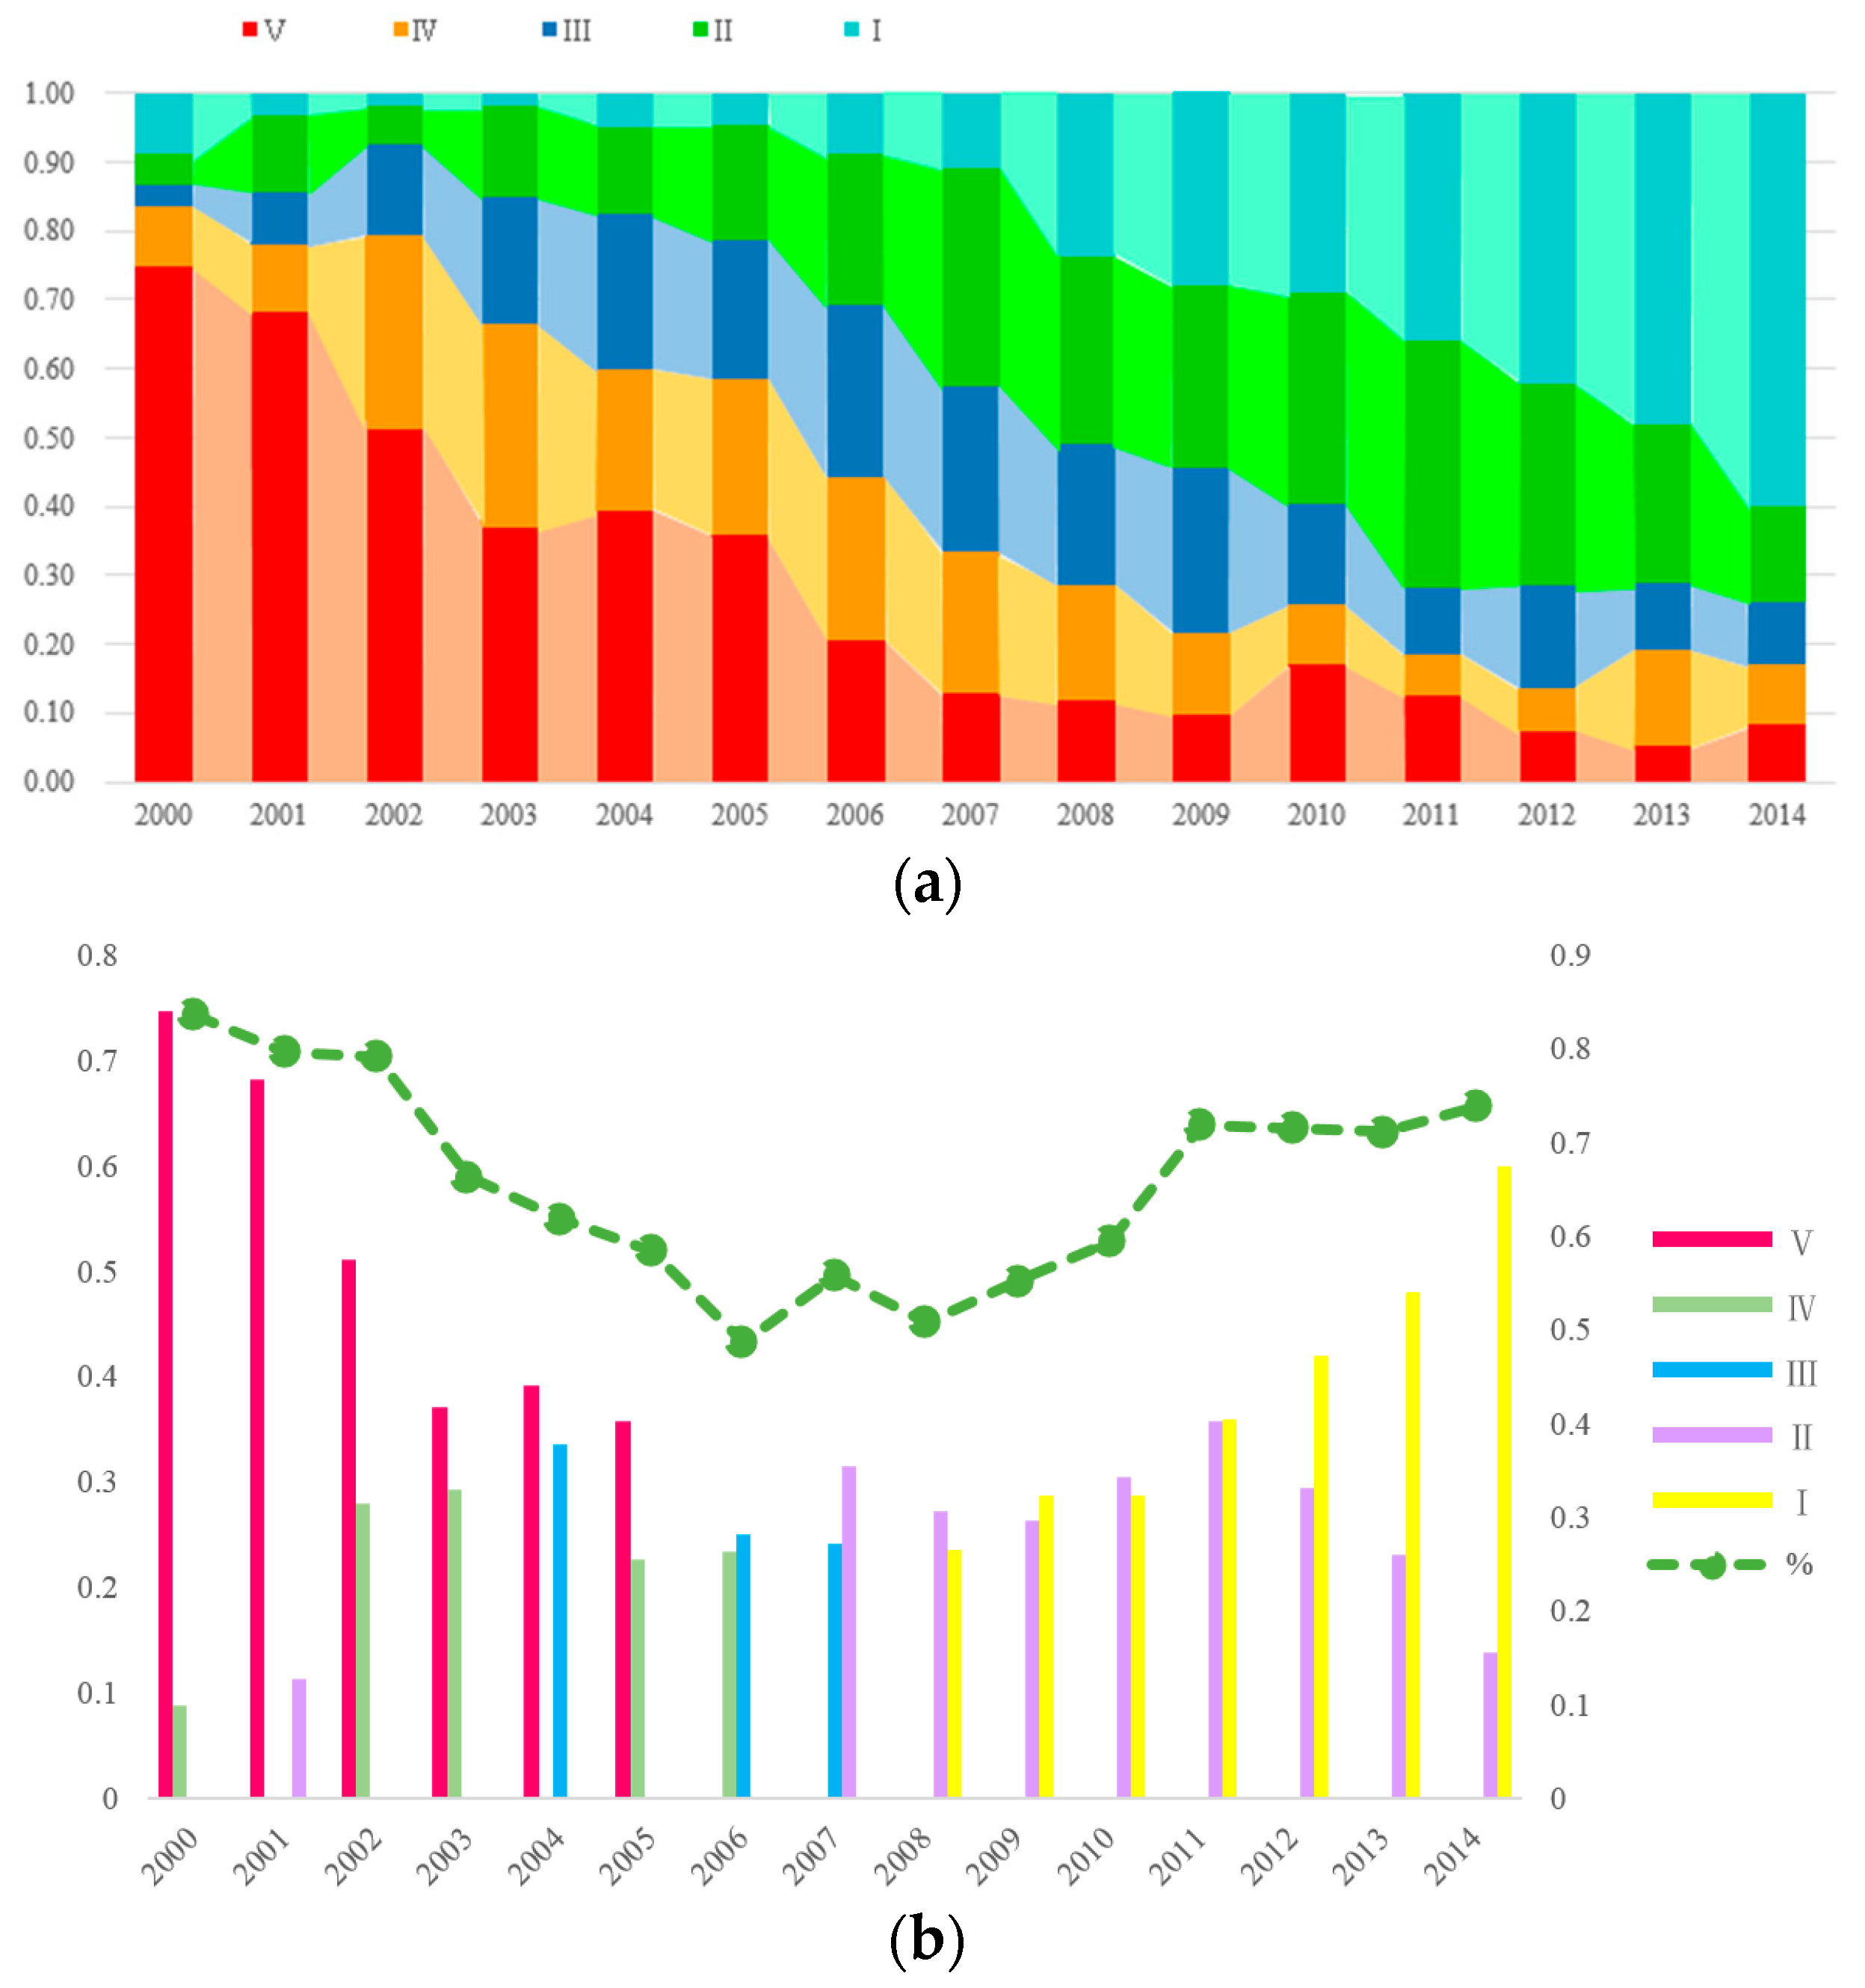
4.4. Fuzzy Evaluation Assessment
Fuzzy evaluation assessment is based on the conception of fuzzy logic, and fuzzy logic could be applied to the development of environmental indices in a manner that solves several common problems, including the incompatibility of observations and the need for implicit value judgements [
40]. A grey-fuzzy comprehensive evaluation gives the degree of tendency towards improved UGD from 2000 to 2014 (see
Figure 8), and it reflects the rapid speed of the change during the 15 years in Beijing, in which the “very unhealthy” level (
V) was reduced year by year, although it slightly rebounded in 2010, while the “quite healthy” level (
I) steadily increased. However, in the transitional stage from “unhealthy” level
IV to “healthy” level
II, there was first an increasing trend (2000–2007) and then a decreasing trend (2007–2014), indicating that the scope of the UGD assessment criteria in these years was not obvious. This is called a healthy rating scale dispersion, and its maximum proportion was not obvious. Similarly, there are many aspects to development, including the urban economy, society, environment, culture and so on, that were not balanced; in other words, the interior development was not uniform. For example, greater importance was attached to the society and economy, but rapid economic growth presents a contradiction due to the low technological cleaning technology and reformation inputs in industrial production as well as the resulting pollution or environmental degradation. Therefore, it can be surmised that some fields do well, while others are laissez faire, which may lead to the phenomenon in UGD evaluation of a dispersion from level
IV to level
II. This result demonstrates that urban areas have different local conditions, such as natural resources, economic conditions, environmental awareness, technology level and policy competency, over time. Although different temporal and spatial patterns in UGD status emerge, the usual outcome is that UGD improves and becomes healthier.
4.5. Internal Structure of Urban Area
In some researches, the internal structure of cities, usually refers to spatial structure as industrial and residential land use in the city [
41]. When considering the development about an area, it depends on many fields, such like the economy, industry, education, medicine, etc. These different aspects in urban influence the speed of its progress, which named internal structural of urban area. Because of their unbalanced development rate, it will express the unique situation of an area.
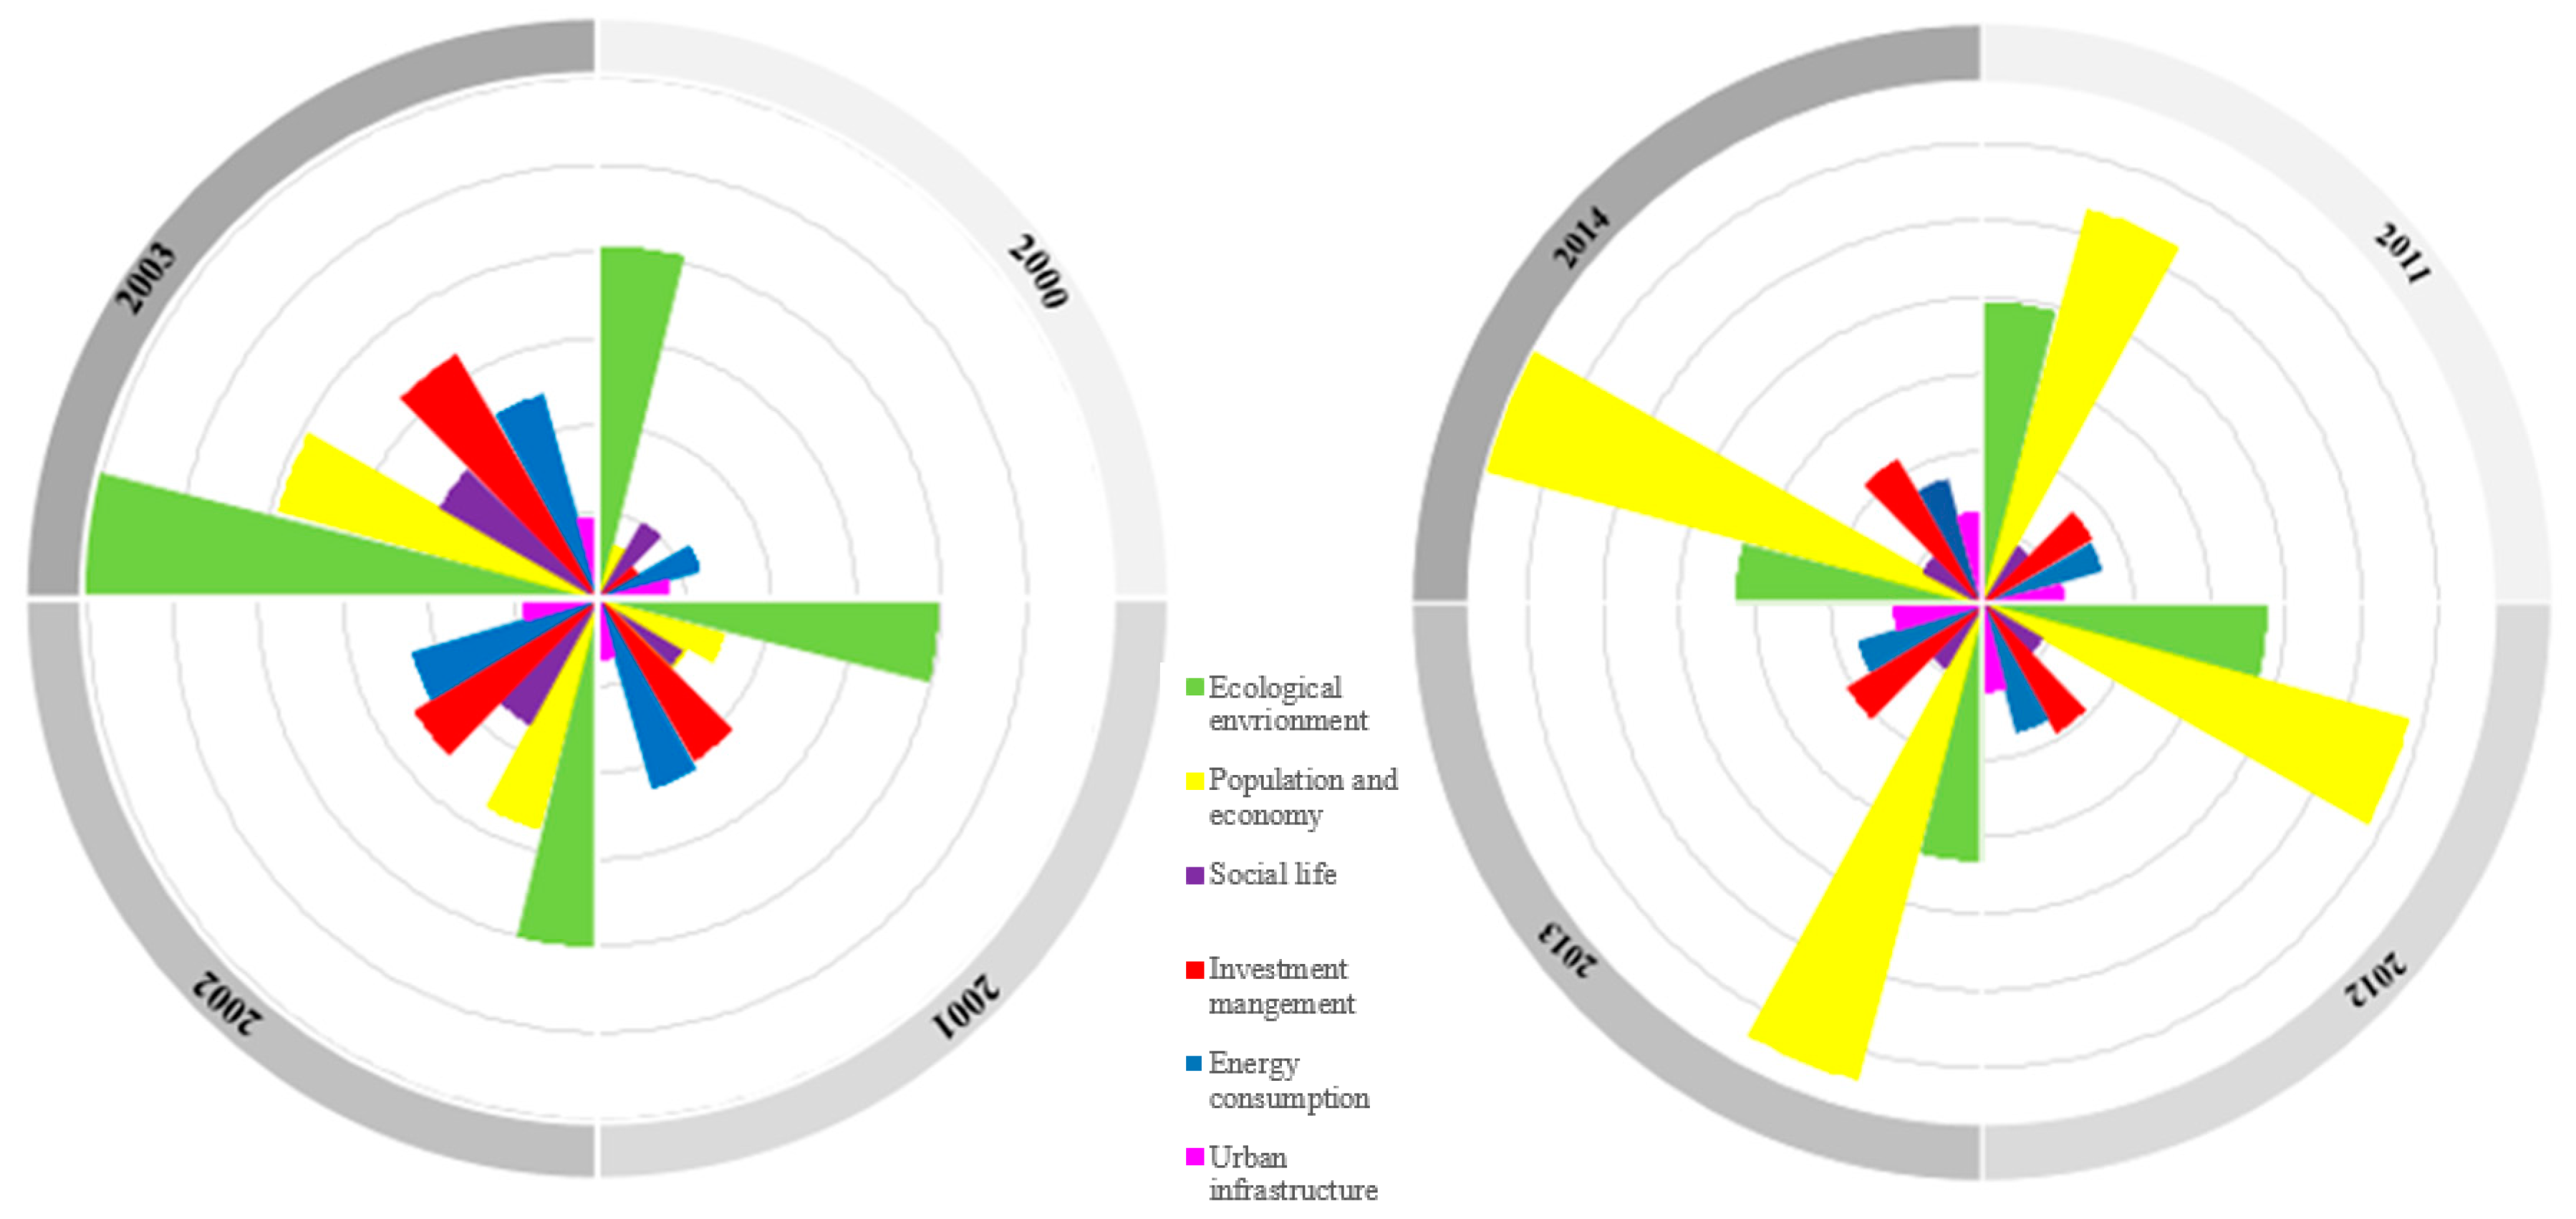
To explain the phenomenon of healthy grade scale dispersion, 40 indicators were redistributed into the following six categories: ecological environment, population and economy, social life, investment management, energy consumption and urban infrastructure. Then, taking four years as a unit, the six interior urban structural indicators were analyzed and compared between the first four years (from 2000 to 2003) and the last four years (from 2011 to 2014), as shown in
Figure 9.
Figure 9 shows the trends in the six indicators from 2000 to 2003 and from 2011 to 2014. The analysis was then based on annual standardized weight values.
- (1)
There was an increasing trend in the ecological environment in the first four years, while it declined in the last four years, but the degree of emphasis on the urban living environment varied in different periods of the year. The ecological environment index was particularly obvious in the last four years (from 2011 to 2014), but it also indirectly indicated that the construction of the ecological environment in Beijing exhibited a downward trend for nearly four years.
- (2)
The values of the population and economic indicators have greatly increased. The very low base value at the beginning of 2000 was the first of the six indicators in 2014, and there was no doubt that Beijing achieved significant growth in labor and economic development over 14 years.
- (3)
The indicators of social life showed an increasing trend in the first four years and the last four years, but the growth rate from 2000 to 2003 was higher than that from 2011 to 2014. Furthermore, the social life index from 2011 to 2014 was lower than that from 2000 to 2003. The indicators of social life, which include a wide range of components, showed different trends in different time periods.
- (4)
Indicators of investment management and indicators of energy consumption showed an increasing trend from 2000 to 2003; these two indicators explained a large proportion of the UGD in 2003, but from 2011 to 2014, they did not grow. It can be speculated that Beijing changed over the 14 years and shifted focus to the change in industrial structure, the importance of education and the management of environmental pollution. Additionally, there was some structural adjustment in the energy and production sectors as well as in consumption.
- (5)
The urban infrastructural indicators maintained relative stability in the study period. The index value of the last four years was higher than the index value of the first four years, but the rate of change was not significant. In terms of the indicators, the construction of city infrastructure was consistent with this trend, but the contrast between infrastructure development and social fairness has not been obvious in the past few years. From the long-term development perspective, there will be some growth and improvement.
The re-division for interior urban indicators was to prove the existence for internal development in Beijing. From these results, it can be concluded that the development of the internal structure of Beijing is not balanced due to the different degrees of development in the following areas: the working lives of urban residents, social welfare, the change in industrial structure, the emphasis on education, the control of environmental pollution, the energy structure and energy consumption. For instance, a government may pay more attention to social and economic development at the expense of the control of environmental pollution and construction (an area may be polluted before environmental pollution is curbed); rapid economic growth may be incompatible with the advancement of industrial production technology (it may be difficult for traditional enterprises to transition); the level of social infrastructure and civic education may not match (garbage collection and recycling may not be completely implemented); and important environmental issues may not have clear technical solutions (haze pollution is difficult to mitigate).
4.6. Policy Implications
Eventually, combined with the conclusion of grey relational analysis and internal structural of urban area, there are some advises for urban development: First, the application of novel, clean energy resources and recycling can reduce the depletion of non-sustainable resources; currently, energy depletion is only decreasing in the industrial sector in China [
42]. However, completely achieving a green city across all sectors and all areas demands such complex reestablishment and reapportionment that the only feasible way to implement green development globally is likely to be a long and enhancive accumulation of local and industry-specific advancements. Second, urban planning is one of the most important policy tools in modern society, and it has been increasingly recognized as an available means to pursue sustainable urban development [
43]. Therefore, urban planning, especially for environmental programs, that is detailed and quantitative should be quickly proposed and be accompanied by an effective assessment to avoid unachievable operational goals. Many threats to sustainable development stem from regulatory failures that not only include simple inadequacies in governmental capacity, most obviously in developing countries [
44]. Meanwhile, maintaining and protecting a holistic environmental system is needed whose development cannot be left to the technocrats alone [
45]. Third, higher education and increased research funding must be committed to future innovation, meaning that technology can be applied to protect the environment and promote healthy urban development. Fourth, environmental protection laws, including national or local standards, are constantly advancing, and the monitoring and evaluation systems are also constantly being updated. Fifth, business is the driver towards sustainability [
46], so in the long run, trade may be the only way to combine economic welfare and global sustainability [
16]. Increased information, changing values, improved management techniques and new technology all operating through the market are the best means to achieve sustainable development, so the needs-oriented approach towards sustainable urban development could be broadened into a vision of overall urban development to improve livelihoods [
47]. Last, natural and social systems behave in nonlinear ways in diverse regions around the world and exhibit marked thresholds in their dynamics, and social-ecological systems act as strongly coupled, complex and evolving integrated systems. Thus, building resilience in social-ecological systems requires structured scenarios and active management to promote learning [
48].
5. Conclusions
In this article, the DPSIR framework and grey-fuzzy comprehensive evaluation was applied to assess the UGD in Beijing. The DPSIR model, which is composed of quantifiable and measurable indicators that are capable of integrating social, economic, environmental and cultural information, supports UGD as a policy response in an urban area. In the present study, 40 individual third-level indicators that can be combined into second-level indicators were chosen, which in turn can be grouped into first-level indicators.
Through the evaluation method, the proportion of resource depletion is the largest; the pressure will increase with the augmentation of resource depletion. At the same time, Beijing can be classified as a resource-consumption metropolis. Whether based on the trend in the growth of the comprehensive indicators of ecological benefits and environmental damage, its municipal development is gradually transitioning to a green development orientation. Therefore, attention should be given to the ecological and environmental aspects, although the overall health of the green development of the city is good. Since Beijing consumes significant resources, it is recommended that the use of new clean energy and energy recycling be encouraged in Beijing's industrial parks and living areas to reduce the consumption of non-sustainable resources.
Based on the analysis in this study, it can be concluded that the highest degree of correlation is among the top ten highest weighted UGD indicators, which indicates that there are six facets to increasing UGD. There are the complex reestablishment and reapportionment of resources at the macro scale of the city state, detailed urban planning at the microcosmic angle of city development, strengthened education and investment in research funding to advance technology, policy interventions to promote environmental quality, the facilitation of business to stimulate industrial reform, and resilience-building and active management in the social-ecological system.
Using a fuzzy comprehensive analysis, it can be concluded that the health of green development is generally improving and was healthy in Beijing from 2000 to 2014. However, within the evaluation period, from 2003 to 2011, there was healthy grade scale dispersion, meaning that the internal structure of the development of the city was imbalanced. The specific indicators can be separated into six aspects. Comparing the numerical values of the indicators for the first four years to the last four years of the evaluation period shows that the development of the internal structure of Beijing is not balanced in aspects such as the work life of the urban residents, social welfare, the change in industrial structure, the degree of education, and the control environmental pollution, as well as the energy structure and energy consumption. Thus, urban internal development should be balanced by improving the work life of urban residents and social welfare, optimizing the industrial structure to eliminate conservative enterprises, attaching greater importance to investment in education and innovation, focusing on environmental pollution control, and improving the energy structure to support new energy policies, etc. and then proposed respond policy implications.
This assessment about the city is mainly to propose a method to evaluation an area green growth, although, and the complicated grey-fuzzy assessment method is suitable for evaluation, the choice of indicators would vary from region to region. This mainly on account of natural geography and social economic characteristics of each distinct, and it can be tailored to local conditions. However, when evaluates the UGD in an area, it still can be considered in these three aspects: resource depletion, environmental damage and ecological benefits. Through the UGD system and evaluation, the policy maker can identify the weak link of green development, then it can make some targeted improvement measures to improve the urban progress and take some references to the future policy formulation. However, green development evaluation of an area is a long-term and arduous task, and to achieve it, UGD will require more than an interdisciplinary or even transdisciplinary view of the world.


