Article

A Model Approach for Yield-Zone-Specific Cost Estimation of Greenhouse Gas Mitigation by Nitrogen Fertilizer Reduction

by
Yusuf Nadi Karatay
1,2,* and
Andreas Meyer-Aurich
1
1
Department of Technology Assessment and Substance Cycles, Leibniz Institute for Agricultural Engineering and Bioeconomy (ATB), Max-Eyth-Allee 100, 14469 Potsdam, Germany
2
Faculty of Life Sciences, Humboldt-Universität zu Berlin, Invalidenstraße 42, 10115 Berlin, Germany
*
Author to whom correspondence should be addressed.
Sustainability 2018, 10(3), 710; https://doi.org/10.3390/su10030710
Submission received: 19 December 2017 / Revised: 2 March 2018 / Accepted: 3 March 2018 / Published: 6 March 2018
(This article belongs to the Special Issue Economics of Climate Smart Agriculture)

Abstract

:
Nitrogen use in agriculture has been intensified to feed the growing world population, which led to concerns on environmental harms, including greenhouse gas emissions. A reduction in nitrogen fertilization can abate greenhouse gas emissions, however, it may result in crop yield penalties and, accordingly, income loss. Assessment tools are necessary to understand the dynamics of nitrogen management issues both in environmental and economic aspects and both at low and high aggregation levels. Our study presents a model approach, estimating yield-zone-specific costs of greenhouse gas mitigation by moderate reduction of mineral nitrogen fertilizer application. Comparative advantages of mitigating greenhouse gas emissions by nitrogen fertilizer reduction were simulated for five yield-zones with different soil fertility in the state of Brandenburg, Germany. The results suggest that differences in yield response to nitrogen fertilizer lead to considerable differences in greenhouse gas mitigation costs. Overall cost-efficiency of a regional greenhouse gas mitigation by nitrogen fertilizer reduction can be substantially improved, if crop and yield-zone-specific yield responses are taken into account. The output of this study shall help to design cost-efficient agro-environmental policies targeting with specific crop yield response functions at different sites.

1. Introduction

Nitrogen (N) use in agriculture is of concern due to the dilemma of agricultural intensification to cope with the global food demand and the efforts to reduce emission of reactive N, which is one of the vital environmental challenges [1]. To feed the growing world population, mineral N fertilizer production and application have grown ten-fold in the second half of the last century [2]. Every kg of mineral N fertilizer application increases the global stock of reactive N which keeps partly circulating (i.e., manure recycling) in agricultural systems. Increasing use of N fertilizers causes impacts on soil, air, water, biodiversity and climate change [3]. The application of mineral N fertilizers is the biggest source of global anthropogenic N2O emissions [4] which are the fastest growing source of agricultural greenhouse gas (GHG) emissions [5]. N2O emissions are expected to rise further and this may offset GHG mitigation efforts from other sectors [6]. At farm level, more than half of GHG emissions generated in crop production originate from N fertilizer application [7,8]. Besides, production of fertilizers is an energy intensive process that is responsible for a considerable amount (0.6–1.2%) of total GHG emissions worldwide [9] with the highest contribution from N fertilizer production [10]. Thus, if emissions due to mineral N fertilizer production were accounted for, in addition to N2O emissions due to application, the importance of N fertilizer in total agriculture induced GHG emissions would be even higher [11].
Measures to tackle the N use dilemma mainly focus on how to achieve more efficient N use [7,12]. However, it is particularly challenging to increase N use efficiency, since reactive N is bound and cycled in various chemical pathways in agricultural soils [3] and easily distributed by hydrologic and atmospheric transportation [13]. Roughly half of the N added into agricultural systems in Europe is lost to the surrounding environment [3]. Facing the high impact of N fertilizer use on the environment and especially global warming, reduction of N fertilizer seems to be an effective GHG mitigation measure. Reduction in N fertilizer related GHG emissions can be achieved by changing input management or change in cropping systems (selection of crops with lower N input). A direct reduction of N input supply into agricultural systems is an obvious mitigation measure which was suggested 20 years ago (e.g., Kroeze [14]). Denmark implemented an N input quota system in the early 1990s setting norms for the N fertilization equal to the economic optimum N rate which was subject to further reduction up to 15% below the economic optimum [15]. Furthermore, GHG mitigation options based on N input management were often suggested as technological approaches such as variable rate technology in precision farming [16,17]. While the acceptance level of such technologies still remains in a tardy progress at the global scale [18], the returns of investments in precision farming technologies are often low [19,20]. One reason for the limited economic returns of precision farming practices is the flatness of profit functions around the assumed economic optimum [21]. However, flat profit functions also provide an opportunity to reduce N input and thus associated GHG emissions, without affecting farm profitability heavily. In the same vein, McSwiney & Robertson [22] stated that mitigation of N2O emissions by N fertilizer reduction could be achieved without causing a strong yield penalty. Furthermore, Meyer-Aurich et al. [23] reported that a moderate reduction of N fertilizer can be an effective measure to lower GHG emissions; and such straightforward N fertilizer reduction—without any technology investment—requires more attention as an alternative to mitigate GHG emissions in agriculture.
N fertilizer reduction has been considered from GHG mitigation point of view at different scales. For instance, Domínguez et al. [24] evaluated the EU-wide implications of a reduction in N fertilizer input—while maintaining output constant—via eliminating assumed over-fertilization and/or achieving more balanced N fertilizer management between mineral and organic N fertilization. Mérel et al. [25] assessed the effects of an N fertilizer tax on N mitigation at the intensive (input intensity adjustments) and extensive margins (acreage reallocation) at the regional scale. While there is information at aggregated levels in terms of to what extent and at what costs N fertilizer reduction offers GHG mitigation potentials, there is little information on cost-efficient GHG mitigation at different sites considering different yield responses to stepwise reduction of N fertilization. Such indication of GHG mitigation costs could enable comparability of GHG mitigation potentials by N fertilizer reduction among sites, since site-dependent climate and soil characteristics result in differences in crop yield potentials which in turn may lead to different GHG mitigation costs. This was already shown for GHG mitigation potentials and costs of biogas production in Brandenburg, if different feedstock are grown at sites with different yield potentials [26].
In terms of N fertilizer, yield and GHG interactions, the first step towards understanding site-dependent GHG mitigation potentials and opportunity costs of reducing N supply would be to understand crop yield response to N fertilizer reduction. On the one hand, reduction in N fertilization abates GHG emissions—first, due to reduced energy demand for less N fertilizer production and secondly because of fewer N inputs into agricultural soils, resulting in fewer N2O emissions. On the other hand, it can be expected that yield penalties occur, which may be a major constraint for farmers to reduce N fertilizer [27]. The magnitude of yield penalty depends on yield response to reduced N application. Thus, cost estimation of GHG mitigation by N fertilizer reduction requires the estimation of GHG mitigation potential and thereby the economic returns of reduced N fertilization. While the former can be estimated by means of emission factors per kg N input, the latter requires the identification of production functions relating crop yield to N fertilizer application. Yield response functions can be estimated on the basis of long-term field experiments; however, such empirical data do not exist for all crops at all sites. In this context, this study aims to identify the comparative advantage of different sites (yield-zones) in Brandenburg with specific crop yield responses to N fertilizer to mitigate GHG by N fertilizer reduction. Hanff & Lau [28] suggested yield-zone-specific N fertilizer rates but information on yield-zone-specific response to reduced N supply is not available. Therefore, we estimated yield-zone-specific response functions based on a normalization approach [29], which enables transferring yield response to N fertilizer from sites with empirical data to the yield-zones lacking that information. The normalization approach was applied in earlier studies addressing environmental issues regarding N use in agriculture [30,31,32]. For instance, Baudoux [31] evaluated environmental and economic implications of a complete renunciation of mineral N fertilization. However, to our knowledge the comparative advantages of specific sites to mitigate GHG emissions by moderate N fertilizer reduction have not been shown yet.
In this context, our paper presents a model approach to estimate yield-zone-specific costs of GHG mitigation by mineral N fertilizer reduction. In addition, it provides a basis to analyse implications of different GHG mitigation policies on N fertilizer reduction, e.g., N fertilizer tax, incentives, or N fertilizer cap. The output of this study has potential to contribute as an aiding tool to identify cost-efficient agro-environmental policies.

2. Materials and Methods

2.1. Methodological Concept

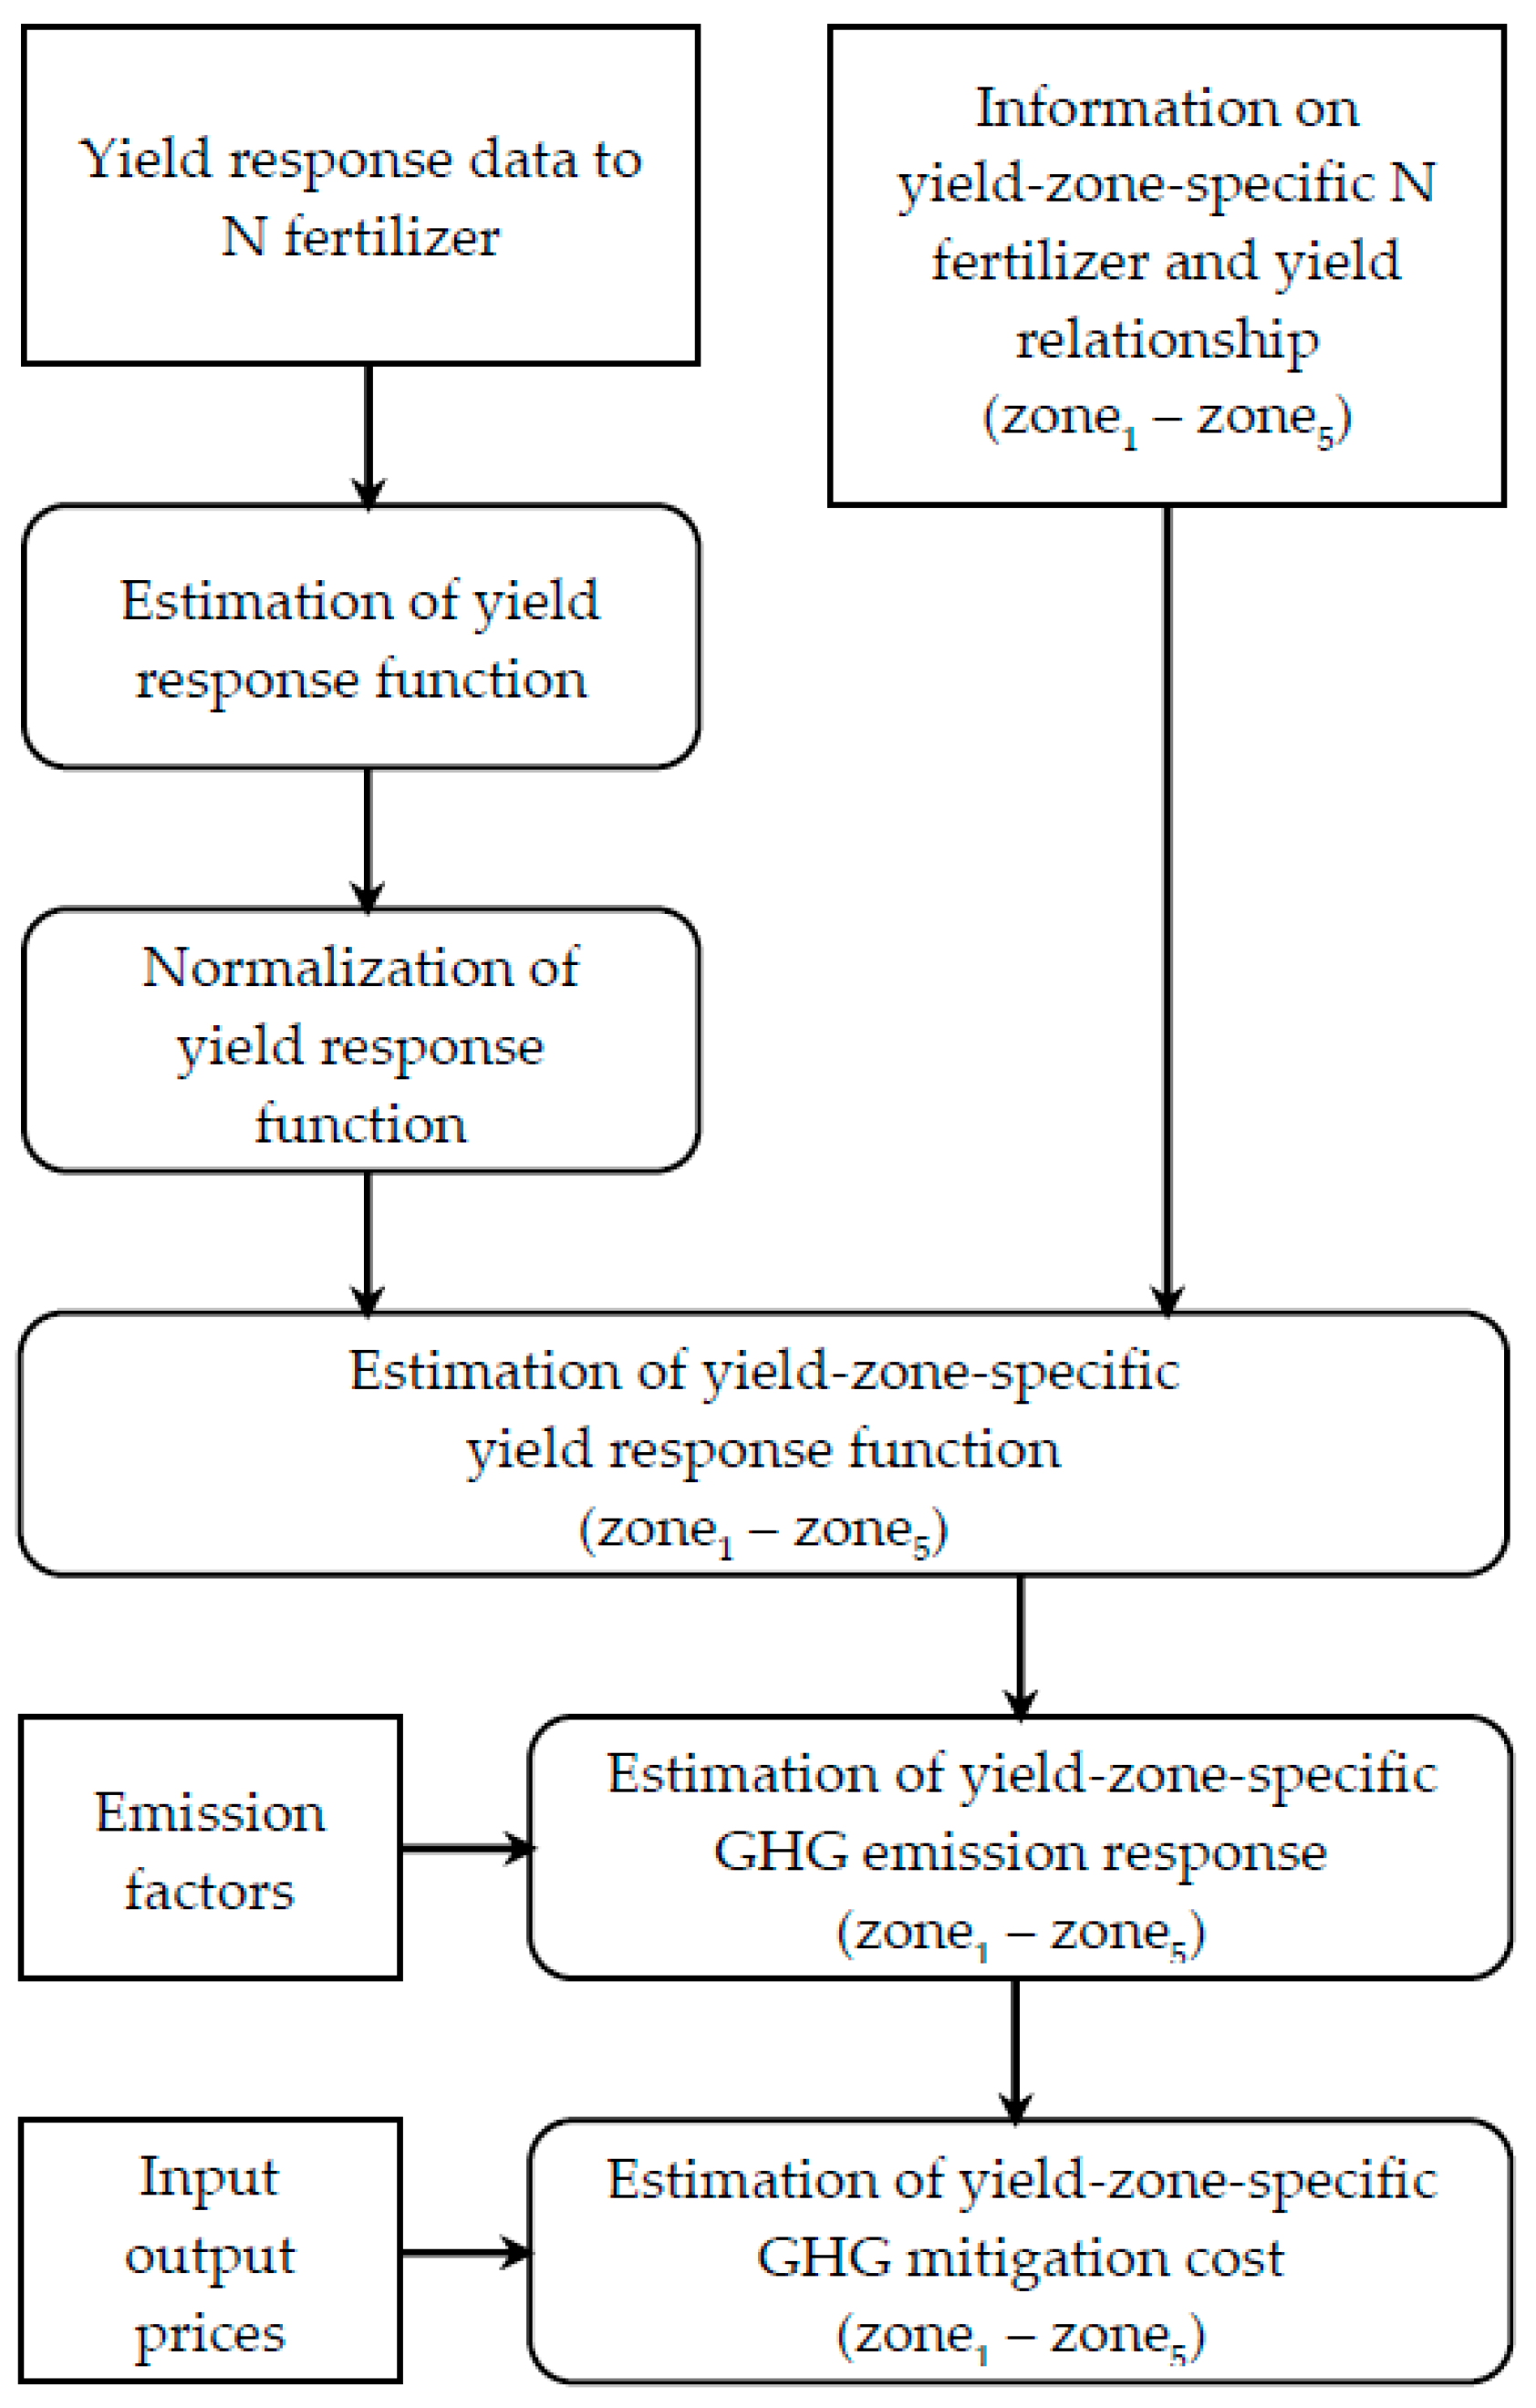
We constructed a model which reflects yield and economic response to N fertilizer reduction in yield-zones with different yield potentials in order to identify comparative advantages for GHG mitigation. A normalization approach following Krayl [29] was employed to transfer yield response to N fertilizer from sites with known input-output relations to yield-zones lacking that information. The workflow of the methodological approach is shown in Scheme 1.
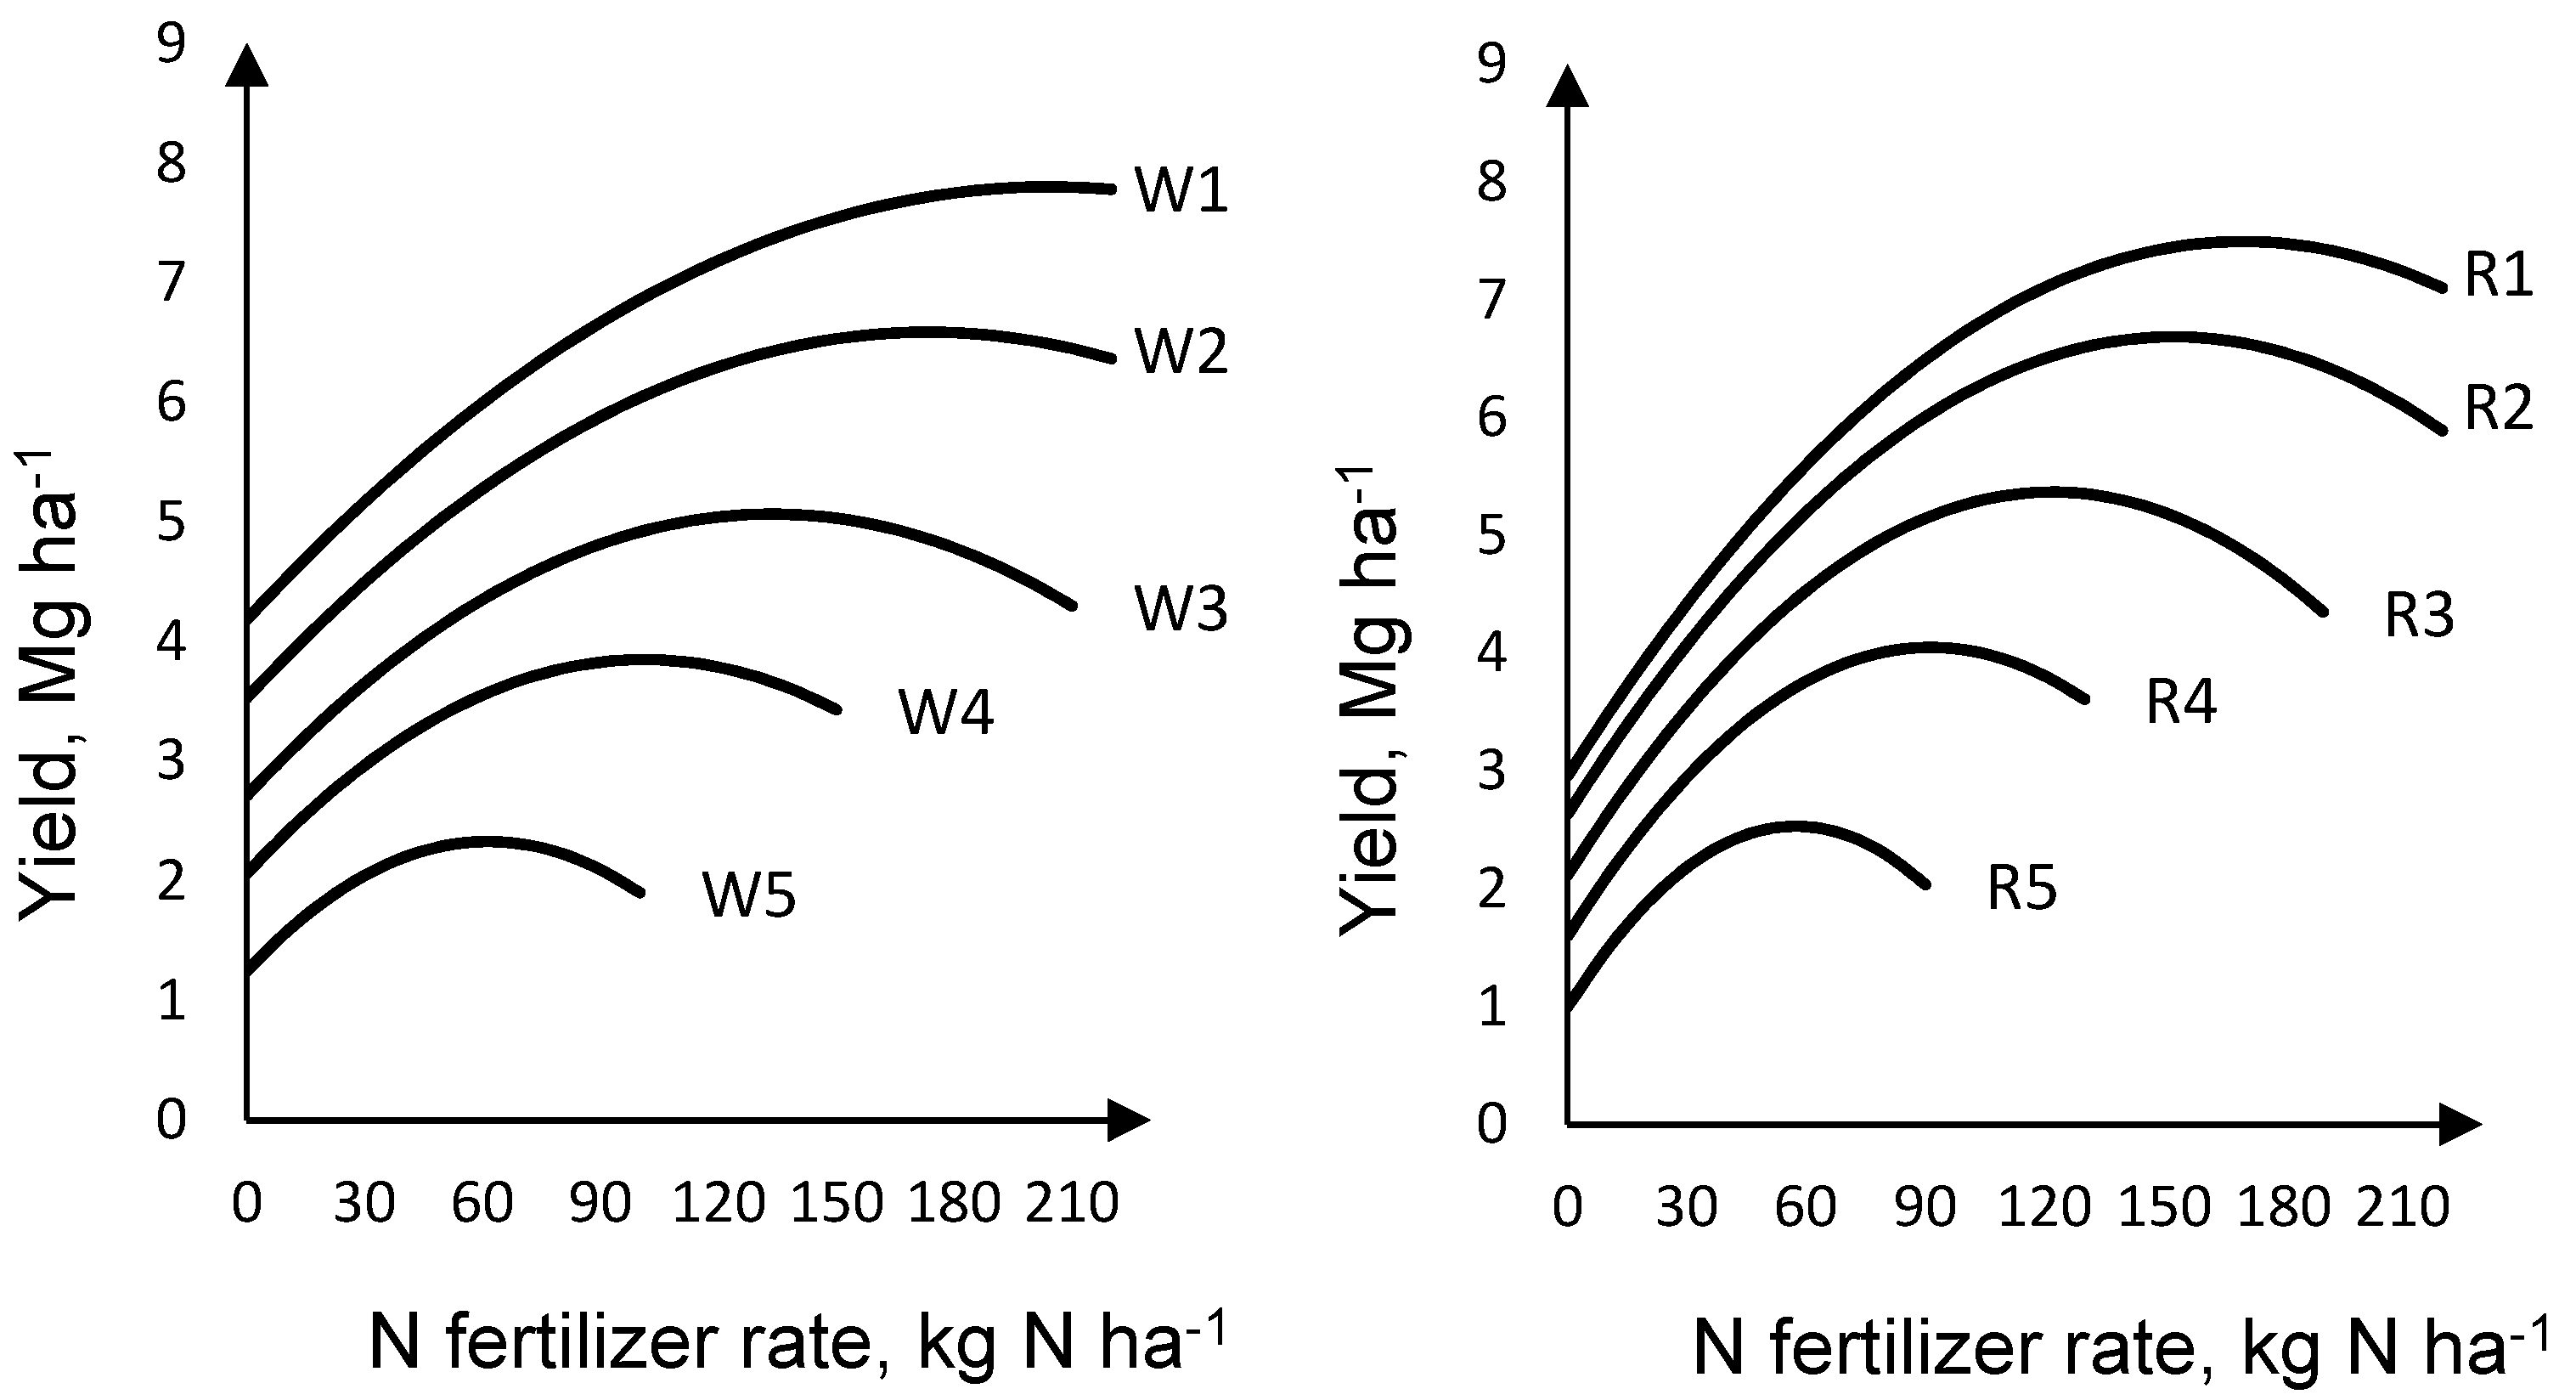
We applied our model to estimate winter wheat (further referred to as wheat) and winter rye (further referred to as rye) yield response to N fertilizer reduction in five yield-zones in the state of Brandenburg, Germany. Wheat and rye are dominant cereals in Brandenburg, while wheat is grown predominantly in high yield-zones, rye is grown rather in low yield-zones. Therefore, modelling both cereals with respect to GHG mitigation potentials provides representation of all possible yield-zones in the region, and, thus respective comparative advantages.
Yield response functions with respect to N fertilizer were estimated based on long-term experiments for wheat and rye (see Section 2.2) and transferred by the normalization approach to the five yield-zones in Brandenburg (see Section 2.3). Yield-zone-specific yield response functions were estimated to provide the base for the subsequent estimations of GHG emission response to N fertilizer reduction (see Section 2.3). Costs of yield-zone-specific GHG mitigation were estimated combining N fertilizer reduction induced GHG mitigation (see Section 2.4) with the economic returns (see Section 2.5). In addition, an uncertainty analysis was executed to identify the most influential parameters on and the ranges of GHG mitigation costs by N fertilizer reduction (see Section 2.6). Considering a constant regional demand for wheat and rye, we applied a system expansion to include possibly emerging GHG emissions by offsetting yield penalties due to N fertilizer reduction (see Section 2.7). Furthermore, we conducted a case study on regional optimization of GHG mitigation by N fertilizer reduction in wheat and rye production in Brandenburg (see Section 2.8).

2.2. Data

Empirical data on crop yield response to N fertilizer were taken from two long-term experiments located in north-eastern Germany (Table 1). Data for wheat (Triticum aestivum L.) yield response were taken from 1986 until 1999 in Dahlem [33]; and for rye (Secale cereal L.) yield response from 1996 until 2010 in Thyrow [34]. The annual average precipitations were 545 mm and 495 mm and the annual average temperatures were 9.3 °C and 8.9 °C for Dahlem and Thyrow, respectively. The experiments were designed with various fertilizer treatments. For wheat, four different mineral N fertilizer application rates were used. Wheat was in rotation with barley (Hordeum vulgare L.) and potato (Solanum tuberosum L.) and 30 t of farmyard manure was applied on potato cultivation in the rotation triennially. For rye, three different mineral N fertilizer application rates were used; and rye was in rotation with winter barley (Hordeum vulgare L.), oil seed rape (Brassica napus L.), cocksfoot (Dactylis glomerata L.) and potato. The rotation received organic fertilizer as straw after harvesting winter barley and rye.
Information on yield and N fertilizer relationships in the yield-zones were derived from Hanff & Lau [28]. They provided input-output patterns including yield potentials and N fertilization rates for five differentiated yield-zones in Brandenburg. Yield-zones are categorized based on a soil fertility index where yield-zone-1 has the highest and yield-zone-5 has the lowest yield potential. We assumed that the data on N fertilizer can be interpreted as the recommended N fertilizer intensity to reach an expected economic optimum yield level in respective yield-zone. Table 2 presents yield-zone-specific N fertilization rates and corresponding yield levels.

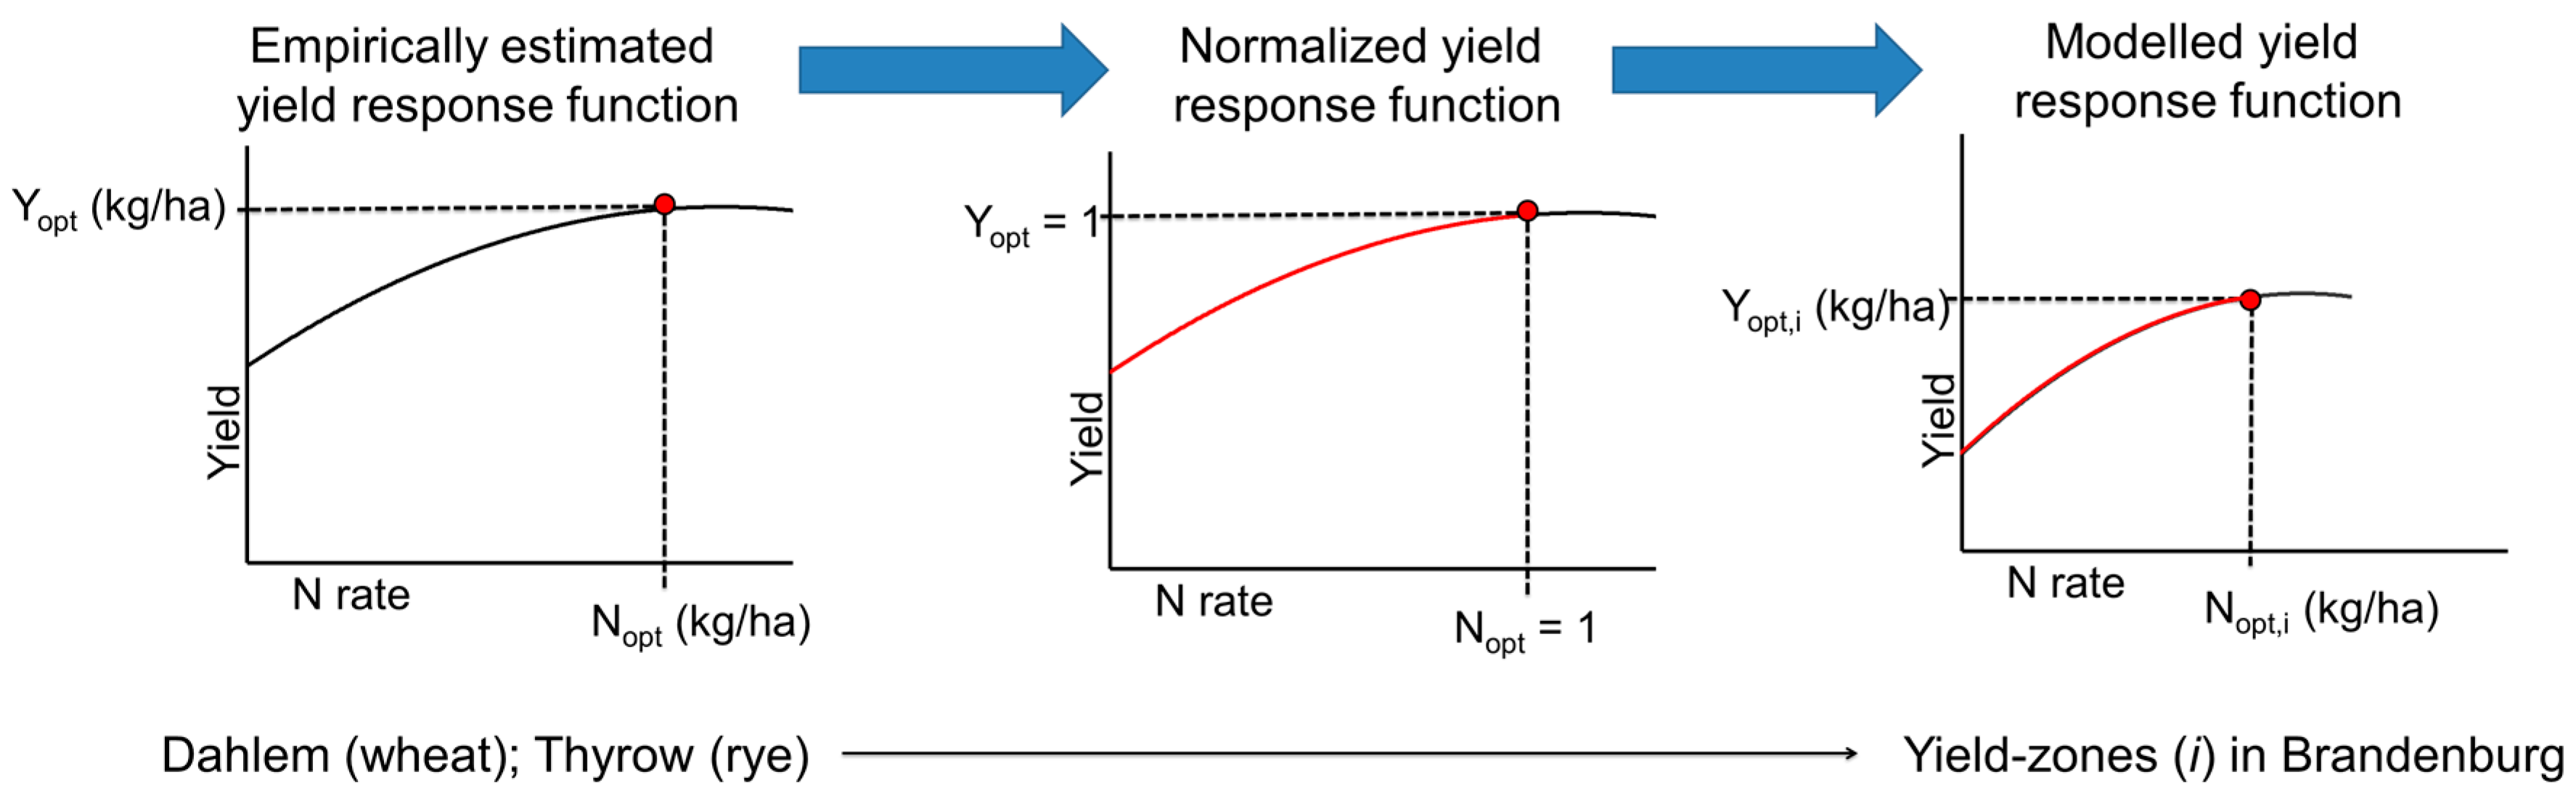
2.3. Estimation of Yield-Zone-Specific Yield Response Functions

Yield-zone-specific yield response functions were modelled in three steps: (i) estimation of yield response functions based on the empirical data; (ii) transforming them by the normalization approach and (iii) transferring the normalized yield response functions to the yield-zones in Brandenburg (Figure 1).
Quadratic polynomial functions were estimated by ordinary least square method (Equation (1)) using the data on crop yield response to N fertilizer for wheat and rye from the considered long term field experiments (Dahlem and Thyrow). Meyer-Aurich et al. [35] reported that quadratic functions showed the best statistical fit for wheat yield response to N fertilizer. Nonetheless, functional specification of yield response to N fertilizer does not have a strong impact on economic assessments [36].
Y = a N 2 + b N + c
where Y is yield (Mg ha−1), N is N fertilization rate (kg N ha−1), a is the quadratic coefficient, b is the linear coefficient and c is a constant.
We deployed the normalization approach transforming the above-mentioned crop specific polynomial function to build crop specific yield response functions for each of the five yield-zones in Brandenburg (Equation (2)).
Y = a i N 2 + b i N + c i
where i denotes yield-zone.
For the transfer of yield response functions, reference points of both sites were required and all quantities of yield and N rate were subject to be relative to these reference points. We used economic optimum N rate and corresponding yield level as reference points in the normalization approach. Economic optimum fertilizer rate maximizes profit and was found by solving the first order derivation of the yield response function. At the economic optimum N rate (Nopt), marginal product is equal to the input-output price ratio (PN/PY) (Equations (3)–(5)). The economic optimum N rates and the corresponding yields (Yopt) were calculated using coefficients of respective yield response functions for wheat and rye at fixed price ratio (5.96 € kg−1 N/€ kg−1 wheat; 7.80 € kg−1 N/€ kg−1 rye) of N fertilizer (input) and crops (output).
d Y o p t d N o p t = P N P Y
d Y o p t d N o p t = 2 a N o p t + b
N o p t = P N P Y b 2 a
The coefficients of the normalized production function were derived from the coefficients of the empirically estimated yield functions a, b, c (in Equation (1)) for wheat from Dahlem and rye from Thyrow; and transformed into (Equation (6)) where Ynorm is the normalized production function with normalized N application rate (Nnorm) and normalized coefficients anorm, bnorm and cnorm.
Y n o r m = a n o r m N n o r m 2 + b n o r m N n o r m + c n o r m
Ynorm was defined as Y divided by Yopt and Nnorm was found as N divided by Nopt. By using these relations, Equation (1) was reformulated as:
Y o p t Y n o r m = a N o p t 2 N n o r m 2 + b N o p t N n o r m + c
By dividing Equation (7) by Yopt, we re-arranged the equation and generated Ynorm function as:
Y n o r m = ( a N o p t 2 Y o p t ) N n o r m 2 + ( b N o p t Y o p t ) N n o r m + c Y o p t
From Equation (8), we identified normalized coefficients (Equations (9)–(11)) by comparing Equation (8) with Equation (6):
a n o r m = a N o p t 2 Y o p t
b n o r m = b N o p t Y o p t
c n o r m = c Y o p t
Once the empirically estimated yield response functions were transformed into normalized yield response functions, they were transferred to the yield-zones of Brandenburg, where only Nopt and Yopt were known. We transferred the normalized yield response functions for wheat and rye to the five yield-zones in Brandenburg. Following the assumption of the normalization approach, the second-degree derivations of the normalized yield response functions at respective Nopt points were equal (Equation (12)).
Y n o r m = Y n o r m _ i
Given this assumption, we calculated the quadratic coefficient of respective yield-zone in Brandenburg as follows:
a i = a n o r m Y o p t _ i N o p t _ i 2
After the quadratic coefficient of the yield response function of the yield-zones was determined based on the normalization approach, we calculated the linear coefficient derived from Nopt calculation in Equation (5):
b i = P N P Y 2 a i N o p t _ i
Once quadratic (a) and linear (b) coefficients of the production function of each yield in Brandenburg were determined, we calculated the constant (c) given the economic optimum N rate (Nopt_i), the yield (Yopt_i) at Nopt_i and the prices of input and output based on Equation (2):
c i = a i N o p t _ i 2 b i N o p t _ i + Y o p t _ i
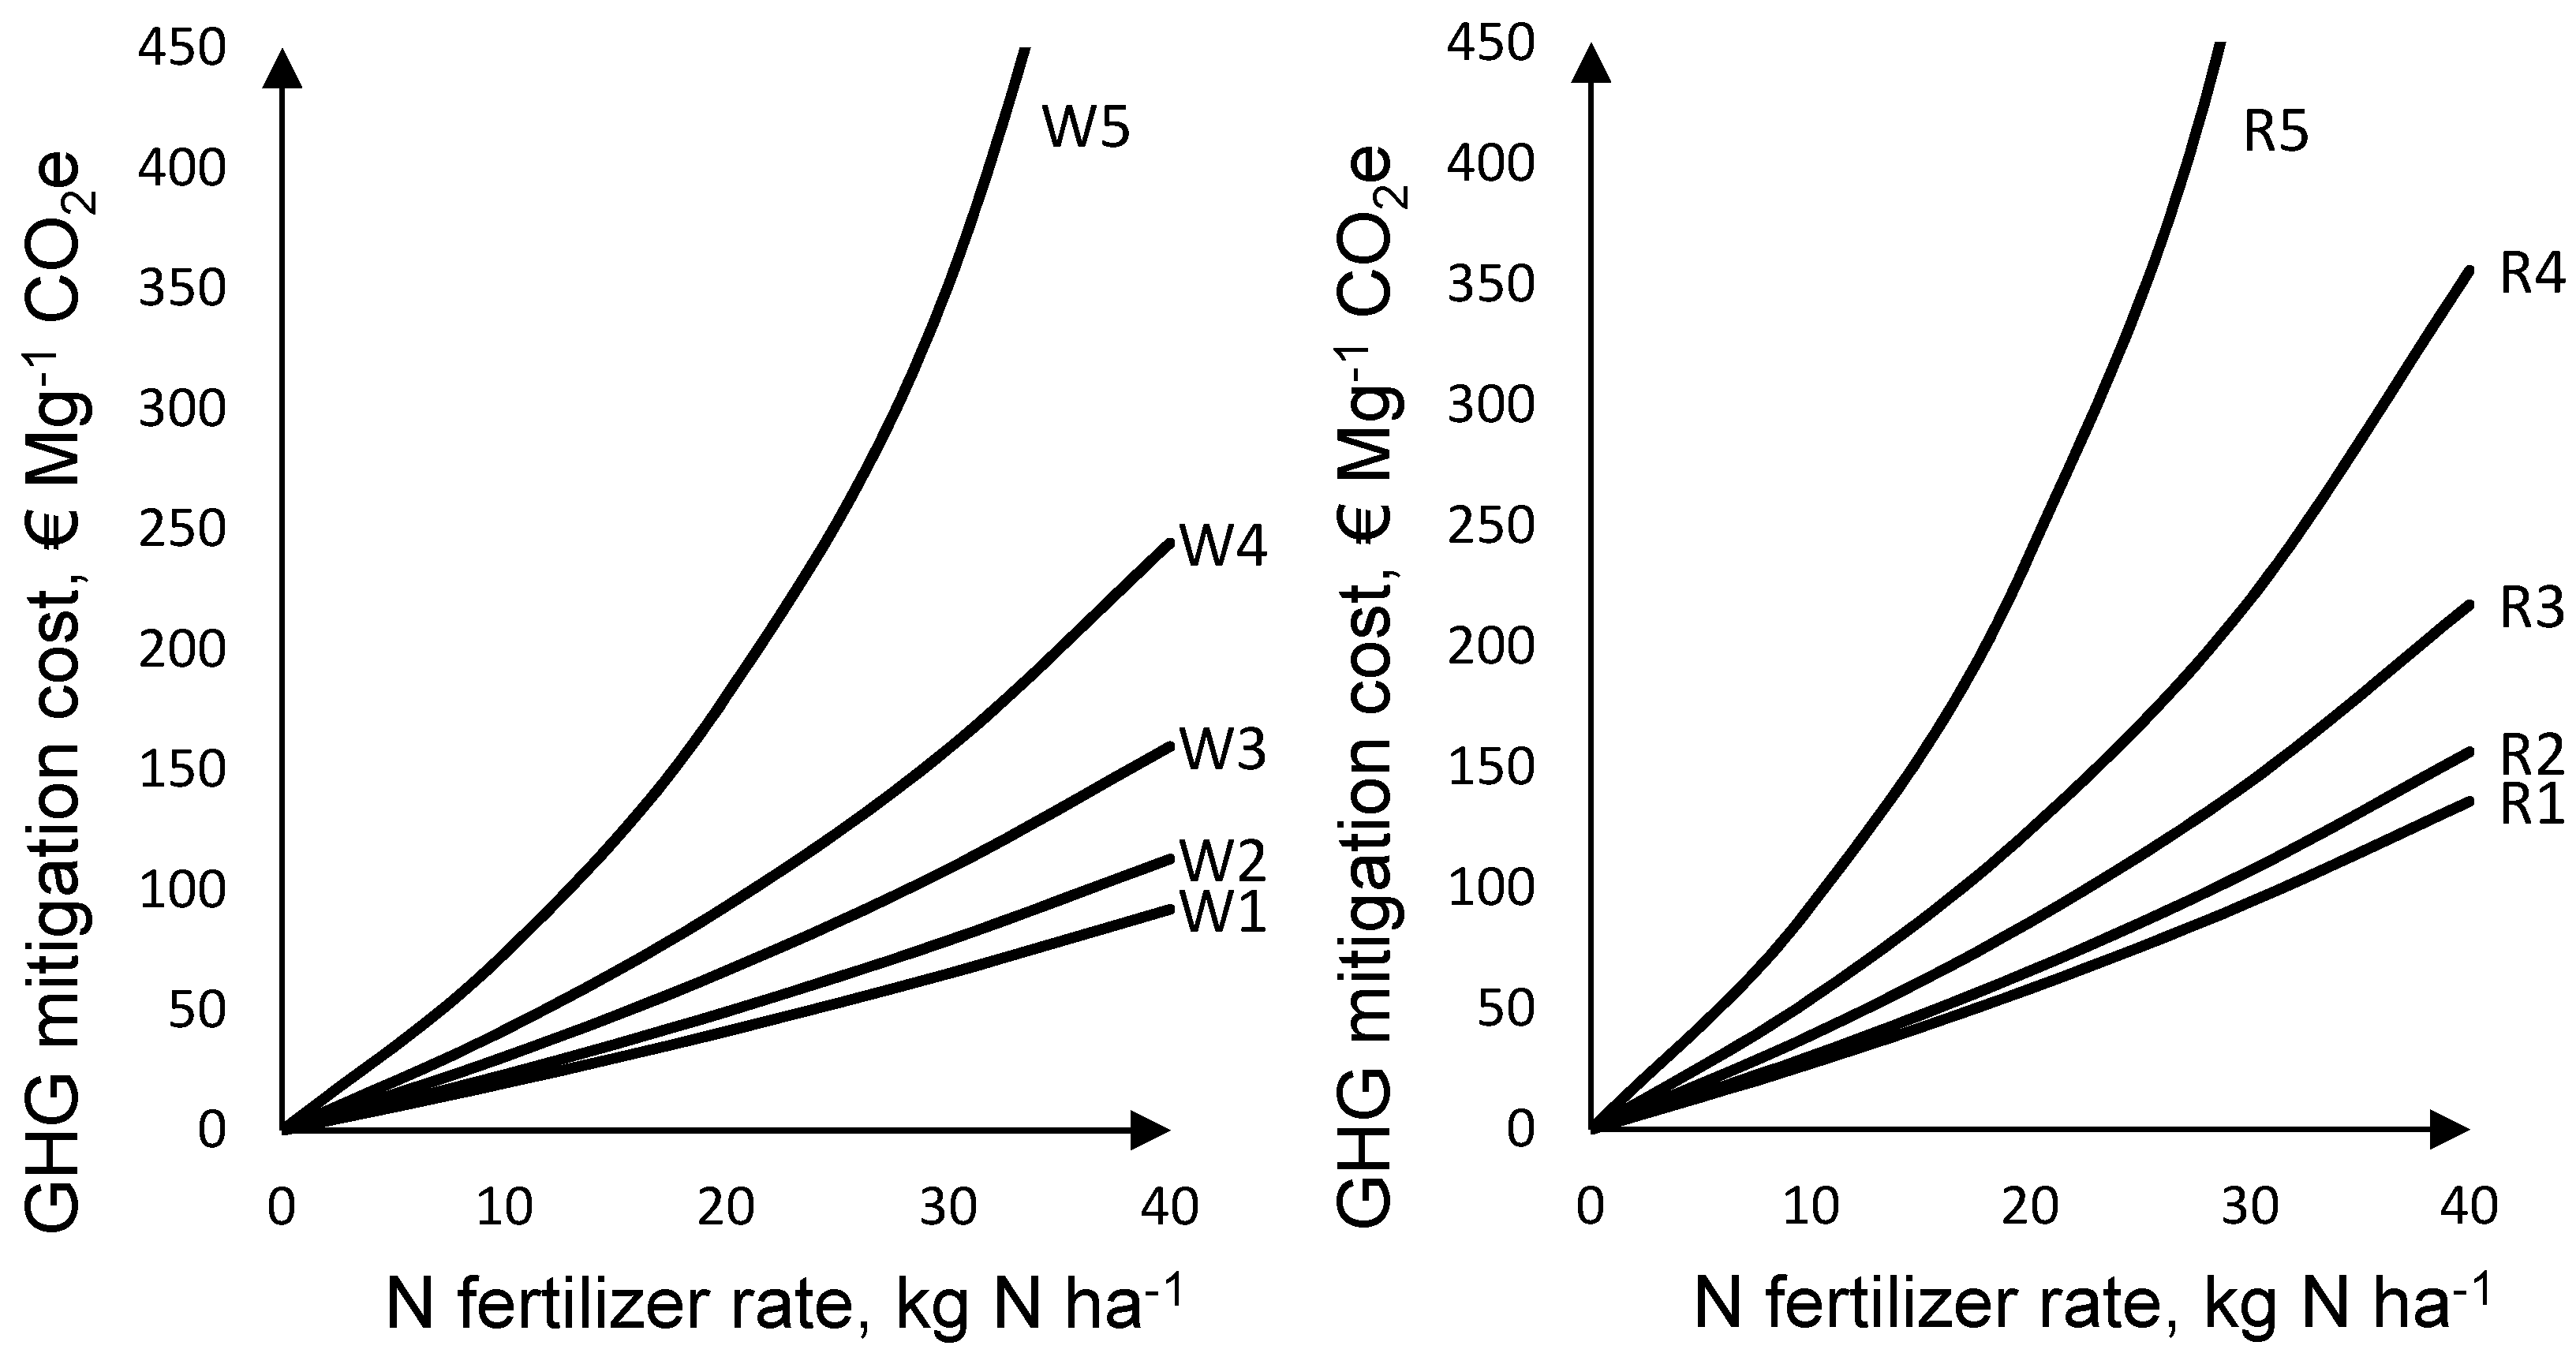
Following normalization of the yield response functions based on the empirical data and transformation of the normalized functions into five different yield-zones in Brandenburg, yield response functions for wheat and rye in each yield-zone were constructed. Consequently, yield response on adjusted N fertilization intensities could be drawn in differentiated yield-zones, so that yield-zone-specific marginal GHG mitigation costs could be identified accordingly.

2.4. Partial Budgeting of GHG Emissions of N Fertilizer

For the partial budgeting of GHG emissions, we included direct and indirect N2O emissions due to mineral N fertilizer application and CO2 emissions generated due to mineral N fertilizer production. Calcium ammonium nitrate (CAN) with 27% N content was chosen as the mineral N fertilizer type which is commonly used in Brandenburg. It was assumed that no manure was applied to fields of wheat and rye and above-ground crop residues were removed from fields. Change in below-ground biomass was ignored, since root biomass was expected to be only marginally affected by moderate adjustments of N fertilization. Table 3 shows the emission factors considered in the calculation. N2O emissions were estimated according to the Intergovernmental Panel on Climate Change (IPCC) guideline [37].
Direct N2O emissions considered in this study included N2O emissions occurring due to N mineralization directly from soil where N fertilizer was applied to. Indirect emissions considered consist of N2O emissions via volatilization, leaching and runoff of N added. N2O emissions were converted into CO2e according to the global warming potential (GWP) as reported in [38]. The 100-year GWP (298) was applied for the conversion. For the GHG emissions regarding the production of N fertilizer (CAN), the average of European production technology was taken according to Bentrup & Palliere [8]. The total emission factor (EFTotal) including production and application of mineral N fertilizer added up to 9.91 kg CO2e kg−1 N. GHG emissions (GHGi,c) of mineral N fertilization in each yield-zone (i) were calculated according to Equation (16).
G H G i , c = ( E F D + E F V + E F L + E F P )   N i , c
Total GHG emissions (GHGi,c; kg CO2e ha−1) of mineral N fertilization (Ni,c) were calculated for each yield-zone (i) and crop (c) using emission factors EFD (emission factor for direct N2O emissions; kg CO2e kg−1 N), EFV (emission factor for volatilization of N2O; kg CO2e kg−1 N), EFL (emission factor of leaching and runoff; kg CO2e kg−1 N) and EFP (emission factor for CAN production; kg CO2e kg−1 N).

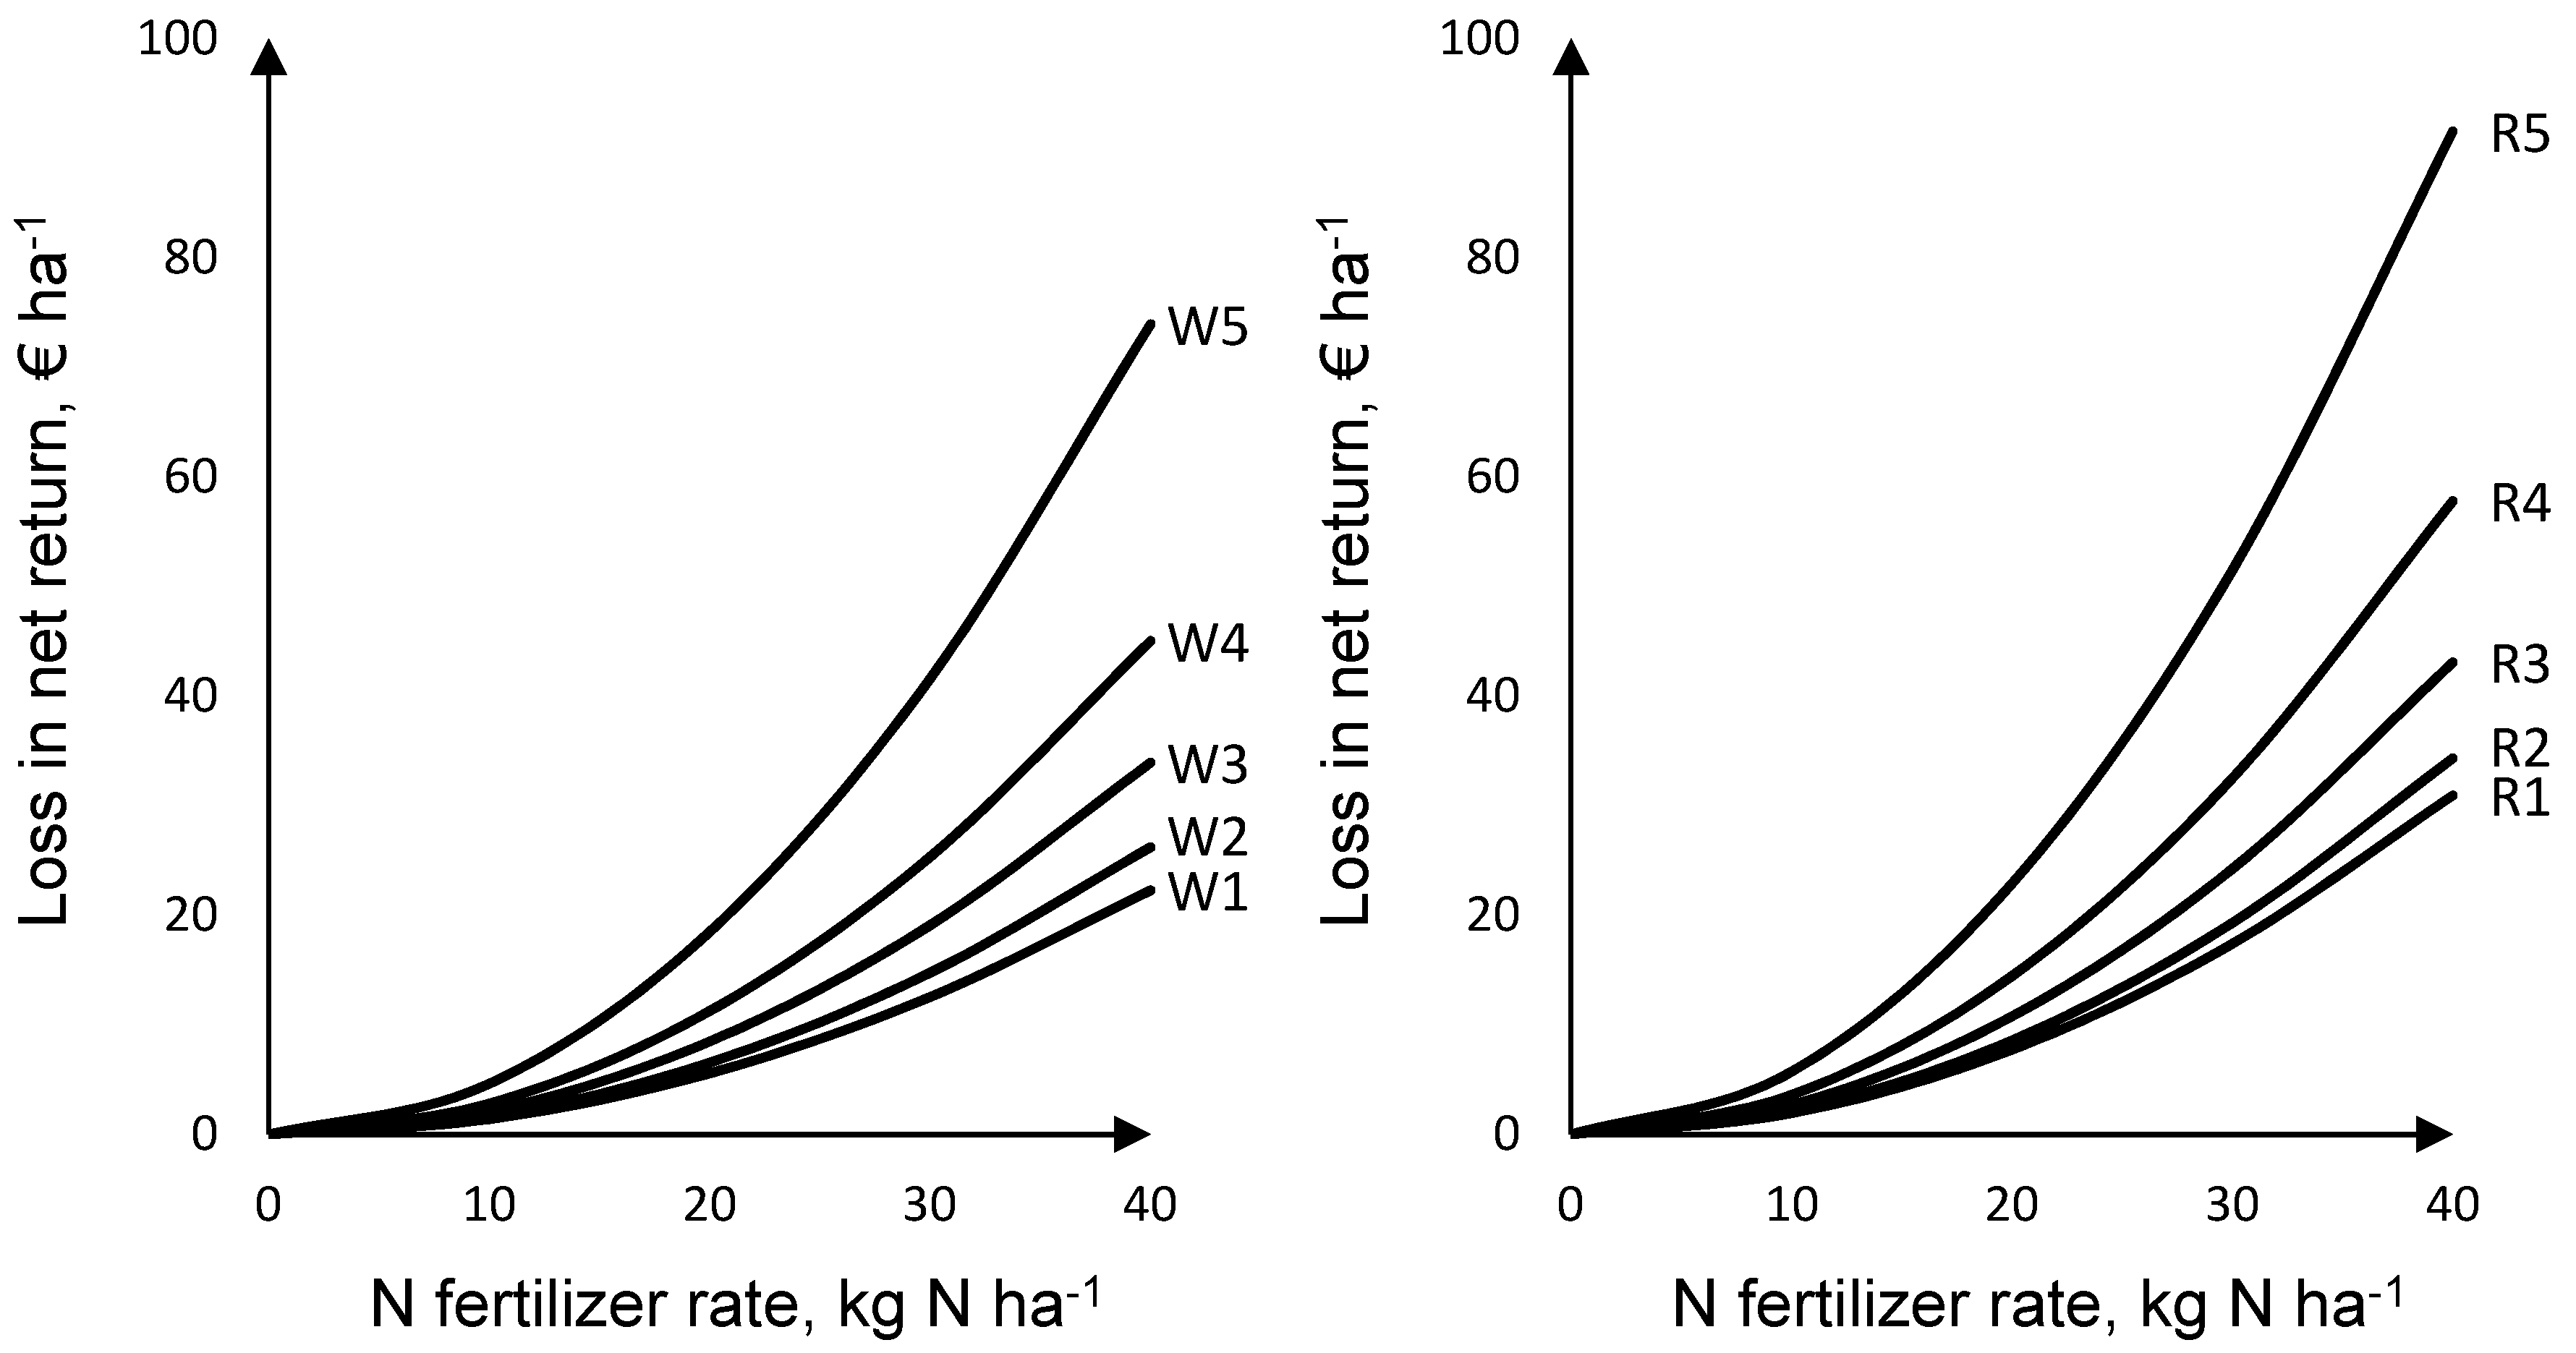
2.5. Net Return over N Fertilizer and Yield-Zone-Specific GHG Mitigation Cost Functions

In our calculation for net return, we performed a partial budgeting. N fertilizer was the only production factor that was adjusted affecting yield. Net return over N fertilizer applied (€ ha−1) was calculated as the difference between revenue of crop sales and cost of N fertilizer applied (Equation (17)). Table 4 presents the prices of N fertilizers and crops considered in this study.
N R i , c = P Y Y i , c P N N i , c
where NRi,c—Net return, PY—Price of crop (€ Mg−1), Yi,c—Yield (Mg ha−1), PN—Price of N fertilizer (€ kg−1 N), Ni,c—N fertilizer rate (kg N ha−1), i—Yield-zone and c—Crop.
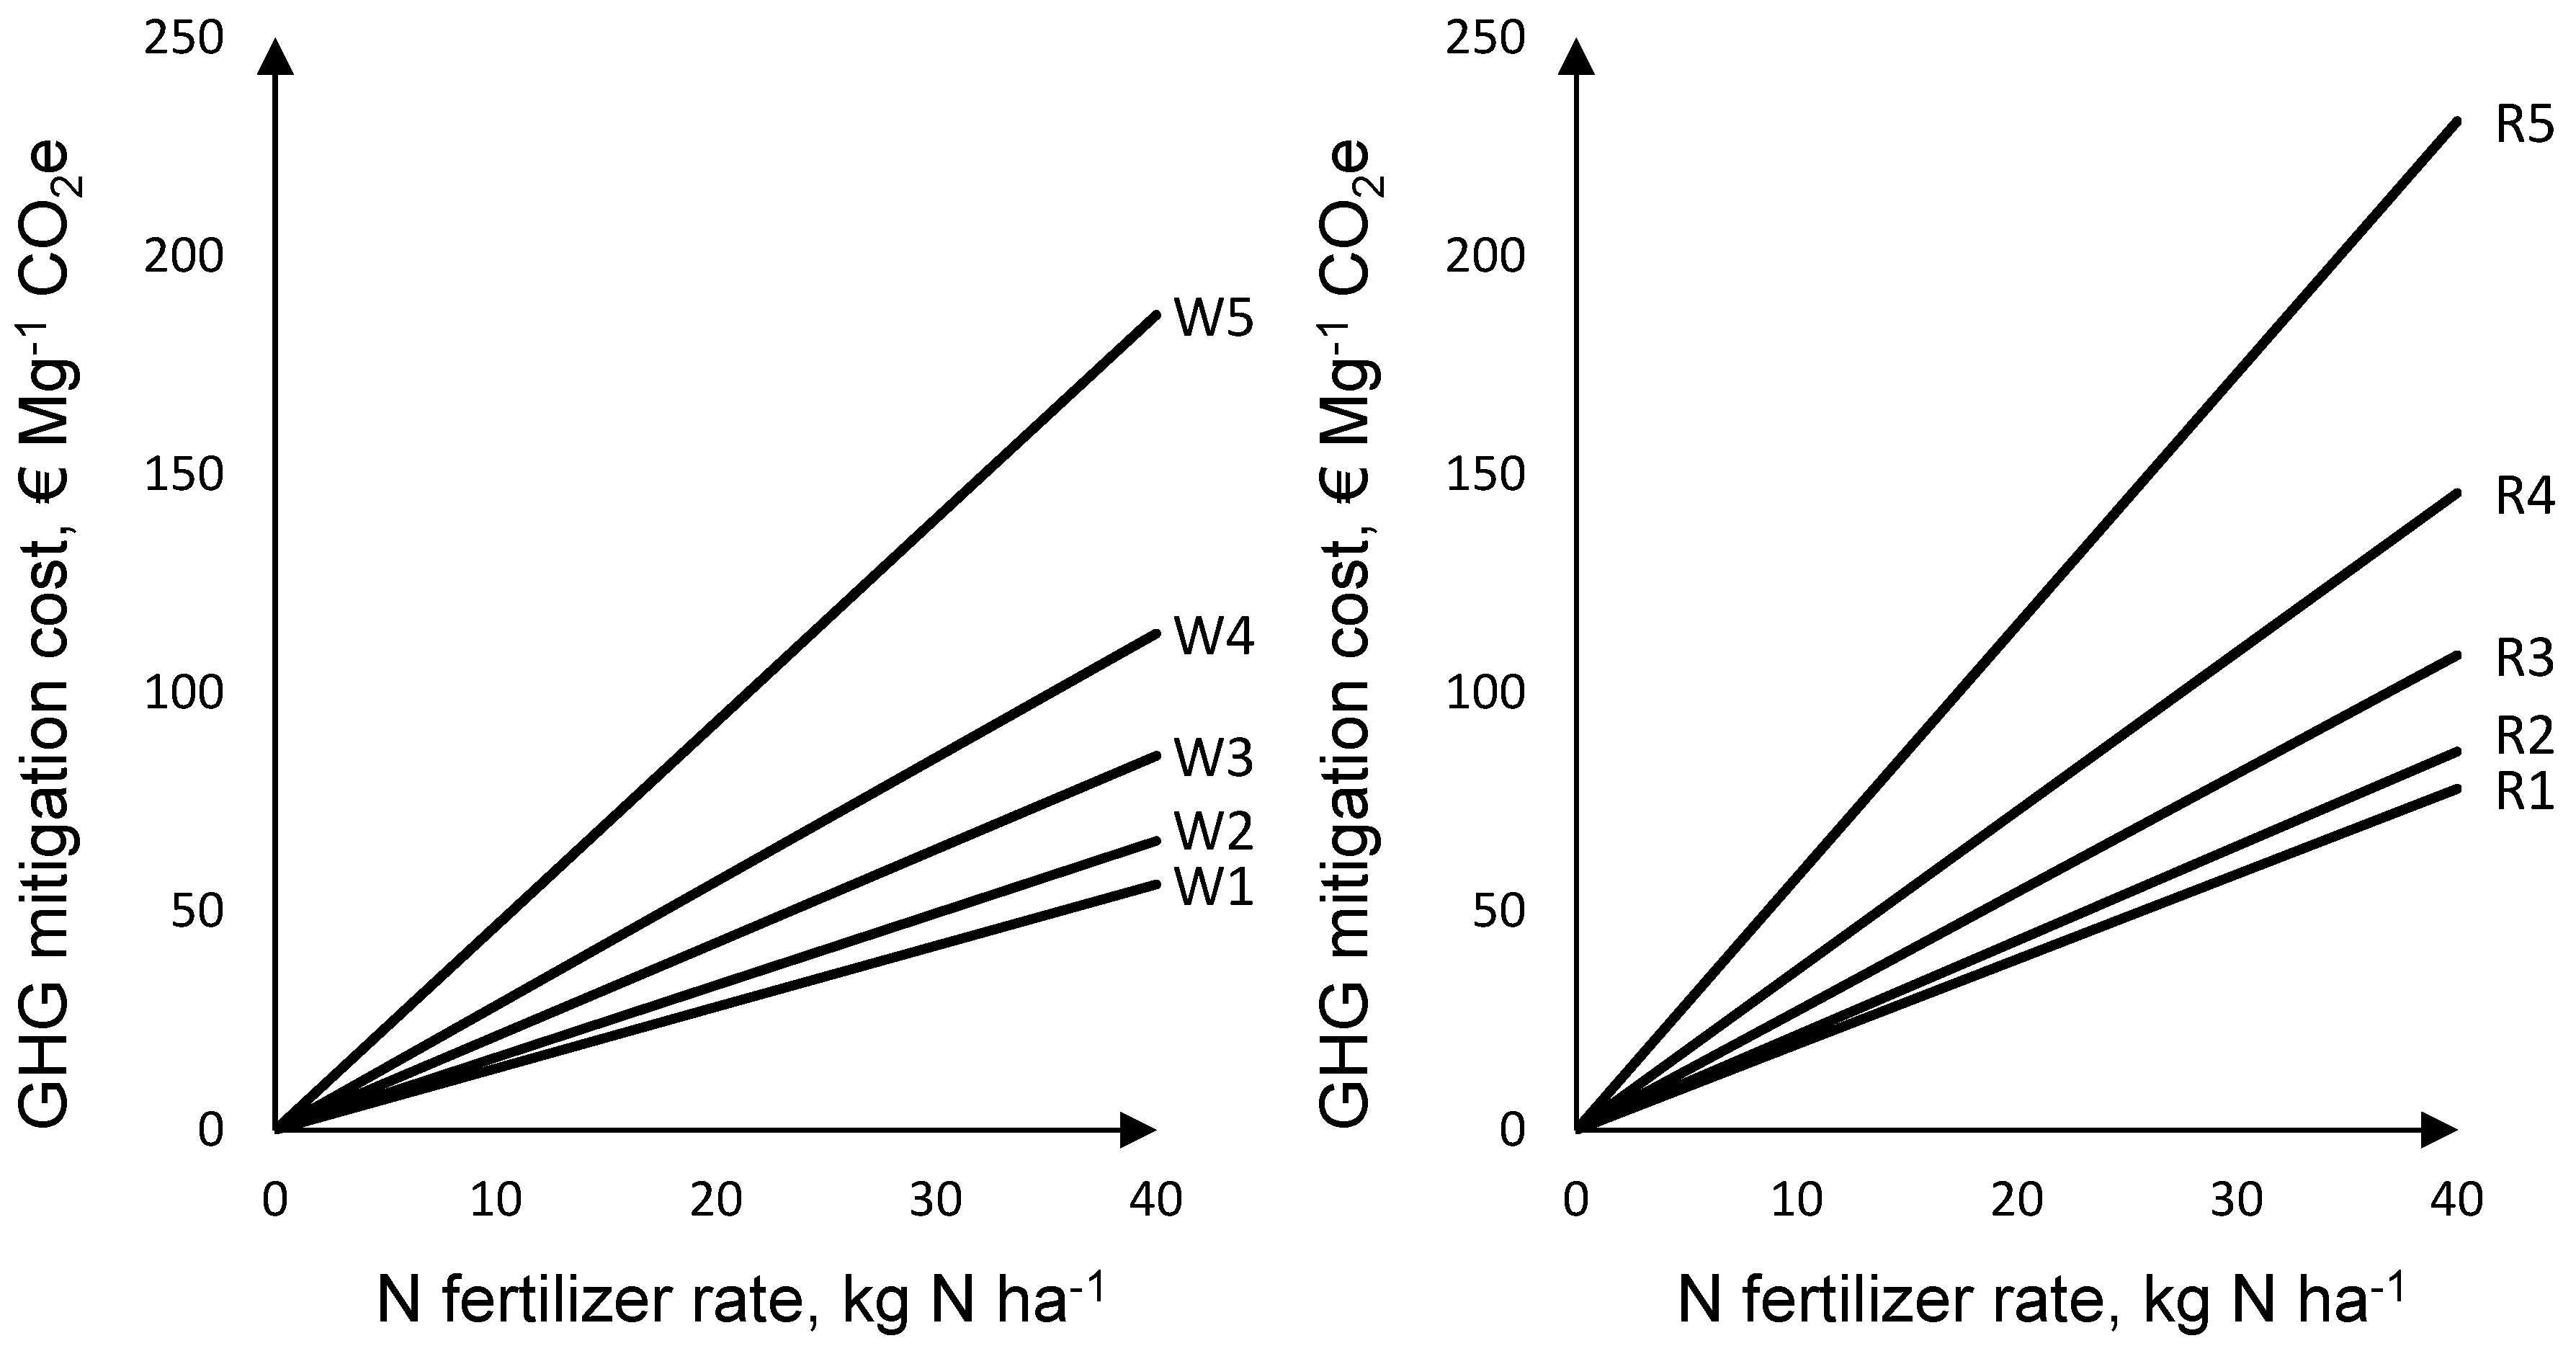
Crop and yield-zone-specific GHG mitigation cost functions were estimated by coupling change in net return and change in GHG emissions when N fertilizer application was reduced (Equation (18)).
G H G _ c o s t i , c = N R i , c _ R N R i , c _ A G H G i , c _ R G H G i , c _ A
where GHG_costi,c—Crop (c) and yield-zone-specific (i) cost of GHG mitigation, NRi,c_R—Crop and yield-zone-specific net return in reference scenario (status quo), NRi,c_A—Crop and yield-zone-specific net return in alternative scenario (N fertilizer reduction), GHGi,c_R—Crop and yield-zone-specific greenhouse gas emissions in reference scenario (status quo) and GHGi,c_A—Crop and yield-zone-specific GHG emissions in alternative scenario (N reduction).

2.6. Uncertainty Analysis

In order to identify the most influential parameters on and the range of GHG mitigation costs, we carried out an uncertainty analysis on cost estimation of GHG mitigation by N fertilizer reduction. We considered uncertainties of the prices of N fertilizer and crops, the emission factors related to the N transformation processes and the standard deviation of crop yields at the economic optimum. The standard deviations of crop and yield-zone-specific yields were estimated based on the assumption that the coefficient of variance for a given crop would be the same in yield-zones as well as in Dahlem and Thyrow for wheat and rye respectively. The coefficients of variance were calculated in Dahlem (wheat) and Thyrow (rye) based on the empirical data and used to estimate the standard deviation of yields in the five yield-zones in Brandenburg. A normal distribution with the respective standard deviation was modelled for each crop and yield-zone. Apart from the standard deviation of yields, all parameters were modelled in a Monte Carlo simulation with a log-triangular distribution (Table 5), 5000 iterations were run using @Risk (Palisade Corporation Software, Ithaca, NY, USA). A multivariate regression analysis was conducted to identify the influence of uncertainty of input parameters on GHG mitigation costs. The expected value (mean) and the standard deviation of GHG mitigation costs in each yield-zone were estimated based on the simulation results.

2.7. System Expansion

A system expansion was applied for N fertilizer reduction to include GHG emissions (EFY,c) that were assumed to be generated at a different site to offset yield penalties due to N fertilizer reduction in the considered yield-zones in Brandenburg (Equation (19)). The European Union average of GHG emissions per kg product for retail sale of wheat (409 kg CO2e Mg−1 product) and rye (299 kg CO2e Mg−1 product) were taken from ProBas database [39].
G H G _ s e i , c = ( E F D + E F V + E F L + E F P ) N i , c + E F Y , c Y _ p i , c
In system expansion, total crop (c) and yield-zone-specific (i) GHG emissions (GHG_sei,c; kg CO2e ha−1) included emissions to compensate yield penalties (Y_pi,c; kg product ha−1) coupled with the emission factor per kg product (EFY,c), in addition to GHG emissions (GHGi,c) highlighted in Section 2.4.

2.8. Case Study

In order to simulate a comparative investigation, we conducted a case study on optimization of regional costs due to N fertilizer reduction to mitigate GHG emissions. As regional GHG mitigation goal 33.5 Gg CO2e was set, which is equivalent to 10 kg ha−1 on average for the given total wheat and rye production area in five yield-zones in Brandenburg. No land use change was allowed. The extension of land use of the respective crops is given in Table 6.
We applied two strategies to reach the GHG mitigation target: Uniform reduction (the same reduction rate for both crops in all yield-zones) and smart reduction considering comparative advantages of crop- and yield-zone-specific GHG mitigation costs.
Uniform reduction implies equal amount of mineral N reduction per hectare to reach an overall reduction target. In other words, the overall reduction target was distributed to every hectare evenly independent of site qualities, crop selection and input and output prices (Equation (20)).
N r e d _ u n i = G H G r e d _ t a r g e t E F T o t a l i n c m L
Nred-uni—Uniform N fertilizer reduction (kg ha−1), GHGred_target—GHG mitigation target of the region (kg CO2e), EFTotal—Total emission factor (kg CO2e kg−1 N), L—Land use (ha) for every yield-zone (i) and crop (c).
Smart reduction was defined as cost-minimizing yield-zone-specific N fertilizer reduction that considered the individual yield response to N for each crop, yield-zone, cultivated areas and input and output prices. The total reduction was achieved by considering the yield response to reduced N fertilization for wheat and rye in every yield-zone. The loss in total net return of the region was minimized as the objective function of a nonlinear optimization; while GHG mitigation induced reduction for N supply was held as constraint reflecting the mitigation goal (Equation (21)). Additionally, land use of wheat and rye in respective yield-zones were held constant.
Objective :   MINIMIZE   i n c m L i , c Δ ( P Y Y i , c P N N i , c )
subject   to :   L i , c _ A = L i , c _ R   and   i n c m Δ N i , c = G H G r e d _ t a r g e t E F T o t a l
Li,c—Land use of crop (c) in respective yield-zone (i), PY—Price of crop (€ Mg−1), Y—Yield (Mg ha−1), N—N fertilizer rate (kg N ha−1), PN—Price of N fertilizer (€ kg−1 N), Li,c_A—Land use of crop in respective yield-zone in the alternative scenario (N fertilizer reduction), Li,c_R—Land use of crop in respective yield-zone in the reference scenario.

3. Results and Discussion

3.1. Model Results

According to the regression analysis, Table 7 presents the coefficients of yield response functions based on the long-term field experiments in Dahlem for wheat and Thyrow for rye.
The coefficients of the modelled yield functions for five yield-zones in Brandenburg are presented in Table 8. The normalization approach enabled to depict differentiated yield response functions of the yield-zones in Brandenburg reflecting differentiated yield potentials.
According to our model calculations, wheat and rye yield responses to N supply followed a similar pattern. Rye yields were consistently lower than wheat yields within the same yield-zone. Yield response to N in low yield-zones was stronger compared to high yield-zones for both wheat and rye (Figure 2). Accordingly, yield penalties due to N fertilizer reduction were higher in low yield-zones, for instance, 20 kg ha−1 N fertilizer reduction from the respective economic optimum caused the yield penalty for wheat 154 and 234 kg ha−1 in the highest (W1) and the lowest yield-zone (W5) respectively. Higher yield penalties occurred due to stronger yield responses to N fertilizer reduction towards the low yield-zones. Furthermore, rye yield responded stronger to N fertilizer reduction compared to wheat. Yield penalties for rye were higher than for wheat at every N reduction level within the same yield-zone. For instance, 20 kg ha−1 N fertilizer reduction resulted in yield penalties ranging from 219 to 342 kg ha−1 in the highest (R1) and lowest (R5) yield-zone respectively.
N fertilizer reduction led to net return loss, since cost savings due to less N fertilizer use did not compensate for the costs of yield penalties. Change in net return was bound to respective yield penalty and crop price. Even though rye yield was strongly affected by N fertilizer reduction, the total loss in net return for the same level of N fertilizer reduction was slightly lower for wheat than for rye due to the higher crop price for wheat (Figure 3). The reduction of 20 kg ha−1 N fertilizer from the respective economic optimum affected the net return between 6 and 18 € ha−1 for wheat and between 8 and 23 € ha−1 for rye.
Differences in yield response to N strongly affected GHG mitigation costs. Parallel to loss in net return, costs of GHG mitigation were slightly lower for wheat compared to rye (Figure 4) within the same yield-zone.
The marginal costs of GHG mitigation at N fertilizer reduction rate of 20 kg N ha−1 increased from 28 € Mg−1 CO2e in the highest yield-zone to 93 € Mg−1 CO2e in the lowest yield-zone for wheat and from 39 € Mg−1 CO2e to 115 € Mg−1 CO2e for rye (Table 9). The expected value (mean) of GHG mitigation costs based on the Monte-Carlo simulation increased gradually from high yield-zones to low yield-zones, while the mean was found considerably higher for rye than for wheat compared to respective default values. This can be explained by rather less favorable site conditions for rye production which was incorporated by means of yield functions in our model where rye yield responds stronger to reduced N input. Besides, rye yield has higher standard deviation than wheat. The standard deviation of GHG mitigation costs increase from high yield-zones to low yield-zones and it is relatively lower for wheat than rye. The results suggest lower uncertainty for GHG mitigation costs by N fertilizer reduction for wheat in high yield-zones.
The crop-specific N fertilizer reduction showed differences in GHG mitigation costs, since crop yields reacted differently to N fertilizer reduction even within the same yield-zone. Besides, crop prices had a high influence on GHG mitigation costs. With higher N fertilizer reduction, GHG mitigation costs increased linearly (Figure 4).
Our findings indicate that the cost level of GHG mitigation by moderate N reduction could be considered in the lower bound compared to other GHG mitigation measures. Smith et al. [40] published a wide cost range of GHG mitigation measures (1–2500 $ Mg−1 CO2e), while the range for nutrient management measures, such as improved timing and placement of N fertilizers and avoiding over-fertilization, was reported between 8 and 15 $ Mg−1 CO2e depending on the climate zone. Scholz et al. [41] identified mitigation costs of GHG emissions by biogas production in the state of Brandenburg (Germany) between 288 € Mg−1 CO2e and 1135 € Mg−1 CO2e. Teichmann [42] made an ex-ante simulation on the effects of biochar to mitigate GHG emissions. The author reported a wide range of GHG mitigation costs, from 68 € Mg−1 CO2e to over 4000 € Mg−1 CO2e, depending on the feedstock used for biochar production. Similarly, GHG mitigation measures in meat and dairy production systems reflect a wide range (1:3 quartile) from 58 $ Mg−1 CO2e to 856 $ Mg−1 CO2e [43]. There are also studies showing much lower GHG mitigation costs or even negative costs (cost savings) due to, for instance, improved nutrient management [44,45]. Nevertheless, if such measures do not result in any cost, a wide adoption would be expectable which has not been largely observed [45]. A possible reason for this paradox is that GHG mitigation measures estimated in studies can be more costly in practice due to omitted transaction or learning costs [45]. Furthermore, uncertainties on costs and benefits of precision farming technologies could play a role [20].
One possible reason for the relatively low opportunity costs for GHG mitigation by moderate N fertilizer reduction can be explained by the flat profit functions, as reported in Pannell [21]. Marginal adjustments in N intensity around the economic optimum do not result in high costs, since marginal benefit diminishes towards the economic optimum rate and does not drop steeply immediately, so that the returns do not severely vary in both directions (intensifying or reducing) around that rate. It is noteworthy to mention that we assumed that grain quality of wheat was not affected by moderate N fertilizer reduction. Wheat price of feed quality is around 10 € Mg−1 lower than baking quality [28]. Loss in grain quality would increase the GHG mitigation costs due to reduced N fertilizer application.
The results of the multivariate regression analysis indicated that the variance of crop prices was the most influential factor followed by the N fertilizer price variance in determining the overall variance of the cost estimation of GHG mitigation (Table 10). The uncertainties of the variables for direct N2O emissions (EF1) and for mineral N production (EFP) had a higher impact on the overall uncertainty than other variables related to N transformation processes. The impact of standard deviation of crop yield on the overall variance within the assumed ranges was close to zero, even though they showed an impact on the change in output mean. This can be explained by the fact that GHG mitigation costs were calculated for each Monte Carlo simulation comparing the mitigation scenario (reduced N fertilizer) with the reference scenario respectively for the same yield-zone and crop, a marginal N fertilizer reduction at slightly higher or lower yield level resulted in—on average—very low impact. The uncertainty analysis in this study was conducted to provide a figure of the range of the GHG mitigation costs, as well as an overall notion of the importance of the considered input parameters and, therefore, has limitations for a more detailed analysis of the distribution of the outcome.
In the analysis of system expansion, the inclusion of additional GHG emissions due to compensation of yield penalties affected the cost-efficiency of GHG mitigation for both crops in all yield-zones negatively. Nevertheless, the comparative advantage of N fertilizer reduction in high yield-zones was relatively improved when compared with low yield-zones (Figure 5). Note that the system expansion did not include GHG emissions due to a possible land use change. It can be expected that additional GHG emissions due to a possible land use change would affect the cost-efficiency of GHG mitigation in the same direction as described above.

3.2. Case Study

In the case study, it was observed that if crop and yield-zone-specific marginal costs of GHG mitigation by N fertilizer reduction were taken into account, regional economic loss could be minimized. The results of the scenario analysis indicated that smart N fertilizer reduction offered a potential to improve the cost-efficiency of GHG mitigation even further. This alternative N fertilizer reduction strategy resulted in 19% cost savings for GHG mitigation and induced overall economic loss of the region compared to the uniform reduction (Table 11). With the smart N fertilizer reduction strategy, the marginal cost of GHG mitigation was reduced by approximately 5 € Mg−1 CO2e, (from 27 € Mg−1 CO2e to 22 € Mg−1 CO2e) for the given land use patterns and the mitigation target.

4. Conclusions

The results indicate the feasibility of our model’s approach, which can be applied to various aspects of N fertilizer and GHG mitigation. The approach provides a modelling tool to simulate the yield and economic responses of stepwise reduction of mineral N fertilizer and assess their implications for yield-zone-specific GHG mitigation potential and costs. Our application of the model to Brandenburg implies that moderate reduction of mineral N fertilizer can mitigate GHG emissions at reasonable opportunity costs as they are in the lower-bound of wide-ranged mitigation costs across the agriculture related measures. High yield-zones show advantages over low yield-zones in terms of cost-efficient GHG mitigation. Therefore, N fertilizer reduction should be applied rather to high yield-zones as long as marginal mitigation costs do not exceed the one in the subsequent lower yield-zone. N reduction in wheat production offers GHG mitigation at lower costs with lower uncertainty compared to N fertilizer reduction in rye production. Our study assumes no change in grain quality due to moderate N fertilizer reduction. If N fertilizer reduction results in grain quality loss, GHG mitigation costs would increase due to higher income loss.
N fertilizer reduction in a given region can be optimized considering crop and yield-zone-specific yield responses (smart reduction) and, thus, the total cost-efficiency to mitigate regional GHG emissions can be improved. A total GHG mitigation target of 35.5 Gg CO2e was achievable with the smart N fertilizer reduction strategy with 19% cost savings—compared to uniform reduction—in wheat and rye production in Brandenburg. Our model can be used in further studies for policy analysis comparing different GHG mitigation strategies aiming N fertilizer reduction, e.g. incentives, N fertilizer tax, or N application cap, targeting policies to different sites with different yield potentials.

Acknowledgments

The authors gratefully acknowledge the financial support by the Senate Competition Committee (SAW) within the Joint Initiative for Research and Innovation of the Leibniz Association (Grant Number: SAW-2013-ATB-4). The publication of this article was funded by the Open Access Fund of the Leibniz Association.

Author Contributions

Yusuf Nadi Karatay (Y.N.K.) and Andreas Meyer-Aurich (A.M.-A.) conceived and designed the study. Y.N.K. compiled the data, performed the calculations and wrote the paper. A.M.-A. contributed to the analysis of the results and the phrasing of the manuscript.

Conflicts of Interest

The authors declare no conflict of interest.

References

  1. Bodirsky, B.L.; Popp, A.; Lotze-Campen, H.; Dietrich, J.P.; Rolinski, S.; Weindl, I.; Schmitz, C.; Müller, C.; Bonsch, M.; Humpenöder, F.; et al. Reactive nitrogen requirements to feed the world in 2050 and potential to mitigate nitrogen pollution. Nat. Commun. 2014, 5, 3858. [Google Scholar] [CrossRef] [PubMed]
  2. Robertson, G.P.; Vitousek, P.M. Nitrogen in agriculture: Balancing the cost of an essential resource. Annu. Rev. Environ. Resour. 2009, 34, 97–125. [Google Scholar] [CrossRef]
  3. Sutton, M.A.; Oenema, O.; Erisman, J.W.; Leip, A.; van Grinsven, H.; Winiwarter, W. Too much of a good thing. Nature 2011, 472, 159–161. [Google Scholar] [CrossRef] [PubMed]
  4. Van Groenigen, J.W.; Velthof, G.L.; Oenema, O.; Van Groenigen, K.J.; Van Kessel, C. Towards an agronomic assessment of N2O emissions: A case study for arable crops. Eur. J. Soil Sci. 2010, 61, 903–913. [Google Scholar] [CrossRef]
  5. Tubiello, F.; Salvatore, M.; Cóndor Golec, R.; Ferrara, A.; Rossi, S.; Biancalani, R.; Federici, S.; Jacobs, H.; Flammini, A. Agriculture, Forestry and Other Land Use Emissions by Sources and Removals by Sinks; Statistics Division; Food and Agriculture Organization: Rome, Italy, 2014. [Google Scholar]
  6. Reay, D.S.; Davidson, E.A.; Smith, K.A.; Smith, P.; Melillo, J.M.; Dentener, F.; Crutzen, P.J. Global agriculture and nitrous oxide emissions. Nat. Clim. Chang. 2012, 2, 410–416. [Google Scholar] [CrossRef]
  7. Snyder, C.S.; Bruulsema, T.W.; Jensen, T.L.; Fixen, P.E. Review of greenhouse gas emissions from crop production systems and fertilizer management effects. Agric. Ecosyst. Environ. 2009, 133, 247–266. [Google Scholar] [CrossRef]
  8. Brentrup, F.; Pallière, C. Energy Efficiency and Greenhouse Gas Emissions in European Nitrogen Fertilizer Production and Use; Reproduced and updated by kind permission of the International Fertiliser Society [www.fertiliser-society.org] from its Proceedings 639 (2008); International Fertiliser Society: Colchester, UK, 2008. [Google Scholar]
  9. Smith, P.; Gregory, P.J. Climate change and sustainable food production. Proc. Nutr. Soc. 2013, 72, 21–28. [Google Scholar] [CrossRef] [PubMed]
  10. Bellarby, J.; Foereid, B.; Hastings, A. Cool Farming: Climate Impacts of Agriculture and Mitigation Potential; Greenpeace: Amsterdam, The Netherlands, 2008. [Google Scholar]
  11. Lal, R. Carbon emission from farm operations. Environ. Int. 2004, 30, 981–990. [Google Scholar] [CrossRef] [PubMed]
  12. Scott, M.J.; Sands, R.D.; Rosenberg, N.J.; César Izaurralde, R. Future N2O from US agriculture: Projecting effects of changing land use, agricultural technology, and climate on N2O emissions. Glob. Environ. Chang. 2002, 12, 105–115. [Google Scholar] [CrossRef]
  13. Galloway, J.N.; Cowling, E.B.; Seitzinger, S.P.; Socolow, R.H. Reactive Nitrogen: Too Much of a Good Thing? Ambio 2002, 31, 60–63. [Google Scholar] [CrossRef] [PubMed]
  14. Kroeze, C. Inventory of strategies for reducing anthropogenic emissions of N2O and potential reduction of emissions in The Netherlands. Mitig. Adapt. Strateg. Glob. Chang. 1996, 1, 115–137. [Google Scholar] [CrossRef]
  15. Dalgaard, T.; Hansen, B.; Hasler, B.; Hertel, O.; Hutchings, N.J.; Jacobsen, B.H.; Jensen, L.S.; Kronvang, B.; Olesen, J.E.; Schjørring, J.K. Policies for agricultural nitrogen management—Trends, challenges and prospects for improved efficiency in Denmark. Environ. Res. Lett. 2014, 9, 115002. [Google Scholar] [CrossRef]
  16. Smith, P.; Martino, D.; Cai, Z.; Gwary, D.; Janzen, H.; Kumar, P.; McCarl, B.; Ogle, S.; O’Mara, F.; Rice, C.; et al. Policy and technological constraints to implementation of greenhouse gas mitigation options in agriculture. Agric. Ecosyst. Environ. 2007, 118, 6–28. [Google Scholar] [CrossRef]
  17. Balafoutis, A.; Beck, B.; Fountas, S.; Vangeyte, J.; Wal, T.; Soto, I.; Gómez-Barbero, M.; Barnes, A.; Eory, V. Precision Agriculture Technologies Positively Contributing to GHG Emissions Mitigation, Farm Productivity and Economics. Sustainability 2017, 9, 1339. [Google Scholar] [CrossRef]
  18. Organization for Economic Cooperation and Development (OECD). Farm Management Practices to Foster Green Growth; OECD Publishing: Paris, France, 2016. [Google Scholar]
  19. Liu, Y.; Swinton, S.M.; Miller, N.R. Is site-specific yield response consistent over time? Does it pay? Am. J. Agric. Econ. 2006, 88, 471–483. [Google Scholar] [CrossRef]
  20. Gandorfer, M.; Meyer-Aurich, A. Economic Potential of Site-Specific Fertiliser Application and Harvest Management. In Precision Agriculture: Technology and Economic Perspectives; Pedersen, S.M., Lind, K.M., Eds.; Springer International Publishing: Cham, Switzerland, 2017; pp. 79–92. [Google Scholar]
  21. Pannell, D.J. Flat Earth Economics: The Far-reaching Consequences of Flat Payoff Functions in Economic Decision Making. Rev. Agric. Econ. 2006, 28, 553–566. [Google Scholar] [CrossRef]
  22. McSwiney, C.P.; Robertson, G.P. Nonlinear response of N2O flux to incremental fertilizer addition in a continuous maize (Zea mays L.) cropping system. Glob. Chang. Biol. 2005, 11, 1712–1719. [Google Scholar] [CrossRef]
  23. Meyer-Aurich, A.; Olesen, J.E.; Prochnow, A.; Brunsch, R. Greenhouse gas mitigation with scarce land: The potential contribution of increased nitrogen input. Mitig. Adapt. Strateg. Glob. Chang. 2013, 18, 921–932. [Google Scholar] [CrossRef]
  24. Dominguez, I.P.; Fellmann, T.; Witzke, H.; Jansson, T.; Oudendag, D.; Gocht, A.; Verhoog, A. Agricultural GHG Emissions in the EU: An Exploratory Economic Assessment of Mitigation Policy Options; European Commission: Brussels, Belgium, 2012. [Google Scholar]
  25. Mérel, P.; Yi, F.; Lee, J.; Six, J. A Regional Bio-economic Model of Nitrogen Use in Cropping. Am. J. Agric. Econ. 2014, 96, 67–91. [Google Scholar] [CrossRef]
  26. Meyer-Aurich, A.; Lochmann, Y.; Klauss, H.; Prochnow, A. Comparative Advantage of Maize- and Grass-Silage Based Feedstock for Biogas Production with Respect to Greenhouse Gas Mitigation. Sustainability 2016, 8, 617. [Google Scholar] [CrossRef]
  27. Stuart, D.; Schewe, R.L.; McDermott, M. Reducing nitrogen fertilizer application as a climate change mitigation strategy: Understanding farmer decision-making and potential barriers to change in the US. Land Use Policy 2014, 36, 210–218. [Google Scholar] [CrossRef]
  28. Hanff, H.; Lau, H. Datensammlung für die Betriebswirtschaftliche Bewertung Landwirtschaftlicher Produktionsverfahren im Land Brandenburg; Ministerium für Ländliche Entwicklung, Umwelt und Landwirtschaft, Landesamt Ländliche Entwicklung, Landwirtschaft und Flurneuordnung: Frankfurt (Oder), Germany, 2016; Volume 7, Available online: http://lelf.brandenburg.de (accessed on 1 March 2017).
  29. Krayl, E. Strategien zur Verminderung der Stickstoffverluste aus der Landwirtschaft; Wiss.-Verlag Vauk: Kiel, Germany, 1993. [Google Scholar]
  30. Kazenwadel, G. Ökonomisch/Ökologische Beurteilung von Regionalen Agrar-Und Umweltprogrammen in der Europaischen Union; Buchedition Agrimedia: Bergen/Dumme, Germany, 1999. [Google Scholar]
  31. Baudoux, P. Ökonomische und Ökologische Wirkungen von Agrarumweltprogrammen: Eine Einzelbetriebliche Analyse in Baden-Württemberg und Brandenburg; Agrimedia: Bergen/Dumme, Germany, 2000. [Google Scholar]
  32. Triebe, S. Reduktion von Treibhausgasemissionen aus der Landwirtschaft: Dargestellt für die Bundesländer Brandenburg und Niedersachsen; Josef Eul Verlag GmbH: Lohmar, Germany; Köln, Germany, 2007; Volume 1. [Google Scholar]
  33. Köhn, W.; Ellmer, F.; Peschke, H.; Chmielewski, F.; Erekul, O. Dauerdüngungsversuch (IOSDV) Berlin-Dahlem Deutschland. In Körschens M (2000) IOSDV Internationale Organische Stickstoffdauerdüngeversuche. Bericht der Internationalen Arbeitsgemeinschaft Bodenfruchtbarkeit in der Internationalen Bodenkundlichen Union; UFZ Bericht 15/2000; UFZ: Leipzig, Germany, 2000; pp. 25–35. Available online: http://www.ufz.de/index.php?en=20939&ufzPublicationIdentifier=7343 (accessed on 1 March 2017).
  34. Meyer-Aurich, A.; Gandorfer, M.; Trost, B.; Ellmer, F.; Baumecker, M. Risk efficiency of irrigation to cereals in northeast Germany with respect to nitrogen fertilizer. Agric. Syst. 2016, 149, 132–138. [Google Scholar] [CrossRef]
  35. Meyer-Aurich, A.; Griffin, T.W.; Herbst, R.; Giebel, A.; Muhammad, N. Spatial econometric analysis of a field-scale site-specific nitrogen fertilizer experiment on wheat (Triticum aestuvum L.) yield and quality. Comput. Electron. Agric. 2010, 74, 73–79. [Google Scholar] [CrossRef]
  36. Bachmaier, M.; Gandorfer, M. A conceptual framework for judging the precision agriculture hypothesis with regard to site-specific nitrogen application. Precis. Agric. 2008, 10, 95. [Google Scholar] [CrossRef]
  37. Intergovernmental Panel on Climate Change. 2006 IPCC Guidelines for National Greenhouse Gas Inventories; Intergovernmental Panel on Climate Change: Geneva, Switzerland, 2006. [Google Scholar]
  38. Forster, P.; Ramaswamy, V.; Artaxo, P.; Berntsen, T.; Betts, R.; Fahey, D.W.; Haywood, J.; Lean, J.; Lowe, D.C.; Myhre, G.; et al. Changes in Atmospheric Constituents and in Radiative Forcing; Cambridge University Press: Cambridge, UK, 2007; pp. 129–234. [Google Scholar]
  39. UBA (Umweltbundesamt)/ÖKO (Öko-Institut). ProBas—Prozessorientierte Basisdaten für Umweltmanagementinstrumente; NG-HandelEU-Weizen-2010; Umweltbundesamt: Dessau-Roßlau, Germany, 2010; Available online: www.probas.umweltbundesamt.de (accessed on 1 March 2017).
  40. Smith, P.; Martino, D.; Cai, Z.; Gwary, D.; Janzen, H.; Kumar, P.; McCarl, B.; Ogle, S.; O’Mara, F.; Rice, C.; et al. Greenhouse gas mitigation in agriculture. Philos. Trans. R. Soc. B Biol. Sci. 2008, 363, 789–813. [Google Scholar] [CrossRef] [PubMed]
  41. Scholz, L.; Meyer-Aurich, A.; Kirschke, D. Greenhouse Gas Mitigation Potential and Mitigation Costs of Biogas Production in Brandenburg, Germany; Food and Agriculture Organization of the United Nations (FAO): Rome, Italy, 2011. [Google Scholar]
  42. Teichmann, I. Climate Protection through Biochar in German Agriculture: Potentials and Costs. DIW Econ. Bull. 2014, 4, 17–26. [Google Scholar]
  43. Smith, P.; Clark, H.; Dong, H.; Elsiddig, E.; Haberl, H.; Harper, R.; House, J.; Jafari, M.; Masera, O.; Mbow, C. Agriculture, Forestry and Other Land Use (AFOLU); International Institute for Applied Systems Analysis: Laxenburg, Austria, 2014. [Google Scholar]
  44. Sutton, M.A.; Howard, C.M.; Erisman, J.W.; Billen, G.; Bleeker, A.; Grennfelt, P.; Van Grinsven, H.; Grizzetti, B. The European Nitrogen Assessment: Sources, Effects and Policy Perspectives; Cambridge University Press: Cambridge, UK, 2011. [Google Scholar]
  45. MacLeod, M.; Eory, V.; Gruère, G.; Lankoski, J. Cost-Effectiveness of Greenhouse Gas Mitigation Measures for Agriculture; Organisation for Economic Co-operation and Development (OECD): Paris, France, 2015. [Google Scholar]
Scheme 1. The workflow of the methodological approach. Normal rectangles are the data and assumptions taken, and the curve edged rectangles are the calculations performed.
Sustainability 10 00710 sch001
Figure 1. Workflow for modelling yield-zone-specific yield response functions.
Sustainability 10 00710 g001
Figure 2. Yield response functions with respect to nitrogen (N) fertilizer; W: wheat; R: rye; 1–5 yield-zones.
Sustainability 10 00710 g002
Figure 3. Economic response to reduced N fertilizer application; W: wheat; R: rye; 1–5 yield-zones.
Sustainability 10 00710 g003
Figure 4. Costs of greenhouse gas (GHG) mitigation by nitrogen fertilizer reduction; W: wheat; R: rye; 1–5 yield-zones.
Sustainability 10 00710 g004
Figure 5. Costs of GHG mitigation in the system expansion; W: wheat; R: rye; 1–5 yield-zones.
Sustainability 10 00710 g005
Table 1. Yield response data with respect to N fertilizer for wheat from Dahlem (1986–1999) based on [33] and for rye from Thyrow (1996–1999) based on [34].
Wheat Rye
Fertilizer (kg N ha−1)Average Yield (Mg ha−1)Fertilizer (kg N ha−1)Average Yield (Mg ha−1)
03.2502.11
605.28604.57
1105.681205.20
1605.98
Table 2. Yield-zone-specific N fertilizer rates and corresponding crop yield levels in five yield-zones in Brandenburg according to Hanff & Lau [28].
Yield-Zones in Brandenburg
1234512345
WheatRye
Yield (Mg ha−1)7.706.505.003.802.307.406.605.304.002.50
Fertilizer (kg N ha−1)17014411184511451301047849
Table 3. GHG emission factors regarding mineral N fertilizer production and application.
GHG Emission Factors (kg CO2e kg−1 N)Source
Direct emissions (EFD)4.68[37]
Indirect emissions:
Volatilization (EFV)0.47
Leaching/Runoff (EFL)1.05
Fertilizer production (EFP)3.70[8]
Sum (EFTotal)9.91
Table 4. Mineral N fertilizer price (PN) and crop prices for wheat (PW) and rye (PR) according to Hanff & Lau [28].
PN (€ kg−1 N)0.96
PW (€ Mg−1)161
PR (€ Mg−1)123
Table 5. Parameters for the uncertainty analysis; EF1: Direct N2O-N emission factor as a function of EFD; EF4: Indirect N2O-N emission factor and FRACG: Volatilization for mineral fertilizer from N volatilization as a function of EFV; EF5: Indirect N2O-N emission factor from leaching and runoff and FRACL: Nitrogen losses by leaching and runoff as a function of EFL; EFP: Emission factor of mineral N fertilizer production; Crop prices (€ Mg−1) for wheat (PW) and rye (PR), PN: Mineral N fertilizer price (€ kg−1 N), Y: Yield (Mg ha−1).
VariableParametersSource
DefaultMinMax
EF10.010.0030.03[37]
EF40.010.0020.05[37]
EF50.00750.00050.025[37]
FracL0.30.10.8[37]
FracG0.10.030.3[37]
EFP3.703.029.56[37]
PW161100238[28]
PR12376210[28]
PN0.960.811.07[28]
YSee the text above (2.6)
Table 6. Land use of two major cereals in Brandenburg [28].
Yield-Zones in Brandenburg (ha)
12345
Wheat56,10050,90020,60094703650
Rye796036,70049,90057,30045,500
Table 7. Coefficients of estimated quadratic polynomial functions of yield (Mg ha−1) response to N fertilizer (kg ha−1) for wheat (Dahlem) based on [33] and rye (Thyrow) based on [34]; a: Quadratic coefficient, b: Linear coefficient, c: Constant.
Dahlem (Wheat) (R2 = 0.66)Thyrow (Rye) (R2 = 0.79)
a−0.000139−0.000254
b0.03860.0562
c3.302.11
Table 8. Coefficients of modelled yield-zone-specific quadratic polynomial functions of yield (Mg ha−1) response to N fertilizer (kg ha−1) for wheat and rye; a: Quadratic coefficient, b: Linear coefficient, c: Constant.
Yield-Zones in Brandenburg (Wheat)
12345
a−0.000087−0.000102−0.000132−0.000175−0.000287
b0.03540.03530.03520.03530.0352
c4.193.532.712.071.25
Yield-Zones in Brandenburg (Rye)
12345
a−0.000157−0.000174−0.000219−0.000294−0.000465
b0.05340.05320.05330.05360.0534
c2.962.642.121.601.00
Table 9. Costs of GHG mitigation (€ Mg−1 CO2e) at 20 kg ha−1 N fertilizer reduction; Default: Costs estimated through the defaults values given under Section 2; Expected value (mean) and standard deviation (SD) of simulations: Values acquired from the Monte-Carlo simulations with 5000 iterations.
Yield-Zones in Brandenburg
WheatRye
€ Mg−1 CO2e1234512345
Default283343579339435473115
Mean (simulations)313645589351556685128
SD (simulations)22242629393233364255
Table 10. Regression coefficients of uncertainty variables from stepwise multivariate regression analysis for GHG mitigation costs by 10 kg ha−1 reduction of N fertilizer for wheat and rye in five yield-zones; Prices of crops (€ Mg−1), PN: Mineral N fertilizer price (€ kg−1), EF1: Direct N2O-N emission factor, EFP: Emission factor of mineral nitrogen fertilizer production, EF5: Indirect N2O-N emission factor from leaching and runoff, FRACL: Nitrogen losses by leaching and runoff, EF4: Indirect N2O-N emission factor from N volatilization, Y: Yield (Mg ha−1), FRACG: Volatilization for mineral N fertilizer.
Yield-Zones in Brandenburg
WheatRye
Variable1234512345
Prices of crops−0.91−0.91−0.90−0.89−0.85−0.91−0.91−0.90−0.88−0.85
N fertilizer price0.250.250.230.220.180.190.180.170.160.13
EF10.170.190.230.270.350.230.240.260.300.36
EFp0.100.110.130.150.200.130.140.150.170.21
EF50.050.060.070.080.100.070.070.080.090.10
EF40.040.040.050.060.070.050.050.050.060.07
FracL0.030.040.040.050.060.040.040.050.050.06
FracG0.030.030.040.040.050.040.040.040.050.05
Y0.000.000.00−0.010.000.000.000.000.000.00
Table 11. Scenario analysis for optimized regional N fertilizer reduction (W: wheat; R: rye; 1–5 yield-zones; NR: Net return; Uni: Uniform).
N Reduction (kg ha−1)Total N Reduction (kg)Loss in NR (€ ha−1)Total Regional Loss in NR (€)
Land Use (ha)UniSmartUniSmartUniSmartUniSmart
W156,1001016561,000915,3701.393.7178,129208,008
W250,9001014509,000705,9211.643.1583,399160,413
W320,6001011206,000220,6842.122.4343,69750,148
W4947010894,70076,4452.821.8326,65817,371
W5365010536,50017,9454.621.1216,8714078
R17960101279,60093,5291.932.6715,39421,253
R236,7001011367,000388,6322.152.4178,75588,312
R349,900108499,000421,1352.691.92134,35895,698
R457,300106573,000360,4243.611.43207,00481,902
R545,500104455,000180,7155.720.90260,32341,065
Sum338,080 3,380,8003,380,800 944,587768,249

