Article

Optimal Cost–Quality Trade-Off Model for Differentiating Presale Housing Quality Strategies

Department of Architecture, National Taiwan University of Science and Technology, Taipei 10607, Taiwan
*
Author to whom correspondence should be addressed.
Sustainability 2018, 10(3), 680; https://doi.org/10.3390/su10030680
Submission received: 14 January 2018 / Revised: 27 February 2018 / Accepted: 27 February 2018 / Published: 2 March 2018
(This article belongs to the Special Issue Real Estate Economics, Management and Investments)

Abstract

:
Housing quality (HQ) has been a long-standing concern for both developers and homebuyers. Currently, HQ depends on the expected profit and subjectivity of the developers, and homebuyers only have a passive choice of whether to accept housing with such quality. Asian housing supply markets have largely adopted the presale housing system. Under this system, developers are able to verify future occupants before commencing construction, enabling them to provide customized designs and differentiated quality items in order to meet user demands and value. Consequently, HQ can be enhanced. A cost–quality trade-off model was developed using a genetic algorithm to help decision-makers identify the optimal HQ differentiation strategy that simultaneously satisfies homebuyers’ expectations of quality and developers’ expectations of profits. The findings showed that the presale housing system effectively improves HQ. A 6% increase in homebuyers’ budgets can achieve the optimal quality improvement effect, while an 8% or more increase in developers’ construction costs in order to improve HQ can generate an additional premium for the developers.

1. Introduction

Developers typically prioritize profits and sales performance in the development of conventional housing projects in order to create quality items and facilities that are easily accepted and implemented in the market [1]. Developers’ failure to take into account the characteristics and needs of future occupants often leads to unfavorable usage and satisfaction of quality items and facilities once occupants move in [2,3,4]. In other words, housing quality (HQ) depends on the developers, while homebuyers only have a passive choice of whether to accept housing with such quality.
The presale system has always been a mainstream approach that has been adopted in the Asian housing supply market. According to presale concepts, developers are able to verify future occupants during the initial stages of project development, enabling them to provide customized designs and differentiated quality items in order to meet user demand and values [5]. Many developers believe that the presale system allows occupants to participate in the design process and helps developers and customers co-create value and embody experiences. Developers are therefore willing to take advantage of presale as the most vital marketing strategy and source of competitiveness in project development [6]. The presale system can be concurrently beneficial for environmental stewardship and profitability, and its implementation accords with the trend of sustainability, since a sustainable design emphasizes meeting users’ demands [7], improves the degree of satisfaction towards residential quality, and reduces later residential changes to construction and resource wasting.
However, a complex relationship exists in homebuyers’ perception of HQ, homebuyers’ willingness to pay, and developers’ expected profit. In a construction project, the unique nature of the industry necessitates the understanding of client needs and expectations for each project carefully for increasing their satisfaction level [7]. Although the provision of high-quality items and facilities (quality differentiation strategy) can enhance homebuyer satisfaction, it compresses profit margins for the developer [8,9]. In addition, homebuyers may need to increase their budget for these high-quality items and facilities. An excessive increase in budget reduces sales performance, which in turn negatively affects the developers’ profits [10]. Therefore, an interesting competition exists between developers and homebuyers in terms of the level of quality items and facilities.
A number of studies have categorized quality as a differentiation factor and a key factor of competitiveness in the housing development industry [11,12]. Some of these studies have focused on the willingness-to-pay (WTP) issue for improving housing quality. For example, He et al. [1] investigated the transaction price in the housing resale market of a unit that received the quality award, and found that it can be up to 7% higher than a similar unit that did not receive the award. Yoshida and Sugiura [13] examined the residential apartment market, and reported that the price premiums of green buildings, as a differentiation factor of WTP, can reach 10%. However, previous studies that have focused on defining and quantifying quality or investigating the relationship between quality and cost for presale projects, have been limited. Alternatively, a number of studies have examined the quality–cost trade-off relationship of construction projects to develop various multi-objective optimization methods [14,15,16]. However, these studies have largely focused on strategic optimization processes as a way of improving project performance. Few studies have investigated the strategic evaluation problems of multiple targets, particularly in the context of the presale housing system.
The purpose of the present study was to develop a systematic housing cost–quality trade-off model that could enhance housing quality (HQ) for both the developer and the homebuyer, while maintaining favorable cost conditions. This study was divided into three stages. First, quality items and facilities that are suitable for the Taiwanese presale housing market were established based on the framework of Design Quality Indicator (DQI) proposed by the United Kingdom (UK) Construction Industry Council. Then, a case study was conducted on a specific housing project. The developer and a number of homebuyers were invited to participate in a developer–homebuyer willingness survey in order to determine their preferences concerning the quality items and facilities established in Stage 1. Finally, a genetic algorithm (GA) was applied to perform a trade-off analysis on cost–quality differentiation strategies. The findings obtained in the present study were used to determine the relationship between homebuyers’ willingness to pay and quality performance, as well as the relationship between profit and the quality performance that developers are willing to provide, thereby clearly highlighting the optimal performance indicators for decision-making.

2. Current Housing Quality Determination Model

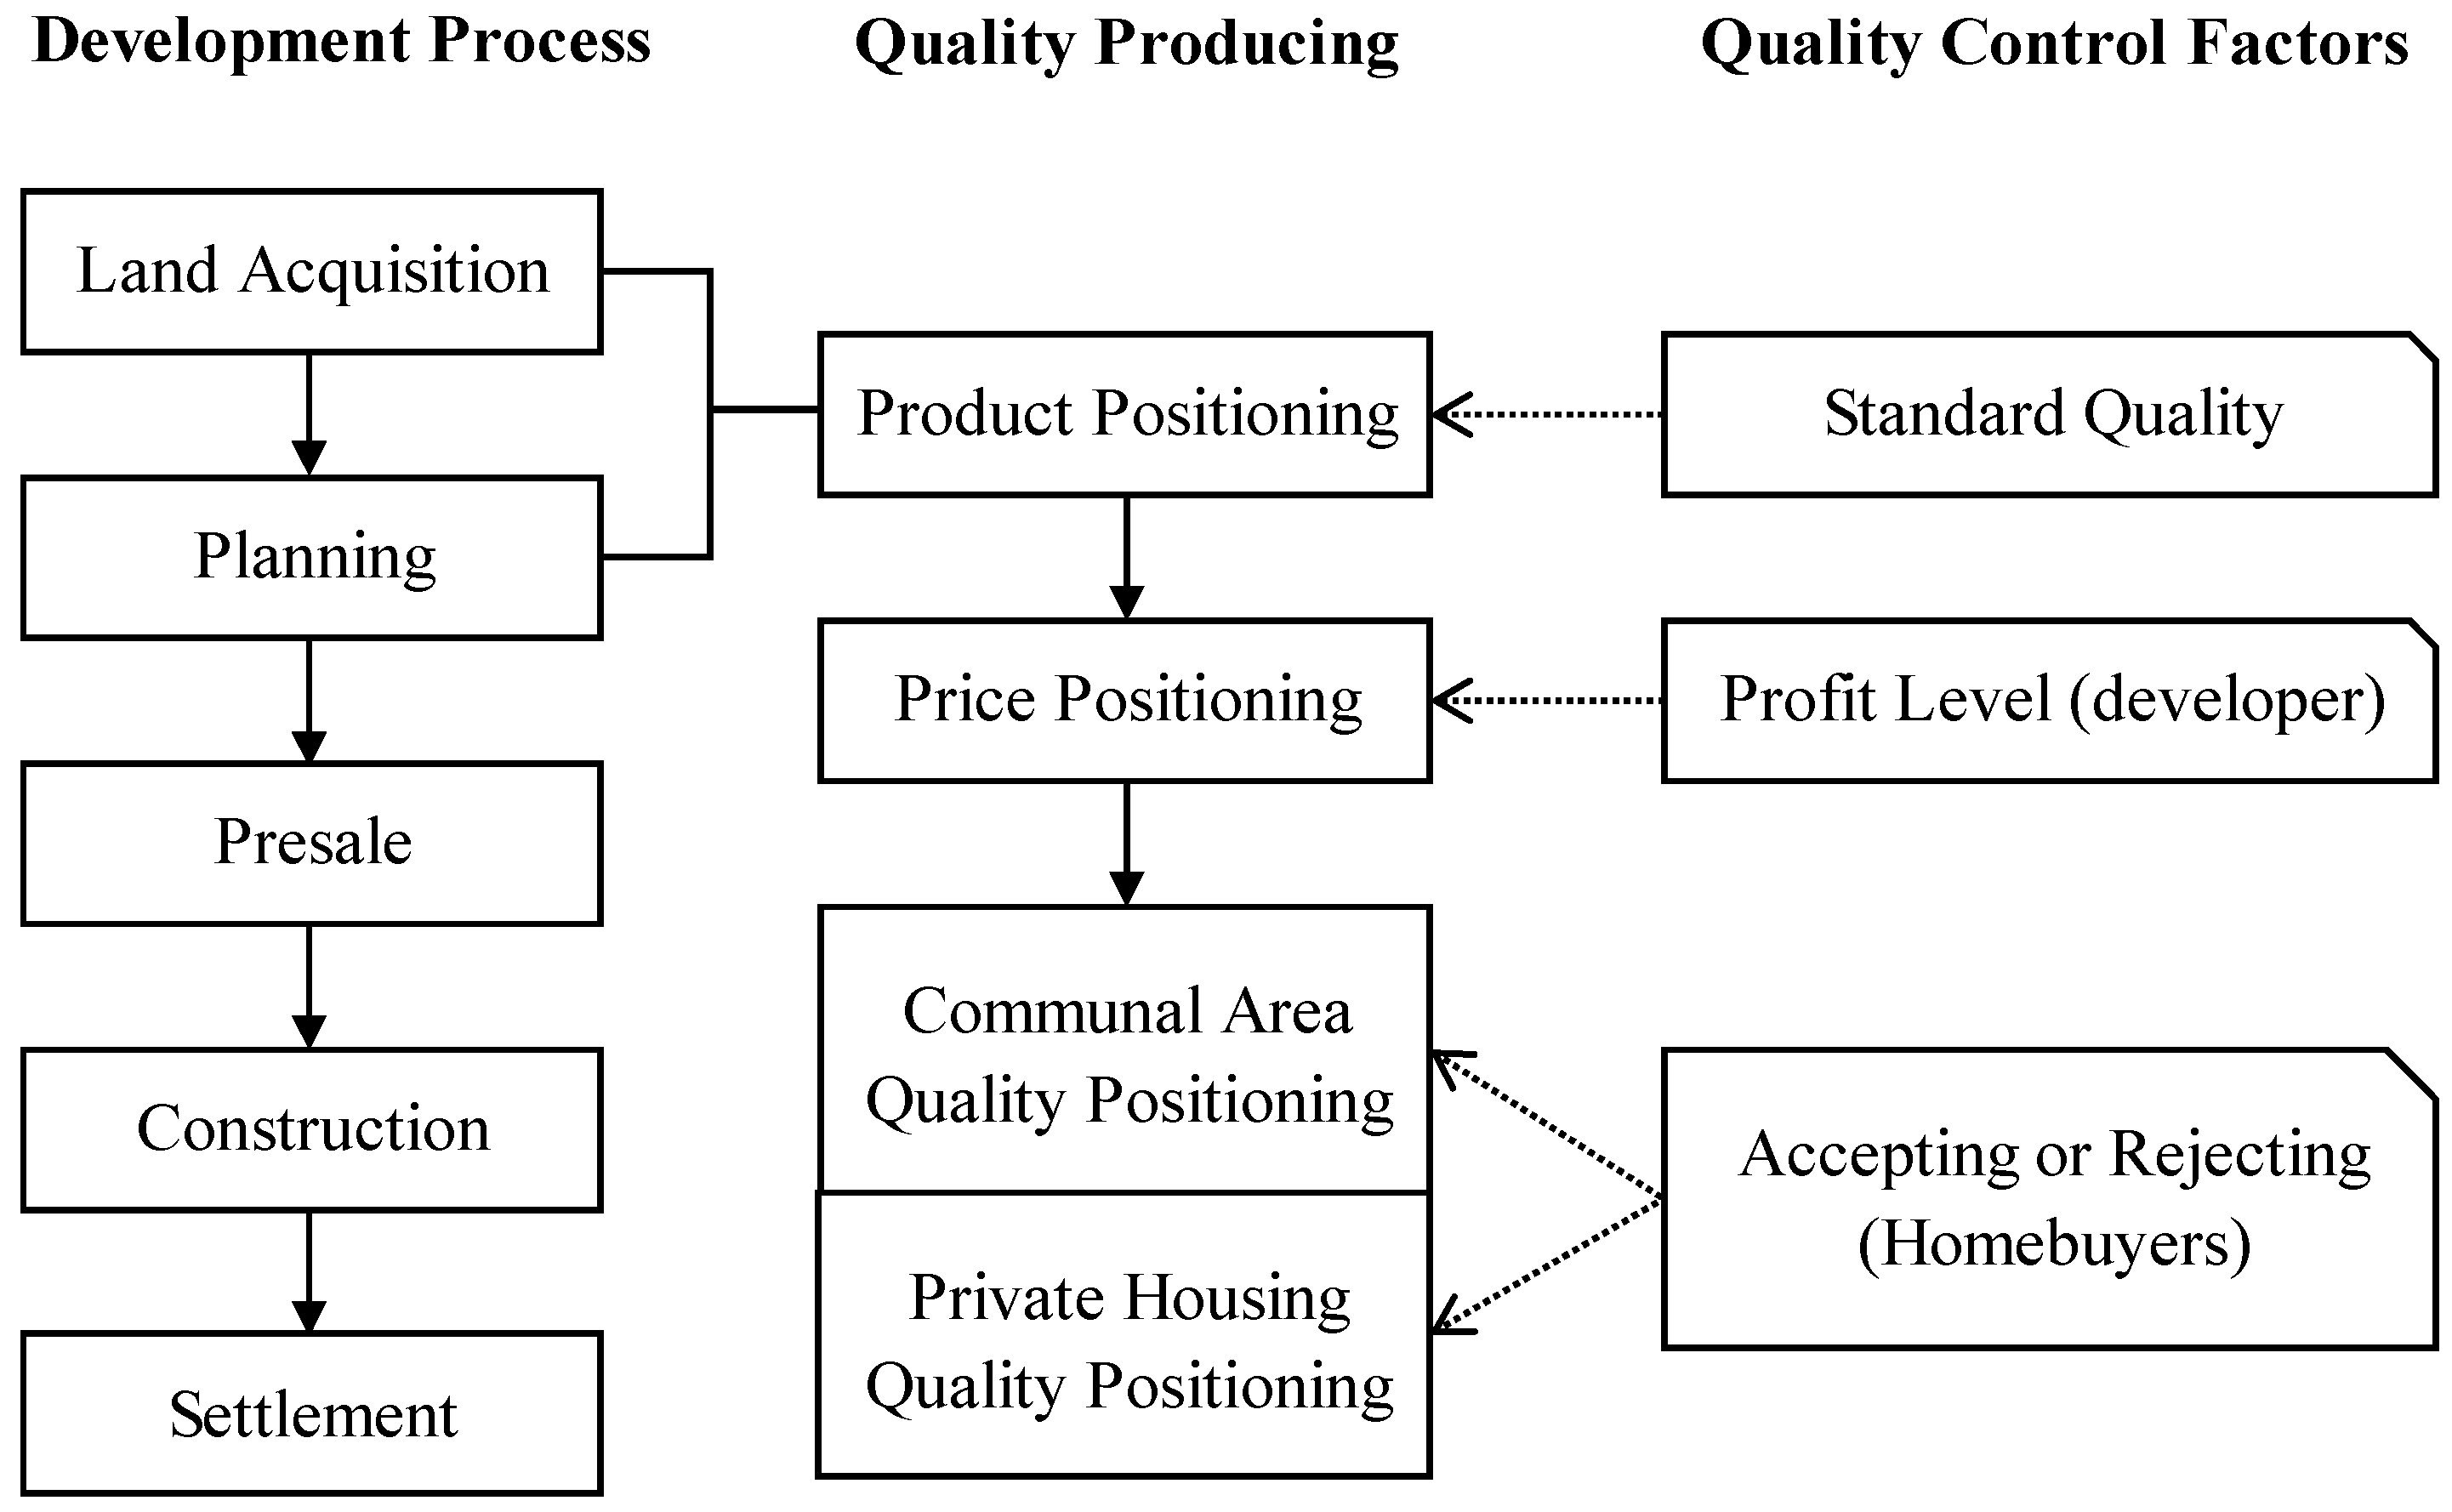
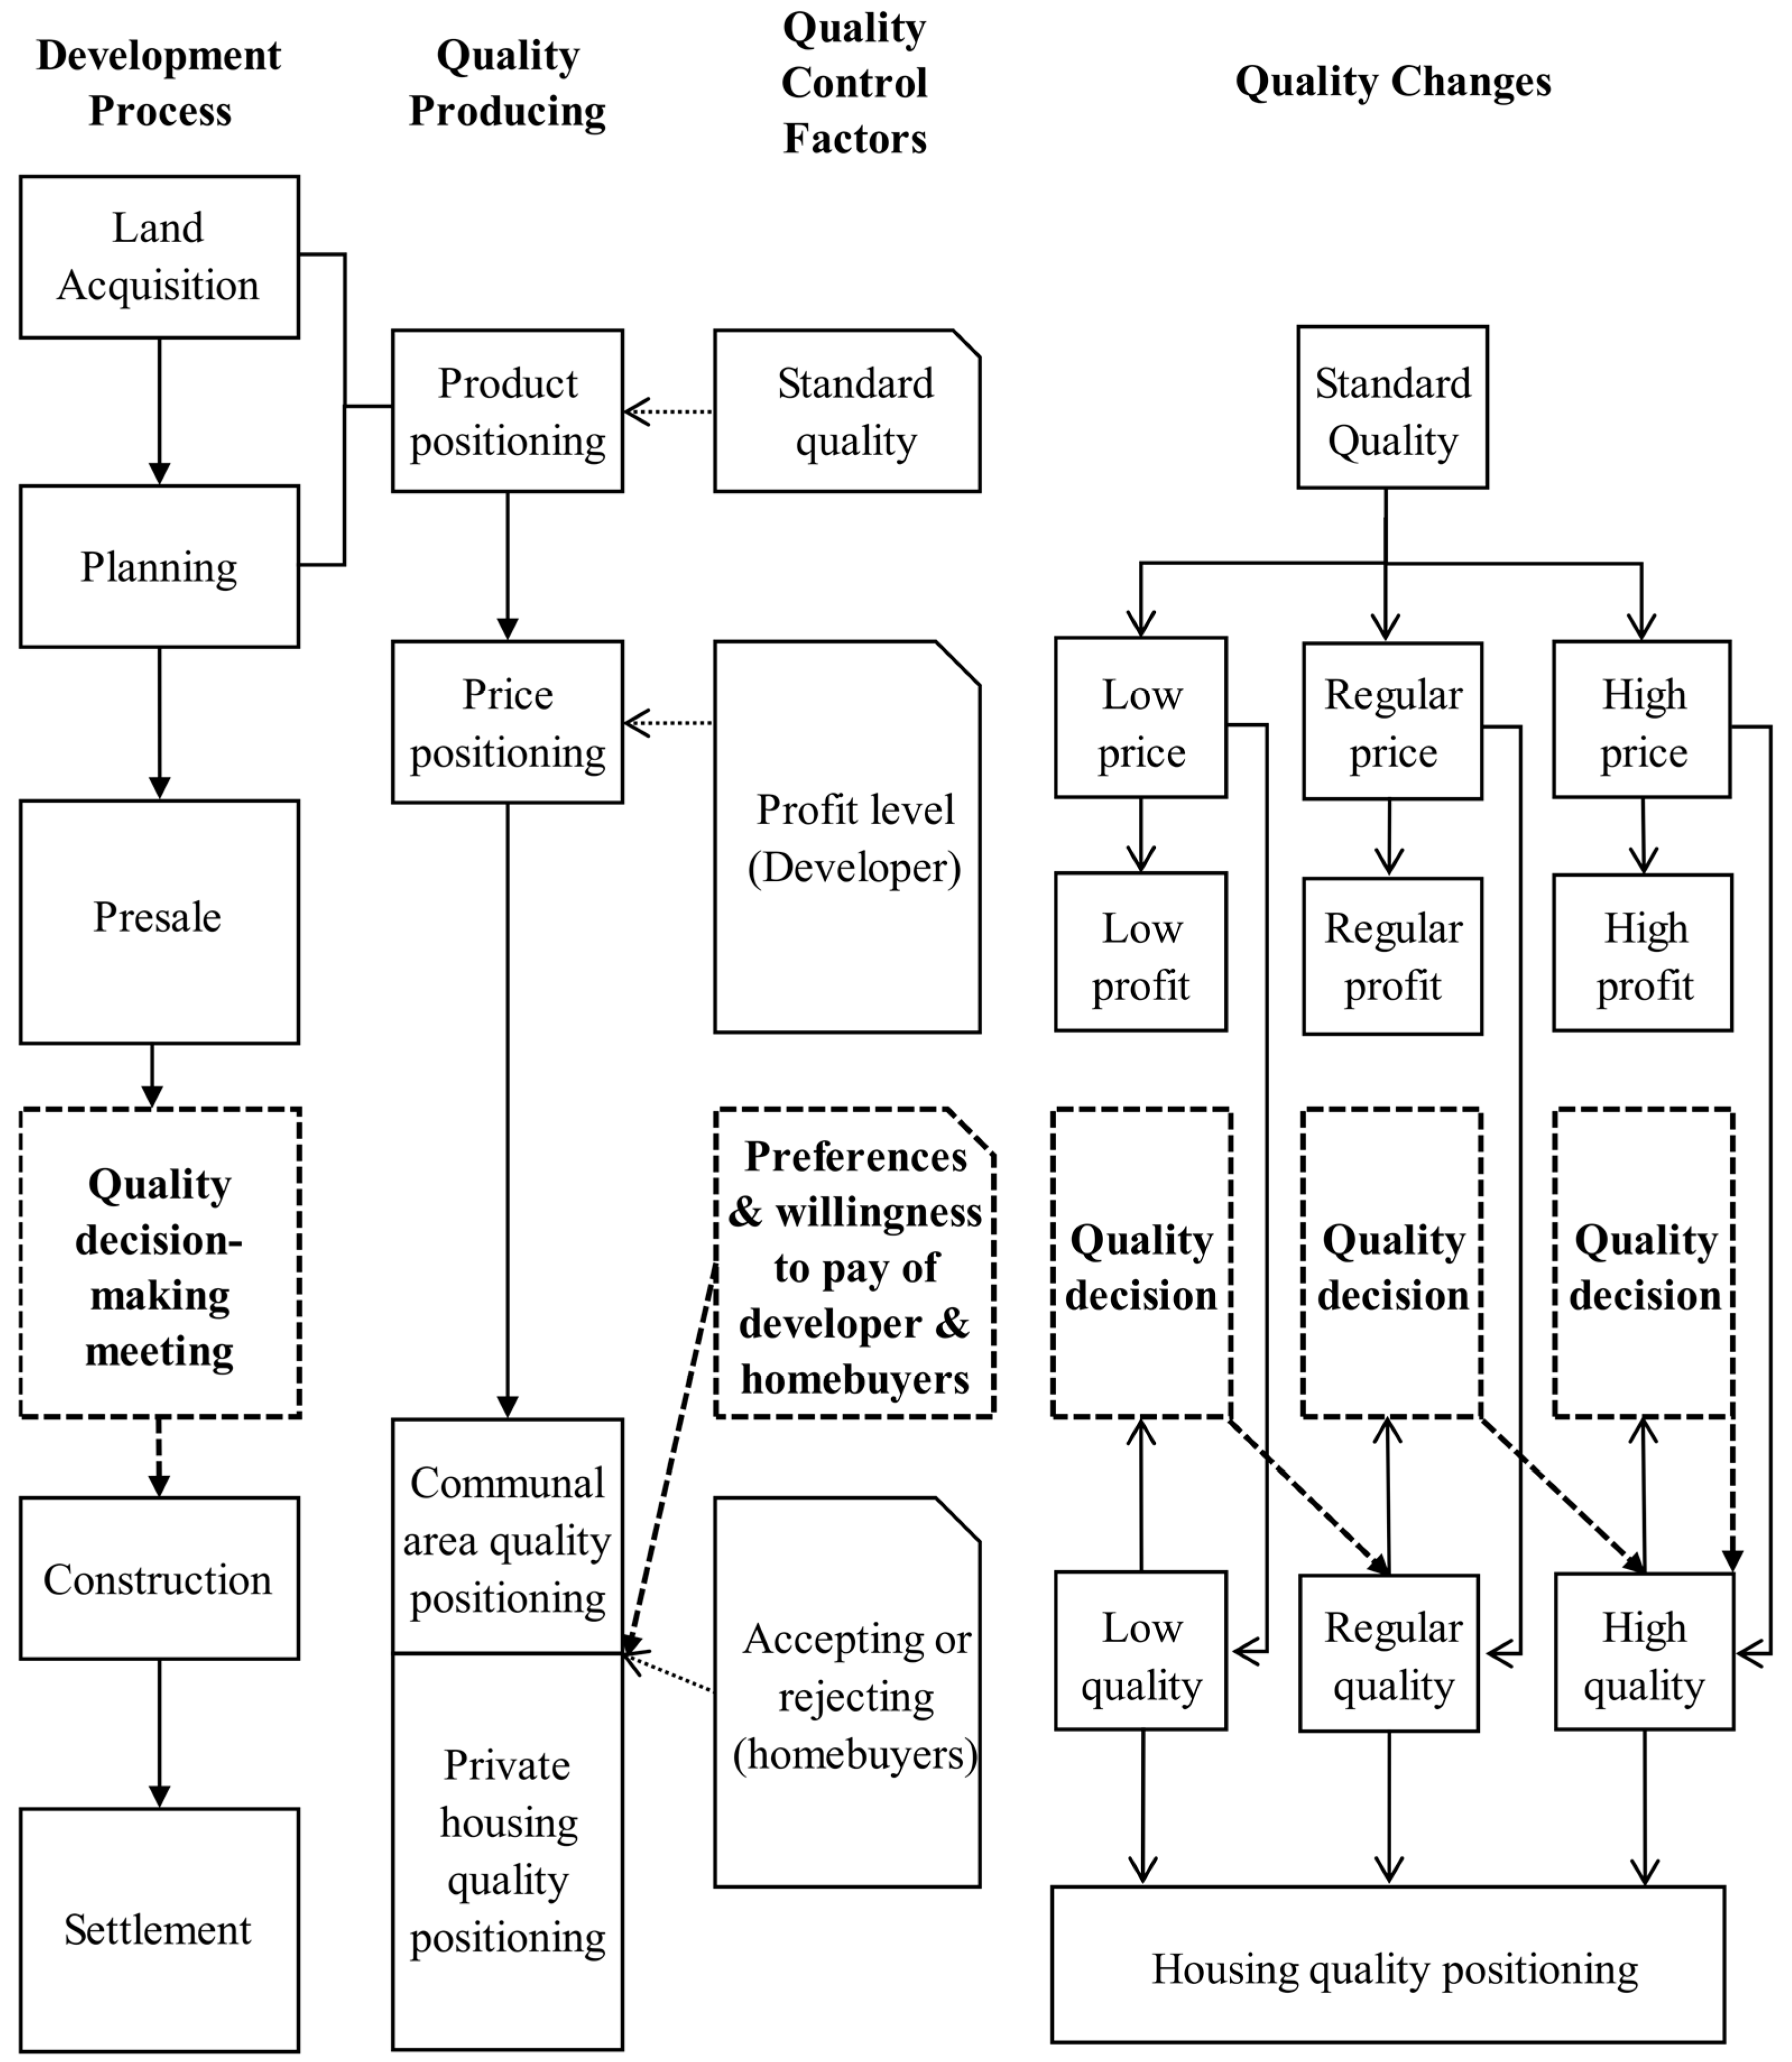
2.1. Pre-Sales Housing System

In the 1960s, rapid economic development in a number of Asian countries, including Taiwan, Hong Kong, China, Singapore, South Korea, and Malaysia, led to an explosion in housing demand. In order to meet growing demand, a unique and innovative presale housing system was developed that has been adopted and developed since then. Presale housing refers to contracted sales of dwelling units before the construction project is built. Under this system, developers are able to obtain funds from homebuyers in advance, thereby resolving funding problems and dispersing development risk. For the homebuyer, presale housing can be purchased at a discounted price, and they gain ownership rights in advance. Moreover, homebuyers are able to participate and supervise the progress of the housing project in order to ensure their property rights on completion of the project [17].
The presale housing system is extremely common in Asian markets [18,19]. According to the statistics announced by the Ministry of Housing and Urban–Rural Development of the People’s Republic of China (MOHURD), 80% of the urban housing in China is sold in the form of presale housing [20]. In Singapore, 55% of the housing is sold as presale housing [21]. Numerous other studies have indicated that the presale housing system has the potential to become a global trading mechanism for housing in the future [22]. The presale housing system will continue to grow steadily upon consensus between developers and homebuyers concerning the value of housing in the market, and upon developers fulfilling and homebuyers believing in the committed HQ [19].
In conventional housing supply models, dwelling units are sold once construction is complete. Quality positioning and facilities planning are confirmed once the construction project is complete, leaving little room for improving quality items. A number of studies have indicated that project quality and contractor satisfaction can be greatly enhanced if HQ can be improved during the planning stage of a construction project [2,23]. The presale housing system is a popular system in Asia. Theoretically, this system creates the opportunity to improve HQ. Developers are able to verify future occupants during the initial stages of project development, enabling them to provide customized designs and differentiated quality items in order to meet the actual needs of the developers and future occupants [5,6]. However, in order to maintain profitability and sales performance, the majority of contractors are unwilling to provide differentiation strategies for HQ.

2.2. Cost-Orientated Housing Quality

The collective housing development process in a presale housing system is sequentially: land acquisition, product planning, presale housing, construction, and settlement. Product type, pricing, communal area, and quality items and facilities are typically determined during the stages of land acquisition and production planning. In Taiwan, housing prices and property registration include communal and private areas and facilities. Subsequently, developers calculate construction costs and determine HQ by subtracting land cost, management and sales costs, and profit from the local housing price.
Figure 1 illustrates the collective HQ and control factors. Sales prices affects developers’ profit margins. Although the provision of high-quality items and facilities (quality differentiation strategy) can enhance homebuyers’ satisfaction, it can also compress profit margins for the developer. At present, homebuyers only have the option of accepting or rejecting the HQ. They have no chance to participate in the determination process of the quality items.
Assuming that a steel framework is adopted as the main building structure, which is roughly 20% more than the cost of reinforced concrete, the developer is bound to increase sales prices in order to compensate for the cost of the higher structural quality, and maintain profit. However, excessively high unit prices may affect sales performance. Therefore, conservative contractors are largely inclined to provide standardized products and quality in order to maintain expected profit, voiding the customization advantage of the presale system.

3. Concept of Optimal Cost–Quality Trade-Off

3.1. Design Quality Indicator(DQI)

The DQI is a tool for evaluating the design quality of buildings. It is an improvement toolkit that was developed by the United Kingdom Construction Industry Council in 1999 for measuring, evaluating, and improving the design quality of the buildings [24]. The purpose of the DQI is to establish a clear product quality model for buildings that can be used in the decision-making process. The model can be sampled in stages in order to improve and control the quality of buildings under development [25].
The framework of the DQI originates from the Roman architect, Vitruvius, who published a paper in the first century BC describing the factors of Western architecture culture and design. These factors consisted of utilitas, firmitas, and venustas, which are often translated as useful, durable, and beautiful [24]. Based on the aforementioned framework, the DQI comprises three major design quality dimensions and 10 indicators. (1) Functionality—the arrangement, quality, and interrelationship of spaces and how the building is designed to be useful to all. (2) Build Quality—the engineering performance of the building, which includes structural stability and the integration, safety, and robustness of the systems, finishes, and fittings. (3) Impact—the building’s ability to create a sense of place and have a positive effect on the local community and environment [26].
According to the results of a case study published on DQI.org.uk, the percentage of contractors implementing DQI into the briefing stage of their construction projects was the highest. In a Market and Opinion Research International (MORI) poll commissioned by Chartered Association of Building Engineers (CABE) in the UK, through the DQI, 85% of respondents agree that: better quality buildings and public spaces improve the quality of people’s lives. These results are consistent with the quality assurance concepts of the presale housing system. Specifically, homebuyers are able to participate in project planning and assess the level of HQ, thereby maximizing quality control. The aforementioned 10 indicators of DQI also serve as categories for the presale HQ items in Taiwan.

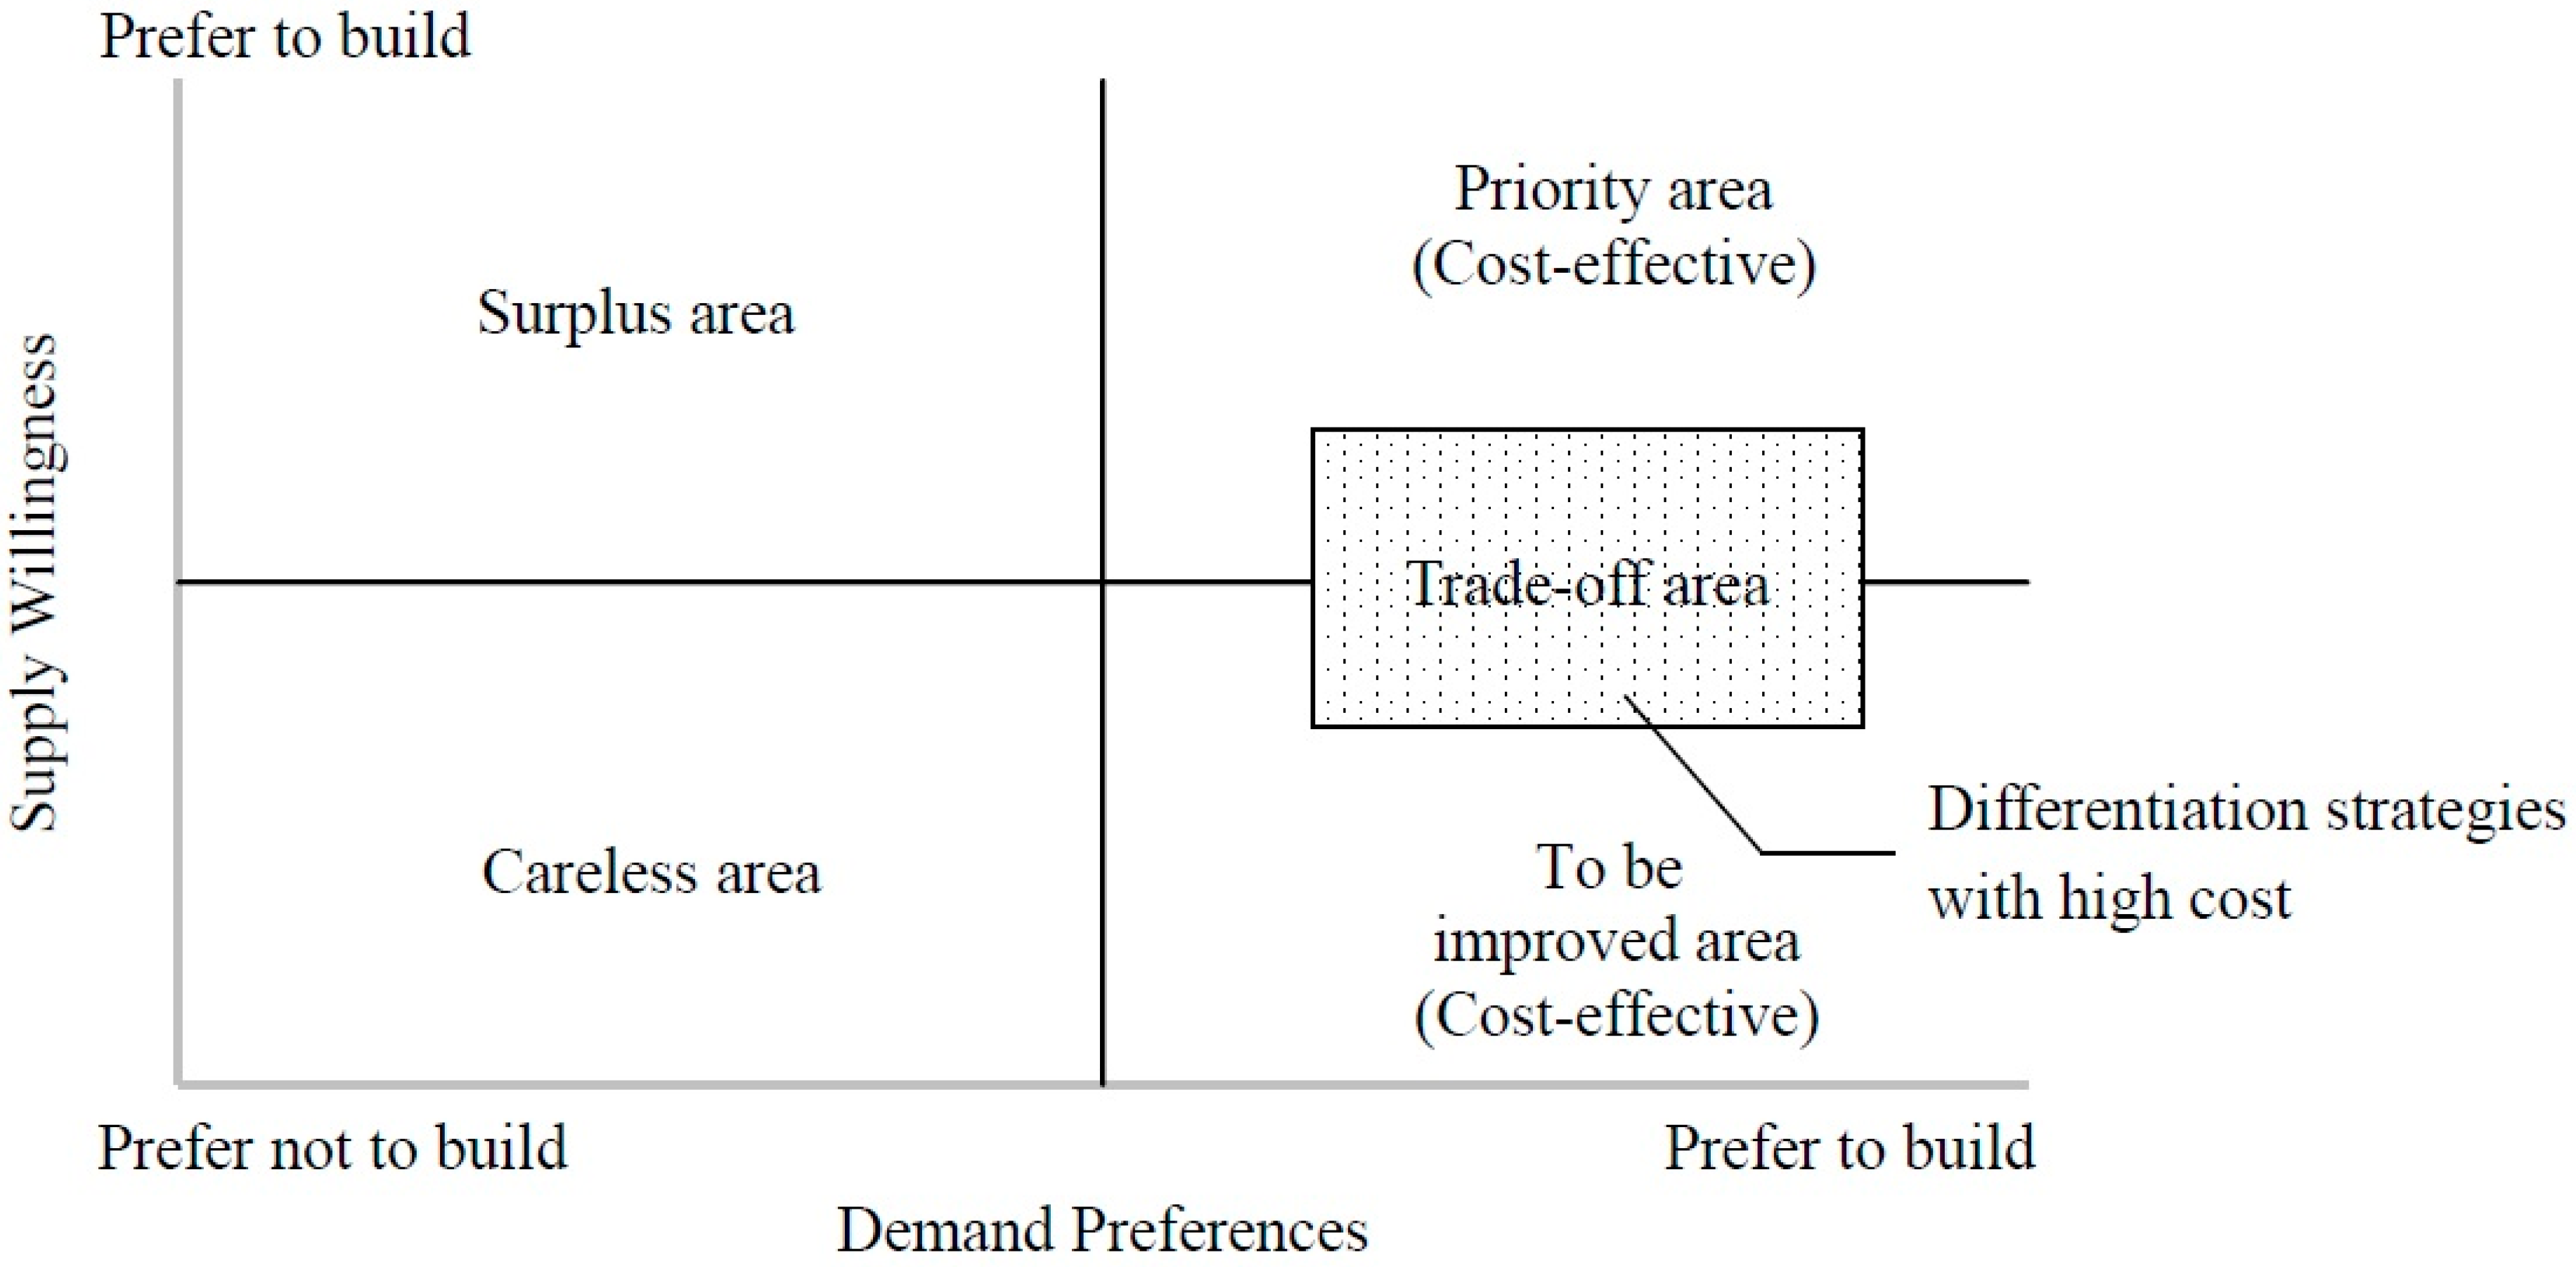
3.2. Differentiation Strategies for Cost and Quality

The implementation of differentiation strategies represents a company’s ability to create unique value during its pursuit of profit [27,28]. From a cost–quality perspective, effective differentiation strategies that are cost-free or only require minimal cost should be prioritized. Those that necessitate a higher cost should be prioritized according to market and user demands [29]. However, differentiation strategies manifest an underlying risk. Consumers may choose to forfeit differentiation for low-cost strategies if the cost of differentiation is excessive. This explains why developers are inclined to choose standardized products and quality.
Differentiation emphasizes the provision of unique value to the customer. When customers are satisfied with the quality of the product, they are more willing to pay a price equivalent to or exceeding the quality [21,30,31]. Therefore, quality differentiation is defined as the provision of value other than that required to satisfy standardized housing products in the present study. Developers are less willing to provide such benefit, which includes unique designs, facilities, equipment, materials, and services. A matrix with demand (X-axis) and supply preferences (Y-axis) can be depicted (see Figure 2) to address the relationship between the differentiation strategies of the two sides. Demand preferences mean that the level at which homebuyers regard these differentiation strategies as important items, and prefer to have these items in their housing. Supply willingness mean the developers’ willingness to provide differentiation strategies after considering the construction cost, time, and technology difficulty. In other words, differentiation items that are not preferred by homebuyers should not be considered. These items can be allocated to the “Surplus area” or “Careless area”.
By elucidating homebuyers’ demands and values, developers can prioritize quality differentiation items that are cost-effective and preferred by the homebuyers, such as those that are located in the quadrant I (“Priority area”) in Figure 2. Items located in this area imply that these items have greater impacts on increasing homebuyer’s preferences and satisfaction, and should be implemented first. Items that are cost-effective, preferred by homebuyers, and less preferred by developers should also be allocated to the “To be improved area” in order to enhance quality satisfaction greatly. Items that are more costly should be allocated the “Trade-off area”, depending on the relationship between the costs of differentiation strategies and the willingness difference (synergy) of homebuyers and developers. If the cost of differentiation is high and the synergy of two sides is low (not cost-effective), these items might be excluded from the optimal process. Through this process, a customer-focused design can be created. With differentiation strategies, homebuyers are willing to increase their WTPs in order to improve their living satisfaction, and developers can meanwhile take these increased WTPs as incentives to provide high-quality housing.

3.3. A New Model for Housing Cost–Quality Trade-Off

Current cost-oriented HQ supply models present numerous problems. They are unable to meet the HQ expectations of homebuyers, and developers are only willing to provide standardized products and quality. The present study examined the housing demands, quality recognition, and cost (including sales price and profit) problems of both homebuyer and developers, and proposed a novel housing cost–quality trade-off model (Figure 3). Moreover, a presale HQ decision-making meeting was incorporated into the development process. Both developers and homebuyers participate in this meeting in order to reach a consensus concerning quality, where cost is adjusted by including or excluding quality items.
Theoretically, homebuyers are willing to increase their budget in order to gain an increased quality of products. Developers are willing to satisfy homebuyers’ quality expectations without compromising profits. Therefore, the trade-off problem for homebuyers and developers is to identify the optimal quality level that fits homebuyers’ budget, while retaining developers’ profit.

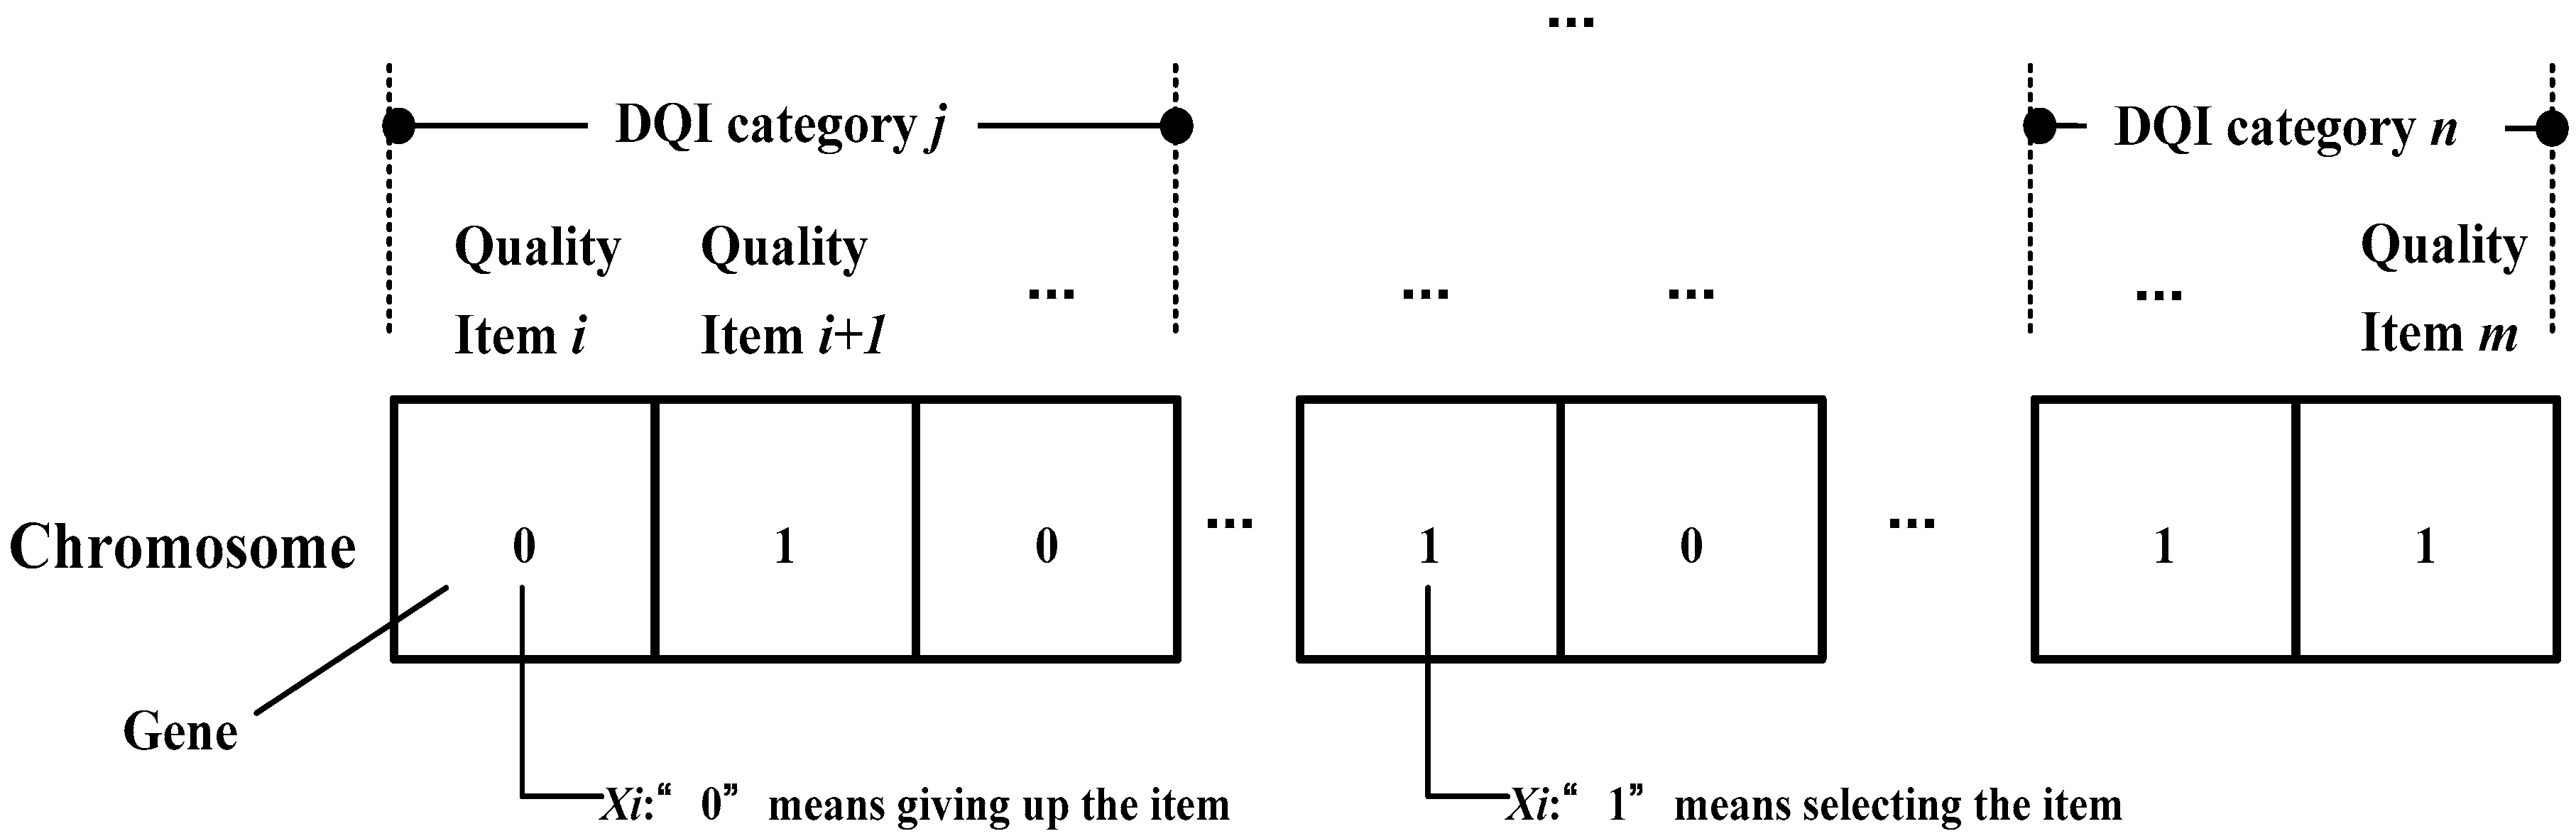
3.4. Genetic Algorithms (GAs)

The quality item selection set for a package may exceed more than billions of combinations. In order to optimize the trade-off between cost and quality, this study adopts the GA as an effective analytic tool and stochastic search technique. It is helpful in solving large and complicated problems by using ideas from natural genetics and evolutionary principles [32]. Combining problem-solving algorithms with the principles of evolution, the GA demonstrates great operations in combinatorial optimization [33]. By giving more chances to the better elements to have offspring in the next generation, the GA facilitates an evolutionary process in which elements in a population progressively improve over time [34].
Implementing the GA entails a set of trial solutions that are coded as chromosomes. A chromosome is composed of genes representing variables (quality items). Each chromosome is evaluated on its performance with respect to the fitness function. The ones with better performance are more likely to survive than the ones with worse performance. This evolutionary process of genetic information is preceded by crossover, and perturbed by mutation. The result is a new generation with better survival abilities. The process is repeated until the chromosomes in the new generation are identical, or certain termination conditions are reached [35]. For the chromosome structure, as illustrated in Figure 4, the value of a variable is specified as the content of the gene, which means the quality item selections (the items of improving housing quality from the framework of the DQI, see Table A1) in this study.
Assuming that the proposed model comprises an mth number of quality items, Bi (i = 1, 2, 3, …, m) represents the cost that homebuyers would have to pay for the ith quality item, and Di (i = 1, 2, 3, …, m) represents the cost that developers would have to pay for the ith quality item. B represents the value that homebuyers are willing to increase their total housing purchasing budget, and D represents the value that developers are willing to provide a total budget for quality after taking into account their profit. In addition, Gi (i = 1, 2, 3, …, m) represents homebuyers’ willingness to pay for the ith quality item, and Hi (i = 1, 2, 3, …, m) represents the developers’ willingness to provide the ith quality item.
Subsequently, xi represents the benefit of investing in the ith quality item. The following problems are expressed using the fitness function of the GA. First, Ci (=Gi + Hi) is used to express the synergy between developers and homebuyers. If Gi and Hi are higher than the mean value of homebuyers’ and developers’ willingness values (items located in the quadrant I in Figure 2), respectively, then the items with higher Ci are more advantageous to be selected during the optimal process.
Quality items with high homebuyer preferences and developer willingness, as well as items with high homebuyer preferences and low developer willingness, are listed as priority improvement items (Equations (1) and (2)). Second, quality items with a homebuyers’ preferences value lower than the mean value a were allocated to the “Careless area” and “Surplus area”. These are the priority items for exclusion (Equation (3)). Third, the total cost of the quality items generated by the optimal solution must be smaller than the total budget that the homebuyers and developers are willing to pay (Equations (4) and (5)). If the cost of differentiation is high, and the synergy of two sides is low (not cost-effective), these items might be also excluded.
M a x   i = 1 m C i x i
C i = G i + H i i = 1 ,   2 ,   3 , ,   m
If   G i ( i = 1 ,   2 ,   3 , , m ) a ,   then   x i = 0
i = 1 m B i x i B i   =   1 ,   2 ,   3 ,   ,   m
i = 1 m D i x i D i = 1 ,   2 ,   3 , ,   m
xi = 0 or 1 i = 1, 2, 3, …, m

4. Case Study: Cost–Quality Trade-Off Model Applied to a Housing Project

4.1. Project Debriefing

A collective housing project in the East District of Taipei City was selected for the case study. The site area of the project was 1402 m2. The project entailed the construction of a 15-floor building, comprising 13 aboveground levels and two basement levels. The building contained 55 dwelling units and 49 parking spaces. The total floor area of the project was 8908 m2. According to the sales and engineering contract information provided by the developer, the total sales price was $42,926,689 USD, and the total cost price was $28,729,086 USD (including $7,239,413 USD for the construction cost, $429,267 USD for the management cost, $1,180,484 USD for the sales cost, and $19,879,922 USD for the land cost). The estimated profit for the project was $14,197,603 USD (total sales price − total cost price = expected profit).
The project first provided a set of normalized HQ items. The research team and the developer repeatedly reviewed these items against the 10 indicators of the DQI, and formulated 50 quality differentiation items (see Table A1) for improving HQ. The developer was then asked to estimate the cost involved in improving individual quality items. The cost was converted to a percentage (total construction cost/item cost).
A questionnaire was developed based on the 50 quality improvement items. A nine-point scale and a semantic assessment framework were developed to determine the developers’ and homebuyers’ willingness to improve each quality item in a standardized product, and the amount that both parties were willing to pay in order to improve each quality item. The nine-point scale fully expressed respondents’ level of willingness, where a score of 5 (no comment) was the neutral reference value. The scores were then converted into percentages to enhance data accuracy and practicality. Descriptions of the nine-point scale and semantic assessment framework are provided in Table 1.
The respondents were the presale homebuyers of the case building. The survey period was between March–April 2016. A total of 59 questionnaires were administered, and 53 valid questionnaires were returned. Among the respondents, 45.28% were men, and 54.72% were women. Subsequently, 43.40% of the respondents were between the ages of 40–49. Respondent age groups comprised the ages of 20 to 29, 30 to 39, 40 to 49, 50 to 59, and 60 and above, accounting for 3.77%, 13.21%, 43.40%, 24.53%, and 15.09% of the respondents, respectively. Six mid-level and high-level executives who were serving in the case company and involved in the construction of the case building were also invited to participate in the questionnaire survey.

4.2. Results of the Questionnaire and Trade-Off Model

The system is developed under the Java Server Pages (JSP), Java environment, Apache Tomcat web container, and MySQL database. The mating convention for reproduction is that only the high-scoring individuals preserve and propagate their worthy characteristics from generation to generation, and thereby help in continuing the search for an optimal solution. The crossover rate and mutation rate in this study are set at 0.4 and 0.02, respectively. In addition, the search is set to terminate when the trade-off curve does not change in 10 consecutive iterations.
Survey results show that the homebuyers were willing to increase their budget by an average of 8.33% to improve the HQ. The system selected 34 quality improvement items for a final controlled budget of 8.02%. The developers were willing to pay an additional 5.95% to improve HQ. The system selected 31 quality improvement items. Homebuyers’ average willingness score for improving HQ was 6.78 (total of 16.54). Developers’ willingness score for improving HQ was 6.71 (total of 15.17). The willingness to pay and the quality items selected by the homebuyers and developers were tabulated in Table 2. Items with an average homebuyers’ willingness score of less than 5.5 were allocated to the “Surplus Area” and “Careless Area”, and prioritized for exclusion.

5. Discussion on Housing Cost-Quality Performance

To evaluate the relationship of cost–quality trade-off decisions, the improvement performance of the quality items for the homebuyers and the developers were reviewed in the present study. Thirteen quality items (26.02%) were selected with a 1% increase in the homebuyers’ budgets, and homebuyers’ preference and willingness increased by 86.85 points (25.63%). By analogy, 35 quality items can be selected (70.20%) with a 10% increase in the homebuyers’ budgets, and homebuyers’ preference and willingness can be increased by 240.74 points (71.05%). The simulation results of homebuyers’ willingness to increase their budget between 1–10% are tabulated in Table A2. The table shows the changes in quality items and willingness scores.
ΣG represents the homebuyers’ preferences or willingness to pay for a quality item, and ΣS represents the selected quality item. Subsequently, the improve quality indicator (IQI) can be defined as the weighted results of the homebuyers’ preferences or their willingness, and the selected quality item (ΣG*ΣS). Besides taking into account homebuyers’ preferences or willingness, cost factors should also be considered in order to present the relationship between trade-off decisions regarding cost and quality more clearly. In other words, the IQI increases concurrently with an increase in homebuyers’ preferences or willingness, and the number of quality improvement items, suggesting that homebuyers are more willing to pay an increased premium. Table A2 also shows the relationship between the IQI and changing cost, where the IQI was 6.67%, with a 1% increase in cost, and 49.88% with a 10% increase in cost.

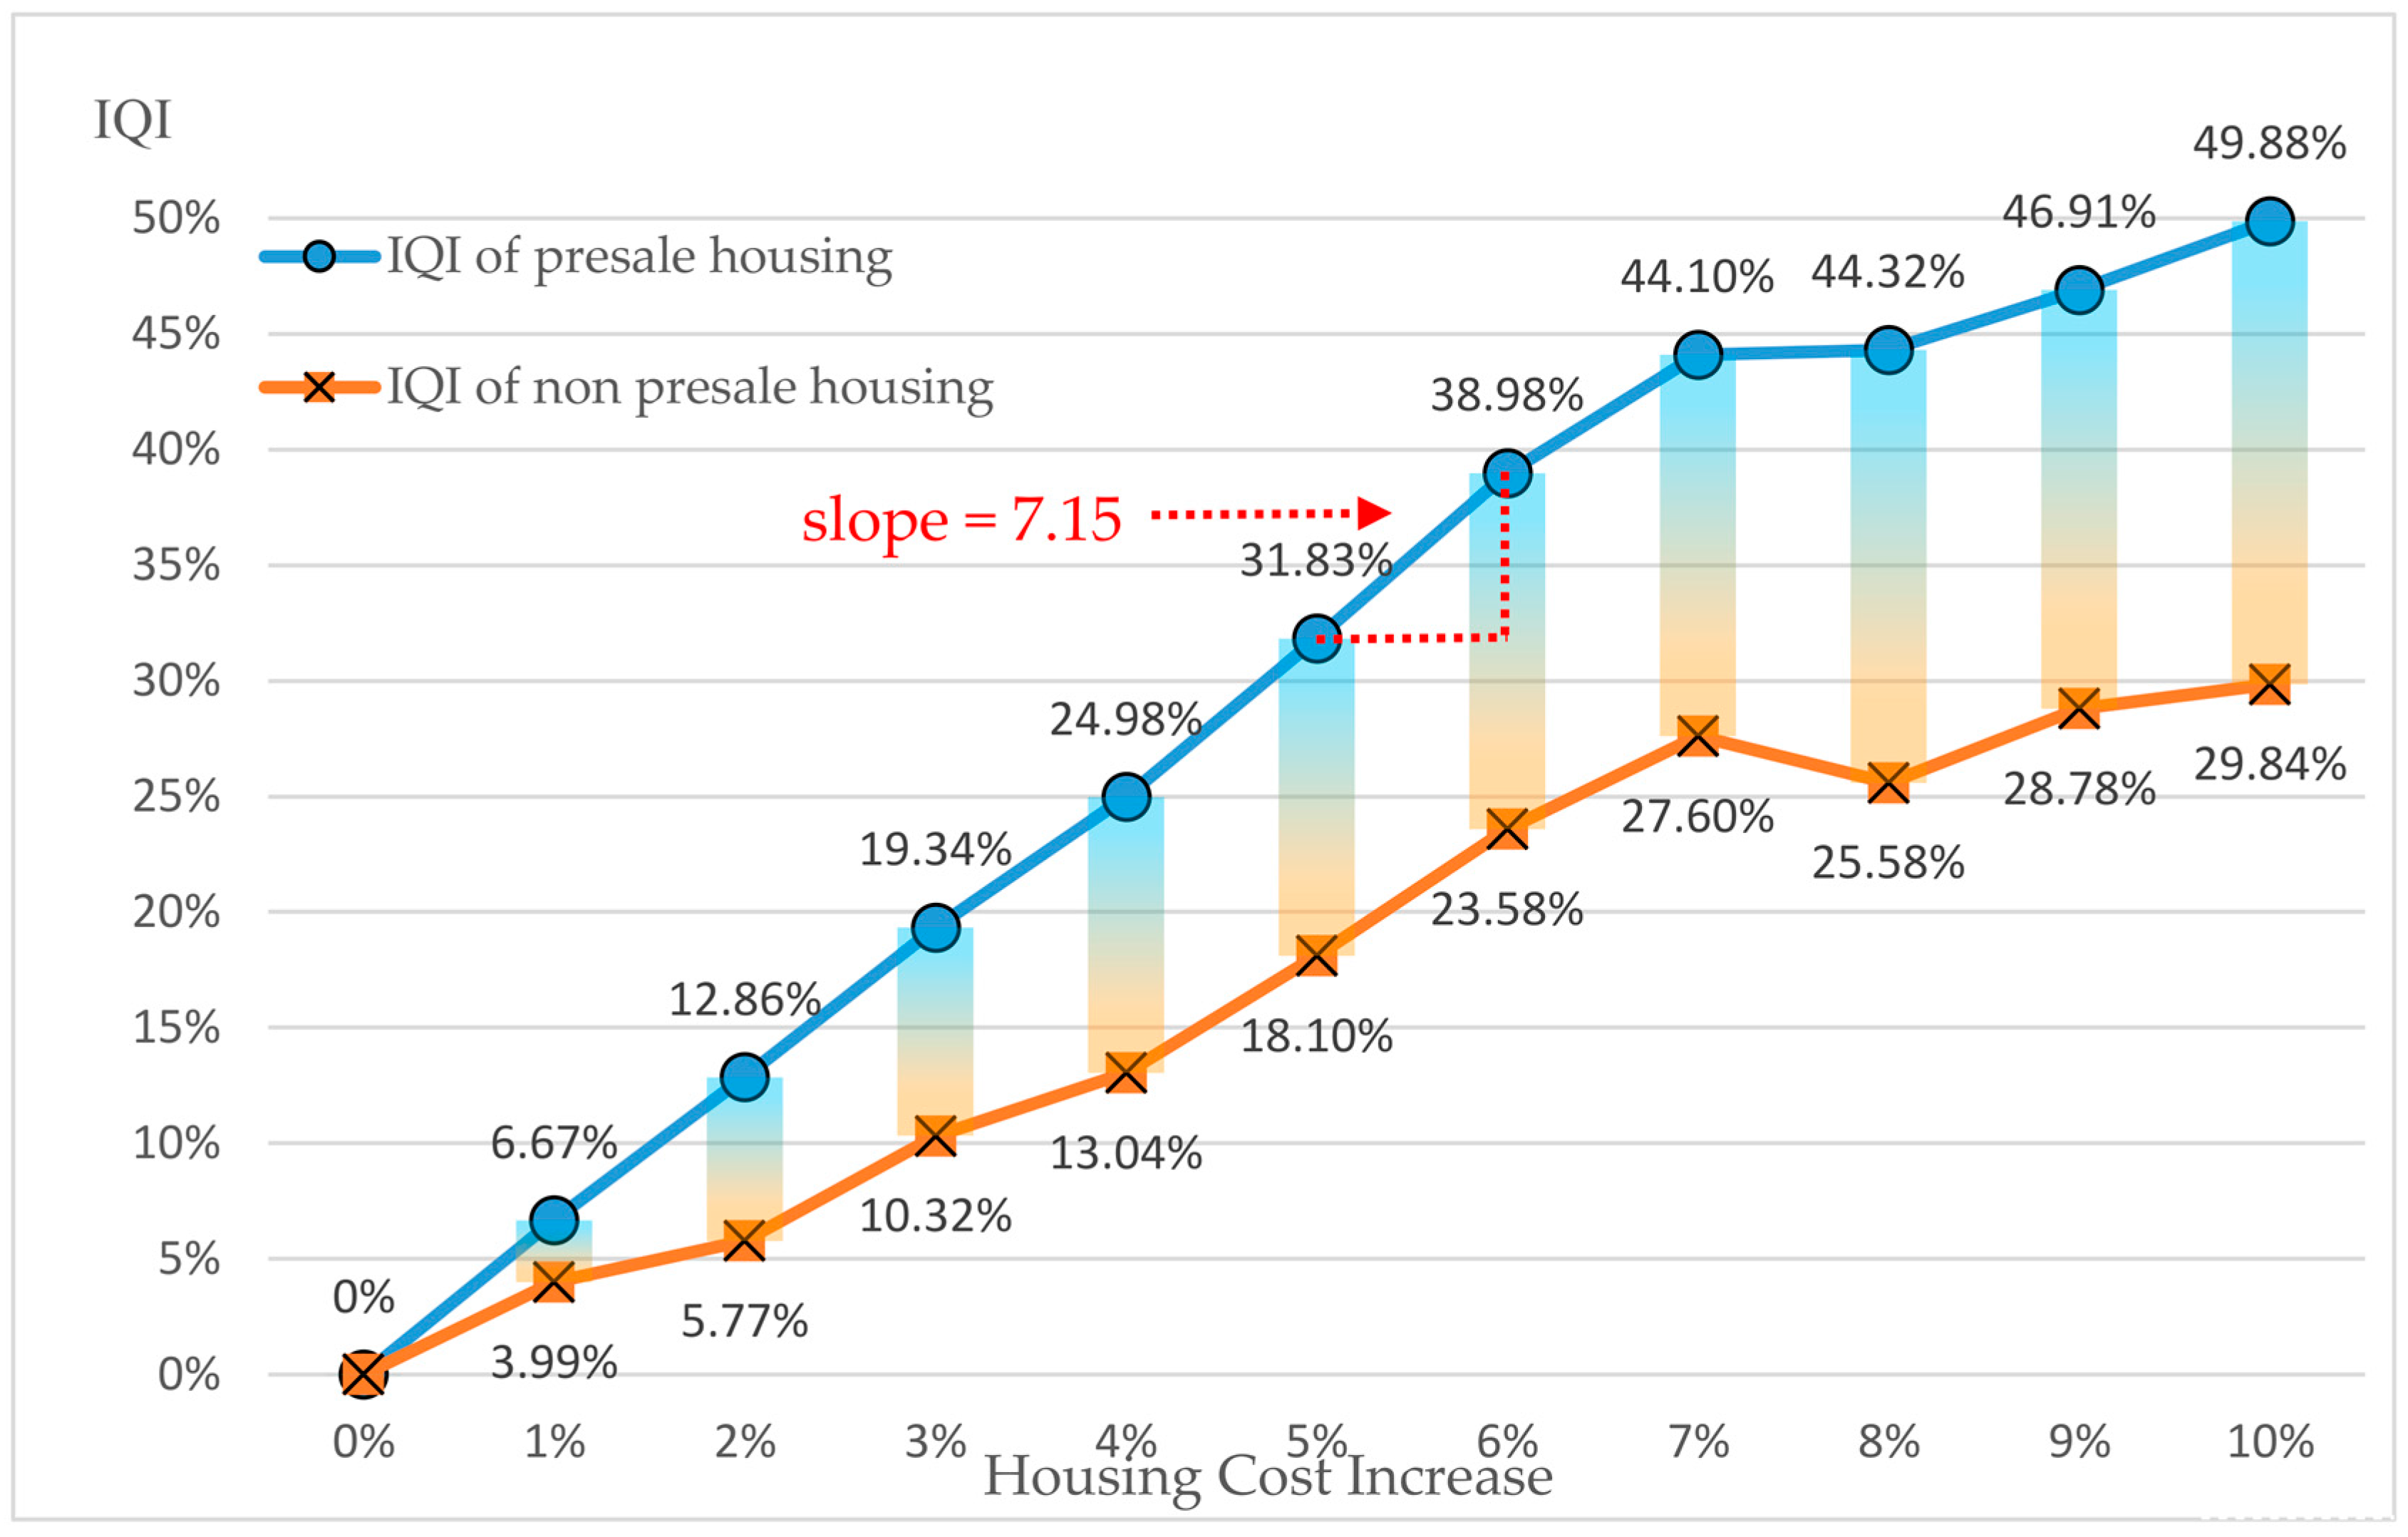
5.1. Cost Performance of Homebuyers’ Quality Improvement Strategies

The quality improvement conditions of non-presale housing were also simulated in the present study. The simulation results of homebuyers’ willingness to increase their budget between 1–10% for the acquisition of non-presale housing, quality improvement items, changes in willingness and the IQI are tabulated in Table A3. For non-presale housing, a number of quality items were completed after the initial project design was confirmed. These items cannot be changed by the homebuyer. Therefore, homebuyers’ selection of quality improvement items and their willingness were relatively more restricted. The homebuyers’ willingness to pay and the quality improvement indicators that are tabulated in Table A2 and Table A3 are also depicted in Figure 5.
In Figure 5, slopes were illustrated in order to define the cost performance of the quality improvement strategies (quality improvement performance per 1% increase in the homebuyers’ budgets). The greater the slope, the better the quality improvement effect. The results indicated that the slope achieved 7.15 when the homebuyers’ budgets increased by 6%, achieving the optimal quality improvement effect. Diminishing the marginal benefit was exhibited once the budget was increased by 8%. The slope at 8% was only 0.21, exhibiting the least favorable quality improvement effects. In other words, paying a higher unit price could not guarantee a proportionate return on the HQ. The analysis results also verified that that the homebuyers’ average willingness to increase their budget by 8.33% is an inefficient investment, and that favorable HQ improvement effects are achieved during the presale housing stage. Figure 5 shows that the IQIs of non-presale housing were substantially lower than those of presale housing. This is because a portion of the quality items cannot be changed once construction is complete, regardless of the amount that homebuyers are willing to pay. Therefore, benefits can be maximized if HQ and satisfaction are improved at the planning and design stages by incorporating participation strategies and considering homebuyers’ HQ opinions. The result is consistent with some studies that revealed that housing providers should regulate their housing activities and design accuracy at the original design stage in order to suit households’ needs and wants by examining factors that account for housing satisfaction or dissatisfaction [2,3,4].

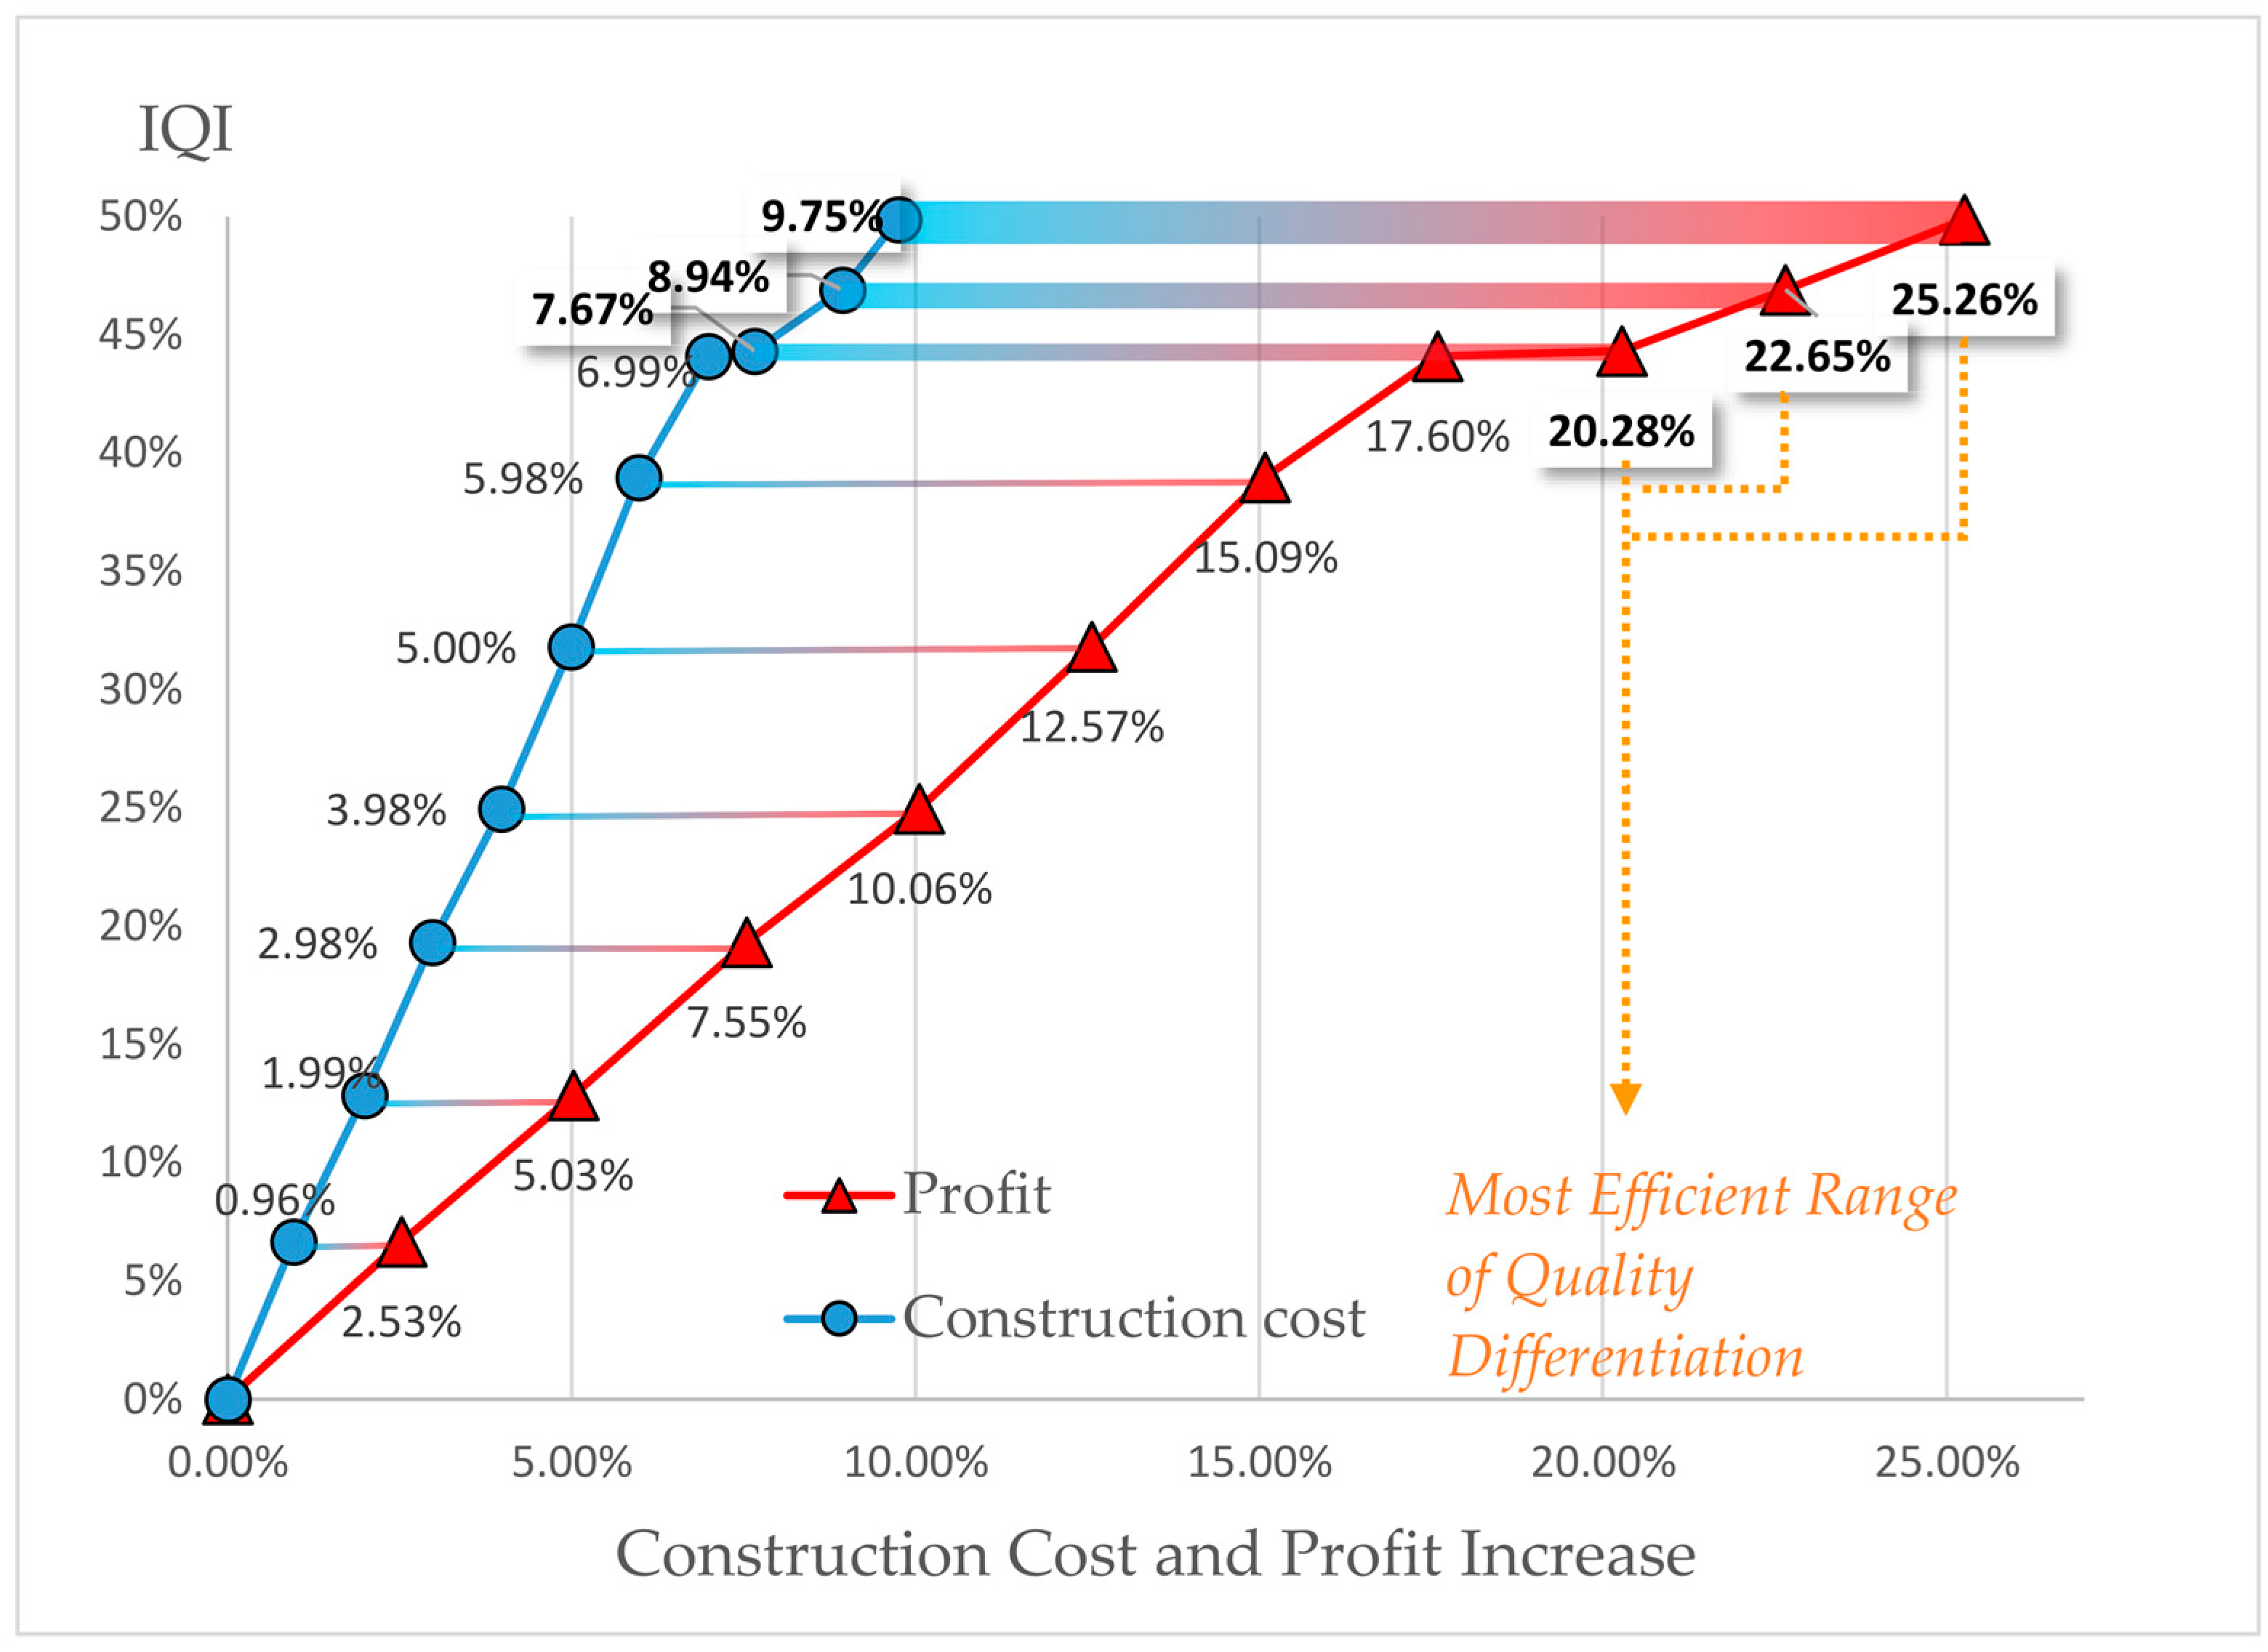
5.2. The Profit Performance of Developers’ Quality Differentiation Strategy

The relationship between profit and IQI are simulated in order to identify the incentives for developers to adopt quality differentiation strategies (see Table A4). The initial expected profit of the case developer was $14,197,604 USD. This value is set as the origin of profit increase (0%) in order to examine the changes in construction cost and quality after quality differentiation strategies are implemented.
Figure 6 shows that developers’ profit increased by 2.53% with a 1% increase in cost (IQI = 6.67%). Subsequently, an investment of an additional 10% into quality differentiation would increase profits by 25.26% (IQI = 49.88%). Figure 6 further reveals that within a 7% increased construction cost, profit steadily increases with IQI. An increase in construction costs between 8–10%, locating the area of the Most Efficient Range of Quality Differentiation in Figure 6, markedly increased the IQI and excess returns. The proposed optimal cost–quality trade-off model can distinguish the insights among the quality items and costs, as well as homebuyers’ WTP and developers’ profits. In other words, if developers are willing to slightly increase the construction cost in order to improve housing quality, they can acquire the excess profits coming from homebuyers who can detect the quality differentiation and are then willing to increase their WTP to purchase the housing. The WTP meanwhile incentivizes developers to employ more advanced building technologies and materials in order to enhance the building quality. This is a win–win situation that optimal pricing strategies should be developed in the real estate market according to consumer-perceived prices and developers’ expected profits. These assumptions can be supported by the findings of some empirical studies, which revealed that insufficient incentives of quality design would be one of the critical challenges of improving housing quality [4], and the selling price and appreciation rate are significantly related to housing construction quality. These studies showed that well-constructed housing not only commands a higher price for developers, it also generates higher capital gains for homebuyers in the future [21]. In addition, survey results show that developers are willing to increase construction costs by an average of 5.95%, which is clearly lower than the optimal quality differentiation effect. We recommend increasing the construction cost by 8% or more in order to maximize premiums. By using this model, developers can differentiate themselves from other developers and increase competiveness by earning more excess profits.

6. Conclusions and Suggestions

HQ has been a long-standing concern for both homebuyers and developers. However, to date the developers have exclusively determined the HQ, and homebuyers have only had a passive choice of whether to accept such HQ. Asian housing supply markets largely adopts the presale housing system, under which developers are able to verify future occupants before initiating construction, thereby enabling them to provide customized designs and differentiated quality items in order to meet user demands and value, as well as enhance HQ. In conventional presale housing systems, HQ depends on the developers’ mentality and expectation for profits, while homebuyers are left with only the choice to accept or reject the provided HQ. Under extreme information asymmetry, paradoxical and irrational patterns of supply and demand are often exhibited in presale housing markets. A complex relationship exists in homebuyers’ perception of HQ, the price they are willing to pay, and developers’ expected profits.
Therefore, the purpose of the present study was to develop a systematic housing cost–quality trade-off model. First, HQ items were established based on the DQI. Then, a specific housing project was used as an example. A developer–homebuyer willingness survey concerning quality improvement and willingness to pay was conducted. Finally, a GA was used to perform a trade-off analysis on cost–quality differentiation strategies. The findings of the present study indicated that (1) the presale housing systems can more effectively and promptly provide customization to improve HQ than the non-presale housing system. (2) The questionnaire survey results indicated that the homebuyers’ average willingness to increase their budget by 8.33% is an ineffective investment. Statistics show that an increase of 6% in the budget can achieve the ideal quality improvement effect. (3) Developers can increase their profits by improving HQ through the implementation of quality differentiation strategies, where an 8% or more increase in construction cost can effectively generate premiums.
The cost–quality trade-off model established in the present study can be used as a general decision-making model for improving HQ. The proposed model not only considers the willingness and budgets of developers and homebuyers concurrently, it also automatically selects suitable quality improvement items. In addition, the model can also highlight the optimal cost and profit points in accordance with the characteristics of individual construction projects in order to ensure homebuyers’ HQ satisfaction and developers’ profits. A number of limitations were observed in the practical application of the proposed model. First, profit estimations in the model neglected sales performance and sales risks. Including sales time and risk factors in the model could enhance the accuracy of cost–quality trade-off estimations. Second, only a collective housing project was selected for the case study. However, the model can be used to develop different cost–quality trade-off mechanisms for various building types (e.g., commercial buildings or office buildings), which may affect profit estimations for developers. The model can be gradually expanded, or the DQI framework and quality improvement items can be revised, in order to apply to a wider variety of building types, thereby enhancing the system applicability.

Acknowledgments

The authors are appreciative of the valuable comments from editors and anonymous reviewers. Their detailed comments helped to improve the clarity and focus of this paper. This study was funded by the Ministry of Science and Technology of Taiwan (R.O.C.) as Project No. 106-2211-E-011-052.

Author Contributions

Both authors contributed equally to this work. In particular, Y.-K.J. lead the research activities, developed the research framework and decision model. I.-C.L. conducted the survey and case study, collected the data and performed the analysis.

Conflicts of Interest

The authors declare no conflict of interest.

Appendix A

Table A1. The items that improve housing quality according to the DQI framework.
The Framework of DQI Improving the Quality by Presale HouseItem Cost (%) *
IndicatorCategoryItems
Functionality
AccessA11.2 parking spaces per household3.10%
A2Accessible wisdom visitor guidance system0.04%
A3Electronic bulletin board0.03%
A4Bicycle parking area0.08%
A5Electronic door locks0.16%
A6Keyless access control system0.05%
A7Biometric access control systems0.06%
SpaceS1Waste storage and delivery system0.10%
S2Household exclusive storage room0.30%
S3Public rental storage0.03%
S4Interior minimum height of 2.8 m above floor0.48%
UseU1Flexible compartment0.15%
U2Open water and electricity pipeline0.13%
U3Light-emitting diode (LED)0.01%
U4Multi-gym equipment0.31%
Build Quality
PerformanceP1Earthquake-proof system1.19%
P2Floodgate0.07%
P3Saving rainwater filtration system0.08%
P4Indoor noise reduction material0.11%
P5A separate pipeline of bathroom exhaust fans0.12%
P6Multifunction bathroom exhaust fans0.19%
P7Airtight windows0.32%
P8Nanometer paint facades1.58%
P9Marble facades8.50%
Engineering SystemsES1High-performance air conditioning system6.11%
ES2Indoor air quality control systems6.11%
ES3Solar panels for public electricity0.50%
ES4Physical water purification system0.07%
ConstructionC1Low-E glass0.37%
C2Electronically tintable glass0.75%
C3Automatic shutters0.12%
C4Steel structure19.03%
C5Purification of reinforced concrete0.38%
C6Combined with ventilation tower and stairwell0.09%
C7External wall insulation materials0.42%
C8Formaldehyde-free green building materials0.25%
Impact
Urban and Social IntegrationUSI1Rain storage tank at raft foundation0.11%
USI2Facades and architectural lighting design0.28%
Internal EnvironmentIE1Large balcony and terrace0.33%
IE2Panorama glass living room0.51%
IE3Wireless security system0.18%
Form and MaterialsFM1Reinforced concrete protective0.21%
FM2Fireproofing systems0.40%
FM3Electronic toilet seat (Washlet)0.37%
FM4Water hammer arresters0.02%
FM5Floor insulation0.44%
Character and InnovationCI1Building information modeling (BMI)0.88%
CI2Intelligent evacuation system0.19%
CI3Automatic number plate recognition system0.07%
CI4Electronic toll collection access control0.04%
* Item cost (%) = Item cost/total construction cost.
Table A2. Improve quality indicators (IQI) of presale housing
Assumption of increased purchased costs1%2%3%4%5%6%7%8%9%10%Amount
Sum of preferences score86.85120.91148.70169.00192.25212.62225.94226.96233.13240.74339
%25.63%35.68%43.89%49.88%56.74%62.75%66.68%66.98%68.80%71.05%100%
Number of selection items1318222528313333343550
%26.02%36.04%44.06%50.08%56.10%62.12%66.14%66.16%68.18%70.20%100%
Improve quality indicators (IQI)6.67%12.86%19.34%24.98%31.83%38.98%44.10%44.32%46.91%49.88%100%
Selection items
A21111111111
A30001111111
A41111111111
A61111111111
S11111111111
S40001111111
U10111111111
U20111111111
U31111111111
U40001111111
P10000000101
P21111111111
P31111111111
P41111111111
P50011111111
P60111111111
P70000111111
P80000000011
ES30000001111
ES41111111111
C10001111111
C50111111111
C61111111111
C70000011111
C80000111111
USI20011111111
IE20000001001
IE30111111111
FM11111111111
FM20011111111
FM30000011111
FM41111111111
FM50000111111
CI10000000010
CI20010011111
CI41111111111
Table A3. Improve quality indicators of non-presale housing.
Assumption of increased purchased costs1%2%3%4%5%6%7%8%9%10%Amount
Sum of preferences score67.5381.30109.09122.42145.66166.04179.36172.79180.00186.57339
%19.93%23.99%32.20%36.13%42.99%49.00%52.93%51.00%53.12%55.06%100%
Number of selection items1012161821242625272750
%20.02%24.04%32.06%36.08%42.10%48.12%52.14%50.16%54.18%54.20%100%
Improve quality indicators (IQI)3.99%5.77%10.32%13.04%18.10%23.58%27.60%25.58%28.78%29.84%100%
Selection items
A21111111111
A30001111111
A61111111111
U31111111111
U40001111111
P21111111111
P31111111111
P41111111111
P50011111111
P60111111111
P70000111111
P80000000011
ES30000001111
ES41111111111
C10001111111
C70000011111
C80000111111
USI20011111111
IE20000001001
IE30111111111
FM11111111111
FM20011111111
FM30000011111
FM41111111111
FM50000111111
CI10000000010
CI20010011111
CI41111111111
Table A4. Profit Performance of Quality Differentiation Strategy for Developers.
Assumption of Increased Construction CostsActual Increased CostsIncrease ProfitIQI
1.00%0.96%2.53%6.67%
2.00%1.99%5.03%12.86%
3.00%2.98%7.55%19.34%
4.00%3.98%10.06%24.98%
5.00%5.00%12.57%31.83%
6.00%5.98%15.09%38.98%
7.00%6.99%17.60%44.10%
8.00%7.67%20.28%44.32%
9.00%8.94%22.65%46.91%
10.00%9.75%25.26%49.88%

References

  1. He, J.; Wu, J. Doing well by doing good? The case of housing construction quality in China. Reg. Sci. Urban Econ. 2016, 57, 46–53. [Google Scholar] [CrossRef]
  2. Mohit, M.A.; Ibrahim, M.; Rashid, Y.R. Assessment of residential satisfaction in newly designed public low-cost housing in Kuala Lumpur Malaysia. Habitat Int. 2010, 34, 18–27. [Google Scholar] [CrossRef]
  3. Tan, T.H. Housing satisfaction in medium-and high-cost housing: The case of Greater Kuala Lumpur Malaysia. Habitat Int. 2012, 36, 108–116. [Google Scholar]
  4. Liu, X.; Xue, C.Q.L. Exploring the challenges to housing design quality in China: An empirical study. Habitat Int. 2016, 57, 242–249. [Google Scholar] [CrossRef]
  5. Juan, Y.K.; Shin, S.G.; Perng, Y.H. Decision support for housing customization-A hybrid approach using case-based reasoning and genetic algorithm. Expert Syst. Appl. 2006, 31, 83–93. [Google Scholar] [CrossRef]
  6. Juan, Y.K.; Chien, S.F.; Li, Y.J. Customer-focused system for pre-sale housing customization using case-based reasoning and Feng-Shui theory. Indoor Built Environ. 2010, 19, 453–464. [Google Scholar] [CrossRef]
  7. Rosen, M.A.; Kishawy, H.A. Sustainable Manufacturing and Design: Concepts, Practices and Needs. Sustainability 2012, 4, 154–174. [Google Scholar] [CrossRef]
  8. Zainul Abidin, N.; Yusof, N.A.; Othman, A.A.E. Enablers and challenges of a sustainable housing industry in Malaysia. Constr. Innov. 2017, 13, 10–25. [Google Scholar] [CrossRef]
  9. Hui, E.C.M. Willingness to pay for better housing in Hong Kong: Theory and evidence (of dwelling space). Urban Stud. 1999, 36, 289–304. [Google Scholar] [CrossRef]
  10. Laszek, J.; Olszewski, K. The Behaviour of Housing Developers and Aggregate Housing Supply; NBP Working Paper; Narodowy Bank Polski: Warschau, Poland, 2015. [Google Scholar]
  11. Dikmen, I.; Birgonul, M.T.; Kiziltas, S. Strategic use of quality function deployment (QFD) in the construction industry. Build. Environ. 2005, 40, 245–255. [Google Scholar] [CrossRef]
  12. Pheng, L.S.; Yeap, L. Quality function deployment in design/build projects. J. Archit. Eng. 2001, 7, 30–39. [Google Scholar] [CrossRef]
  13. Yoshida, J.; Sugiura, A. The effects of multiple green factors on condominium prices. J. Real Estate Financ. Econ. 2015, 50, 412–437. [Google Scholar] [CrossRef]
  14. Tao, R.; Tam, C.M. System reliability theory based multiple-objective optimization model for construction projects. Autom. Constr. 2013, 31, 54–64. [Google Scholar] [CrossRef]
  15. Babu, A.J.G.; Suresh, N. Project management with time, cost, and quality considerations. Eur. J. Oper. Res. 1996, 88, 320–327. [Google Scholar] [CrossRef]
  16. Zhang, H.; Xing, F. Fuzzy-multi-objective particle swarm optimization for time–cost–quality tradeoff in construction. Autom. Constr. 2010, 19, 1067–1075. [Google Scholar] [CrossRef]
  17. Chang, C.O.; Ward, C.W.R. Forward pricing and the housing market: The pre-sales housing system in Taiwan. J. Prop. Res. 1993, 10, 217–227. [Google Scholar] [CrossRef]
  18. Munneke, H.J.; Ooi, J.T.L.; Sirmans, C.F.; Turnbull, G.K. Sequential sales of similar assets: The law of one price and real estate. J. Reg. Sci. 2011, 51, 355–370. [Google Scholar] [CrossRef]
  19. Chau, K.W.; Wong, S.K.; Yiu, C.Y. Housing quality in the forward contracts market. J. Real Estate Financ. Econ. 2007, 34, 313–325. [Google Scholar] [CrossRef]
  20. Mak, S.W.K.; Choy, L.H.T.; Ho, W.K.O. Privatization, housing conditions and affordability in the People’s Republic of China. Habitat Int. 2007, 31, 177–192. [Google Scholar] [CrossRef]
  21. Ooi, J.T.L.; Le, T.T.T.; Lee, N.J. The impact of construction quality on house prices. J. Hous. Econ. 2014, 26, 126–138. [Google Scholar] [CrossRef]
  22. Edelstein, R.; Liu, P.; Wu, F. The Market for Real Estate Presales: A Theoretical Approach. J. Real Estate Financ. Econ. 2012, 45, 30–48. [Google Scholar] [CrossRef]
  23. Raslanas, S.; Alchimovienė, J.; Banaitienė, N. Residential Areas with Apartment Houses: Analysis of the Condition of Buildings, Planning Issues, Retrofit Strategies and Scenarios. Int. J. Strateg. Prop. Manag. 2011, 15, 152–172. [Google Scholar] [CrossRef]
  24. Gann, D.; Salter, A.; Whyte, J. Design Quality Indicator as a tool for thinking. Build. Res. Inf. 2003, 31, 318–333. [Google Scholar] [CrossRef]
  25. Prasad, S. Clarifying intentions: The design quality indicator. Build. Res. Inf. 2004, 32, 548–551. [Google Scholar] [CrossRef]
  26. Markus, T.A. Lessons from the Design Quality Indicator. Build. Res. Inf. 2003, 31, 399–405. [Google Scholar] [CrossRef]
  27. Porter, M.E. Competitive Strategy; Free Press: New York, NY, USA, 1980. [Google Scholar]
  28. Porter, M.E. Competitive Advantage; Free Press: New York, NY, USA, 1985. [Google Scholar]
  29. Porter, M.E. What Is Strategy? Harvard Business College Press: Boston, MA, USA, 1996. [Google Scholar]
  30. Wieand, K.F. The performance of annual housing survey quality measures in explaining dwelling rentals in 20 metropolitan areas. Real Estate Econ. 1983, 11, 45–68. [Google Scholar] [CrossRef]
  31. Ong, S.E. Building defects, warranties and project financing from pre-completion marketing. J. Prop. Financ. 1997, 8, 35–51. [Google Scholar] [CrossRef]
  32. Leu, S.S.; Yang, C.H. GA-based multicriteria optimal model for construction scheduling. J. Constr. Eng. Manag. 1999, 125, 420–427. [Google Scholar] [CrossRef]
  33. Lee, C.K.; Kim, S.K. GA-based algorithm for selecting optimal repair and rehabilitation methods for reinforced concrete (RC) bridge decks. Autom. Constr. 2007, 17, 153–164. [Google Scholar] [CrossRef]
  34. Li, H.; Love, P.E.D.; Ogunlana, S. Genetic algorithm compared to nonlinear optimization for labour and equipment assignment. Build. Res. Inf. 1998, 26, 322–329. [Google Scholar] [CrossRef]
  35. Feng, C.W.; Liu, L.; Burns, S.A. Using genetic algorithms to solve construction timecost trade-off problems. J. Comput. Civ. Eng. 1997, 11, 184–189. [Google Scholar] [CrossRef]
Figure 1. Currently housing quality producing and control charts.
Sustainability 10 00680 g001
Figure 2. Concept of differentiation strategies.
Sustainability 10 00680 g002
Figure 3. The concept of housing quality change strategy.
Sustainability 10 00680 g003
Figure 4. Chromosome structure. DQI: Design Quality Indicator.
Sustainability 10 00680 g004
Figure 5. Relationship between homebuyers’ willingness to increase budget and the improve quality indicator (IQI).
Sustainability 10 00680 g005
Figure 6. Relationship between housing developers’ construction costs, profit increase, and IQI.
Sustainability 10 00680 g006
Table 1. The nine-point scale questionnaire definitions of homebuyers and developers.
ScoreHomebuyersDevelopers
DefinitionDefinition
1Certainly unnecessaryCertainly unnecessary to provide
2Very unnecessaryVery unnecessary to provide
3Moderately unnecessaryModerately unnecessary to provide
4Slightly unnecessarySlightly unnecessary to provide
5No commentsNo comments
6Slightly needSlightly need to provide
7Moderately needModerately need to provide
8Highly needVery necessary to provide
9Necessarily needCertainly need to provide
Table 2. The result of the housing cost–quality tread-off model. DQI: Design Quality Indicator.
HomebuyersDevelopers
Expected ready cost increase8.33%5.95%
Actual cost selected by system8.02%5.95%
Preference score16.5415.17
Selection items3431
The framework of DQISystem selected itemsSystem selected items
IndicatorCategory
FunctionalityAccessA2 A3 A4 A6A2 A3 A4 A6
SpaceS1 S4S1 S4
UseU1 U2 U3 U4U1 U2 U3 U4
Build QualityPerformanceP1 P2 P3 P4 P5 P6 P7P2 P3 P4 P5 P6 P7
Engineering SystemsES3 ES4ES3 ES4
ConstructionC1 C5 C6 C7 C8C1 C5 C6 C8
ImpactUrban and Social IntegrationUSI2USI2
Internal EnvironmentIE2 IE3IE3
Form and MaterialsFM1 FM2 FM3 FM4 FM5FM1 FM2 FM3 FM4 FM5
Character and InnovationCI2 CI4CI2 CI4
Note: The differences between homebuyers and developers include P1, C7, and IE2 of the cost–quality trade-off model.

