Article

Understanding the Emergence and Social Acceptance of Electric Vehicles as Next-Generation Models for the Automobile Industry

College of Computing, Hanyang University, 55 Hanyangdeahak-ro, Sangnok-gu, Ansan 15588, Gyeonggi-do, Korea
*
Author to whom correspondence should be addressed.
Sustainability 2018, 10(3), 662; https://doi.org/10.3390/su10030662
Submission received: 3 January 2018 / Revised: 26 February 2018 / Accepted: 27 February 2018 / Published: 1 March 2018

Abstract

:
This study explores potential factors of drivers’ intentions to use electric vehicles and proposes an integrated adoption model. Results of a structural equation modeling analysis with 988 samples indicate that drivers’ intentions are predicted by one negative factor (cost) and three positive ones (satisfaction, usefulness, and attitude). In addition, the total standardized effects of potential factors on the intention are computed. The current study also validates the original technology acceptance model. Based on the results of the current study, practical and academic implications with potential limitations are examined and presented.

1. Introduction

With increased social interest in the environment, more attention is being paid to the transportation sector, which is considered a key contributor to greenhouse gas (GHG) emissions. The International Energy Agency (2017) indicated that about 14% of GHGs were generated globally by the transportation sector [1], and this rate is estimated to increase to half of all GHG emissions by 2030. Therefore, several nations are attempting to reduce GHG emissions and environmental pollution by the transportation sector by decreasing the use of fossil fuels. Among several alternatives, electric vehicles (EVs) are regarded as one of the most promising approaches in the transportation sector [2]. The U.S. National Resources Defense Council (2007) found that EVs can contribute toward handling several environmental problems [3]. With this positive effect in mind, the majority of vehicle manufacturing companies are developing, introducing, and selling EVs [4].
The energy demand of the world continues to grow [1], and currently, more than 25 billion tons of CO2 arising from human activities are annually released worldwide into the atmosphere. Now, it is a world problem to reduce the emissions of greenhouse gases and air pollutants such as CO, HC, and NOx by road transportations for city governance, as highlighted by previous studies (e.g., [5,6,7]). In the meantime, South Korea, which has ranked 11th worldwide in terms of gross domestic product (GDP) in 2017 and is the world’s third fastest growing country in CO2 emissions, has signed the Paris Agreement on 2016, and its Intended Nationally Determined Contribution (INDC) proposes an economy-wide target to reduce GHG emissions by 37% by 2030 relative to the business-as-usual level [8]. According to several prior studies [9], the level of GHG emissions in South Korea has been 0.69 billion tons of CO2 in 2015, while a total of 49 billion tons of CO2 has been emitted globally in 2015. Moreover, South Korea has established a GHG reduction target of 34.3% to transportation as energy consumption by nonindustrial sectors such as transportation is expected to continuously increase [10], and the South Korean Government is pushing the uptake of EVs with a goal of having 250,000 EVs on the road by 2020 [11].
Nations worldwide are vigorously developing and discovering alternative fuel sources and new technology to lessen the dependency on fossil fuels because of the increasing energy demand, the uncertainty of fuel prices, and severe air pollution restrictions in the road transport sector. Furthermore, attention has been recently drawn to developing cleaner alternative fuels from renewable sources and to improving hybrid vehicles so that the harmful emissions to air in city centers and the need for fossil fuels can be reduced [5,12].
In spite of this trend and its advantages, prior studies have identified notable barriers to the wide diffusion of EVs [2]. For instance, Axsen, Kurani, and Burke [13] found that the cost of a vehicle battery is a significant barrier to EV acceptance. Limitations in battery capacity and vehicle weight are further obstacles to commercializing EVs [14]. This context has directed the focus of engineers and researchers in the field to technical issues, which has yielded improvements in terms of the engineering-related agenda based on what prior studies highlighted as the major restrictions on the spread of EVs [15].
These improvements to the engineering and technical aspects of EVs have increased the importance of focusing on the users’ perspectives on these vehicles [16]. EVs have been rapidly diffused in several developed countries, including Japan [17,18], the Netherlands, and the US, whereas in some nations, such as South Korea and China, they have propagated slowly [19,20].
Thus, the current study aims to explore drivers’ perceptions of EVs by examining the vehicles’ characteristics based on a model represented in user-oriented studies: the technology acceptance model (TAM) [21]. This study proposes a new adoption model that can be applied to renewable energy technologies and vehicle systems to elucidate drivers’ acceptance of EVs in South Korea [19,22]. This study addresses two research questions: (A) what driver-oriented variables motivate intentions to use EVs? And (B) can the original TAM validly be applied to EVs?
The remainder of this paper is structured as follows. First, a literature review is presented. Second, the hypotheses and research model are introduced. Third, the study methods are elucidated, and the results are presented. Finally, a discussion, conclusions, and the limitations of the study are provided.

Electric Vehicles

Although automobiles based on the internal combustion engine are popular in our society, EVs has also been invented in the early stage of automobile history. However, vehicles installed with internal combustion engines have dominated the market, primarily against a background of widely available oil at low prices. Since the 1990s, with the increased interest in environmental issues, including GHG emissions, a number of nations and manufacturers have started paying more attention to EVs and hybrid EVs [23,24]. A hybrid EV has both an internal combustion engine powered by fossil fuels and an electric motor powered by a battery [25]. The battery is charged by the internal combustion engine when the vehicle is braked. Because the original energy of hybrids is supplied by fossil fuels, they are more economical and efficient than traditional vehicles [26].
Generally, EVs are referred to as battery-electric vehicles. Battery-electric vehicles are powered by large battery packs that are recharged via the electricity supply [27]. Although the widespread distribution of battery-electric vehicles may be the most promising solution for future transportation systems, the mass distribution of battery-electric vehicles is more difficult than that of other vehicles, including traditional ones, because of several limitations and technological differences [28].
Public attitudes toward EVs and public willingness to use them should be considered in promoting the use of these vehicles in the transportation sector. Not only should the technical limitations of EVs, including battery capacity and weight, be improved, but also drivers’ individual and social issues should be investigated to enhance commercially successful distributions. Prior studies have reported that users’ adoption and preferences are important factors for successful maintenance in the transportation sector [29]. Thus, this study investigates users’ perceptions of EVs through the introduction of a new integrated model of EVs adoption.

2. Literature Review and Hypotheses

2.1. Modeling Social Acceptance of Electric Vehicles

Estimating users’ responses to specific technologies and products has become a hot research area. Among the various academic studies that have attempted to develop theories for predicting user acceptance of specific technologies and products, the theory of planned behavior (TPB) proposed by Ajzen [30] and the TAM introduced by Davis [21] are well-regarded approaches for revealing how users shape their perceptions and opinions and adopt specific technologies and products. Related to the TPB, several studies have applied it to users’ behavior in using environmentally friendly technologies and products. Chen (2016) note that the TPB can be a significant basic model for predicting users’ intentions to employ environmentally friendly behavior [31]. Dezdar (2017) also employed the TPB in explaining users’ intention to use green information technologies, and found that two constructs in the TPB, perceived behavioral control and subjective norms, were positively related to users’ attitudes toward the technologies [32].
By applying these theoretical approaches to energy or vehicle technologies, prior studies have investigated users’ perspectives toward the technologies. For instance, Kim and colleagues use the TPB to investigate users’ adoption of solar energy, a well-known renewable energy technology [33]. Similarly, Huijts, Molin, and Steg (2012) found the TPB to be valid for explaining sustainable energy technology acceptance. In the field of vehicle-related systems [34], Park and Kim (2014) found the technology acceptance concept to be valid for investigating driver acceptance of automobile-related systems [35].
The original TAM is organized around four variables. Davis (1989) state that two cognitive beliefs, perceived ease of use and usefulness, are determinants of users’ attitudes, and that attitude and usefulness are significantly related to users’ intentions to use particular systems and products [21]. Moreover, the two cognitive beliefs act as mediators between specific characteristics of particular systems and products and two other variables: attitudes and intention. Several prior studies have found positive associations between ease of use and usefulness, ease of use and attitude, usefulness and attitude, usefulness and intention to use, and attitude and intention to use [21,36]. Related to the domain of transportation and innovative products, several prior studies have been conducted on the validity and significance of the TPB and TAM [37,38,39]. Moreover, although users can have positive attitudes toward EVs, there can be hindrances and real-world constraints in purchasing and using them. Because of this, this study separately formulates public attitude and intention to use, respectively. Therefore, based on the findings of previous technology acceptance studies, this study hypothesizes the following connections:
Hypothesis (H1):
Public attitudes toward using EVs are positively related to intention to use EVs.
Hypothesis (H2):
The perceived usefulness of EVs is positively related to intention to use EVs.
Hypothesis (H3):
The perceived usefulness of EVs is positively related to public attitudes toward using EVs.
Hypothesis (H4):
The perceived ease of use of EVs is positively related to the perceived usefulness of EVs.
Hypothesis (H5):
The perceived ease of use of EVs is positively related to public attitudes toward using EVs.

2.2. Satisfaction

Prior studies in the field of information science and communications have reported that the user’s degree of satisfaction in interacting with particular systems and services is a key factor in the user’s perception of the usability of the systems or services [40]. In addition, the user’s satisfaction plays a notable role in elucidating the user’s intention to employ renewable energy technologies or car-related systems [41]. For instance, Kim and colleagues found that users’ satisfaction in economic and social aspects is a significant predictor of their acceptance of solar energy technologies [33]. Therefore, this study hypothesizes the following connections based on the results of prior studies:
Hypothesis (H6):
Satisfaction with using EVs is positively related to intention to use EVs.
Hypothesis (H7):
Satisfaction with using EVs is positively related to public attitudes toward EVs.

2.3. Perceived Enjoyment

Prior studies on user experience have shown that hedonic factors, including perceived enjoyment, are core determinants of users’ perceptions [41]. Van der Heijden defined perceived enjoyment as “the level to which the activity of using a particular system or service is perceived as being nice and enjoyable” [42], and indicate that perceived enjoyment is a key determinant of users’ attitudes and experiences in using a hedonic information service or system. In EVs, drivers’ distinctive experiences from traditional vehicles can also be a source of driving enjoyment [43]. The relationships among users’ satisfaction, enjoyment, and attitudes toward a particular product or service have generally been supported in the field of information science and communications [40]. Therefore, this study hypothesizes the following relationships:
Hypothesis (H8):
The perceived enjoyment of EVs is positively related to satisfaction with EVs.
Hypothesis (H9):
The perceived enjoyment of EVs is positively related to public attitudes toward EVs.

2.4. Perceived Cost

When users encounter newly introduced technologies and systems, the cost concept is a notable factor in determining their use of those technologies and systems [44]. In this process, users may consider the cost of the technology and its potential benefits at the same time. As presented in the findings and validations of prior studies on renewable energy technologies and facilities, the economic hindrance and subsidy which are provided by the central and local governments can be one of the most significant hindrances for the diffusion of the technologies and facilities [45]. The cost concept is a complex notion that encompasses the cost of maintenance, the purchase, and related processes [44]. In the case of EVs, although low running cost is one of the main benefits, the purchasing and infrastructure costs are greater than those of traditional vehicles.
In addition, several studies conducted in the field of transportation and automobiles have confirmed the cost concept as an important factor in the success of products and systems. For example, Jones (2002) found that the cost concept, including pricing strategy, could determine the success or failure of products and systems [46]. Therefore, this study hypothesizes the following connection based on the findings of the previous research:
Hypothesis (H10):
The perceived cost of EVs is negatively related to intention to use EVs.

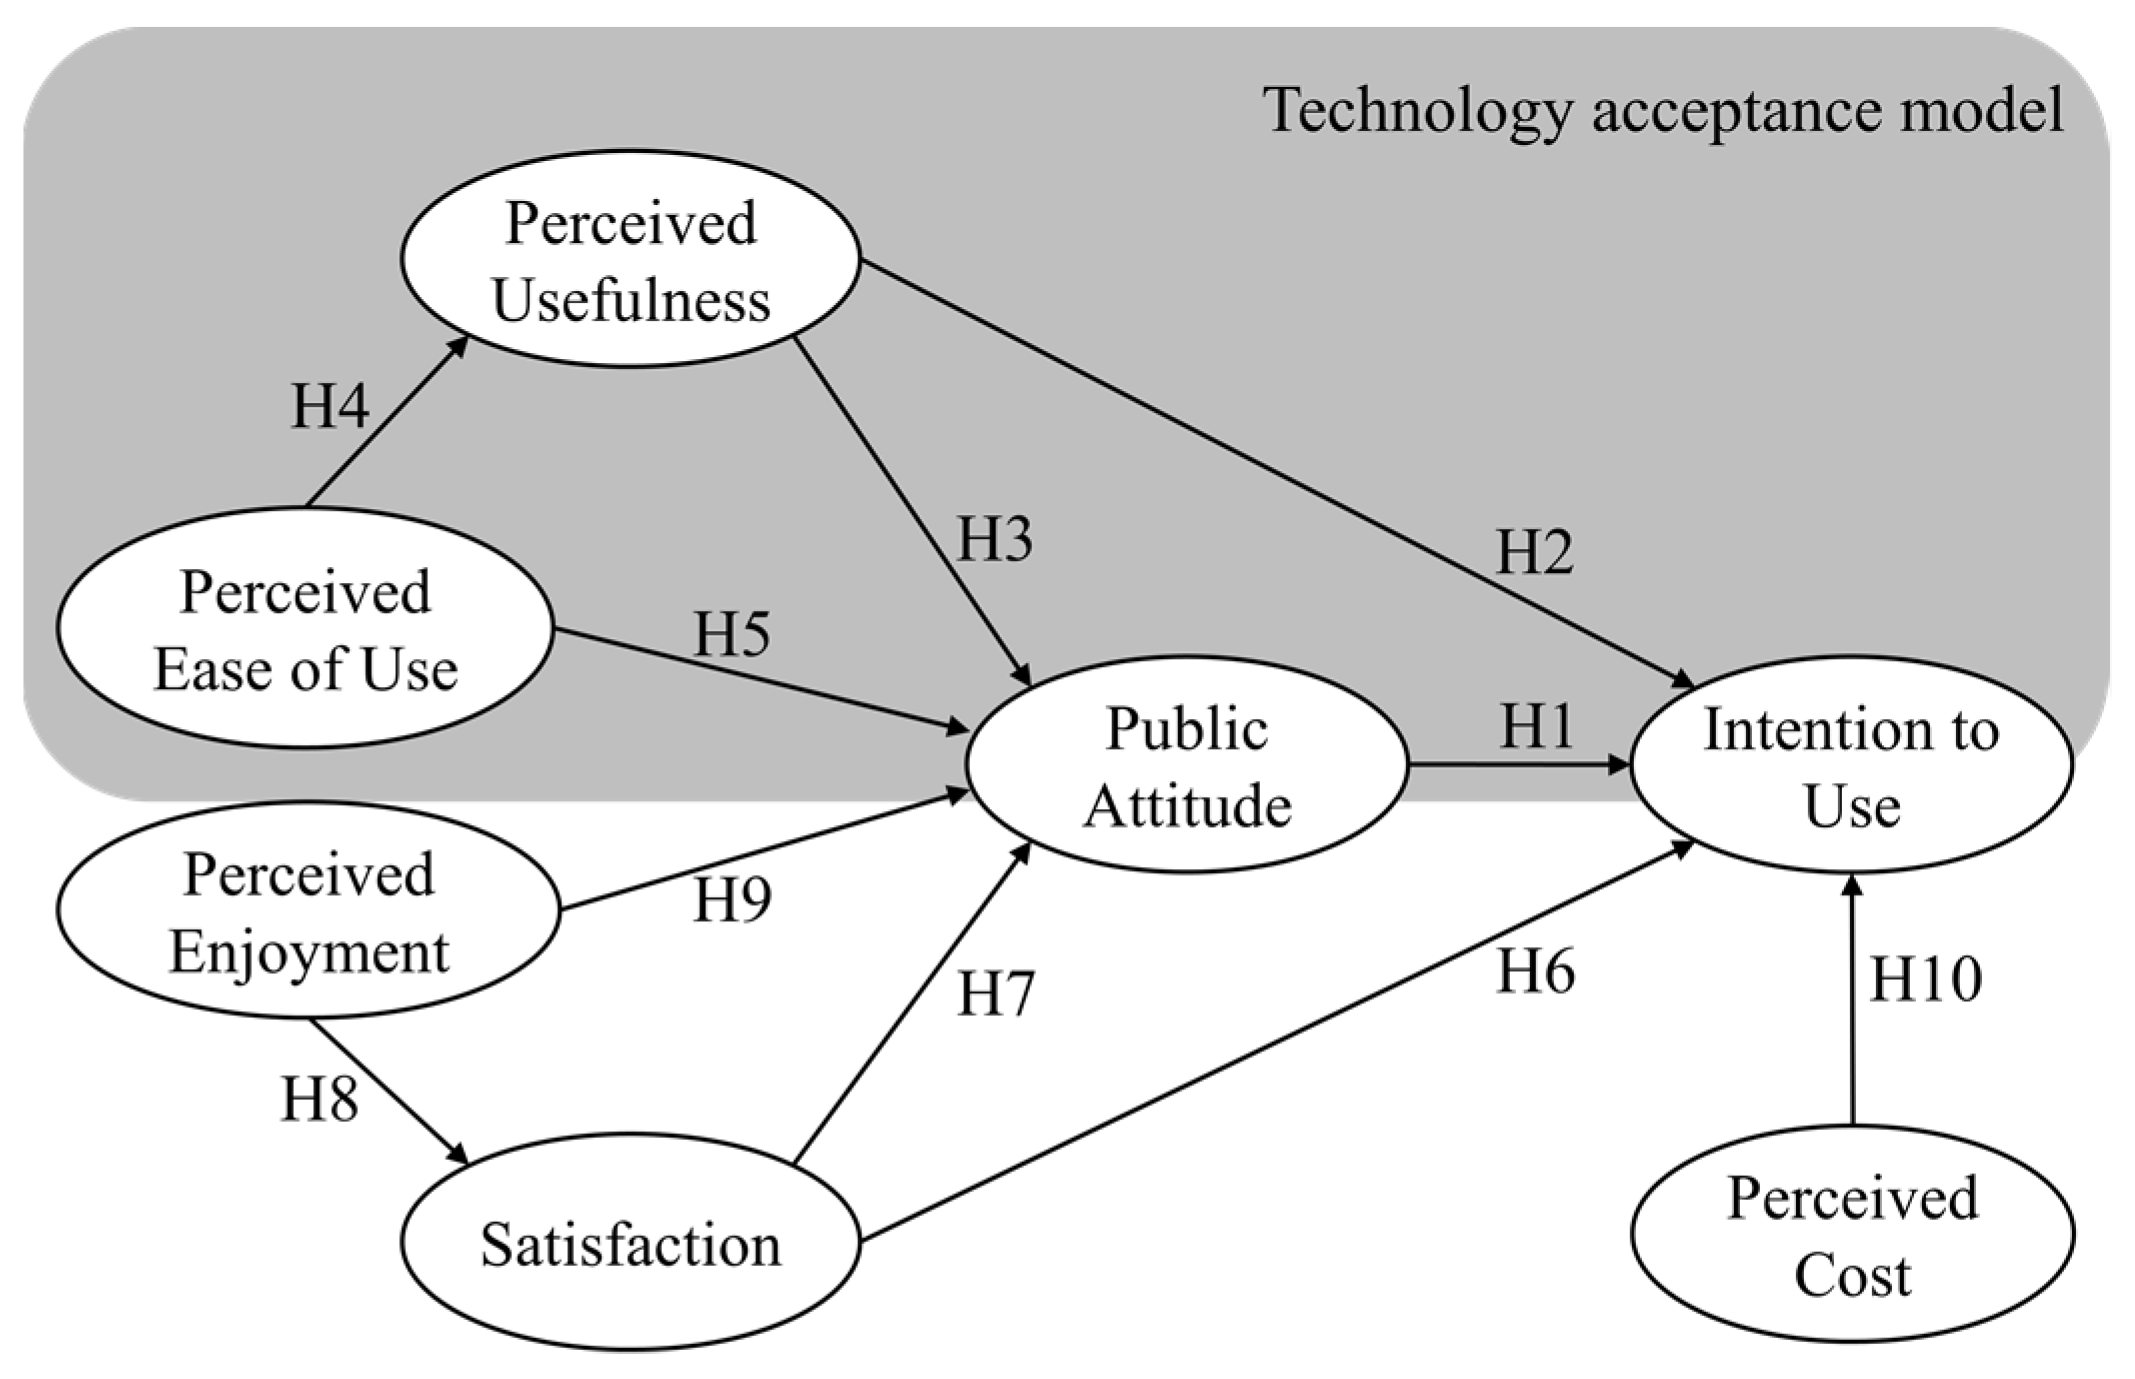
2.5. The Research Model

Based on the proposed hypotheses, the integrated research model is presented in Figure 1.

3. Method

3.1. Questionnaire Design

To administer the survey and obtain data, we followed the following five stages proposed by Shin and Shin [47]: (A) finding potential possible factors; (B) administering the factors; (C) exploring the reliability of the administered factors; (D) conducting a series of pilot surveys and review sessions; and (E) conducting the main survey. To find potential factors, ten-minute in-depth interview sessions were conducted with 15 car drivers with over five years of driving experience and who had driven EVs at least four times.
After the interviews, query analyses were conducted to obtain potential variables (Table 1). We selected five factors and conducted a pre-survey to test the reliability of the questionnaire items for the selected factors. First, we found 29 items that were validated by prior studies. Then, the items were revised by an expert group of three researchers and two professionals in the fields of communications, energy technology, and transportation. Next, three pilot surveys were conducted with 20 drivers who had more than ten years’ driving experience. Respondents were asked to inform the experimenters if they had any problems understanding the questionnaire items. Cronbach’s alpha was computed to test the validity of the responses. Consequently, 21 questionnaire items were selected, and eight items from the original questionnaire set were excluded from the final survey (Table 2).
A professional survey company was hired to conduct a pen-paper survey to test the proposed research model. The survey was conducted from July to August 2014 in Seoul, Republic of Korea. It was conducted using a convenience sampling method after a filtering process that investigated whether each participant had enough experience in using EVs. After this process, each participant was interviewed by the survey researcher face-to-face. All participants in the main survey were asked to respond to all items on a seven-point Likert scale (from 1 = absolutely disagree to 7 = absolutely agree). After the survey, all participants received 5000 KRW (about US $5). The company initially collected 1333 samples. After data filtering, 988 valid responses remained and were used as the dataset. The demographic data are presented in Table 3.

3.2. Results

SPSS 18.0, a professional statistical software package, was used to compute the descriptive statistics of the selected constructs of the main survey. The descriptive statistics indicated that the respondents in the main survey had positive perceptions of EVs (Table 4).

3.2.1. Analysis Methods

To test the proposed connections in the model, a structural equation modeling (SEM) method and confirmatory factor analysis were used. This study satisfied internal and convergent reliability tests according to the recommendations of prior studies that Cronbach’s alpha values should be over 0.7, the sample size should be at least 200, factor loadings should be higher than 0.7, composite reliability values should be greater than 0.7, and average variance extracted (AVE) values should be over 0.5 (Table 5) [50,51]. Additionally, for a test of discriminant reliability, the correlation between two particular constructs should be less than the square root of AVE (Table 6). This study met all of these guidelines.

3.2.2. The Measurement Model

The fit indices of the measurement model showed that the collected data were well-represented by the model (Table 7). The fit indices met the satisfactory criteria presented in the previous studies [50,51,52].

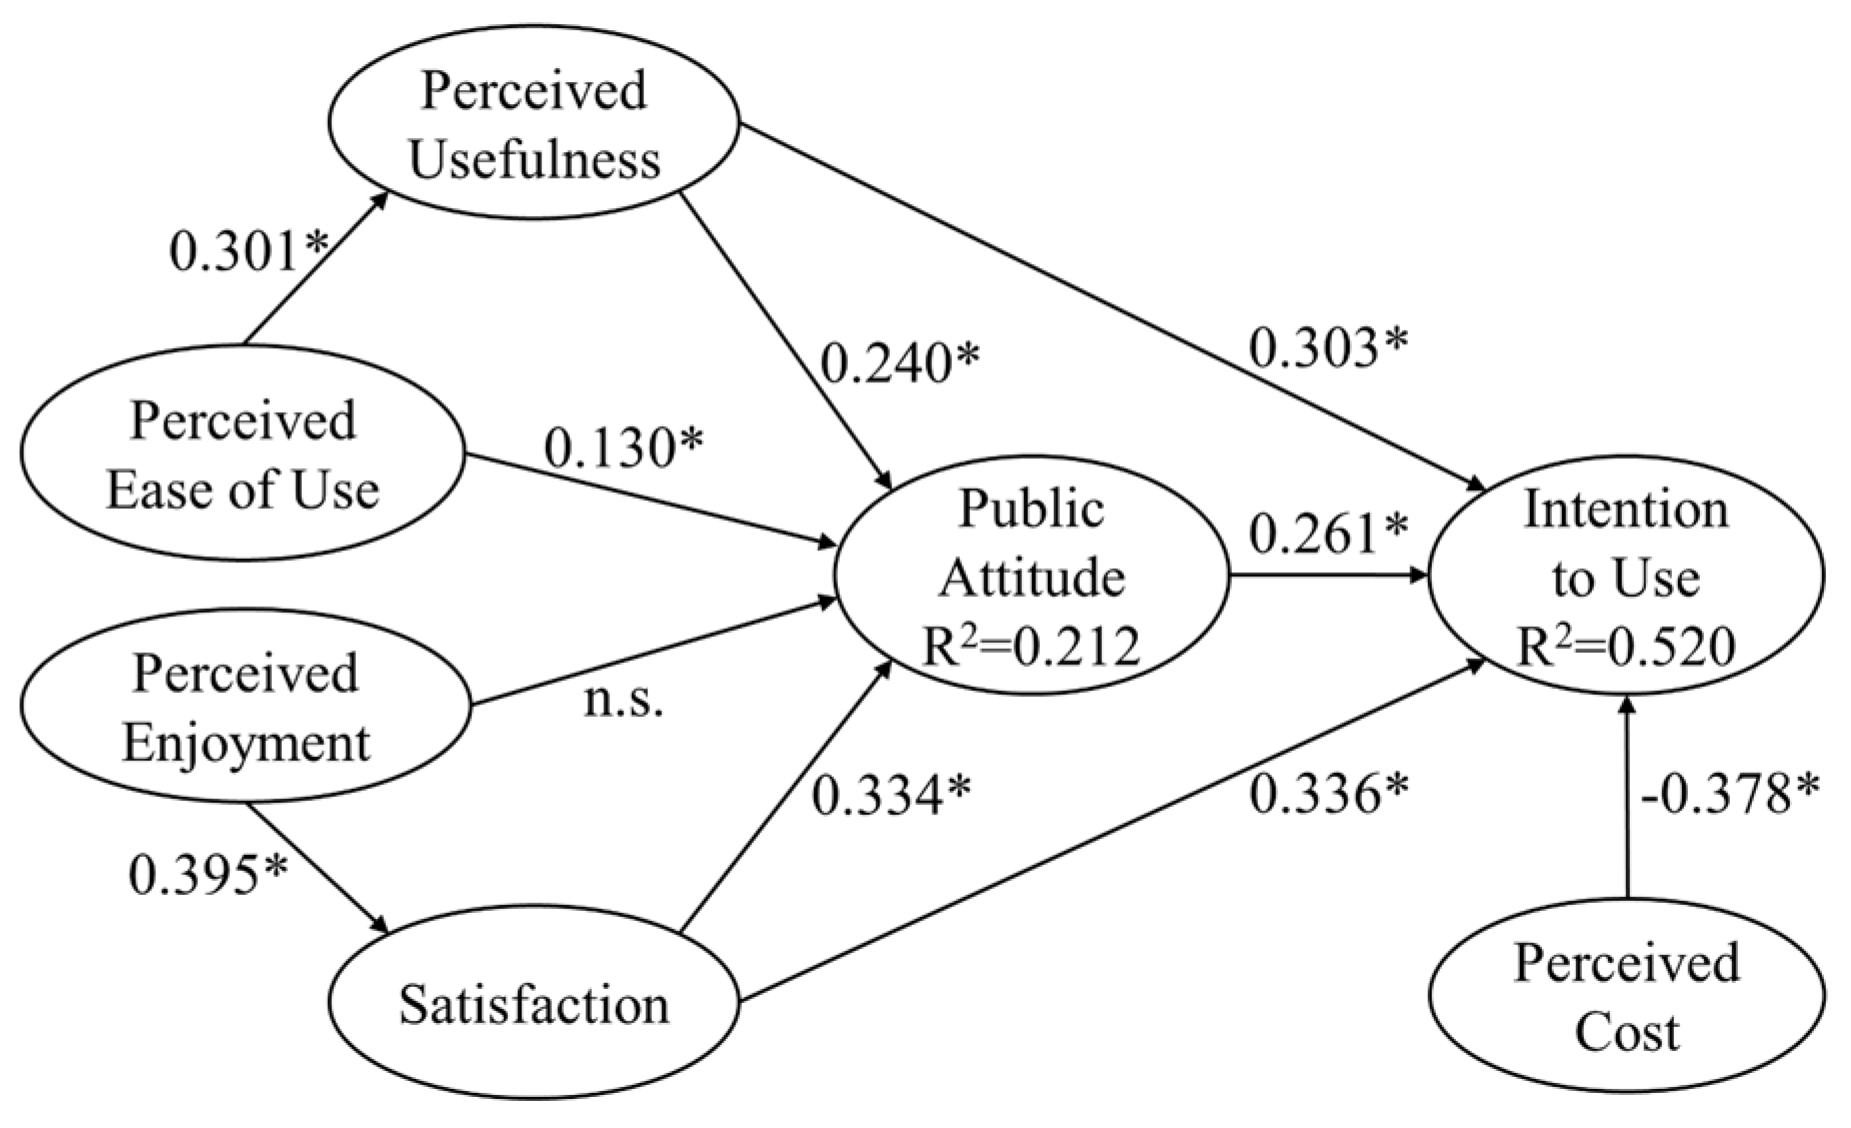
3.2.3. Hypothesis Testing

The proposed connections were explored to investigate the structural relations. The fit indices of the research model were satisfactory (Table 7). As shown in Figure 2 and Table 8, the nine hypothesized connections were supported, but the connection between perceived enjoyment and public attitude toward EVs (H9, p > 0.05) was not supported. Public attitude was mainly determined by three positive variables: usefulness (H3, beta = 0.240, CR = 8.106, p < 0.001), ease of use (H5, beta = 0.130, CR = 4.376, p < 0.001), and satisfaction (H7, beta = 0.334, CR = 10.869, p < 0.001). In addition, perceived ease of use showed notable effects on perceived usefulness (H4, beta = 0.301, CR = 9.934, p < 0.001).
Moreover, drivers’ intention to use EVs was determined by four variables (three positive and one negative). Three significant antecedents, satisfaction (H6, beta = 0.336, CR = 14.209, p < 0.001), usefulness (H2, beta = 0.303, CR = 13.117, p < 0.001), and public attitude (H1, beta = 0.261, CR = 10.600, p < 0.001), showed positive significant effects on intention, but perceived cost had the most significant effect on intention (H10, beta = −0.378, CR = −17.158, p < 0.001).
Of the variance in public attitude, 21.2% was explained by perceived usefulness, ease of use, and satisfaction, whereas 52.0% of the variance in intention to use was explained by perceived cost, public attitude, satisfaction, and usefulness.
To present the most notable effects of the employed constructs in the proposed research model on the intention to use, the standardized total effects of the constructs on the intention to use were computed. As presented in Table 9, users’ satisfaction had the most influence on intention (0.423).

4. Discussion & Conclusions

The purpose of this study was to explore drivers’ motivations for using EVs. We conducted a structural investigation by examining and exploring a driver acceptance model. Based on one of the most widely employed user-oriented models, the statistical results indicated that the original TAM is valid for elucidating driver acceptance of EVs, and a sequential structural relationship of perceived enjoyment—satisfaction—attitude—intention is supported for explaining acceptance.
Building on the findings of prior studies that utility- and price-related factors are the key motivations for using renewable energy technologies and products [53], this study showed that users’ satisfaction and enjoyment should also be considered in explaining their behavior and willingness to use such technologies and products.
This study introduced a new adoption framework for elucidating the user-decision process for EVs. Moreover, the integrated adoption framework was investigated by using SEM to explore the motivations for users’ intention to use EVs and the systematic decision process. The results supported the validity of the proposed model, which thus improves our understanding of users’ willingness to use and perceptions of EVs.
Similar to prior TAM studies, this study confirmed the validity of the model in explaining users’ perceptions of EVs. In addition, the integrated model and results mirrored the current status of EVs: (A) drivers consider their experiences with an overall feeling of enjoyment and satisfaction with the vehicles (0.173 and 0.423); (B) drivers’ expectations of cost, including the cost of maintenance and purchase, can disturb their intention to use the vehicles (−0.378); and (C) drivers’ perspectives toward the hedonic, utilitarian, and economic aspects of EVs should be considered in attempts to diffuse the vehicles. Thus, these factors should be considered when academic and industrial researchers and politicians want to promote EVs. The motivations of drivers, such as intention to use, perceived usefulness (0.366), and attitude (0.261) as positive determinants, and perceived cost (−0.378) as a negative one, were investigated as the key factors in encouraging drivers to purchase and use EVs and establishing support facilities.
The results of this study have several industrial and academic implications related to EVs for engineers, researchers, and government officers, including policymakers. From a practical perspective, practical engineers and researchers can apply our results to enhance EVs by improving their degree of utility and increasing users’ hedonic perceptions of the vehicles. Moreover, government officers, including policymakers, should design financial and supportive policy plans minimizing the cost aspects of EVs for potential drivers. Moreover, automobile manufacturers should establish systematic and user-oriented plans to improve users’ overall satisfaction in using EVs. With the increasing environmental concerns in our society, well-designed plans could encourage potential drivers to consider EVs for transportation. That is, future plans should be established with the considerations of not only economic aspects of EVs, but also users’ experience of EVs. For example, the UK government operates the integrated supporting plans and provides the incentives of 35%-purchasing price (up to £4500) for low-emission vehicles based on seven categories [54]. The supporting plan in Norway mainly concentrates on tax benefit, including no purchase/import taxes, no charges on toll gates, half-company automobile tax, and so on [55]. However, in South Korea, there are two separated supporting plans for EVs which are operated by the central and local governments, respectively [56].
Academically and theoretically, this study improves our understanding of this conceptual structure, including utilitarian, hedonic, and economic factors and their connections. Considering the prior studies that explored drivers’ perceptions of alternative transportation including EVs [57], the research model suggested and verified by this study can be applied to increase our overall understanding of drivers’ adoption of EVs. Although this study examined users’ adoption decisions related to EVs as a future transportation method, the following two research questions remain: (A) are other aspects of EVs significantly related to users’ adoption of the vehicles? And (B) can the adoption model proposed by this study be used to explain future transportation methods and renewable energy products?
This study attempts to expand the findings of previous technology acceptance studies on users’ adoption of particular technologies and products. Therefore, it contributes to the literature on EVs and renewable energy products by investigating the core roles of the variables examined and their significant connections in the integrated research model.

5. Limitations

This study has several limitations. First, other factors may be significantly associated with users’ intention to use technology. For example, prior studies on user behavior have indicated that personal characteristics of users and the technological factors of particular products and technologies can be strongly related to users’ perceptions of those technologies and products [58].
Second, some relationships may have been missed in the proposed research model. The correlation values among several of the investigated factors were high. This study has used a condensed model that excluded complicated connections.
Third, this study does not consider the unique characteristics of the individual driving experience. As previous studies have indicated, the driving patterns of EVs can be significantly affected by charging and parking systems [43]. Moreover, drivers’ subjective needs and targeting behaviors can be related to their perceived usefulness [59]. Moreover, prior studies have showed that infrastructure availability for a particular service is strongly associated with users’ perceived ease of use [60].
Fourth, although the functionality and usability of EVs have been extracted via the initial interview, perceived risks and problems in terms of the technical aspects of EVs have not been considered while prior studies have showed that the environmental aspects of EVs can be significantly related to users’ attitudes toward them [59,61].
Fifth, there may be a common method bias. Several prior studies on SEM and information systems have shown that this bias can significantly influence the results of SEM and regression analysis [62,63]. Considering previous studies on how the perceived risks of renewable energy facilities and products affect their distribution [44], future studies should extend the research model by examining the potential risks and problems of EVs.
Sixth, perceived enjoyment of EVs has been one of the motivators for boosting driver attitudes and increasing their intention to use through perceived satisfaction. Therefore, future research should examine the relationships between perceived enjoyment of EVs and driver perspectives toward them.
Due to these limitations, future researchers should be careful in applying the results of this study to explaining other future transportation and renewable energy products.

Acknowledgments

This work was supported by the Ministry of Education of the Republic of Korea and the National Research Foundation of Korea (NRF-2017S1A5B8058870). This work was also supported by the research fund of Hanyang University (HY-2017-N).

Author Contributions

Eunil Park wrote the majority of the manuscript and designed the survey. Jooyoung Lim and Yongwoo Cho took part in the revision of the manuscript.

Conflicts of Interest

The authors declare no conflict of interest.

References

  1. International Energy Agency. World Energy Outlook: Summary and Conclusions. 2017. Available online: http://www.worldenergyoutlook.org (accessed on 2 June 2017).
  2. Egbue, O.; Long, S. Barriers to widespread adoption of electric vehicles: An analysis of consumer attitudes and perceptions. Energy Policy 2012, 48, 717–729. [Google Scholar] [CrossRef]
  3. The U.S. National Resources Defence Council. The Next Generation of Hybrid Cars. 2007. Available online: https://www.nrdc.org/energy/plugin.pdf (accessed on 2 June 2017).
  4. Mom, G. The Electric Vehicle: Technology and Expectations in the Automobile Age; Johns Hopkins University Press: Baltimore, MD, USA, 2012. [Google Scholar]
  5. Iodice, P.; Senatore, A. Industrial and urban sources in Campania, Italy: The air pollution emission inventory. Energy Environ. 2015, 26, 1305–1317. [Google Scholar] [CrossRef]
  6. Iodice, P.; Senatore, A. Atmospheric pollution from point and diffuse sources in a National Interest Priority Site located in Italy. Energy Environ. 2016, 27, 586–596. [Google Scholar] [CrossRef]
  7. Iodice, P.; Senatore, A.; Meccariello, G.; Prati, M.V. Methodology for the analysis of a 4-stroke moped emission behaviour. SAE Int. J. Eng. 2010, 2, 617–626. [Google Scholar] [CrossRef]
  8. United Nations Framework Convention on Climate Change. Intended Nationally Determined Contribution. 2015. Available online: http://www4.unfccc.int/ndcregistry/PublishedDocuments/Republic%20of%20Korea%20First/INDC%20Submission%20by%20the%20Republic%20of%20Korea%20on%20June%2030.pdf (accessed on 26 February 2018).
  9. Oliver, J.G.J.; Jansses-Maenhout, G.; Muntean, M.; Peters, J.A.H.W. Trends in Global CO2 Emissions: 2016 Report. European Commission, 2016. Available online: http://edgar.jrc.ec.europa.eu/news_docs/jrc-2016-trends-in-global-co2-emissions-2016-report-103425.pdf (accessed on 26 February 2018).
  10. Hong, S.; Chung, Y.; Kim, J.; Chun, D. Analysis on the level of contribution to the national greenhouse gas reduction target in Korean transportation sector using LEAP model. Renew. Sustain. Energy Rev. 2016, 60, 549–559. [Google Scholar] [CrossRef]
  11. Harris, B. South Korea Seeks to Boost Motorists’ Interest in Electric Cars. 2017. Available online: https://www.ft.com/content/2df59014-f0f5-11e6-8758-6876151821a6 (accessed on 26 February 2018).
  12. Costagliola, M.A.; Prati, M.V.; Florio, S.; Scorletti, P.; Terna, D.; Iodice, P.; Senatore, A. Performances and emissions of a 4-stroke motorcycle fuelled with ethanol/gasoline blends. Fuel 2016, 183, 470–477. [Google Scholar] [CrossRef]
  13. Axsen, J.; Kurani, K.S.; Burke, A. Are batteries ready for plug-in hybrid buyers? Transp. Policy 2010, 17, 173–182. [Google Scholar] [CrossRef]
  14. Sovacool, B.K.; Hirsh, R.F. Beyond batteries: An examination of the benefits and barriers to plug-in hybrid electric vehicles (PHEVs) and a vehicle-to-grid (V2G) transition. Energy Policy 2009, 37, 1095–1103. [Google Scholar] [CrossRef]
  15. Eberle, U.; Von Helmolt, R. Sustainable transportation based on electric vehicle concepts: A brief overview. Energy Environ. Sci. 2010, 3, 689–699. [Google Scholar] [CrossRef]
  16. Jansson, J.; Nordlund, A.; Westin, K. Examining drivers of sustainable consumption: The influence of norms and opinion leadership on electric vehicle adoption in Sweden. J. Clean. Prod. 2017, 154, 176–187. [Google Scholar] [CrossRef]
  17. Brown, M. Catching the PHEVer: Simulating electric vehicle diffusion with an agent-based mixed logit model of vehicle choice. J. Artif. Soc. Soc. Simul. 2013, 16, 5. [Google Scholar] [CrossRef]
  18. Carley, S.; Krause, R.M.; Lane, B.W.; Graham, J.D. Intent to purchase a plug-in electric vehicle: A survey of early impressions in large US cites. Transp. Res. Part D Transp. Environ. 2013, 18, 39–45. [Google Scholar] [CrossRef]
  19. Thein, S.; Chang, Y.S. Decision making model for lifecycle assessment of lithium-ion battery for electric vehicle—A case study for smart electric bus project in Korea. J. Power Sources 2014, 249, 142–147. [Google Scholar] [CrossRef]
  20. Wee, D. Diffusion of Electric Vehicles in South Korea. 2015. Available online: http://www.electimes.com/home/news/main/viewmain.jsp?news_uid=120391 (accessed on 31 May 2017).
  21. Davis, F.D. Perceived usefulness, perceived ease of use, and user acceptance of information technology. MIS Q. 1989, 13, 319–340. [Google Scholar] [CrossRef]
  22. Lee, Y.; Kim, C.; Shin, J. A hybrid electric vehicle market penetration model to identify the best policy mix: A consumer ownership cycle approach. Appl. Energy 2016, 184, 438–449. [Google Scholar] [CrossRef]
  23. Lee, J.; Madanat, S. Optimal design of electric vehicle public charging system in an urban network for Greenhouse Gas Emission and cost minimization. Transp. Res. Part C Emerg. Technol. 2017, 85, 494–508. [Google Scholar] [CrossRef]
  24. Fernández, R.Á. A more realistic approach to electric vehicle contribution to greenhouse gas emissions in the city. J. Clean. Prod. 2018, 172, 949–959. [Google Scholar] [CrossRef]
  25. Hannan, M.A.; Azidin, F.A.; Mohamed, A. Hybrid electric vehicles and their challenges: A review. Renew. Sustain. Energy Rev. 2014, 29, 135–150. [Google Scholar] [CrossRef]
  26. Manzetti, S.; Mariasiu, F. Electric vehicle battery technologies: From present state to future systems. Renew. Sustain. Energy Rev. 2015, 51, 1004–1012. [Google Scholar] [CrossRef]
  27. Zheng, Y.; Dong, Z.Y.; Xu, Y.; Meng, K.; Zhao, J.H.; Qiu, J. Electric vehicle battery charging/swap stations in distribution systems: Comparison study and optimal planning. IEEE Trans. Power Syst. 2014, 29, 221–229. [Google Scholar] [CrossRef]
  28. Proost, S.; Van Dender, K. What Sustainable Road Transport Future? Trends and Policy Options; OECD/ITF Joint Transport Research Centre Discussion Paper (No. 2010-14). 2010. Available online: https://www.itf-oecd.org/sites/default/files/docs/dp201014.pdf (accessed on 26 February 2018).
  29. Ozaki, R.; Sevastyanova, K. Going hybrid: An analysis of consumer purchase motivations. Energy Policy 2011, 39, 2217–2227. [Google Scholar] [CrossRef]
  30. Ajzen, I. The theory of planned behavior. Organ. Behav. Hum. Decis. Process. 1991, 50, 179–211. [Google Scholar] [CrossRef]
  31. Chen, M.F. Extending the theory of planned behavior model to explain people’s energy savings and carbon reduction behavioral intentions to mitigate climate change in Taiwan–moral obligation matters. J. Clean. Prod. 2016, 112, 1746–1753. [Google Scholar] [CrossRef]
  32. Dezdar, S. Green information technology adoption: Influencing factors and extension of theory of planned behavior. Soc. Responsib. J. 2017, 13, 292–306. [Google Scholar] [CrossRef]
  33. Kim, H.; Park, E.; Kwon, S.J.; Ohm, J.Y.; Chang, H.J. An integrated adoption model of solar energy technologies in South Korea. Renew. Energy 2014, 66, 523–531. [Google Scholar] [CrossRef]
  34. Huijts, N.M.; Molin, E.J.; Steg, L. Psychological factors influencing sustainable energy technology acceptance: A review-based comprehensive framework. Renew. Sustain. Energy Rev. 2012, 16, 525–531. [Google Scholar] [CrossRef]
  35. Park, E.; Kim, K.J. Driver acceptance of car navigation systems: Integration of locational accuracy, processing speed, and service and display quality with technology acceptance model. Pers. Ubiquitous Comput. 2014, 18, 503–513. [Google Scholar] [CrossRef]
  36. Park, E.; del Pobil, A.P. Modeling the user acceptance of long-term evolution (LTE) services. Ann. Telecommun. 2013, 68, 307–315. [Google Scholar] [CrossRef]
  37. Bockarjova, M.; Steg, L. Can protection motivation theory predict pro-environmental behavior? Explaining the adoption of electric vehicles in the Netherlands. Glob. Environ. Chang. 2014, 28, 276–288. [Google Scholar] [CrossRef]
  38. Rezvani, Z.; Jansson, J.; Bodin, J. Advances in consumer electric vehicle adoption research: A review and research agenda. Transp. Res. Part D Transp. Environ. 2015, 34, 122–136. [Google Scholar] [CrossRef]
  39. Wang, S.; Fan, J.; Zhao, D.; Yang, S.; Fu, Y. Predicting consumers’ intention to adopt hybrid electric vehicles: Using an extended version of the theory of planned behavior model. Transportation 2016, 43, 123–143. [Google Scholar] [CrossRef]
  40. Park, E.; Baek, S.; Ohm, J.; Chang, H.J. Determinants of player acceptance of mobile social network games: An application of extended technology acceptance model. Telemat. Inf. 2014, 31, 3–15. [Google Scholar] [CrossRef]
  41. Park, E.; Kim, K.J.; del Pobil, A.P. An examination of psychological factors affecting drivers’ perceptions and attitudes toward car navigation systems. Lect. Notes Electr. Eng. 2013, 215, 555–562. [Google Scholar] [CrossRef]
  42. Van der Heijden, H. User acceptance of hedonic information systems. MIS Q. 2004, 28, 695–704. [Google Scholar] [CrossRef]
  43. Azadfar, E.; Sreeram, V.; Harries, D. The investigation of the major factors influencing plug-in electric vehicle driving patterns and charging behaviour. Renew. Sustain. Energy Rev. 2015, 42, 1065–1076. [Google Scholar] [CrossRef]
  44. Park, E.; Ohm, J.Y. Factors influencing the public intention to use renewable energy technologies in South Korea: Effects of the Fukushima nuclear accident. Energy Policy 2014, 65, 198–211. [Google Scholar] [CrossRef]
  45. Hartmann, P.; Ibáñez, V.A. Managing customer loyalty in liberalized residential energy markets: The impact of energy branding. Energy Policy 2007, 35, 2661–2672. [Google Scholar] [CrossRef]
  46. Jones, P. Acceptability of Transport Pricing Strategies: Meeting the Challenge. 2002. Available online: http://discovery.ucl.ac.uk/76894 (accessed on 2 June 2017).
  47. Shin, D.H.; Shin, Y.J. Why do people play social network games? Comput. Hum. Behav. 2011, 27, 852–861. [Google Scholar] [CrossRef]
  48. Yi, M.Y.; Hwang, Y. Predicting the use of web-based information systems: Self-efficacy, enjoyment, learning goal orientation, and the technology acceptance model. Int. J. Hum. Comput. Stud. 2003, 59, 431–449. [Google Scholar] [CrossRef]
  49. Lee, K.C.; Chung, N. Understanding factors affecting trust in and satisfaction with mobile banking in Korea: A modified DeLone and McLean’s model perspective. Interact. Comput. 2009, 21, 385–392. [Google Scholar] [CrossRef]
  50. Anderson, J.C.; Gerbing, D.W. Structural equation modeling in practice: A review and recommended two-step approach. Psychol. Bull. 1988, 103, 411–423. [Google Scholar] [CrossRef]
  51. Fornell, C.; Larcker, D.F. Evaluating structural equation models with unobservable variables and measurement error. J. Mark. Res. 1981, 18, 39–50. [Google Scholar] [CrossRef]
  52. Hoelter, J.W. The analysis of covariance structures: Goodness-of-fit indices. Sociol. Methods Res. 1983, 11, 325–344. [Google Scholar] [CrossRef]
  53. Ewing, G.; Sarigöllü, E. Assessing consumer preferences for clean-fuel vehicles: A discrete choice experiment. J. Public Policy Mark. 2000, 19, 106–118. [Google Scholar] [CrossRef]
  54. UK Government. Low-Emission Vehicles Eligible for a Plug-In Grant. 2017. Available online: https://www.gov.uk/plug-in-car-van-grants (accessed on 26 February 2018).
  55. EV Norway. Norwegian EV Policy. 2017. Available online: https://elbil.no/english/norwegian-ev-policy/ (accessed on 26 February 2018).
  56. Korea Environment Corporation. EV Incentives in Korea. 2018. Available online: https://www.ev.or.kr/portal/buyersGuide/incenTive?pMENUMST_ID=21549 (accessed on 26 February 2018).
  57. Burgess, M.; King, N.; Harris, M.; Lewis, E. Electric vehicle drivers’ reported interactions with the public: Driving stereotype change? Transp. Res. Part F Traffic Psychol. Behav. 2013, 17, 33–44. [Google Scholar] [CrossRef]
  58. Lassar, W.M.; Manolis, C.; Lassar, S.S. The relationship between consumer innovativeness, personal characteristics, and online banking adoption. Int. J. Bank Mark. 2005, 23, 176–199. [Google Scholar] [CrossRef]
  59. Steinhilber, S.; Wells, P.; Thankappan, S. Socio-technical inertia: Understanding the barriers to electric vehicles. Energy Policy 2013, 60, 531–539. [Google Scholar] [CrossRef]
  60. Park, E.; Ohm, J.Y. Appropriate technology for sustainable ecosystems: Case studies of energy self-reliant villages and the future of the energy industry. Sustain. Dev. 2015, 23, 74–83. [Google Scholar] [CrossRef]
  61. Franke, T.; Krems, J.F. Understanding charging behaviour of electric vehicle users. Transp. Res. Part F Traffic Psychol. Behav. 2013, 21, 75–89. [Google Scholar] [CrossRef]
  62. Malhotra, N.K.; Kim, S.S.; Patil, A. Common method variance in IS research: A comparison of alternative approaches and a reanalysis of past research. Manag. Sci. 2006, 52, 1865–1883. [Google Scholar] [CrossRef]
  63. Siemsen, E.; Roth, A.; Oliveira, P. Common method bias in regression models with linear, quadratic, and interaction effects. Organ. Res. Methods 2010, 13, 456–476. [Google Scholar] [CrossRef]
Figure 1. The integrated research model.
Sustainability 10 00662 g001
Figure 2. Results of the hypotheses tests; * p < 0.001, H1, H2, H3, H4, H5 (from the TAM), H6 (satisfaction—intention), H7 (satisfaction—attitude), H8 (enjoyment—satisfaction), and H10 (perceived cost—intention) were confirmed, while H9 (enjoyment—attitude) was not supported.
Sustainability 10 00662 g002
Table 1. Results of the in-depth interviews.
Potential Variablesn (%)
1Functionality/Usability39 (29.8%)
2Cost (in maintenance and purchase) 30 (22.9%)
3Satisfaction (including convenience)22 (16.8%)
4Easy to drive12 (9.2%)
5Enjoyment7 (5.3%)
6Etc.21 (16.0%)
TotalFrom 15 drivers131 queries
Table 2. Questionnaire items in the main survey.
ConstructsDescriptions
Perceived Ease of Use [21]PEOU1: I find electric vehicles easy to drive.
PEOU2: Driving electric vehicles does not require a lot of physical effort.
PEOU3: Driving electric vehicles does not require a lot of mental effort.
Perceived Usefulness [21,36]PU1: Driving electric vehicles may lead to better and new ways to significantly contribute to our environment.
PU2: Driving electric vehicles can improve my work efficiency and performance.
PU3: Using electric vehicles can increase my productivity.
Perceived Enjoyment [41,42]EN1: I enjoy driving electric vehicles.
EN2: Driving electric vehicles is more enjoyable than driving traditional vehicles.
EN3: I am happy to use electric vehicles.
Satisfaction [48,49]ST1: Overall, I am satisfied with electric vehicles.
ST2: I have positive feelings toward electric vehicles in general.
ST3: I recommend electric vehicles to others who intend to purchase and use new vehicles.
Public Attitude [33,44]ATT1: Driving electric vehicles is good for us.
ATT2: Using electric vehicles is wise for us.
ATT3: I agree with the use of electric vehicles.
Perceived Cost [44]PC1: It takes a considerable amount of effort and cost to use electric vehicles.
PC2: I think the purchasing cost of driving electric vehicles is expensive.
PC3: I think the maintenance cost of driving electric vehicles is expensive.
Intention to Use [21,44]IU1: I would rather drive electric vehicles than other vehicles.
IU2: If possible, I intend to drive electric vehicles as much as possible.
IU3: If possible, I would like to continually use electric vehicles.
Table 3. Demographic data of the participants.
Agen (%)Driving Experiencen (%)
19–30149 (15.1%)0~5 years128 (13.0%)
31–40292 (29.6%)5~10 years198 (20.0%)
41–50331 (33.5%)10~15 years351 (35.5%)
51–60139 (14.1%)15~20 years205 (20.7%)
Over 6077 (7.8%)Over 20 years106 (10.7%)
Driving experience of electric vehiclesEducation
3~5 times97 (9.8%)High school or below677 (68.5%)
5~10 times437 (44.2%)College272 (27.5%)
10~20 times352 (35.6%)Graduate or above39 (3.9%)
Over 20 times102 (10.3%)
Gender
Male539 (54.6%)
Female449 (45.4%)
Table 4. Descriptive statistics of the selected constructs.
ConstructMeanStandard Deviation
Perceived Ease of Use4.321.17
Perceived Usefulness4.601.02
Perceived Enjoyment4.091.25
Satisfaction4.181.19
Public Attitude4.541.01
Perceived Cost3.951.38
Intention to Use4.931.39
Table 5. Internal and convergent reliability of the constructs.
ConstructItemInternal ReliabilityConvergent Validity
Cronbach’s AlphaItem-Total CorrelationFactor LoadingsComposite ReliabilityAverage Variance Extracted
Perceived Ease of UsePEOU10.8600.7990.8830.9110.772
PEOU2 0.7950.898
PEOU3 0.8490.855
Perceived UsefulnessPU10.8380.8130.8560.9190.791
PU2 0.8340.934
PU3 0.7840.877
Perceived EnjoymentEN10.8670.8660.9310.9420.845
EN2 0.8280.924
EN3 0.8350.902
SatisfactionST10.9080.8460.9250.9420.844
ST2 0.8600.900
ST3 0.8940.931
Public AttitudeATT10.9100.8610.8300.8570.667
ATT2 0.8990.851
ATT3 0.8500.766
Perceived CostPC10.8590.8190.9240.9310.819
PC2 0.8430.928
PC3 0.8000.861
Intention to UseIU10.8910.8160.8890.9160.784
IU2 0.9040.890
IU3 0.8850.878
Table 6. Discriminant validity; the square roots of average variance extracted between the variables are presented in diagonal elements.
1234567
1. Perceived Ease of Use0.879
2. Perceived Usefulness0.2210.889
3. Perceived Enjoyment0.1980.1510.919
4. Satisfaction0.0980.3270.2930.919
5. Public Attitude0.1760.5500.4250.3960.817
6. Perceived Cost−0.112−0.264−0.098−0.170−0.3090.905
7. Intention to Use0.3830.4020.1870.1410.284−0.2180.885
Table 7. Fit indices of the measurement model and research model.
IndexMeasurement ModelResearch ModelSatisfactory Levels
χ2930.811031.91-
Degree of freedom198214-
χ2/d.f.4.7014.822<5.00
Comparative Fit Index0.9130.908>0.900
Incremental fit index0.9160.923>0.900
Goodness-of-fit index0.9010.902>0.900
Adjusted goodness-of-fit index0.9030.903>0.900
Normed fit index0.9100.908>0.900
Non-normed fit index0.9080.911>0.900
Standardized root mean square residual0.0590.058<0.060
Root mean square of approximation0.0730.076<0.080
Table 8. Summary of the results; * p < 0.001; Attitude: Public attitude, Intention: Intention to use, PU: Perceived usefulness, PEOU: Perceived ease of use, Enjoyment: Perceived enjoyment, Cost: Perceived cost.
HypothesesStandard CoefficientStandard ErrorCritical RatioResults
H1. Attitude → Intention0.261 *0.03910.600Supported
H2. PU → Intention0.303 *0.03613.117Supported
H3. PU → Attitude0.240 *0.0328.106Supported
H4. PEOU → PU0.301 *0.0289.934Supported
H5. PEOU → Attitude0.130 *0.0314.376Supported
H6. Satisfaction → Intention0.336 *0.01914.209Supported
H7. Satisfaction → Attitude0.334 *0.03010.869Supported
H8. Enjoyment → Satisfaction0.395 *0.02613.493Supported
H9. Enjoyment → Attitude0.0230.0260.750Not supported
H10. Cost → Intention−0.378 *0.032−17.158Supported
Table 9. Total standardized effects on intention.
Total Standardized Effects Total Standardized Effects
Attitude0.261Enjoyment0.173
PU0.366Satisfaction0.423
PEOU0.144Cost−0.378

