1. Introduction
Since the 1990s, accompanying the rapid urbanization, an important feature of China’s social change is its large-scale interregional migration, originating from not only the high demand for labor in the eastern coastal region due to its development policy but also the gradual loosening of migration and household registration policies. The migrant population has reached 247 million by 2015, accounting for approximately 1/6 of the total population, with an increase of approximately 8 million per year, according to the
2016 Report on China’s Migrant Population Development released by the National Health and Family Planning Commission of China. With the rapid development of China’s urbanization, intercity migration has directly led to the change of city numbers and sizes at all levels, thus affecting the city hierarchical structure and city spatial distribution, namely the urban system. The urban system is a spatial distribution structure in a region, country or the world consisting of cities of different types and sizes [
1]. As the connections between cities are becoming increasingly complex instead of containing purely vertical and horizontal linkages and the social network analysis method (Social network analysis (SNA) is the mapping and measuring of relationships and flows between people, groups, organizations, computers and other connected socioeconomic entities) is in wide use, urban system research has shifted gradually from the inspection of city attributes to the exploration of intercity relationships in networked societies in the form of “world city network research” [
2,
3]. From the perspective of migration, all cities in the urban system form a network connected by intercity migration and this spatial linkage integrates the scattered cities into a whole. By conducting an associated exploration of migration and the urban system, both of which are important issues in the research fields of regional economics and urban geography, this study comprehensively and deeply reveals the interaction and co-evolution mechanism between the two, combining theories of demography and New Economic Geography.
Population represents regional competitiveness in current China and the diminishing of China’s demographic dividend leads to a new round of population battle between cities [
4]. China is now in a transition stage from the industrial society to the post-industrial society, in which the low-end manufacturing has been gradually replaced by the service industry, whose development needs sufficient labor force and domestic market demand, as well as high-quality talents, so megacities and urban agglomerations with large population have obvious advantages. This study investigates the direction of the future population battle and predicts which cities will stand out. The key research question in this paper, therefore, concerns how China’s migration network influences the urban system and what the distribution of China’s future city sizes will be. This is of particular interest for several reasons. Firstly, urbanization has become a dominant tendency influencing China’s future economic development and the clearest manifestation of urbanization is migration, which brings about the evolution of the urban system. Second, starting from the essence of China’s urbanization—the migration network, this study analyzes the influencing factors of migration and the evolutionary process of the urban system and establishes an urban system model with an explicit intercity migration mechanism and a clear spatial reference, thus deepening the studies of the urban system and migration. Thirdly, the model is used as the basis for predicting the size changes of all cities, regarding the whole urban system as a network connected by intercity migration, with the prediction results providing scientific evidence for decision making in National New-Type Urbanization Planning, in terms of floating population management, public service improvement and urban system planning.
China is used as an example to predict the future evolution of the urban system based on the migration network for the following reasons: China’s urbanization has increasingly attracted attention from across the world. As Nobel Laureate Joseph E. Stiglitz comments, China’s urbanization is one of the two important issues influencing the future development of the world’s economy in the 21st century. Furthermore, with the rapid urbanization in full swing and the demographic dividend coming to an end, China’s future city-size distribution is mainly influenced by intercity migration, making it a typical case for this research.
This paper proceeds as follows. In
Section 2, the related literature is systematically reviewed, followed by a description in
Section 3 of the theoretical model based on NEG theory to explain how intercity migration influences changes in city sizes. The actual evolutionary process of China’s urban system is simulated in
Section 4 to evaluate the precision of model fit, leading to the use of the theoretical model in
Section 5 in predicting the future evolution of the urban system under different urbanization scenarios. Finally, concluding remarks and policy suggestions are provided in
Section 6.
2. Literature Review
As there exists a close relationship between the urban system and migration, this study will review studies on migration and the urban system in a separate and integrated context. More specifically, it starts with migration theories, taking into account China’s population projection methods, introduces theoretical models of urban system, further discusses the relationship between migration and the urban system and finally summarizes deficiencies of current research and the main contributions of this study.
Migration models, which are used to analyze and simulate the migration process and predict migration indices, can be divided into macro models, micro models and comprehensive models in terms of the research scale. This paper studies intercity migration, which can be viewed as a mechanism analysis at the macro level, so we will focus on macro models and comprehensive models (combining macro models with micro models). There are three main types of macro models. First, the basic idea of a gravity model (Zipf [
5]; Stouffer [
6]; Lowry [
7]) is that interregional migration is positively related to the population sizes and economic development levels of the origin and destination regions and inversely related to the distance between these two regions. Second, push-pull migration theory (Lee [
8]) holds that the push force of the origin region, the pull force of the destination region and intervening obstacle factors directly influence migration. This theory has been extended by other scholars (Lowry [
7]; Rogers [
9]) to include a series of influencing factors: demographic, economic (such as income and unemployment rate), social, geographic, ecological factors, government policies (including migration policies, especially household registration system in China), housing indexes, previous interregional migration flow and interregional distance. Third, the Markov chain migration model (Rogers [
10]; Keyfitz [
11]) assumes that migration is determined by the probability of interregional migration. Other classical microeconomic migration models incorporate the Dual Economy Model (Lewis [
12]), the Expected Income Theory (Todaro [
13]), the Hypothesis of the Mobility Transition (Zelinsky [
14]), the Dual Labor Market Theory (Piore [
15]), New Economics of Migration (Stark and Bloom [
16]), Network Theory (Taylor [
17]), the Cost-Income Theory (Schultz [
18]) and so on. Migration models are conventionally used to explain the migration process at the macro or micro levels only, although the construction of comprehensive migration models by combining macro and micro models has recently attracted attention from academia. Comprehensive models mainly consist of meso migration models (Cadwallader [
19]), 2-stage migration models (ODPM [
20]; Fotheringham et al. [
21]), spatial choice models (Fotheringham [
22,
23]), multiregional models (Rogers [
24]) and NEG models (Fujita, Krugman and Venables [
25]). Of these, NEG models are based on the hypothesis that spatial economic agglomeration is the main reason for migration aggregation and that the labor force tends to migrate to a region with a relatively high utility/wage level. Among these migration theories, Gries, Kraft and Simon [
26] argue that three strands of theory that seem relevant for the migration process within China are identified as the classical rural-urban migration approach (in line with Harris/Todaro), the NEG and gravity approach and the new economics of labor migration (NELM).
Although theories proposed to explain internal migration posit different causal mechanisms at many levels of aggregation, the various propositions of the above migration theories all suggest that migration flows acquire a measure of stability and structure over space and time, allowing for the identification of stable internal migration systems (Massey et al. [
27]). An internal migration system is characterized by relatively large flows of migrants between certain regions compared to flows from outside the system, including a core destination region, which may be a city or group of cities and a set of specific origin regions linked to it by large flows of immigrants (Fawcett [
28]; Hania [
29]). Multipolar migration systems may exist and migration systems will evolve as social and economic conditions change. As the cities in the migration system are connected by intercity migration network, the review on migration systems theory will enlighten further studies.
In China, studies of population projection often adopt traditional research methods, such as Leslie Matrix Model (Leslie [
30]), Keyfitz Model (Keyfitz [
11]), Logistic Model (Malthus and Flew [
31]), Population Dynamics Equation (Song [
32]) and Grey System Method (Deng [
33]), whereas few studies use intercity migration to predict the population change of each city from the perspective of all cities. At present, the mechanical growth of population in China’s cities is higher than the natural growth, so the fact that most of the existing prediction models do not take into account intercity migration causes a deviation in the prediction results. To overcome the lack of research into population spatial patterns in China, Deng et al. [
34] constructed a new top-down, multiregional population projection method to predict the population at national and provincial levels in China from 2010 to 2050, considering both natural population growth and intercity migration as influencing factors. There are two problems with this: First, the assumption of the Markov chain migration model used in the prediction, that the transition probability is determined by the evolution of the system, is not consistent with the reality; Second, the prediction is on a macroscopic scale at the provincial level, while it is more helpful to predict the population of each city when making planning and policy decisions. Even more encouraging, the gravity modelling of migration has a promising future in a multiregional population projection system (Poot et al. [
35]; Kumo [
36]), which will benefit China’s future population projection.
Urban system theoretical models comprise classical urban system models and urban system models based on NEG theories. Classical urban system models include central place theory (Christaller [
37]; Losch [
38]), optimum city size theory (Henderson [
39]) and urban growth theory. Central place theory was first put forward by Christaller [
37] and Losch [
38] developed this theory which suggests that a city’s size depends on the economy scale of goods or services provided by the city, thus explaining how the location patterns of different industries form the regional urban system. As a classical model of urban economics, Henderson’s [
39] optimum city size theory explains the concentration of economic activities in cities and the formation of city size distribution and points out that a balanced city size will eventually form under the effects of external economies of scale (spatial agglomeration of specific industries in cities) and external non-economy (rising commuting and congestion costs caused by overlarge city sizes). Furthermore, urban growth theories also focus on the city size structure of urban systems, including random growth models (Simon [
40]) and endogenous growth models predicting deterministic, persistent, parallel growth of cities (Eaton and Eckstein [
41]; Black and Henderson [
42]; Duranton [
43,
44]; Glaeser et al. [
45,
46]). The random growth theory assumes that the city size growth process follows Gibrat’s law (a stochastic process in which all cities have a common expected growth rate and a common standard deviation), then, in the steady state, the distribution of city sizes will follow Zipf’s law (Cordoba [
47]; Gabaix [
48]). In regard to researches on China’s urban system, many scholars have conducted empirical studies on the best approximation for China’s city size distribution based on Zipf’s Law and the patterns of urban growth and analyzed influences of economic and institutional factors on the urban system and urban growth (Song and Zhang [
49]; Anderson and Ge [
50]; Schaffar and Dimou [
51]; Chen and Greene [
52]), especially intercity migration in recent years as an important factor contributing to city growth in China.
Urban system models based on NEG theories incorporate the space factor into urban system evolution theories (Fujita and Krugman [
53]; Fujita and Mori [
54]; Fujita et al. [
25]), effectively making up for the lack of spatial dimension and microeconomics basis in previous urban system evolution models. The initial conditions of locational characteristics play a crucial role in shaping the formation and evolution of the city size of that location, which is called the path dependence effect or the lock-in effect of self-reinforcing agglomeration forces [
55]. The basic agglomeration mechanism of the urban system is the same as that of basic NEG models, which consists of the diversity of consumer preferences, interregional transport costs and manufacturers’ internal economies of scale and is embodied in the local market effect and the price index effect, with the spatial distribution of manufacturing activities determining the city number, sizes and locations in equilibrium. Urban system models based on NEG theories are represented by Krugman’s [
56] racetrack economy model and Fujita, Krugman and Mori’s [
57] linear model of the urban system, which present a regular urban hierarchy through the self-organization of microeconomic entities. Under the theoretical framework of NEG models, the racetrack economy model comprises a circle of 12 equidistant locations, with goods only transported along the circle. In such a ring-shaped space, when the share of expenditure on manufacturing goods is large enough, or the elasticity of substitution is high enough, or the transportation cost is low enough, the originally evenly distributed areas change dramatically. Some locations with weak initial advantages tend to expand their population sizes because of self-reinforcement and eventually evolve into cities. The following two examples demonstrate that it is feasible to apply the extended racetrack economy model to empirical studies of urban system: Stelder [
58] introduced geographical space into Krugman’s [
56] model to simulate the urban system of Europe; Ge et al. [
59] integrated spatial heterogeneity into Stelder’s [
58] model, calculated the geographic advantage of each grid and simulated the evolution of the urban system of Zhejiang Province in China.
A certain amount of studies has discussed the close relationship between migration and the urban system. To begin with, the evolution of urban system (the process of urbanization) and migration have mutually caused and resulted from each other, working together as a positive feedback system (Riddell and Harvey [
60]). Whether the internal migration flows are upward or downward within the urban hierarchy depends on the urbanization development stage of this country (Plane, Henrie and Perry [
61]). Other studies forecast dynamics of urban system based on migration flows between cities, linking the migratory behavior of individuals at the micro level to the dynamics of populations of cities at the macro level (Brown, Odland and Golledge [
62]; Haag et al. [
63]).
Concerning the interrelationship between migration and the urban system, the perspective of network analysis is adopted, which regards the urban system as a network of industrial activities and social connection (including migration) and uses network models to explain city size distribution. The existing network models (Barabasi and Albert [
64]; Menczer [
65]) propose the preference attachment hypothesis, which is similar to Simon’s [
40] stochastic growth model, making the connection of the network obey the power law distribution. The preferential attachment theory proposed by Barabasi and Albert [
64] can be used to analyze intercity migration. First, it is assumed in the theory that well-connected city nodes enjoying economies of scale can provide more reliable services and more switching opportunities at low costs, so a new city in the network always tends to establish connections with well-connected city nodes and people are inclined to migrate to well-connected (with a large population) cities; Second, it is assumed that the network connection cost increases along with the increasing geographical distance, so the possibility of connecting a new node with existing nodes decreases with the increasing geographical distance between them, indicating that intercity migration will gradually decline with the augment of spatial distance. However, very few network models take into account space factors [
66]. Therefore, using the network model to explain city size distribution has a wide research potential and urban network theory is the key to studying complex connections between cities [
67]. Mansury and Gulyas [
68] adopted a bottom-up approach to construct a model and explained how migration behaviors of individual decision makers affect the formation of city size distribution. In summary, as intercity migration is one kind of city network and an important aspect of the research on urban system, it is feasible and necessary to combine the studies of migration and urban system to establish a comprehensive research framework and Krugman’s [
56] racetrack economy model provides a particular way to realize this goal, because city size distribution is determined by migration in this model.
In conclusion, to rectify the following problems in extant researches, this study makes the following contributions:
- (1)
Studies predicting China’s population are mainly based on local population growth models of one city, with a lack of studies on population spatial pattern prediction regarding the urban system as a whole and the spatial scales of migration are relatively macro [
69,
70,
71,
72]. This study establishes a global network model considering all cities and intercity migration linkages and predicts changes in each city’s population viewing the whole urban system as a network connected by intercity migration, by introducing important influencing factors of migration into the NEG model to deepen its migration mechanism and expanding the spatial scale of migration studies from province-level to city-level.
- (2)
Current models of the urban system (classical urban system models and NEG models) are based on two or several regions, difficult to be used to conduct empirical tests in a real geographic environment. This study extends the NEG model from two homogenous regions to heterogeneous multi-regions, to simulate and predict the evolution of China’s actual urban system using empirical evidence based on real data, thus advancing the development of empirical research into NEG theories.
- (3)
Though current studies on urban system evolution and migration have formed a complete theoretical system separately, there is no systematic research framework combining them into a comprehensive analysis. Due to the close interconnection between migration and urban system, based on the urban system evolution model of NEG theory [
56], this study establishes an integrated research framework for migration and urban system.
3. Description of the Simulation Process
In accordance with the key research question, this paper attempts to focus efforts in the following three aspects: exploring the influence of intercity migration on urban system; modelling China’s urban system by connecting all cities in the urban system by intercity migration; extending the extant theoretical models of urban system to make them applicable in empirical studies. The urban system model of Krugman [
56,
73], Fujita, Krugman and Venable [
25], can address the above problems, therefore it is chosen as the basic theoretical model. According to related migration theories and China’s actual situation, this study presents such important factors influencing migration as population, economic development, public service, geographic advantage (including living conditions and environment quality), social network, spatial distance and policy elements, using the gravity model with econometric results shown in
Table A1 in the
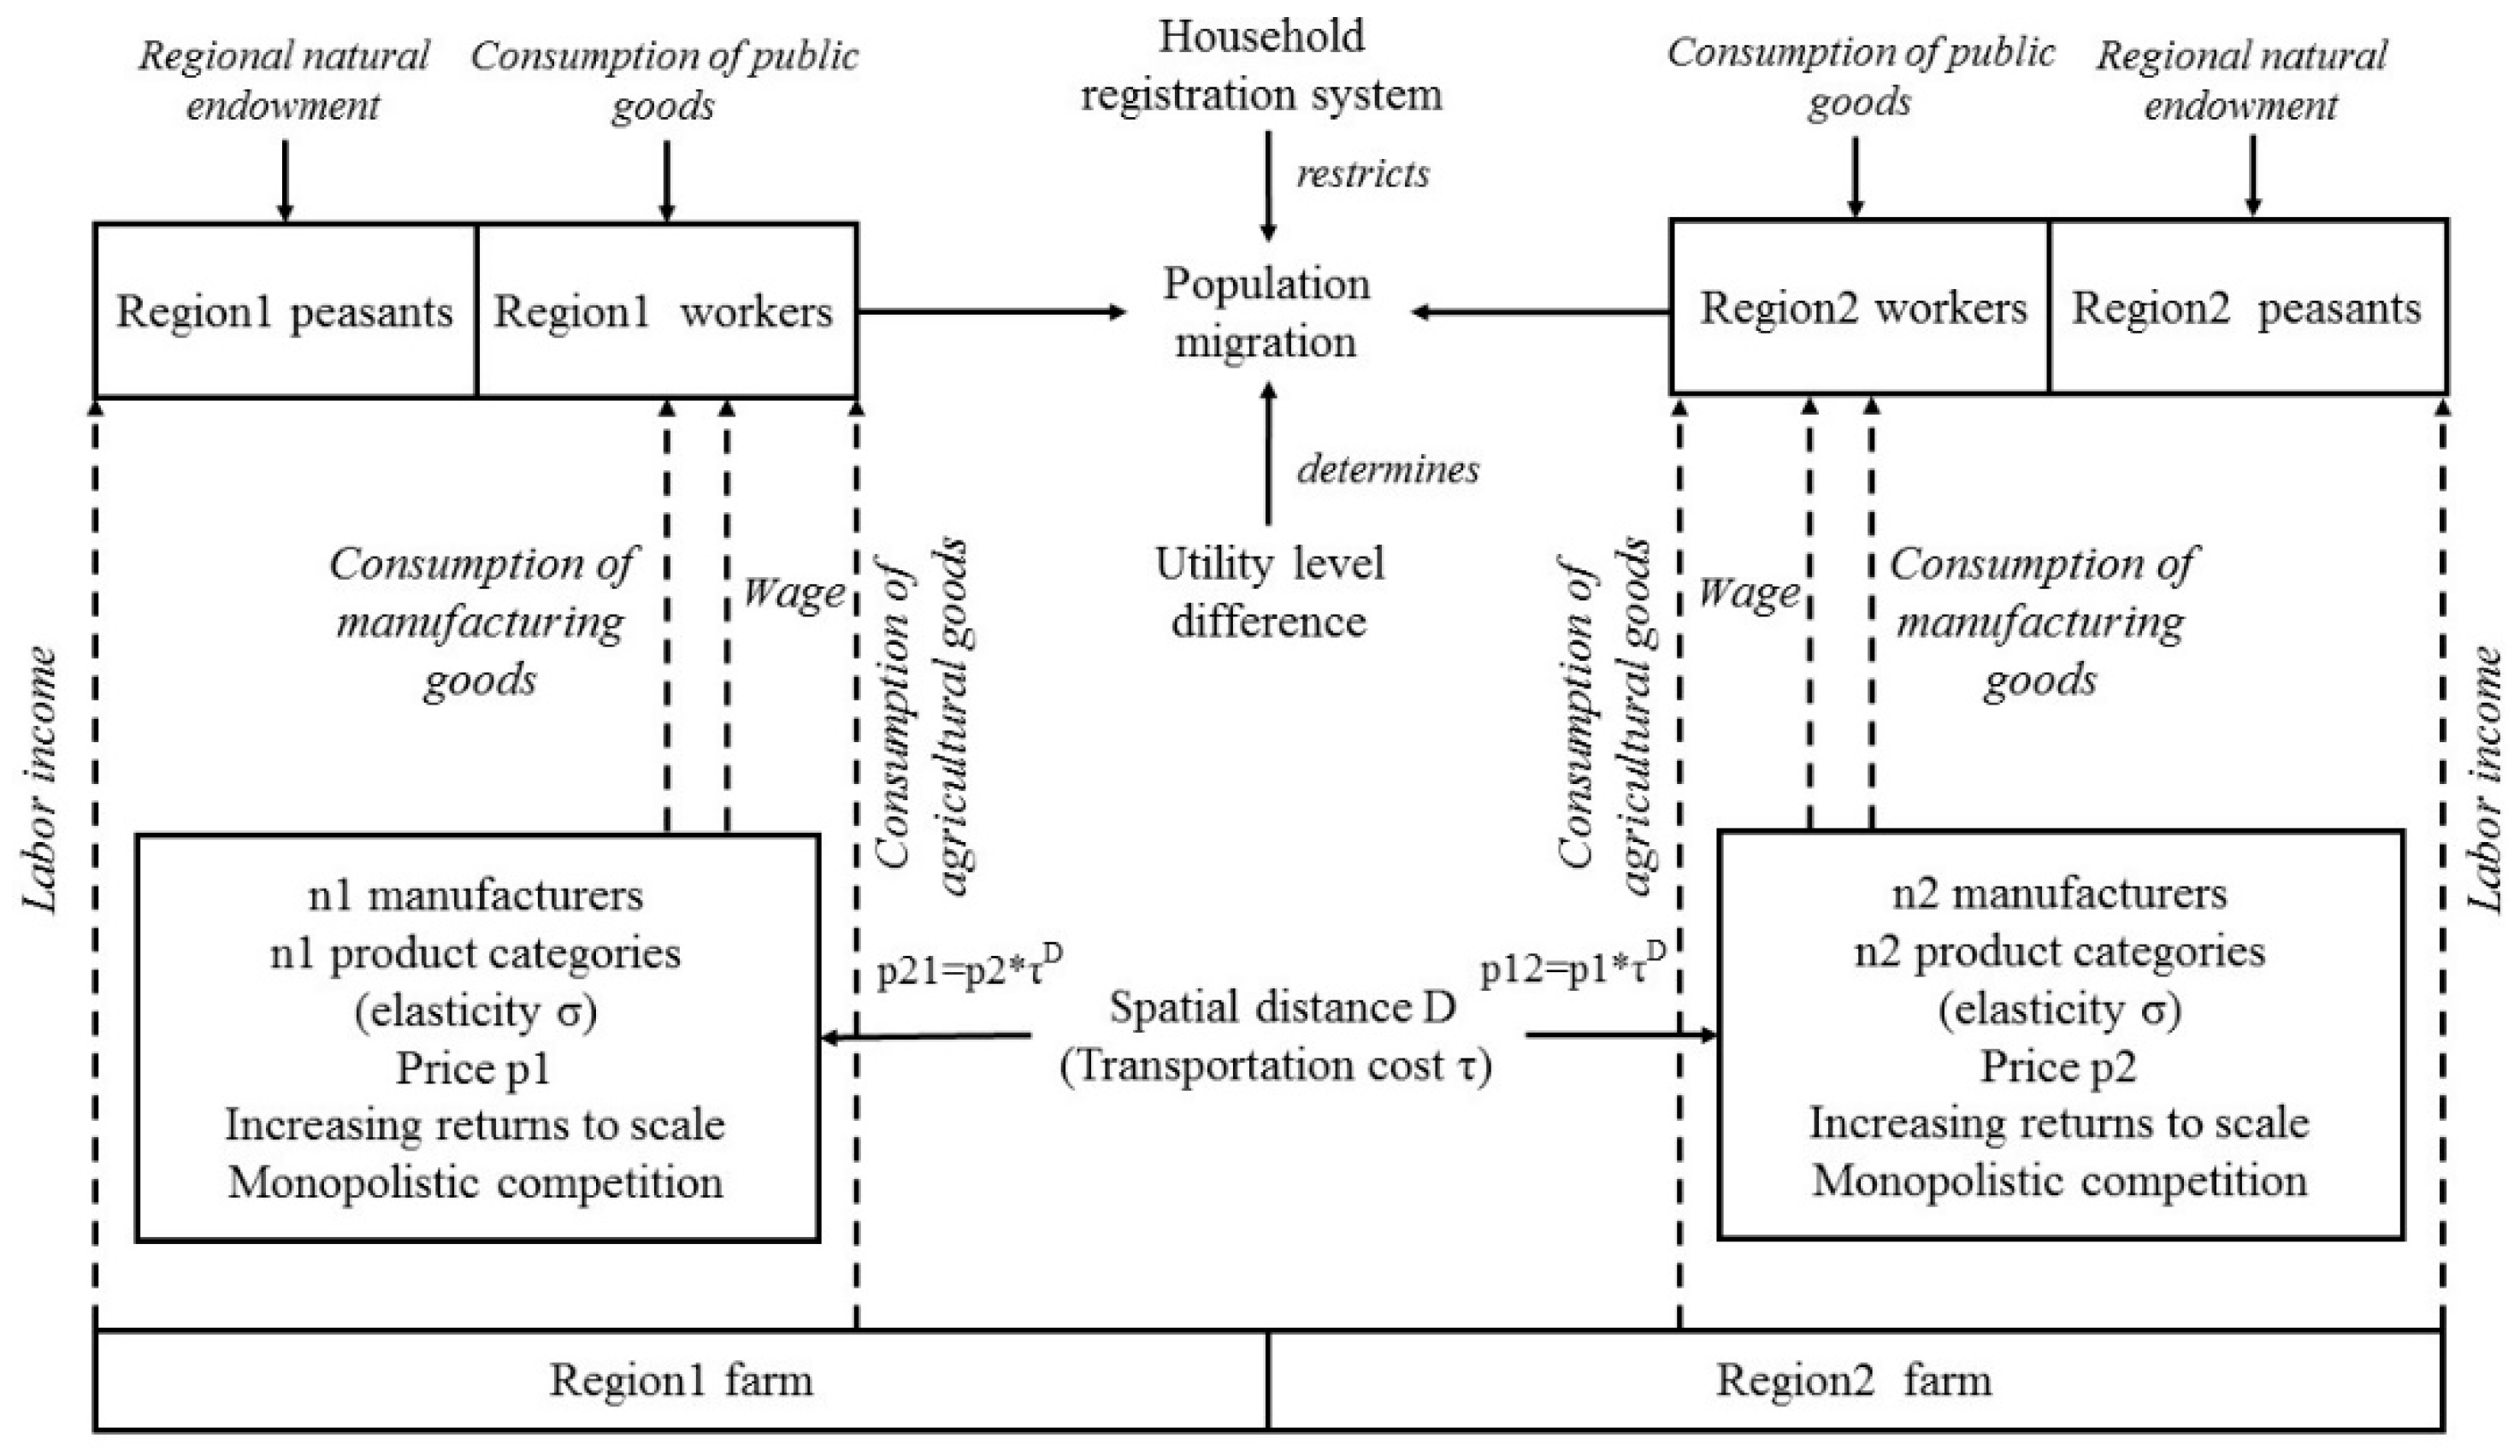
Appendix A. Hence, we add a utility function containing public service level and an interregional spatial distance matrix to the basic model. In this model, to link the theoretical model to China’s actual situation, each region’s economic development level is represented by wage and income, geographic advantages are signified by heterogeneous numbers of peasants and the influence of policy elements on migration is indicated by its effect on the level of public service, while social network linkages are difficult to quantify directly in this model. Therefore, different from the basic model, the mechanism for migration influences on the urban system is embedded in the model with the above influencing factors of migration, with the basic theoretical framework under the case of 2 regions shown in
Figure 1. The utility level of each region is determined by the consumption of manufacturing goods, agricultural goods and public goods by local workers.
Our starting point is the basic multi-regional NEG model presented in Krugman [
56], which builds a discrete urban system of
n locations/cities and the economy is divided into two sectors of agriculture and manufacturing. Agriculture is assumed to be perfectly competitive under constant returns to scale, while manufacturing is taken to be monopolistic competitive with increasing returns to scale. In the short-run equilibrium, the producers’ profits are all zero, with balanced supply and demand. To consumers, their living expenses equal labor income. Peasants of all regions total
LA and each region’s share of agricultural labor is exogenous, given as
φi, while manufacturing labor is changing in time, meaning workers can migrate among regions. Manufacturing workers of all regions total
LM, with a region
i’s share of manufacturing labor represented by
λi. Choose appropriate units to let
LM =
μ and
LA = 1 −
μ.
Both agricultural and manufacturing workers consume products from other regions under the Samuelson iceberg assumption: when one unit of manufacturing goods travels from region i to region j, only a fraction of 1/Tij arrives. The transportation cost between regions i and j is , among which τ is unit transportation cost and Dij is the distance between regions i and j. Agricultural goods are traded without cost, so peasants of all regions share the same wage. Both the wage of peasants and price of agricultural goods are set to unity, that is, wiA = 1 and piA = 1. wi is defined as the nominal wage of manufacturing workers in region i.
All individuals in this economy, then, are assumed to share a utility function of the form
where
M is the aggregate consumption of manufacturing,
A is the consumption of agricultural goods,
S is the consumption of public goods,
μ refers to the share of expenditure on manufacturing goods and (1 −
μ) refers to the share of expenditure on agricultural goods.
γ denotes the elasticity of the consumers’ utility to local public goods, meaning when the supply of public goods increases by one unit, how much the consumer welfare level will increase. Therefore, a higher value of
γ indicates that consumers are more sensitive to the supply of public goods, i.e. relatively preferring public goods in welfare preference. Dividing the product by
aims to simplify the form of indirect utility function.
To simplify the computation, this model regards public goods as an exogenous variable [
74], then
Qi, the supply of public goods in region
i is also exogenous, manifested as an increasing function of region
i’s share of manufacturing labor—
λi (urban population as city size). In most instances, the higher is the city grade (larger city size), the more exclusive public goods are enjoyed by the local residents. However, the city household registration system determines whether laborers can enjoy public goods, because a higher city grade means a stricter household registration system, which causes more difficulty in obtaining public goods for migrants [
75]. For this reason,
ε, the power exponent of
λi is set to a number less than unity. So
On the premise that the distribution of manufacturing labor is given and laborers cannot migrate among regions in the short-run, by introducing the above formulae into Krugman’s [
56] urban system model (See Fujita, Krugman and Venables [
25] for a full description of the basic model), the following 4 equations in the short-run equilibrium of city spatial pattern are derived.
where
Yi denotes the consumer income of region
i,
Gi denotes region
i’s price index,
Ui signifies region
i’s indirect utility function,
σ signifies the constant elasticity of substitution between any two manufacturing varieties and
piS expresses region
i’s price of public goods.
The long-run equilibrium state of this model focuses on migration, i.e. the state of determines if migration is in a stable state. Due to the nature of migrants pursuing utility maximum, if a region’s utility level is relatively high (higher than the average utility), manufacturing workers will migrate to this region.
Suppose workers will migrate from a region with utility lower than average to another region with utility higher than average, the average utility is defined as:
then the dynamic equation of migration is expressed as:
where
denotes migration speed and (8) indicates that region
i’s net immigration (
dλi) is proportional to region
i’s population size (
λi), as stated by the preference attachment theory of network models. If region
i’s consumer utility is higher than the average utility of all regions, region i becomes a destination region, or vice versa.
Based on China’s national conditions, each city’s population is divided into urban population and rural population [
24], actual city size is measured by urban population and the existence of cities in different sizes produces a complete urban hierarchy. The change of each city size (urban population) is mainly determined by inter-urban migration and rural-urban migration:
where
Pu(
i,
t) denotes city
i’s urban population at a given time
t,
uPu(
i,
t) denotes the population in city
i’s urban area both in the past and at the present,
rPu(
i,
t) denotes the population in city
i’s urban area at the present which used to be in rural areas and
dλi is the immigration from other cities’ urban areas to city
i’s urban area.
α refers to the ratio of immigration from rural areas to city
i’s urban area and
bi refers to city
i’s natural population growth rate. To simplify the computation process,
α is set as a national uniform constant.
In this way, all cities in China can be divided into megalopolises, large cities, medium-sized cities and small cities in terms of city size and the urban growth momentum comes from 2 exogenous variables added here: α (the ratio of immigration from rural areas to city i’s urban area) and bi (natural population growth rate). Therefore, the urban system connotation and urban growth mechanism are embedded into the multiregional population projection model.
The simulation process of city spatial pattern includes two solution procedures: the short-run equilibrium and the long-run equilibrium, shown in
Figure A1 in the
Appendix A. First, assign values to explanatory variables (
λi,
φi,
wi) and other variables (
μ,
σ,
τ,
γ,
ε,
η) and then solve the equations by sequential iterations. The detailed procedures are:
Set the initial values of nominal wages of N regions (wi,0), where the subscripted variable 0 denotes that iterations have not happened;
Plug the variable (wi,0) into Equations (3) and (4) to compute the income (Yi,0) and price index (Gi,0);
Plug the income (Yi,0) and price index (Gi,0) derived by Step (ii) into Equation (5), to solve for the nominal wage (wi,1);
Repeat Steps ii and iii until , then the condition of short-run equilibrium is found, where the subscripted variables “n” and “n + 1” are the numbers of iterations.
Derive region i’s utility (Ui) and the average utility of all regions () from Equations (6) and (7).
Plug Ui and into Equation (8) to solve for the distribution of manufacturing laborers among regions (λi), until , then the condition of long-run equilibrium is found.
When these two judging conditions are met, the distribution of manufacturing laborers among regions (λi) in the equilibrium state is obtained; the solution process terminates only when the above steps hold for all regions.
4. Analysis of Simulation Results
Referring to the empirical parameter values of related studies, the parameter values in the model are set by repeated testing as μ = 0.4, σ = 5, τ = 1.5, γ = 5, ε = 0.7 and η = 0.5. The initial data is obtained from the China City Statistical Yearbook, where λi is the urban population of each spatial unit at prefecture level in 2000, wi signifies the GDP per capita of each prefecture-level unit in 2000 that better represents a city’s economic development level, the number of peasants φi is obtained by the weight assignment method based on geographic advantages(each region’s number of peasants is proportional to its geographic advantage, the total number of which equals the number of national non-migrating peasants), Dij denotes the geographic distance between 2 prefecture-level units. The geographic advantages are obtained by assigning values to each province according to the topographic, temperature, wet and dry climate zones to which it belongs and summarize them to obtain the score. The geographic advantage score of each prefecture is the same as each province to which it belongs: the first ladder in the topographic zone is assigned a value of 1, the second ladder of 2 and the third ladder of 3; the plateau climate and cold temperature zones are assigned a value of 0, mid temperature zone of 1, warm temperature zone of 2, subtropical zone of 3 and tropic zone of 4; the arid zone is assigned a value of 0, semi-arid zone of 1, semi-humid zone of 2 and humid zone of 3. According to actual needs, the above initial values are normalized or standardized. As shown in Equations (9) and (10), “Pu(i, t) = [λi + rPu(i, t)] * (1 + bi)” demonstrates that city i’s simulated urban population in 2010 (Pu(i, t)) can be derived by the sum of the initial share of workers λi (urban population) and the rural-urban migration rPu(i, t), also taking the population growth rate (bi) into consideration. To make the simulation result closer to the actual situation, the natural population growth rate of each city’s urban area is determined by that of each city from 2009 to 2010 and the natural population growth rate of each city’s rural area is determined by that of national rural area from 2009 to 2010, both of which come from the 6th national population census data in 2010. This study focuses on the urban system measured by urban population, so the rural population growth rate is simplified with a national index, due to the lack of data of rural population growth rate of each city. After multiple experiments and repeated modifications of the model and simulation program, the final simulation results show that the model fitting precision is high enough to pass the test. The simulation results will be compared with actual situations in terms of the model fit, intercity migration and hierarchical structure of the urban system.
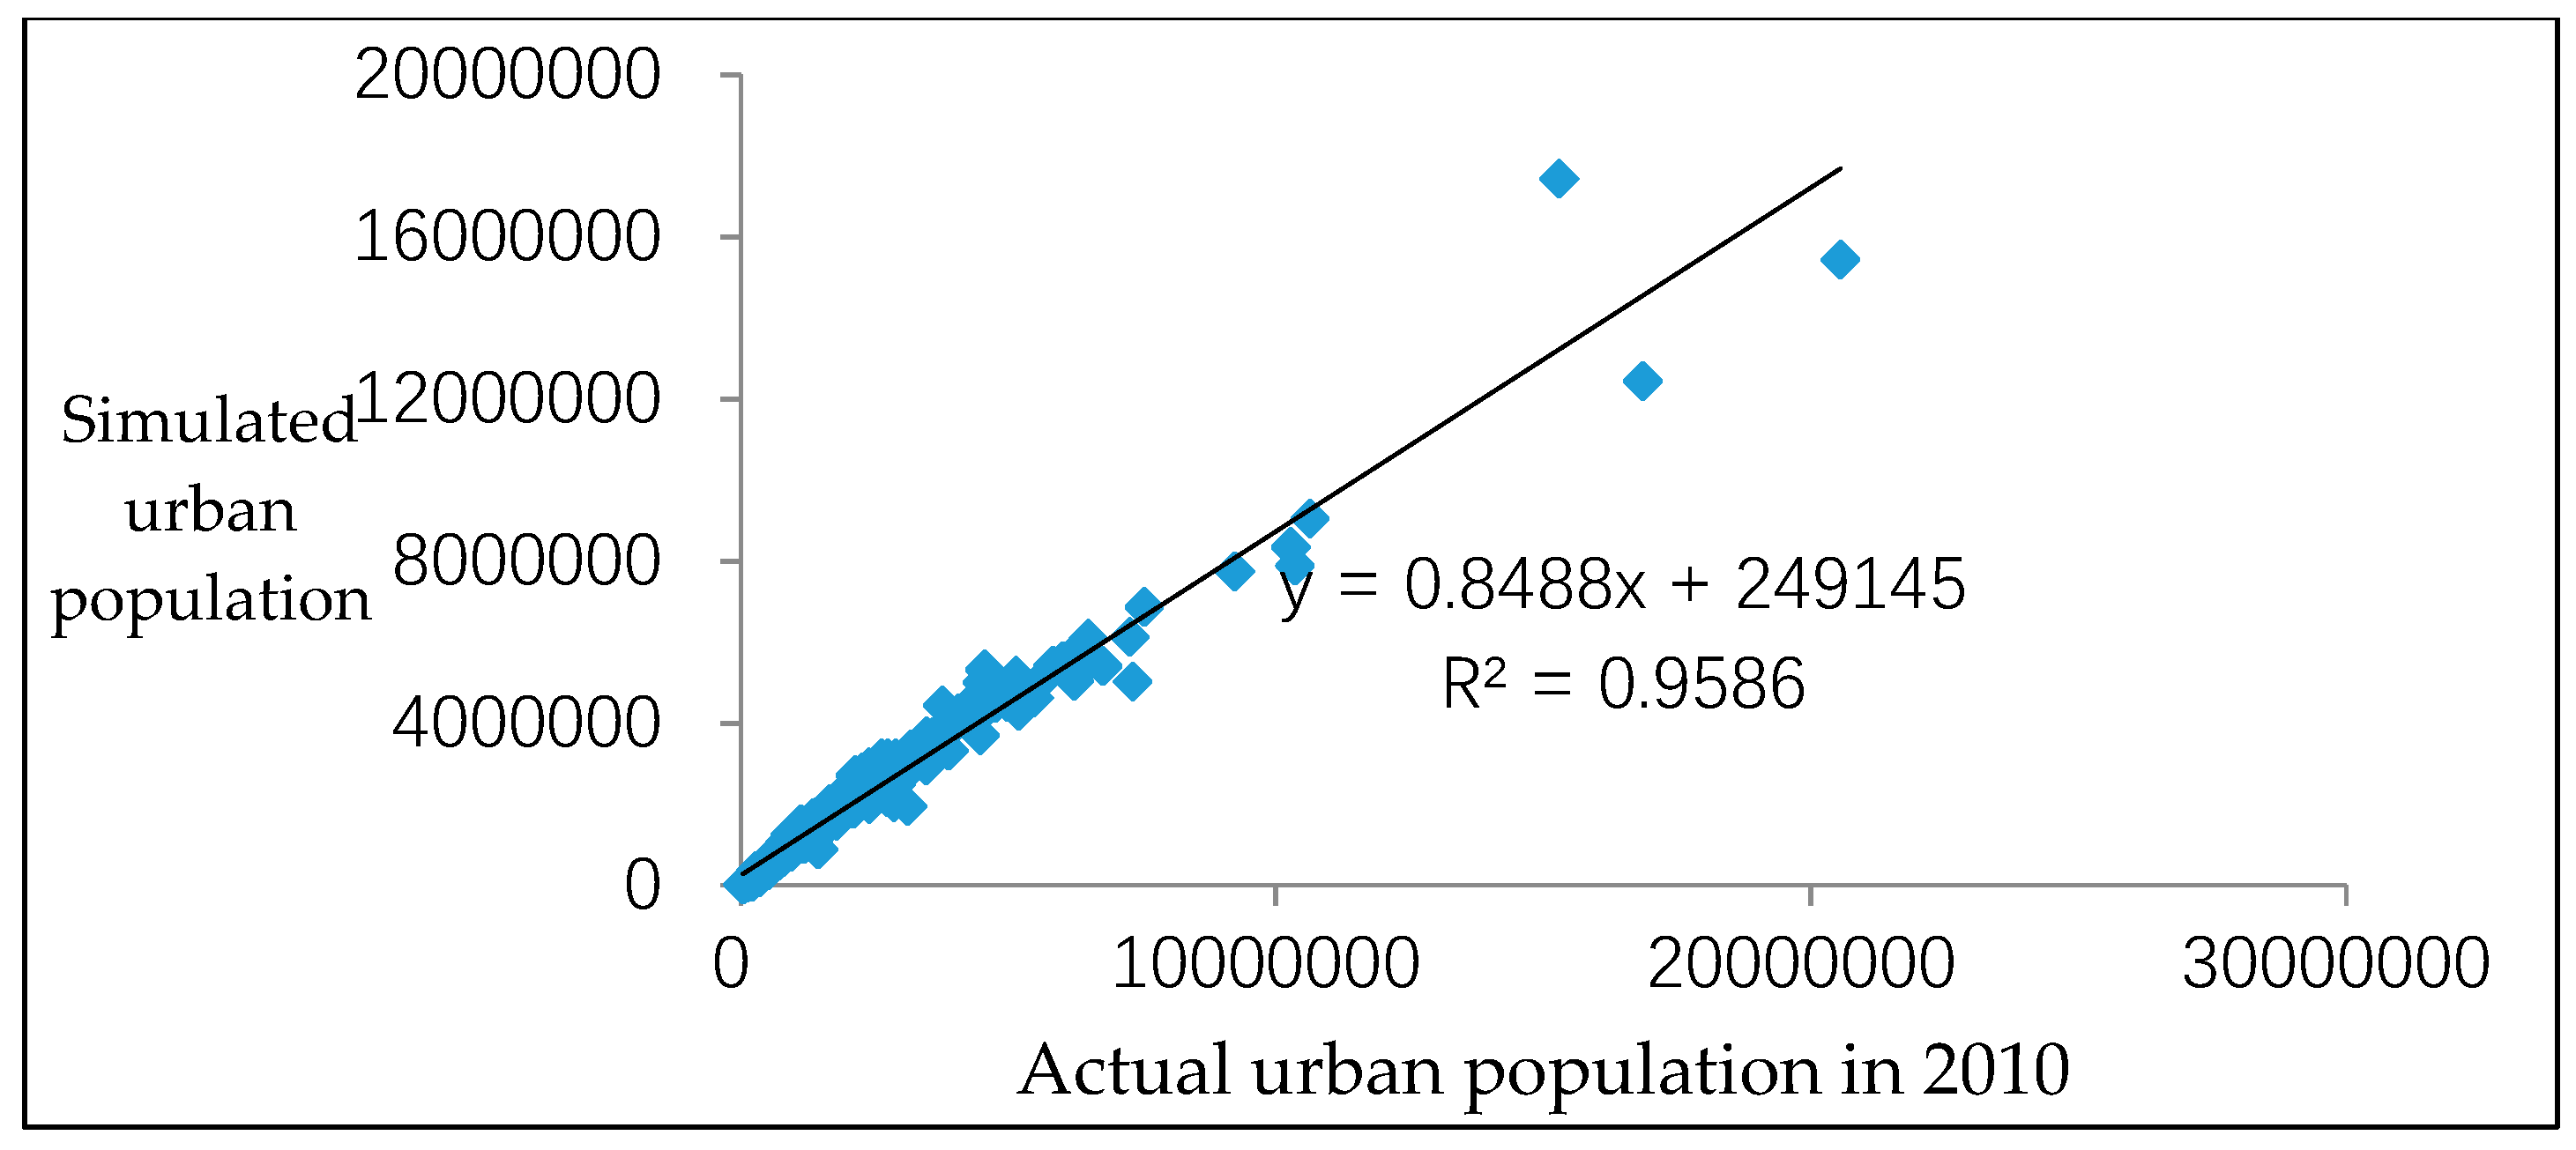
4.1. Model Fit
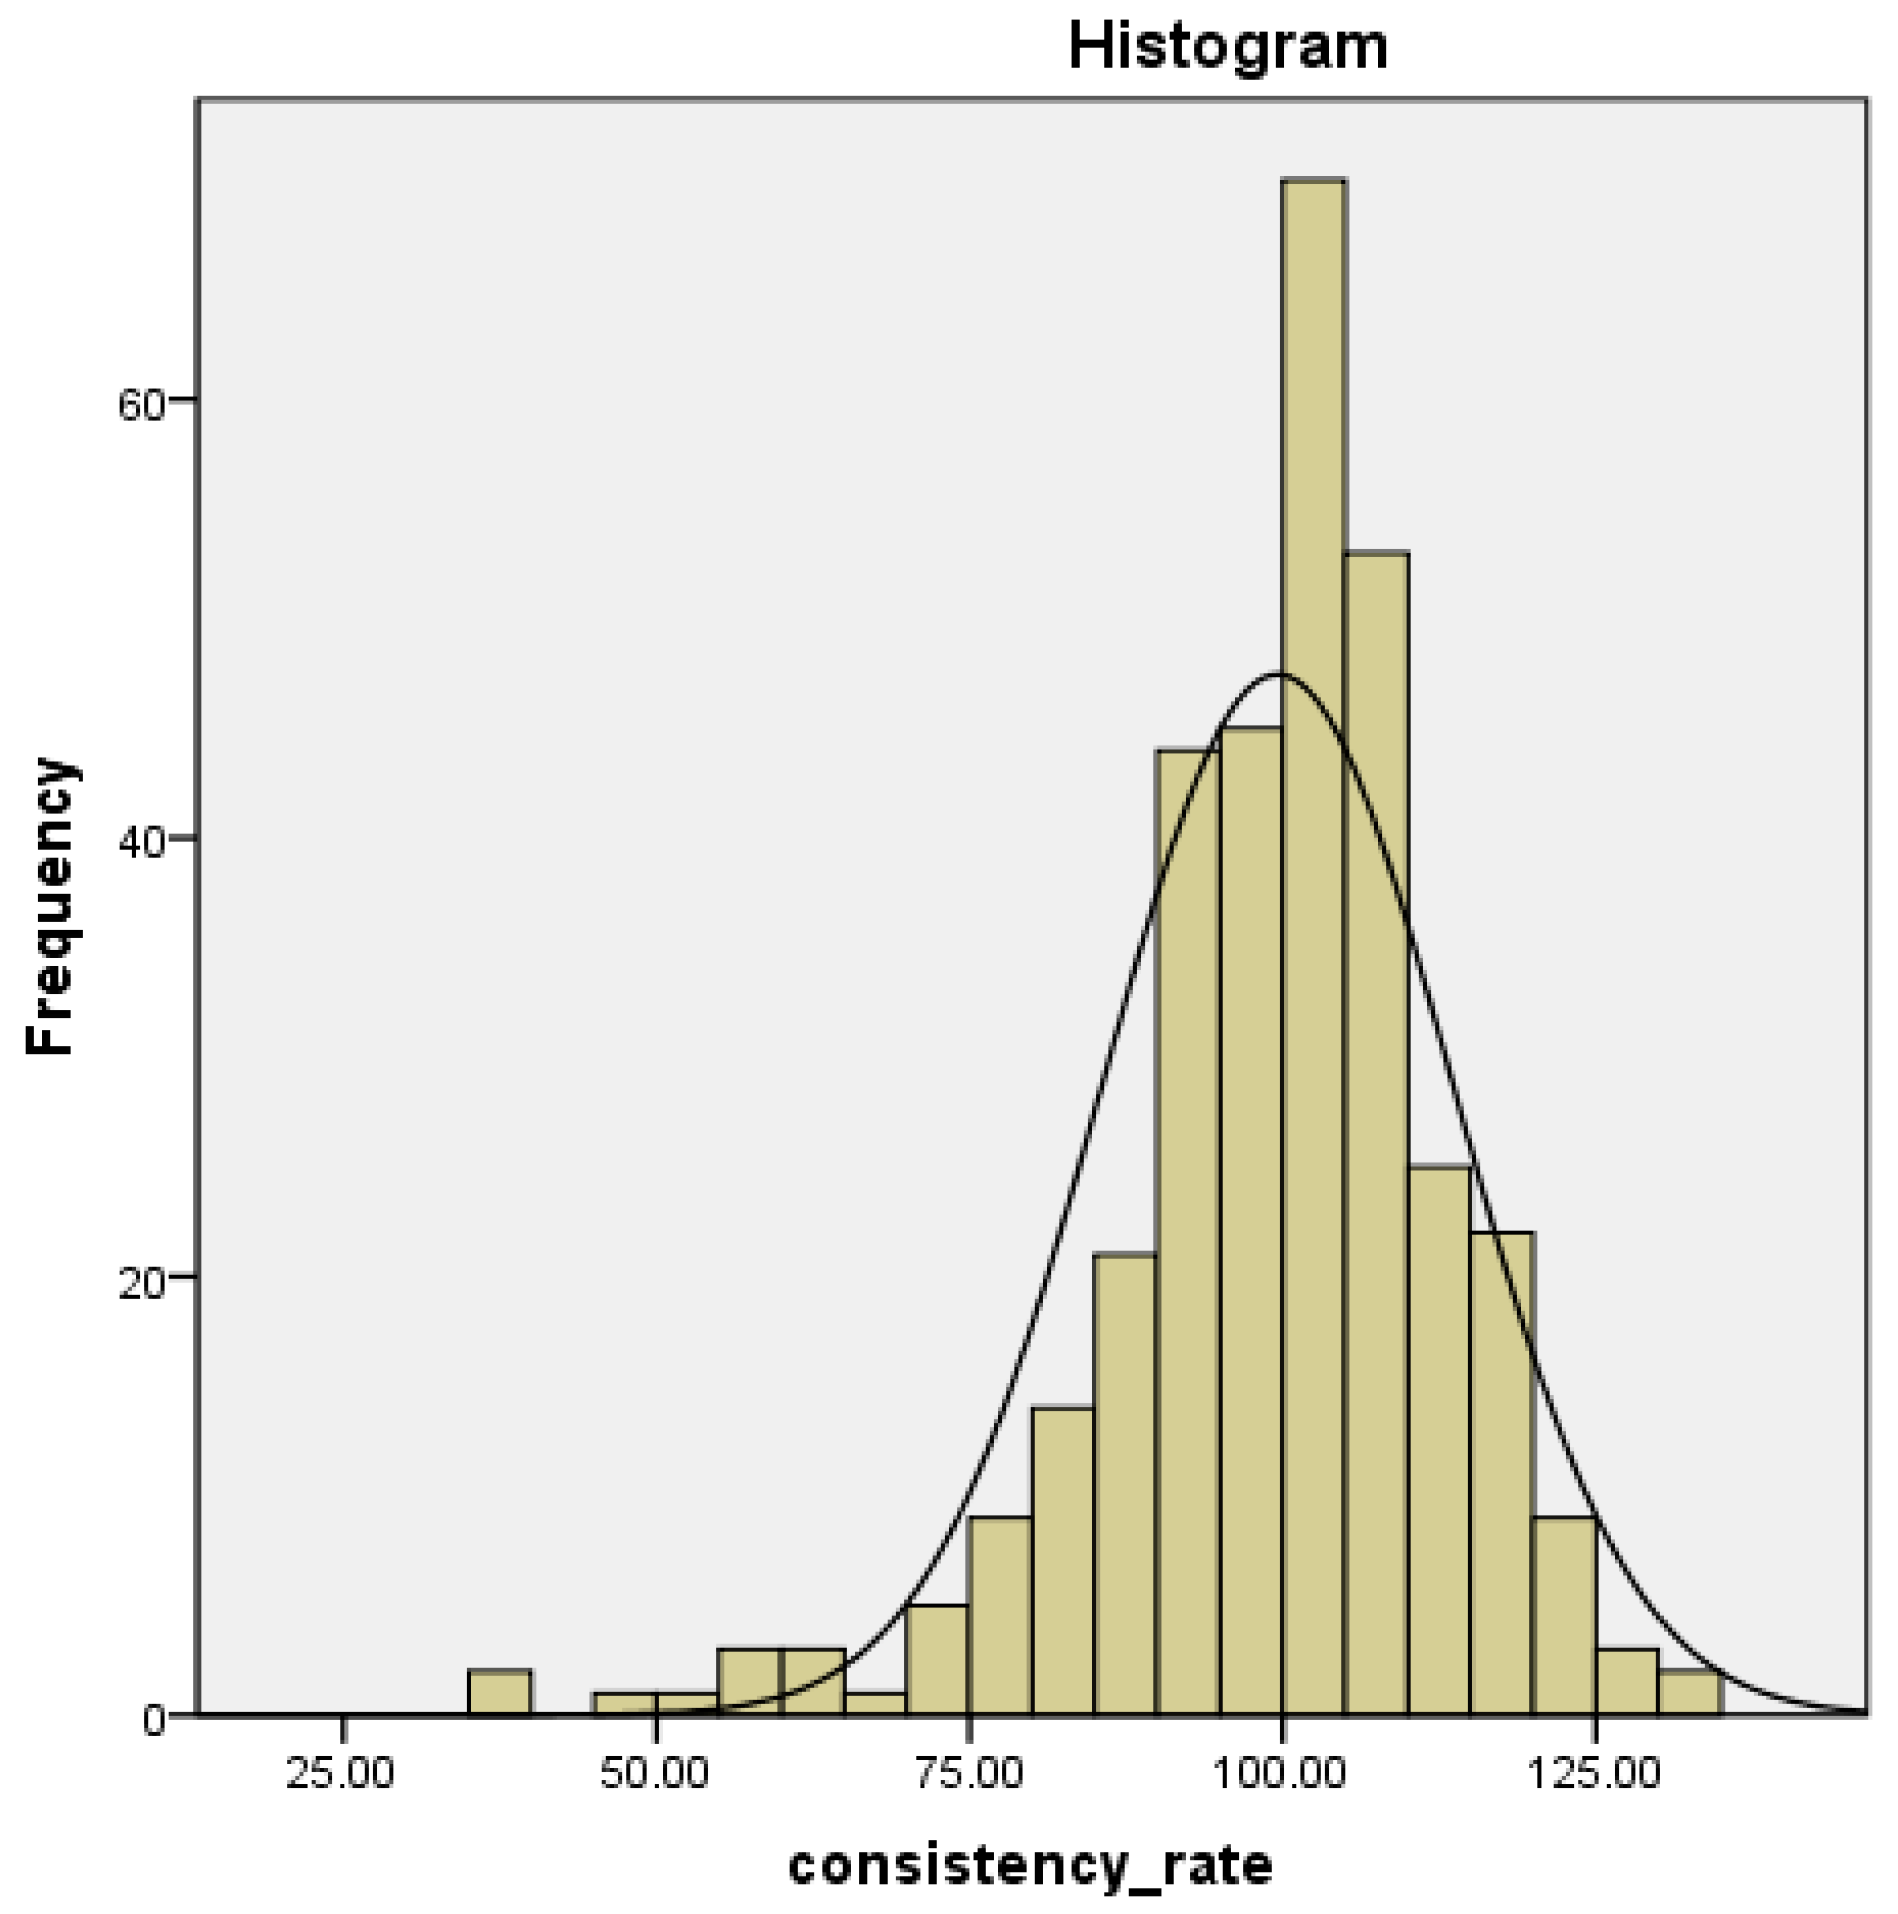
The model fit is expressed as the ratio of the simulated value to the actual value (consistency rate), which implies a relatively high fit: its average, median, minimum, maximum and standard deviation values are 99.58%, 101.62%, 38.74%, 134.10% and 14.00% respectively. As shown in
Figure A2, the fit presents a roughly normal distribution around the consistency rate 100% and most simulated values are in close proximity to their actual values (between 75% and 125%).
Furthermore, the actual population is positively correlated with the simulated population, with a coefficient of determination of 0.9586 in
Figure A3, which also indicates that the simulation results are very close to actual data.
4.2. Comparison between the Actual and Simulated Results of Intercity Migration
There is a significant Pearson correlation coefficient of 0.699 (
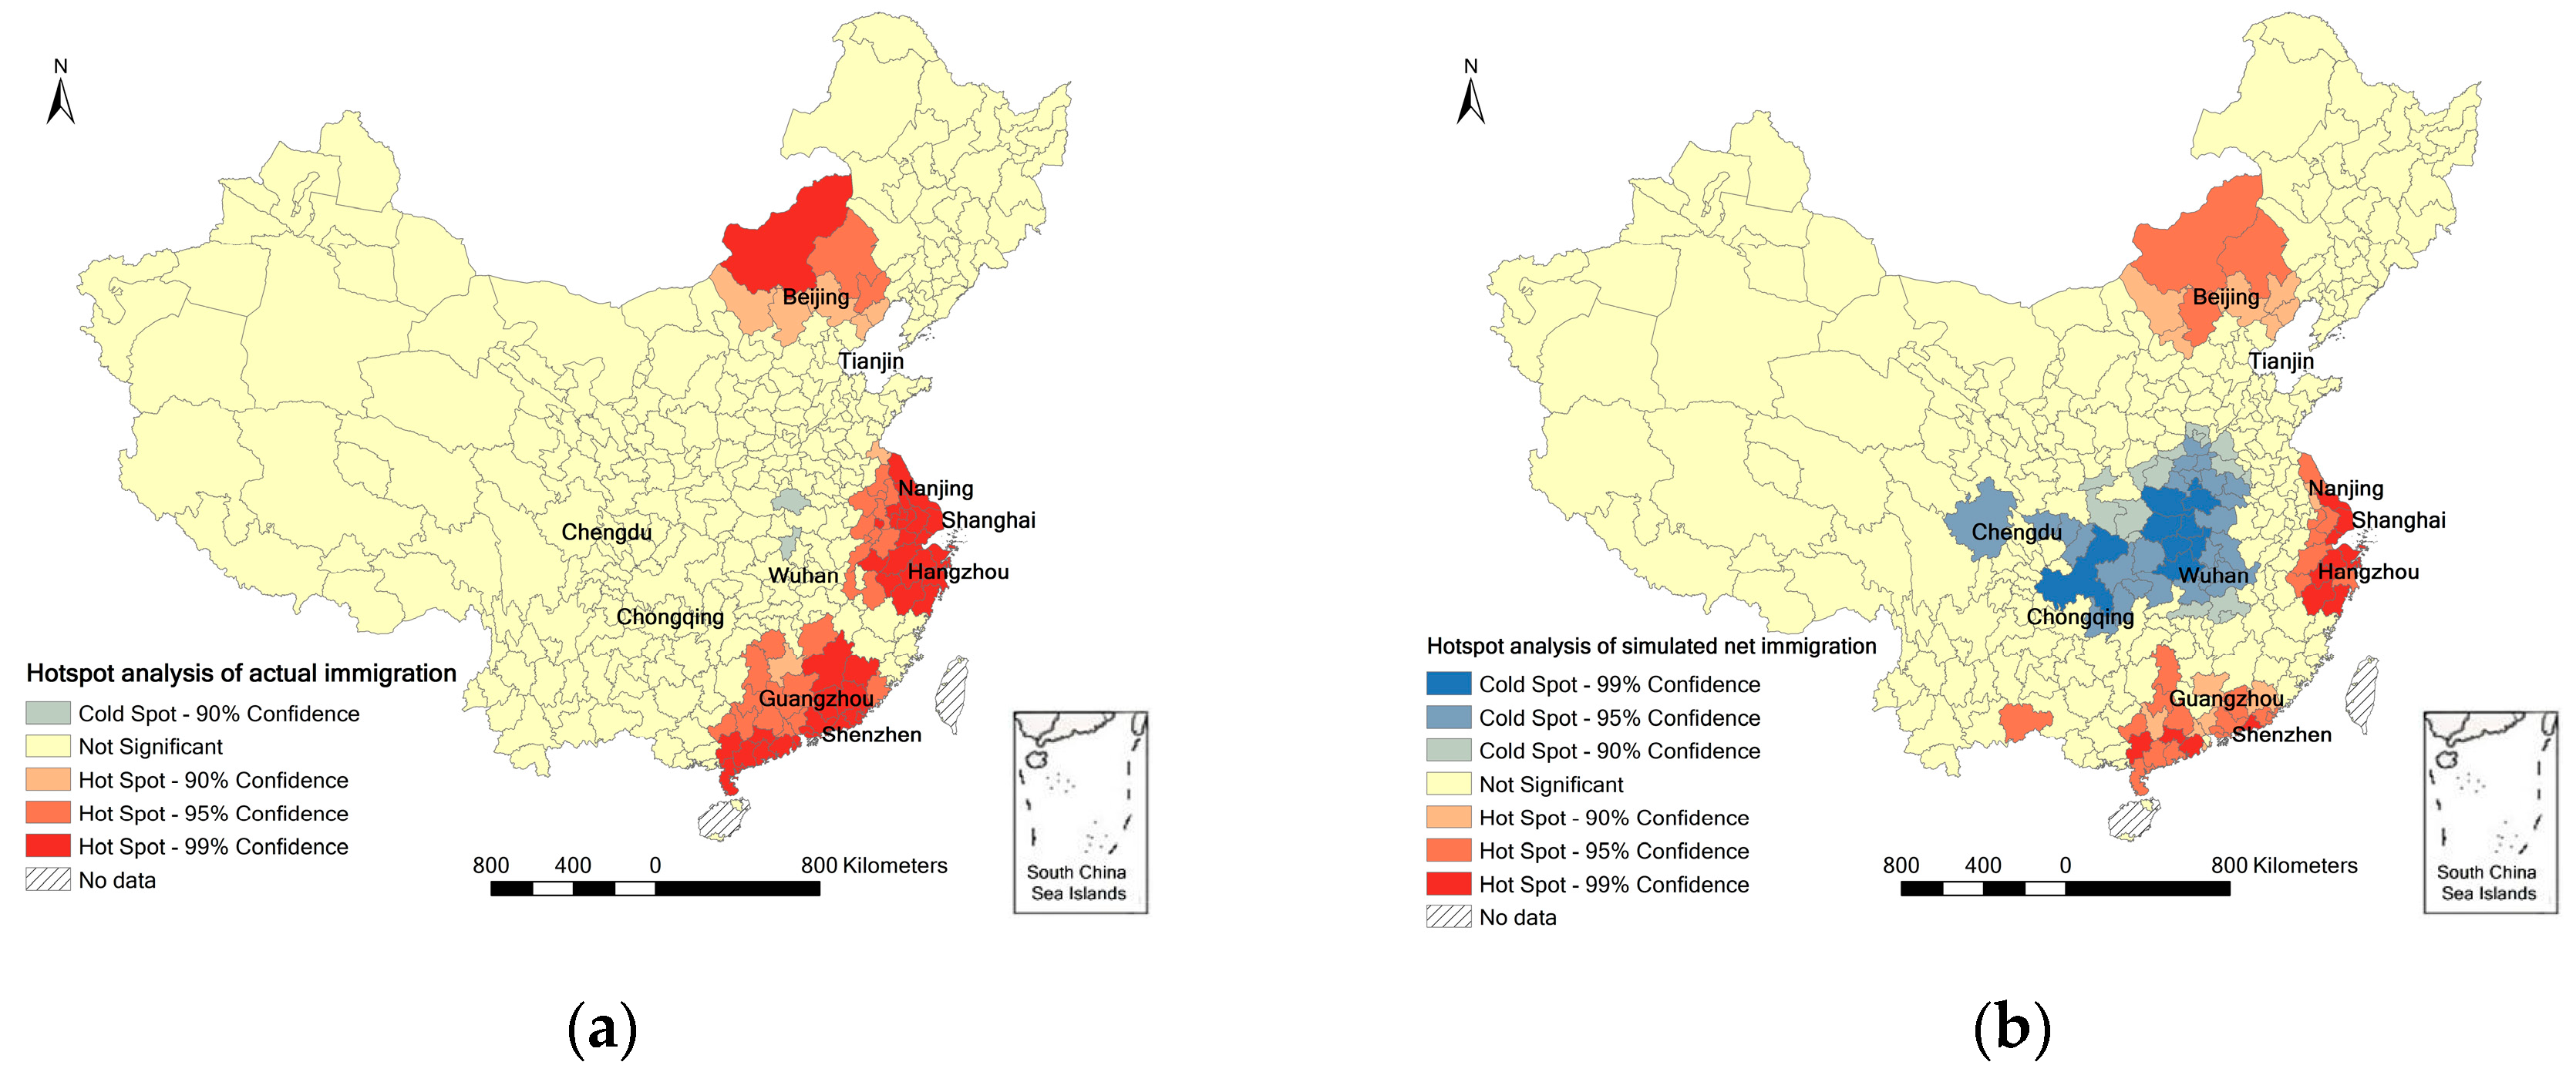
p-value = 0.01) between the simulated net immigration and actual immigration. Furthermore, the results of spatial autocorrelation analysis and hotspot analysis can be corroborative evidence. Moran’s I of actual immigration is 0.122086 at a significance level of 0.000 and Moran’s I of simulated net immigration is 0.071839 at a significance level of 0.000, meaning that both of them present a similar spatial agglomeration pattern with positive spatial correlation. The result of hotspot analysis shown in
Figure 2 also shows that the spatial agglomeration pattern of the actual immigration is similar to that of the simulated net immigration, with the core cities of the Beijing-Tianjin-Hebei Region, Yangtze River Delta Region, Pearl River Delta Region as main concentration areas of immigration (hot spot regions) and the central regions as main areas of emigration (cold spot regions).
4.3. Comparison between the Actual and Simulated Results of the Urban System
In general, the simulated urban system of 2010 is consistent with the real situation in the following respects:
- (1)
The hierarchical structure of the urban system (
Table A2). At the prefecture level, there exists the smallest number of megalopolises, the largest number of large cities, a relatively smaller number of medium-sized cities and small cities. The number of megalopolises has increased significantly between 2000 and 2010, the number of large cities has also enjoyed fast growth, while the number of medium-sized and small cities has decreased because of their rapid promotion to large cities.
- (2)
Law of the primate city. The city size distribution disobeys the law of the primate city and the primate city Shanghai has a limited effect of agglomeration and radiation. The urban system presents a double-center or multi-center structure, with the urban primacy index declining slightly from 2000 to 2010.
- (3)
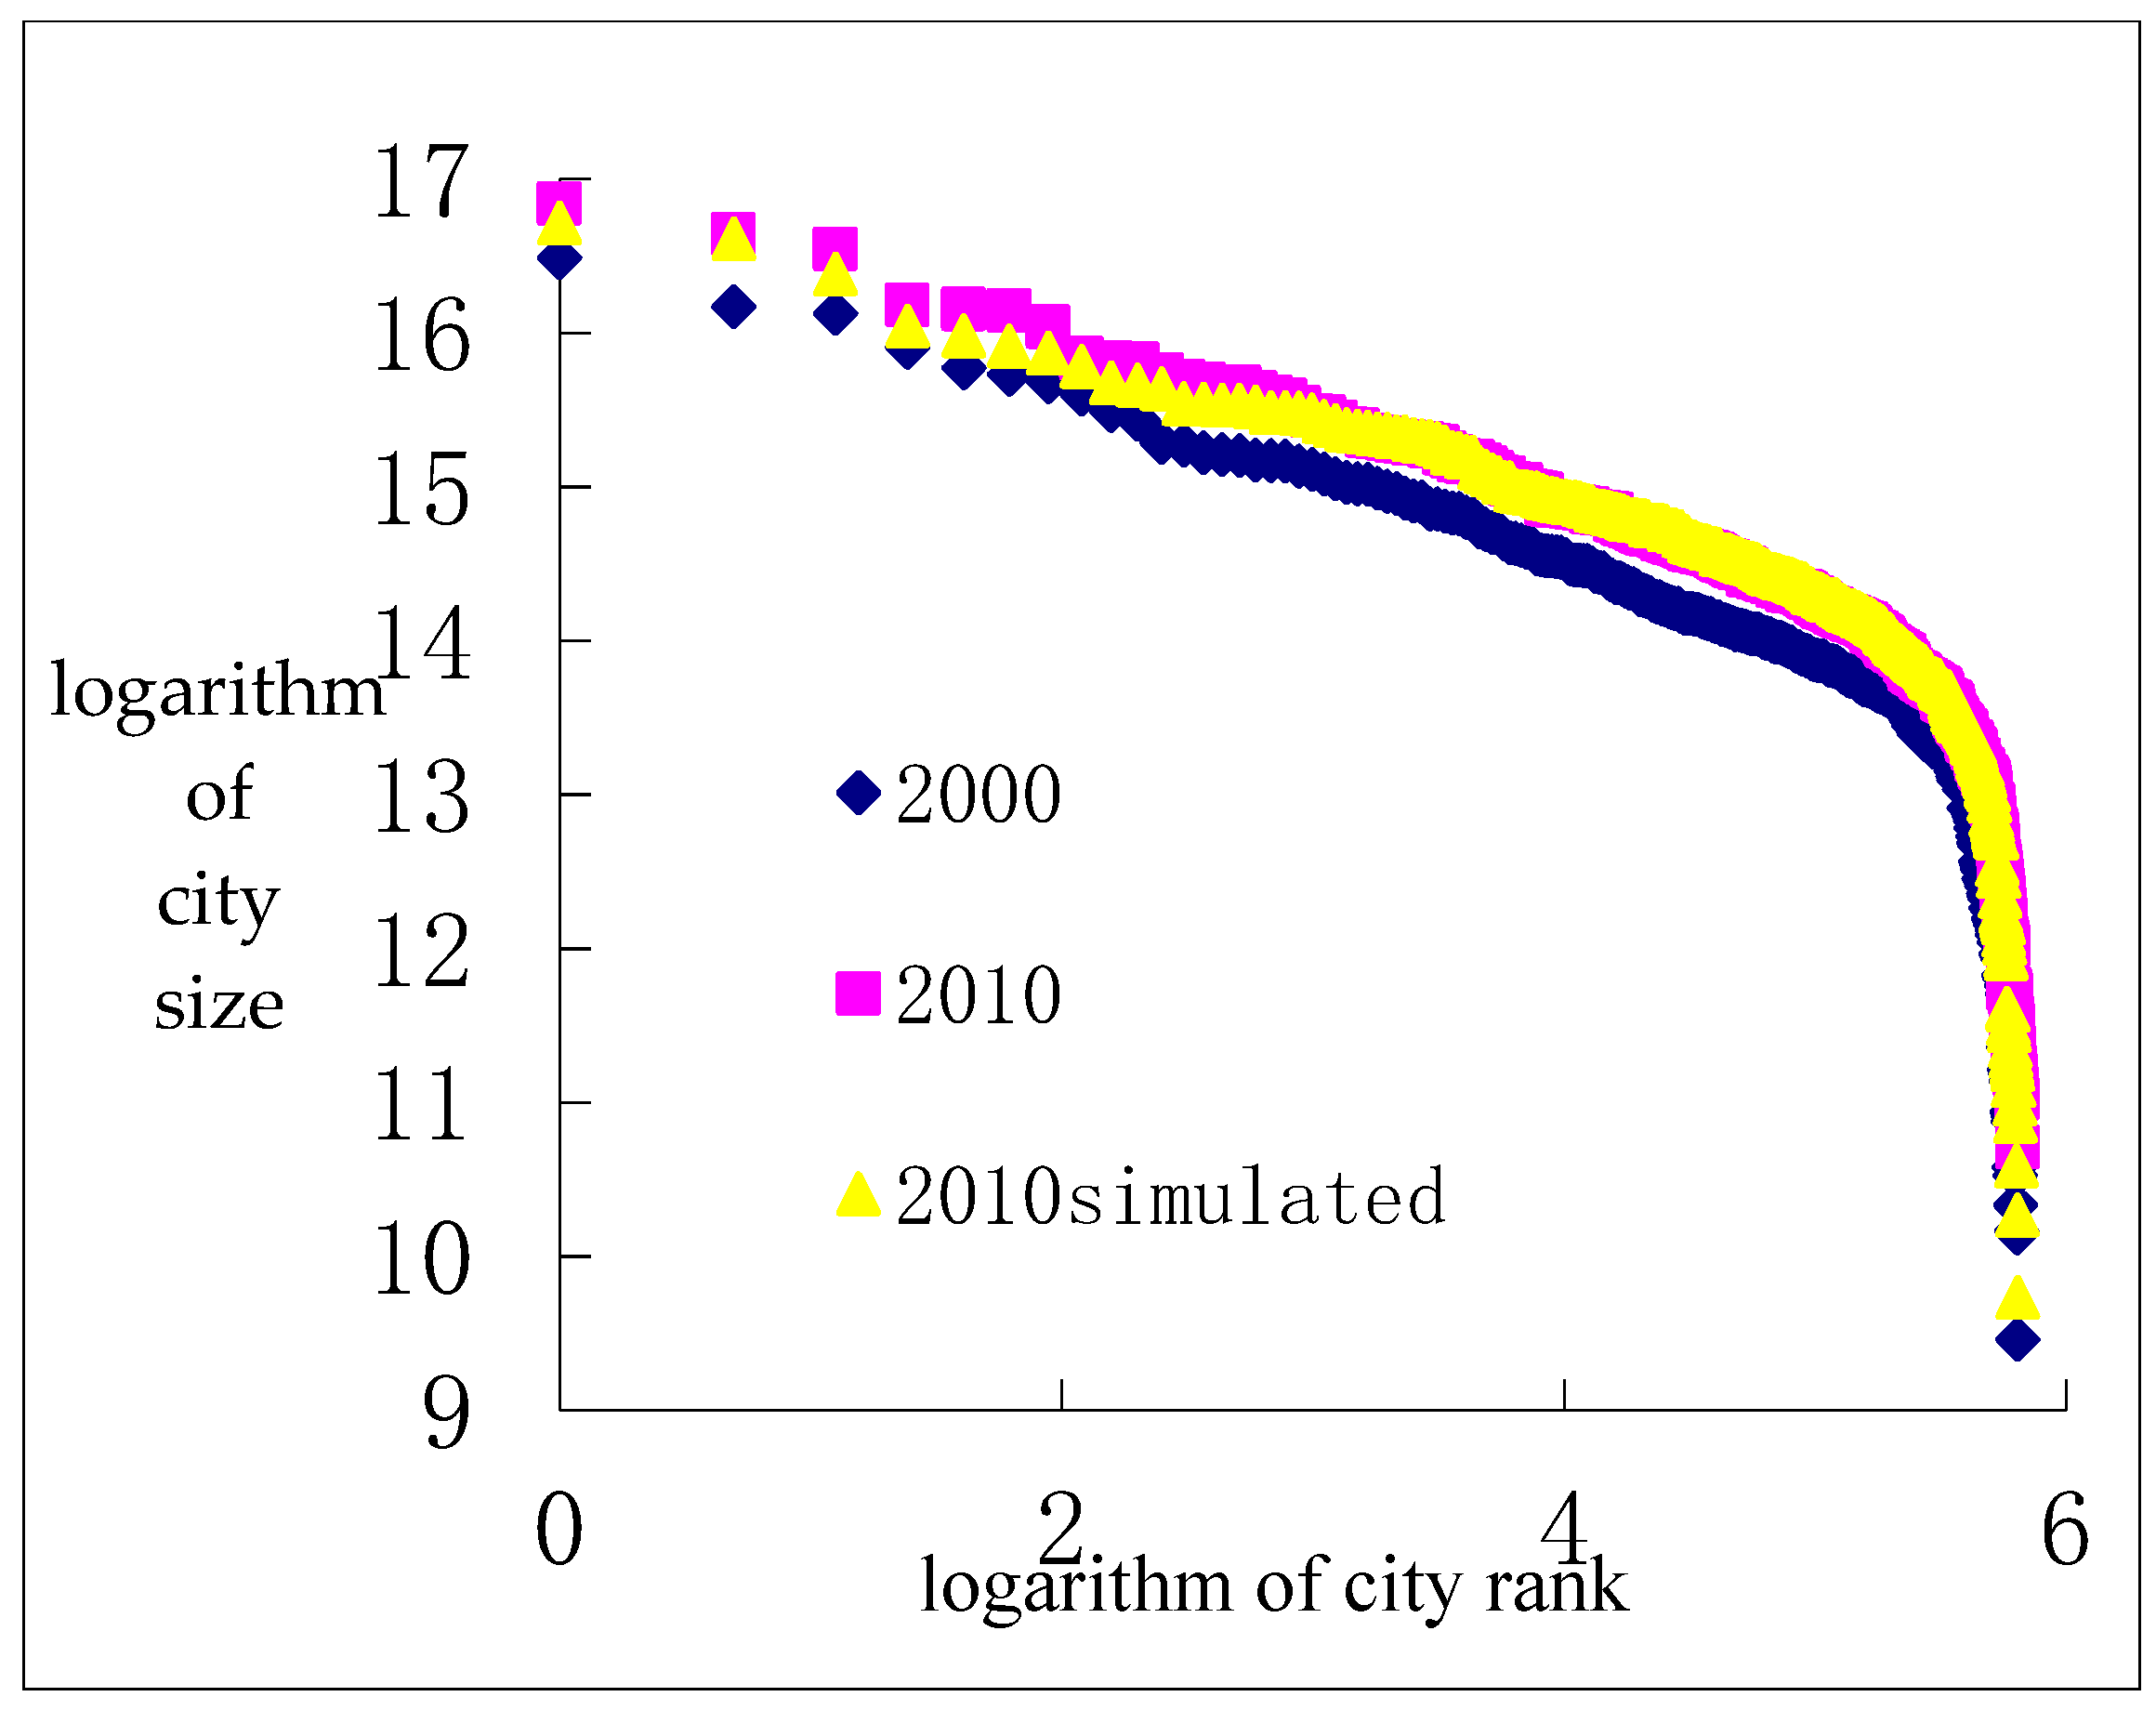
Rank-size distribution of cities. China’s urban system is broadly in line with the rank-size rule and the city-size distribution remains relatively stable with the rank-size curve moving forward in parallel (
Figure A4), implying an incremental total urban population. The balanced degree of the urban system gradually strengthens from 2000 to 2010, which is consistent with the declining trend of the urban primacy index. Theoretically, from the perspective of the rationality of city size structure, high-order cities still have much room for further development.
- (4)
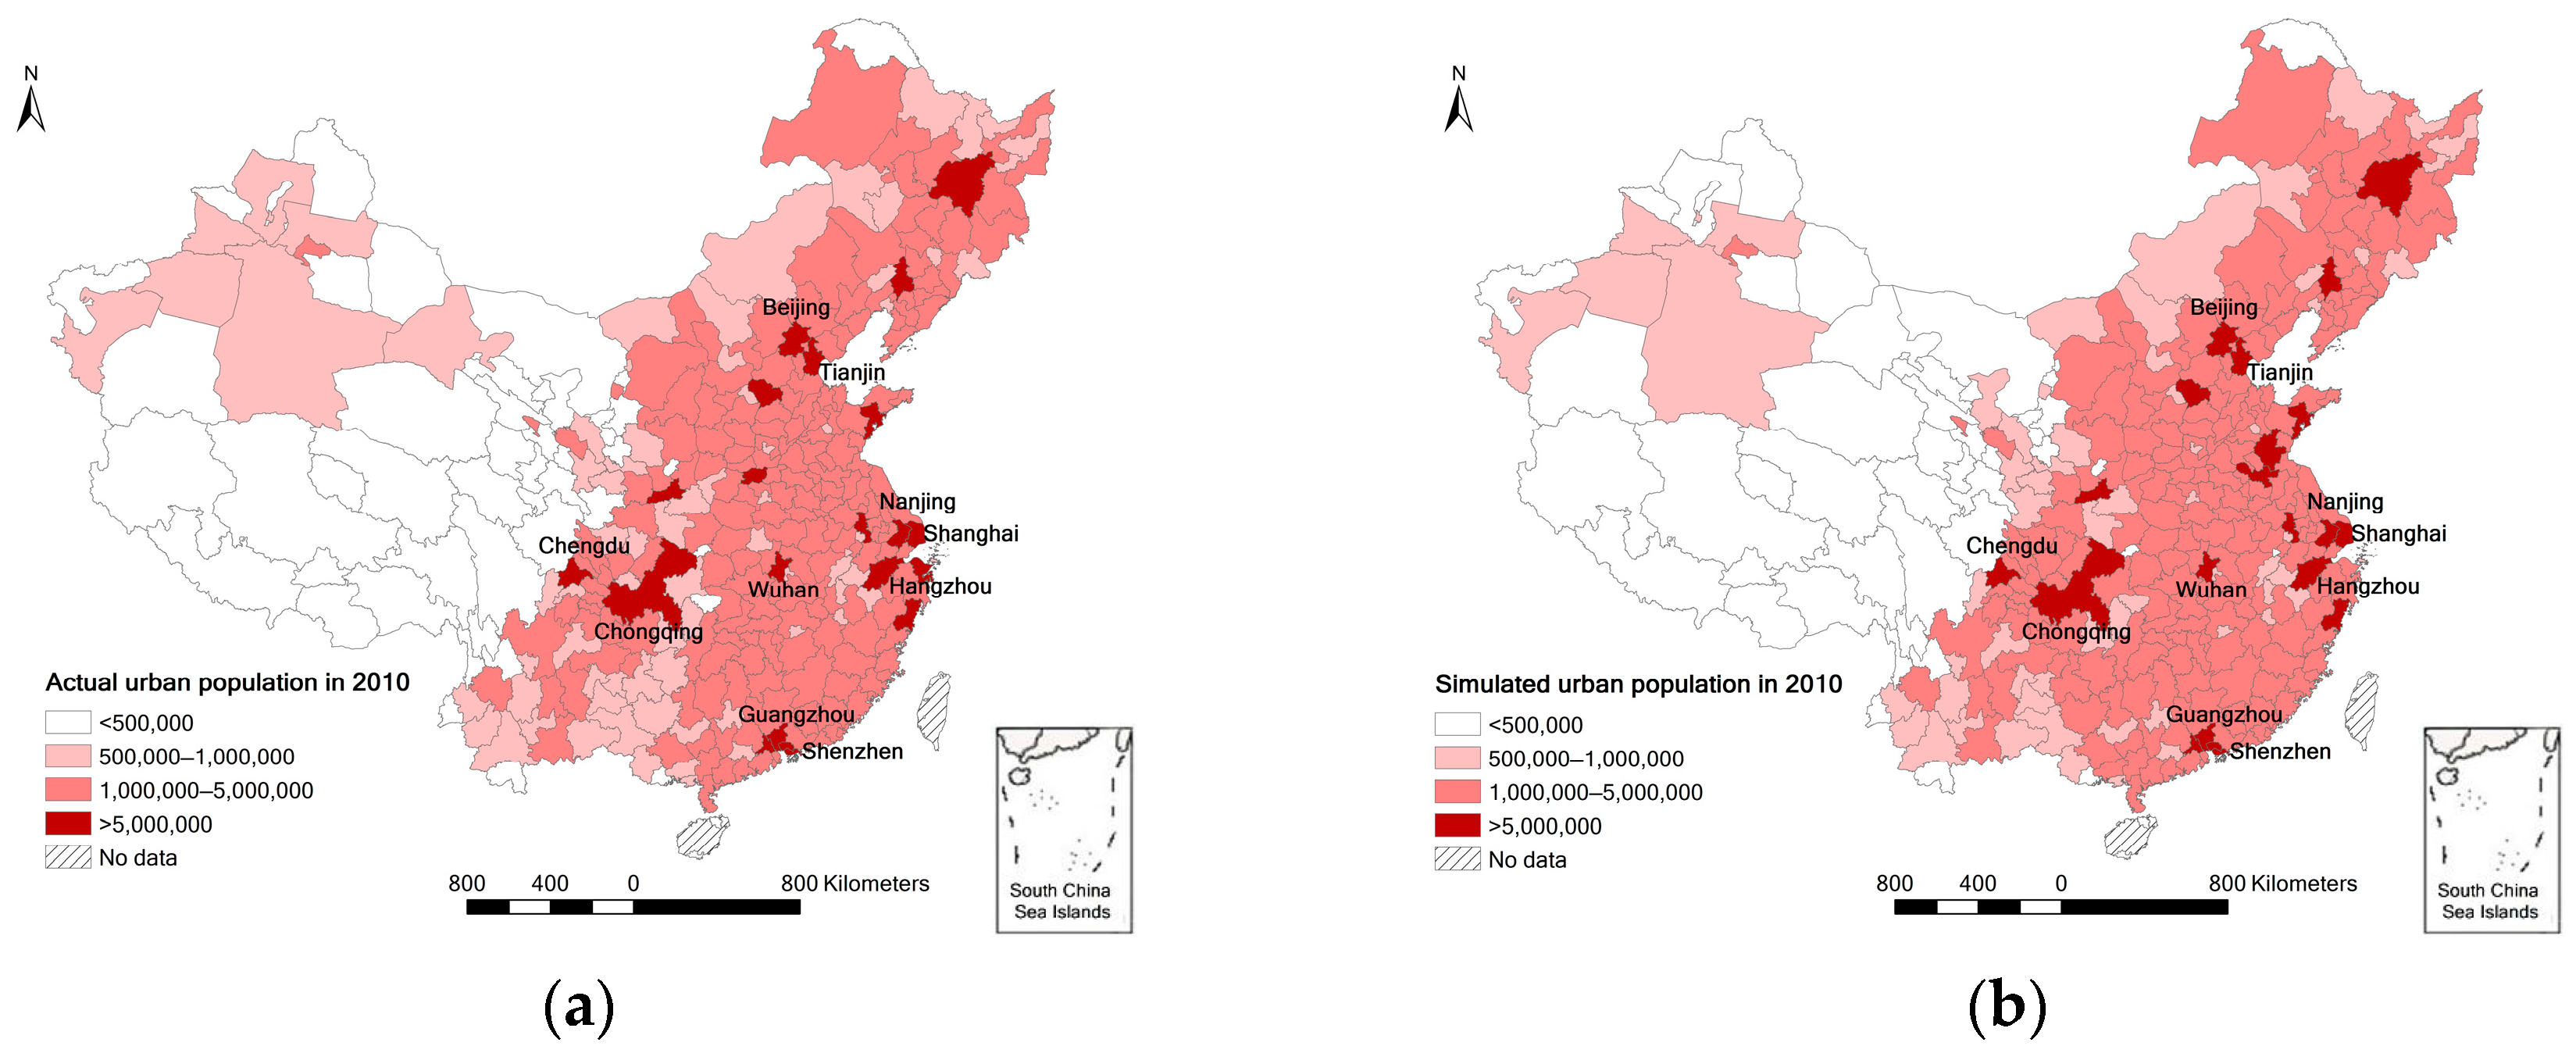
Spatial distribution of city sizes. The spatial differences of city numbers and sizes are significant, especially in the eastern region, which possesses a distinct advantage in terms of city number, city size and the number of large cities and megalopolises, compared with the central and western regions (shown in
Figure 3).
5. Analysis of Prediction Results
As the simulation results indicate a good model fit, which verifies the robustness of the model, the initial data for the prefecture-level units of 2010 are plugged into the theoretical model and the simulation process is used to predict the evolution of China’s urban system by 2020 under different urbanization development scenarios.
According to the objective of urbanization rate reaching 60% by 2020 proposed by the National New-Type Urbanization Planning (2014–2020), we suppose that the urbanization rate in 2020 will be 60%, increased by 10.32% compared with the national urbanization rate in 2010 (49.68%), meaning that 1.42 hundred million rural population migrate to urban area from 2010 to 2020, consistent with the current urbanization trend (the national urbanization rate is 57.35% in 2016). Based on the 1% national population sampling survey data of 2015, the national population is 13.73 billion and the national population in 2020 will be 14.08 billion increasing at the growth rate from 2010 to 2015. The natural growth rate of each city from 2010 to 2020 is also estimated with the natural growth rate of urban and rural areas from 2009 to 2010, due to the limited data accessibility and the relative stability of the natural growth rate in recent years.
5.1. Prediction Results under the Baseline Scenario
This is therefore taken to be the baseline scenario of urban system evolution, that is, the evolution of the urban system in 2020 predicted according to current development trends. As can be seen in
Table 1, the evolution of the urban system (2010–2020) still maintains its original development trend (2000–2010). First, the majority of city levels do not change. Second, there is a dramatic increase in the proportion of megalopolises in terms of both number and city size, with 13 large cities converting to megalopolises raising the city size proportion by 8.19%. Third, the number of large cities rises slightly while the city size proportion decreases. Fourth, although the number and the city size proportions of the small and medium-sized cities diminish, 35 medium-sized cities become large cities while 9 small cities grow into medium-sized cities. The prediction results indicate that the population growth rate of China’s coastal large cities will be well above the national average level and the ratio of population in small and medium-sized cities will decline, in line with the international experience of urbanization [
76]. From the perspective of prefecture-level cities, the evolution of China’s urban system will still be dominated by cities with a population of over 1 million.
In general, assuming that the current trend of urban system evolution remains unchanged, the prediction results depict that the city hierarchical structure and city spatial distribution will stay relatively stable between 2010 and 2020. To be more specific, the sizes of most cities will expand slightly with their city levels unchanged. Only a few cities, especially the large ones, will be upgraded to a higher level. Furthermore, the less populated and undeveloped prefecture-level cities will undergo a sharp decrease in population. These cities either are located in the remote western inland region or cannot provide sufficient employment to attract enough people, hence they may gradually disappear over time.
5.2. Prediction Results under “Dominated by Cities of Different Sizes” Scenario
There is always some disagreement over China’s urbanization development models [
77]. Those advocating a small-city-dominated model emphasize that basic national conditions determine that the process of urbanization in China should be dominated by small cities, which means that the sizes of large cities need to be severely restricted in favor of the development of small and medium-sized cities and small towns. In contrast, theoretical analysis suggests a large-city-dominated model to be more appropriate, placing more emphasis on the phasic rule of prioritizing large cities in the course of urbanization or the agglomeration economic effect of city size. In addition, another model is proposed concerning the coordinated development of cities of different sizes, which attempts to take into account the advantages of both the “large-city-dominated” and the “small-city-dominated” models in accordance with urban system theories. Overall, urbanization development models dominated by cities of different sizes lead to different urban system structures.
Different speeds are set for migration to megalopolises, large cities, medium-sized cities and small cities, to generate different prediction results under the “large-city-dominated” scenario (the net immigration rate of large cities is the highest), the “small-medium-city-dominated” scenario (the net immigration rate of small and medium-sized cities is the highest) and the “coordinated development” scenario (the net immigration rates of cities at all levels are consistent). The results are shown in
Table A3, revealing that the prefecture-level city hierarchical structures remain largely unchanged no matter what kind of urbanization development scenarios is adopted; the size proportions of megalopolises in these three scenarios decline slightly compared with the baseline scenario but they are still higher than that in 2010, reflecting an irreversible natural tendency; and the speed of large cities developing into megalopolises is also much lower than that of small and medium-sized cities converting to large cities.
The size proportions of cities at all levels under the “large-city-dominated” scenario are similar to those of the baseline scenario, except that the size proportion of megalopolises under the “large-city-dominated” scenario is slightly lower, while the size proportion of large cities is a little higher. This demonstrates that the prediction result under the “large-city-dominated” scenario is closest to the natural law of urban system evolution, in which the agglomeration economic effect plays a decisive role, while the other two scenarios are mainly affected by policies. Compared with the other scenarios, it is evident that the speed of small and medium-sized cities developing into large cities is a lot higher under the “small-medium-city-dominated” scenario (42 medium-sized cities becoming large cities), resulting in a larger number (224) and a higher size proportion (61.24%) of large cities. Relatively speaking, the development speeds of cities at all levels under the “coordinated development” scenario (such as the number of medium-sized cities changing into large cities and large cities changing into megalopolises) are between those in the “large-city-dominated” scenario and “small-medium-city-dominated” scenario.
5.3. Prediction Results under “Different Strictness of Household Registration System” Scenario
The provisions of the National New-Type Urbanization Planning (2014–2020) are shown as followings: the limits to household registration in designated towns and small cities should be fully removed, cities with a population of 500 thousand–1 million orderly removed and cities with a population of 1 million–3 million reasonably removed; the requirements for household registration in cities with a population of 3 million–5 million are obliged to be defined rationally, while the population sizes of cities with over 5 million residents have to be rigidly controlled. Different household registration systems, therefore, are supposed to be established in accordance with different city sizes and overall carrying capacities. Under the guidance of the government’s policies, the urbanization scenarios of “releasing all cities”, “releasing small and medium-sized cities” and “limiting megalopolises” in terms of household registration system are designed in the simulations.
The city hierarchical structures in 2020 under “different strictness of household registration system” scenarios, calculated based on the actual data of the prefecture-level units in 2010, are shown in
Table A4. There is a greater size proportion of megalopolises under the “releasing all cities” scenario, while large cities account for a lower proportion, reflecting the aggregation of population towards megalopolises. Besides, small and medium-sized cities develop rapidly under the “releasing small and medium cities” scenario, with 43 cities developing into large cities, giving rise to a greater number and size proportion of large cities. Under the “limiting megalopolises” scenario, the size proportion of megalopolises and the development speed of small and medium-sized cities are between those under the other two scenarios and large cities grow relatively quickly, which causes a greatest number (14) of large cities to become megalopolises.
As can be seen from
Table A4, the different household registration restrictions exert a certain influence on city hierarchical structures. To begin with, under the “releasing all cities” scenario in which all cities’ immigration are not restricted, the population growth of megalopolises is faster from 2010 to 2020 than that of the other two scenarios, resulting from the natural law of China’s internal migration that people tend to migrate to the highest-ranking cities. Meanwhile, the population growth in large cities is more rapid under the “limiting megalopolises” scenario than the corresponding values under the other two scenarios, because of the advantages of large cities over small and medium-sized cities in terms of their scale of economy and population. Finally, small and medium-sized cities have a higher population growth rate under the “releasing small and medium-sized cities” scenario than that under the other two scenarios, due to the restriction on immigration of megalopolises and large cities in that case.
6. Conclusions and Discussion
In response to the comment of Wahnschafft and Wei [
76] that it is hard to accurately predict China’s specific urban morphology in the future, this article builds a theoretical model based on the urban system models of NEG theories from the perspective of migration, intending to improve the prediction accuracy of China’s urban system by explaining how intercity migration affects the urban system evolution. The simulated values of this model using data of China’s prefecture-level units in 2000 are close to actual situation in 2010 with a high fitting accuracy, in terms of each city’s urban population, intercity migration, city hierarchical structure and city spatial distribution, indicating that the model is feasible to predict the future urban system evolution after passing empirical tests.
The following main discoveries are obtained through applying the model to predicting the development of China’s urban system by 2020 under a variety of urbanization scenarios.
- (1)
Under the baseline scenario, the city hierarchical structure and spatial distribution remain relatively stable, with most city sizes expanding slightly in spite of their unchanged city levels. There is a rapid growth in both the number and the size proportion of megalopolises, therefore the evolution of the urban system at prefecture level is still dominated by cities with a population of over 1 million. Small and medium-sized cities also develop rapidly, while less populated and less attractive cities are likely to gradually disappear in the future. To present the prognosis in a more clear way, the top 10 cities enjoying the largest population growth include Shanghai, Chongqing, Beijing, Shenzhen, Guangzhou, Tianjin, Chengdu, Wuhan, Dongguan and Wenzhou, mostly megalopolises, the cities in the second tier with large population growth are mainly provincial capitals and sub-provincial cities, followed by relatively developed cities with large populations mostly in eastern and central regions and small cities in the remote western region (Xinjiang, Xizang and Qinghai Provinces) are supposedly in the list of the shrinking cities.
- (2)
Under the “large-city-dominated” scenario, megalopolises take up the highest size proportion, as this scenario is closest to the natural law of urban system evolution, in which the market mechanism plays a decisive role. Urban systems are mainly affected by policies under the “small-medium-city-dominated” and “coordinated development” scenarios and the high speed of small and medium-sized cities developing into large cities is the most prominent under the “small-medium-city-dominated” scenario, while the results under the “coordinated development” scenario are between those under the “large-city-dominated” scenario and “small-medium-city-dominated” scenario.
- (3)
Population tend to concentrate in high-level cities irrespective of changes in the restrictions on the household registration system, reflecting the lasting agglomeration forces from super cities [
78]. The population growth of megalopolises, large cities, small and medium-sized cities are the fastest respectively under the “releasing all cities”, “limiting megalopolises” and “releasing small and medium-sized cities” scenarios.
- (4)
The simulation and prediction results are essentially consistent with the results of Krugman’s core-periphery model after the introduction of spatial heterogeneity and the construction of city hierarchical structure. This means that, with the continuous enhancement of cohesion, circulation and accumulated effect, regions with first-mover advantage (referring to a larger population) always attract an increasing amount of people and the core areas are gradually strengthened owing to the agglomeration economic effect while, on the contrary, population may decrease sharply in the rural areas around cities and small cities in marginal areas.
As we can see, the future development trend of centralized urbanization predicted by this study (dominated by large cities with a population of above 1 million) is consistent with the main standpoints of the following reports: World Bank [
79] regards the law of scale economy as the basic law of the world economic development, which is clearly supported by our prediction that population tend to concentrate in larger cities, despite adoptions of different urbanization development paths and restrictions in the household registration system of larger cities. According to a recent report released by McKinsey Global Institute (Woetzel et al. [
80]), centralized growth is the optimal solution for China’s urbanization development, hence the urbanization development model dominated by megalopolises is the most economical, stating that targets including the highest per capita GDP, the lowest per capita energy consumption, intensive land use, more efficient public transportation, more powerful pollution control, knowledge spillovers and innovation development, will be achieved with this model. Wang [
81] also points out that the active development of cities with a population of over 1 million will considerably improve economic performance, thus enhancing the speed and quality of economic growth. More importantly, the development of large cities emphasizes not only simply the expansion of existing cities but also the accelerating development of small and medium-sized cities into newer large cities. Conforming to this law of urban system evolution, China’s urban system development should take the path of centralized urbanization pattern, rely on huge urban agglomerations and actively cultivate regional economic growth poles, to form urban agglomeration structures with megalopolises as growth poles, which enjoy a coordinated development of cities at all levels.
What’s more, there exists a mismatch between the trend of population migrating to larger cities and strict household registration system restrictions on megalopolises and large cities. To resolve this conflict, firstly public service equalization among different levels of cities should be enhanced, making sure that most floating population can settle down and share the benefits of economic and social development in cities where they have made great contributions; furthermore, as main destination regions of immigration, the development of large cities and megalopolises should obey the natural law of scale economy to constantly aggregate population and economies, whereas in order to cope with the urban diseases of growing pollution, traffic jams and blistering house price growth, governments should gradually disperse functions (especially industrial functions) of large cities and megalopolises to surrounding cities, rather than simply control the population growth by setting higher entry hurdles for migrants.
Very few studies conduct an overall prediction of China’s national population spatial pattern and city hierarchical structure and the prediction result of this study is roughly identical to research conclusions of Gu [
82] and Deng et al. [
34]: In the predicted urban system in 2020 by Gu [
82], city proportions of large cities with a population of over 1 million will enjoy the largest increase between 2010 and 2020; Deng et al. [
34] predicted that China’s urbanization rate will be 61% in 2020, at that time, eastern coastal developed regions including Beijing, Tianjin, Shanghai, Jiangsu Province, Zhejiang Province and Guangdong Province are considered as net immigration dominated regions with rapid population changes, central regions consisting of Henan, Anhui and Hubei Provinces are deemed as net emigration dominated regions with rapid population changes, most northwestern and northeastern provinces belong to regions with steady population growth.
In contrast with extant studies, this paper establishes a theoretical model to predict the evolution of China’s urban system based on the internal migration network, with the embedded mechanism of how migration influences the urban system, while also expanding the empirical studies of NEG models. In regard with research limitations, further studies are needed to develop the data source to a longer time scale and more micro spatial units, which will also benefit from increasing refined scenarios (such as considering various natural population growth rates, urbanization levels, economic development levels and transportation conditions) in line with China’s recent development trends to improve the ability of the model in terms of prediction accuracy and government decision support; moreover, a systematic sensitivity analysis will make the empirical approach more convincible; to rectify this situation, the methodology based on the integration of GIS technology, scenario approach in urban planning and sensitivity analysis [
83,
84,
85,
86], will represent a useful tool to support decisions on China’s floating population management, public service improvement and urban system planning, which can be integrated into our model in the future research.


