Vegetation Succession on Degraded Sites in the Pomacochas Basin (Amazonas, N Peru)—Ecological Options for Forest Restoration

 ,
,  ,
, 
Abstract
1. Introduction
- (1)
- anthropogenic successional and disturbance levels are crucial input variables for an effective restoration of biocorridors,
- (2)
- geological substrate is a strong driver for plant-site relationships and for habitat variety on the landscape level, and
- (3)
- intact mountain rainforests are strongly determined by intrinsic system-optimized water and nutrient cycles.
2. Materials and Methods
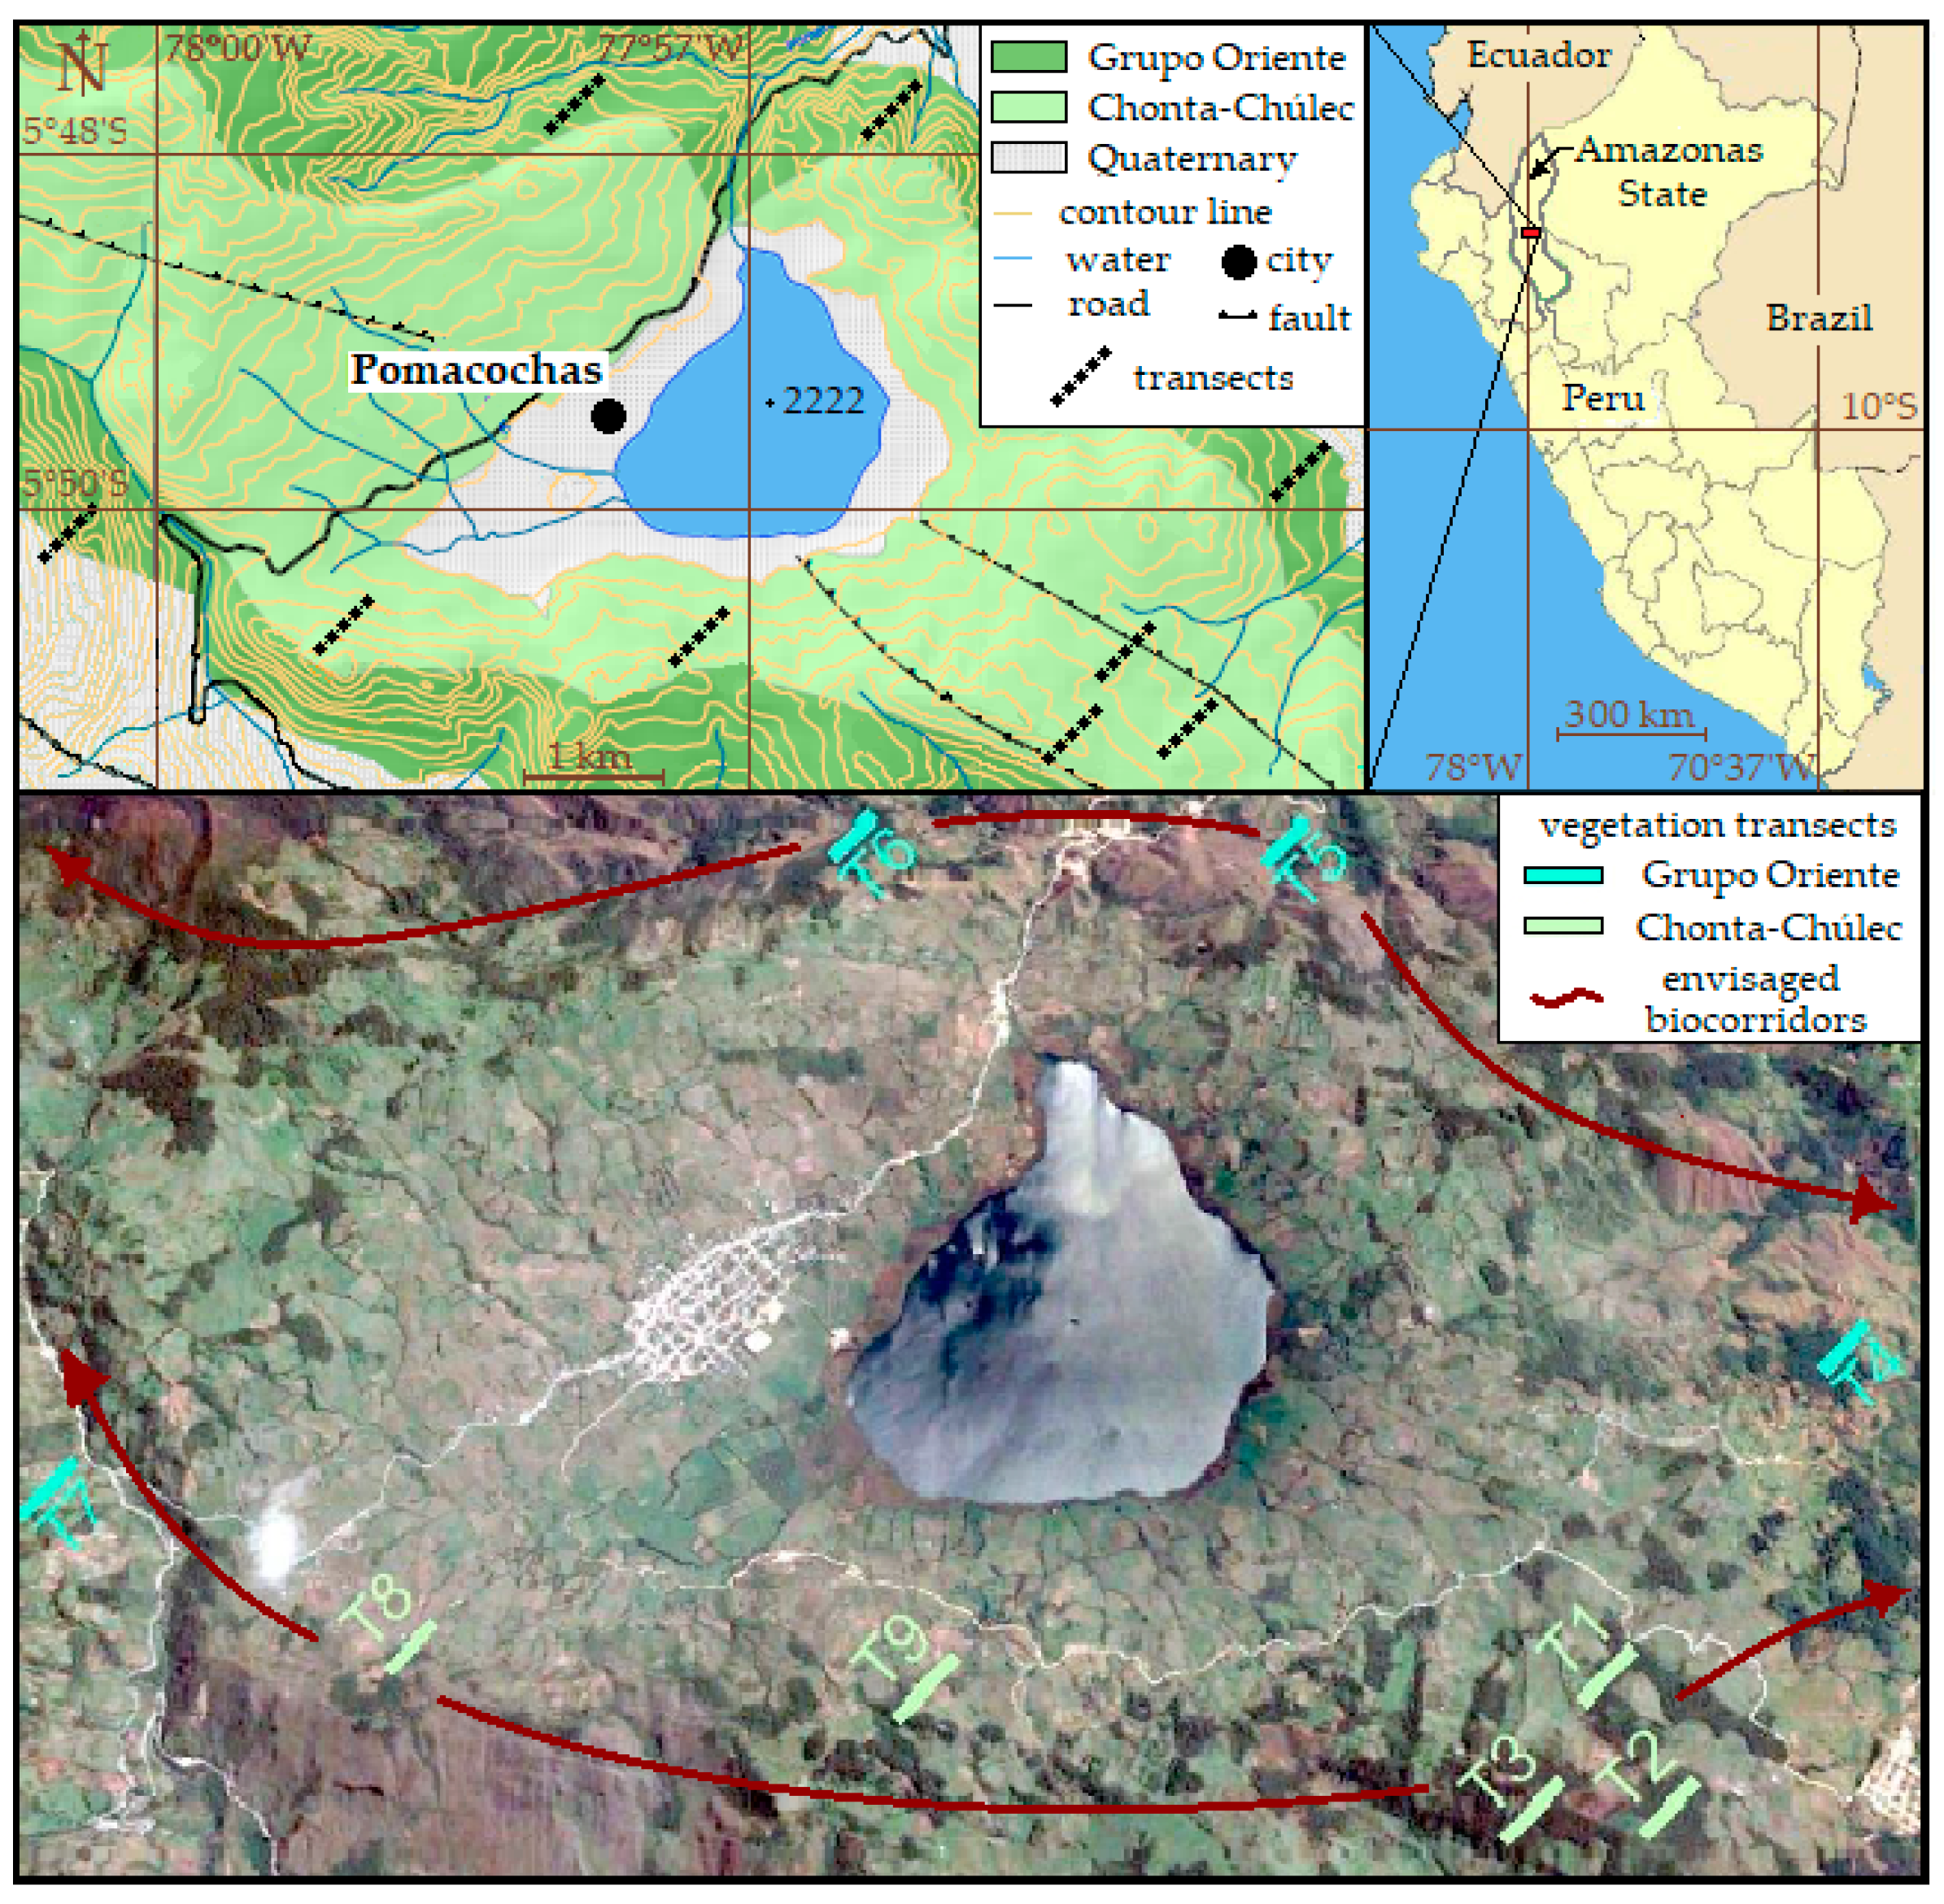
2.1. Study Area
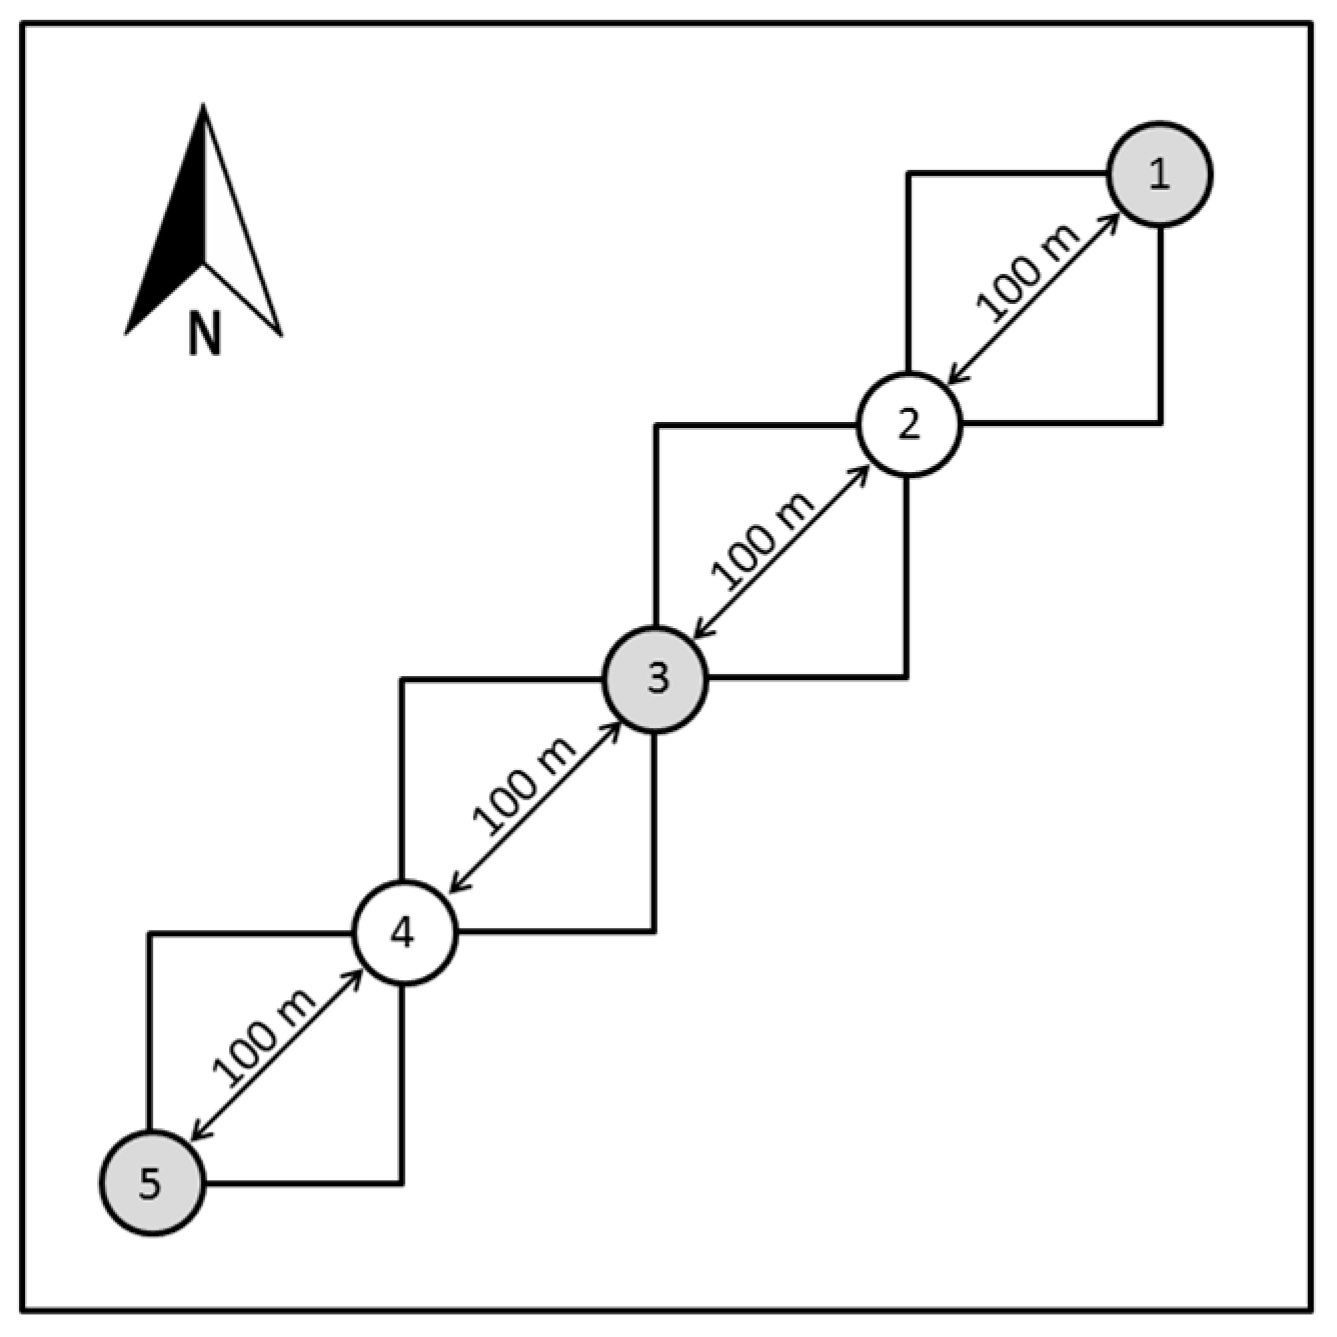
2.2. Soil Sampling
2.3. Vegetation Sampling
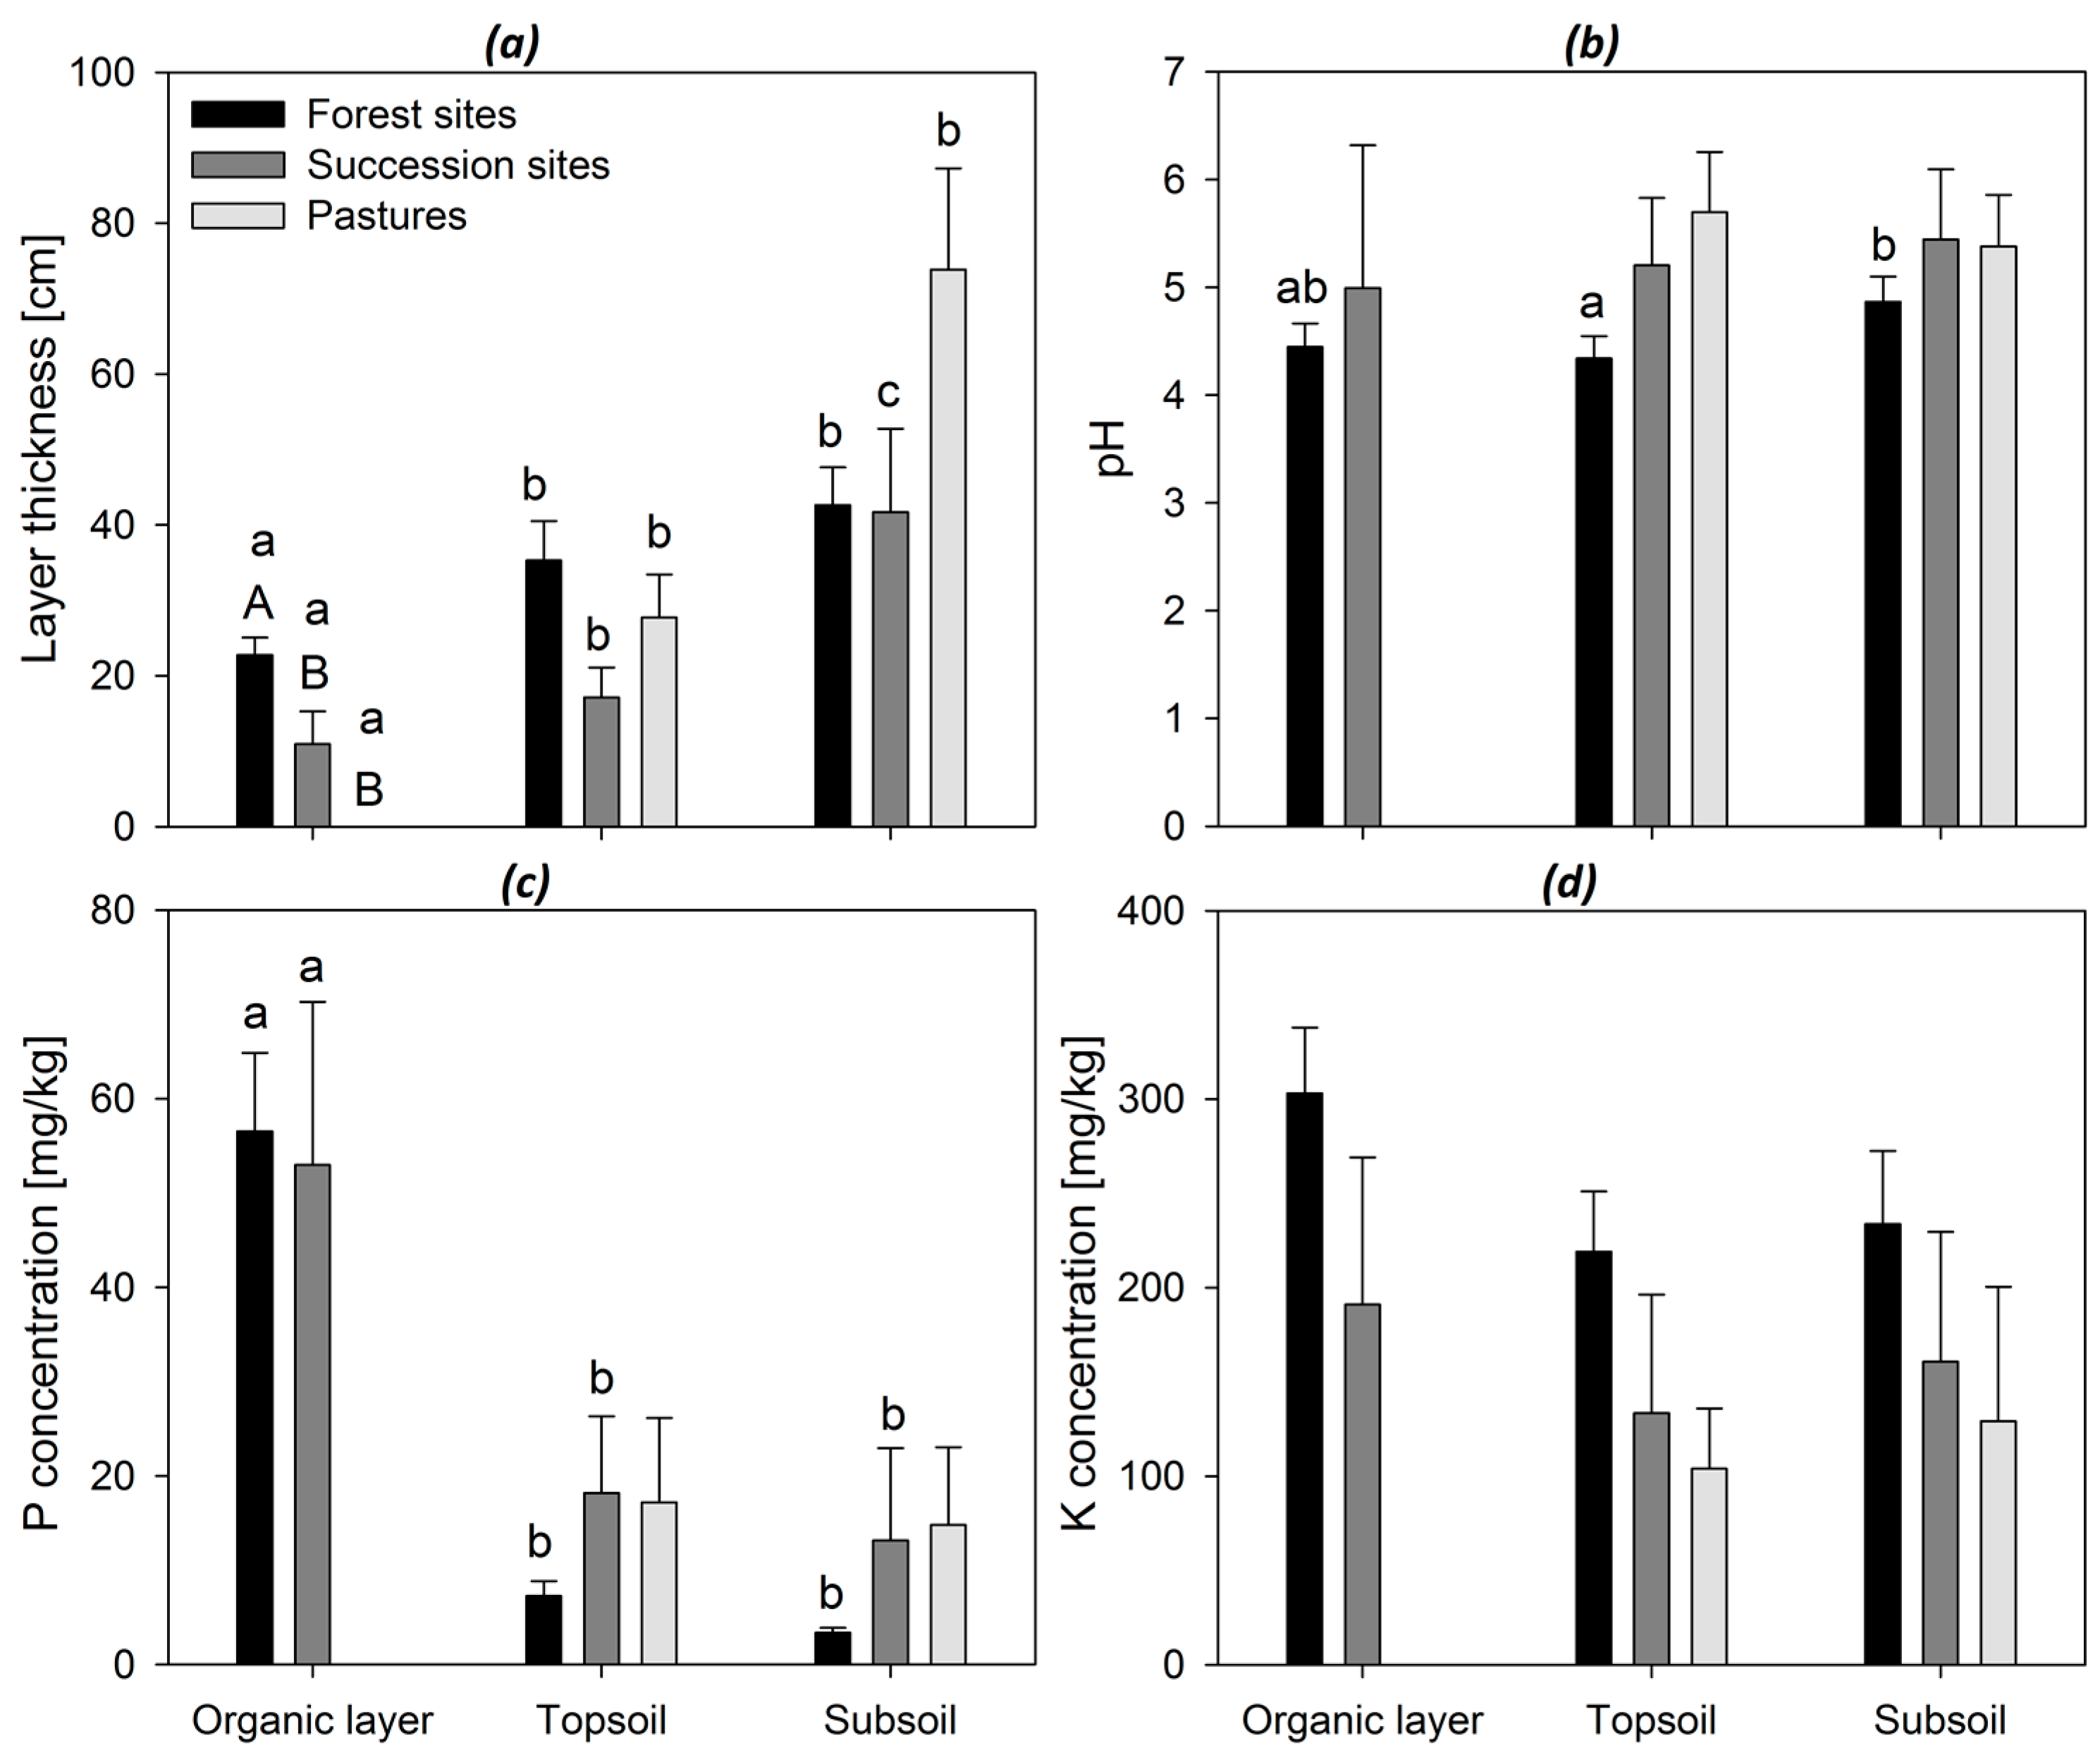
3. Results
4. Discussion
4.1. Anthropogenic Successional and Disturbance Levels Are Crucial Input Variables for an Effective Restoration of Biocorridors
4.2. Geology Is a Strong Driver for Plant-Site Relationships and for Habitat Variety on the Landscape Level
4.3. Intact Mountain Rainforests Are Strongly Determined by Intrinsic System-Optimized Water and Nutrient Cycles
5. Conclusions
- The anthropogenic successional and disturbance levels affect pedogenesis and nutrient cycling. They have significant influence on the achievable forest development type, since woody species have different temporal niches (early successional to late successional stages).
- Soil properties and their relationships with underlying geological substrates determine the achievable forest-development type, as there are different site-plant relationships (e.g., calcifuge species; frugal species or more demanding species).
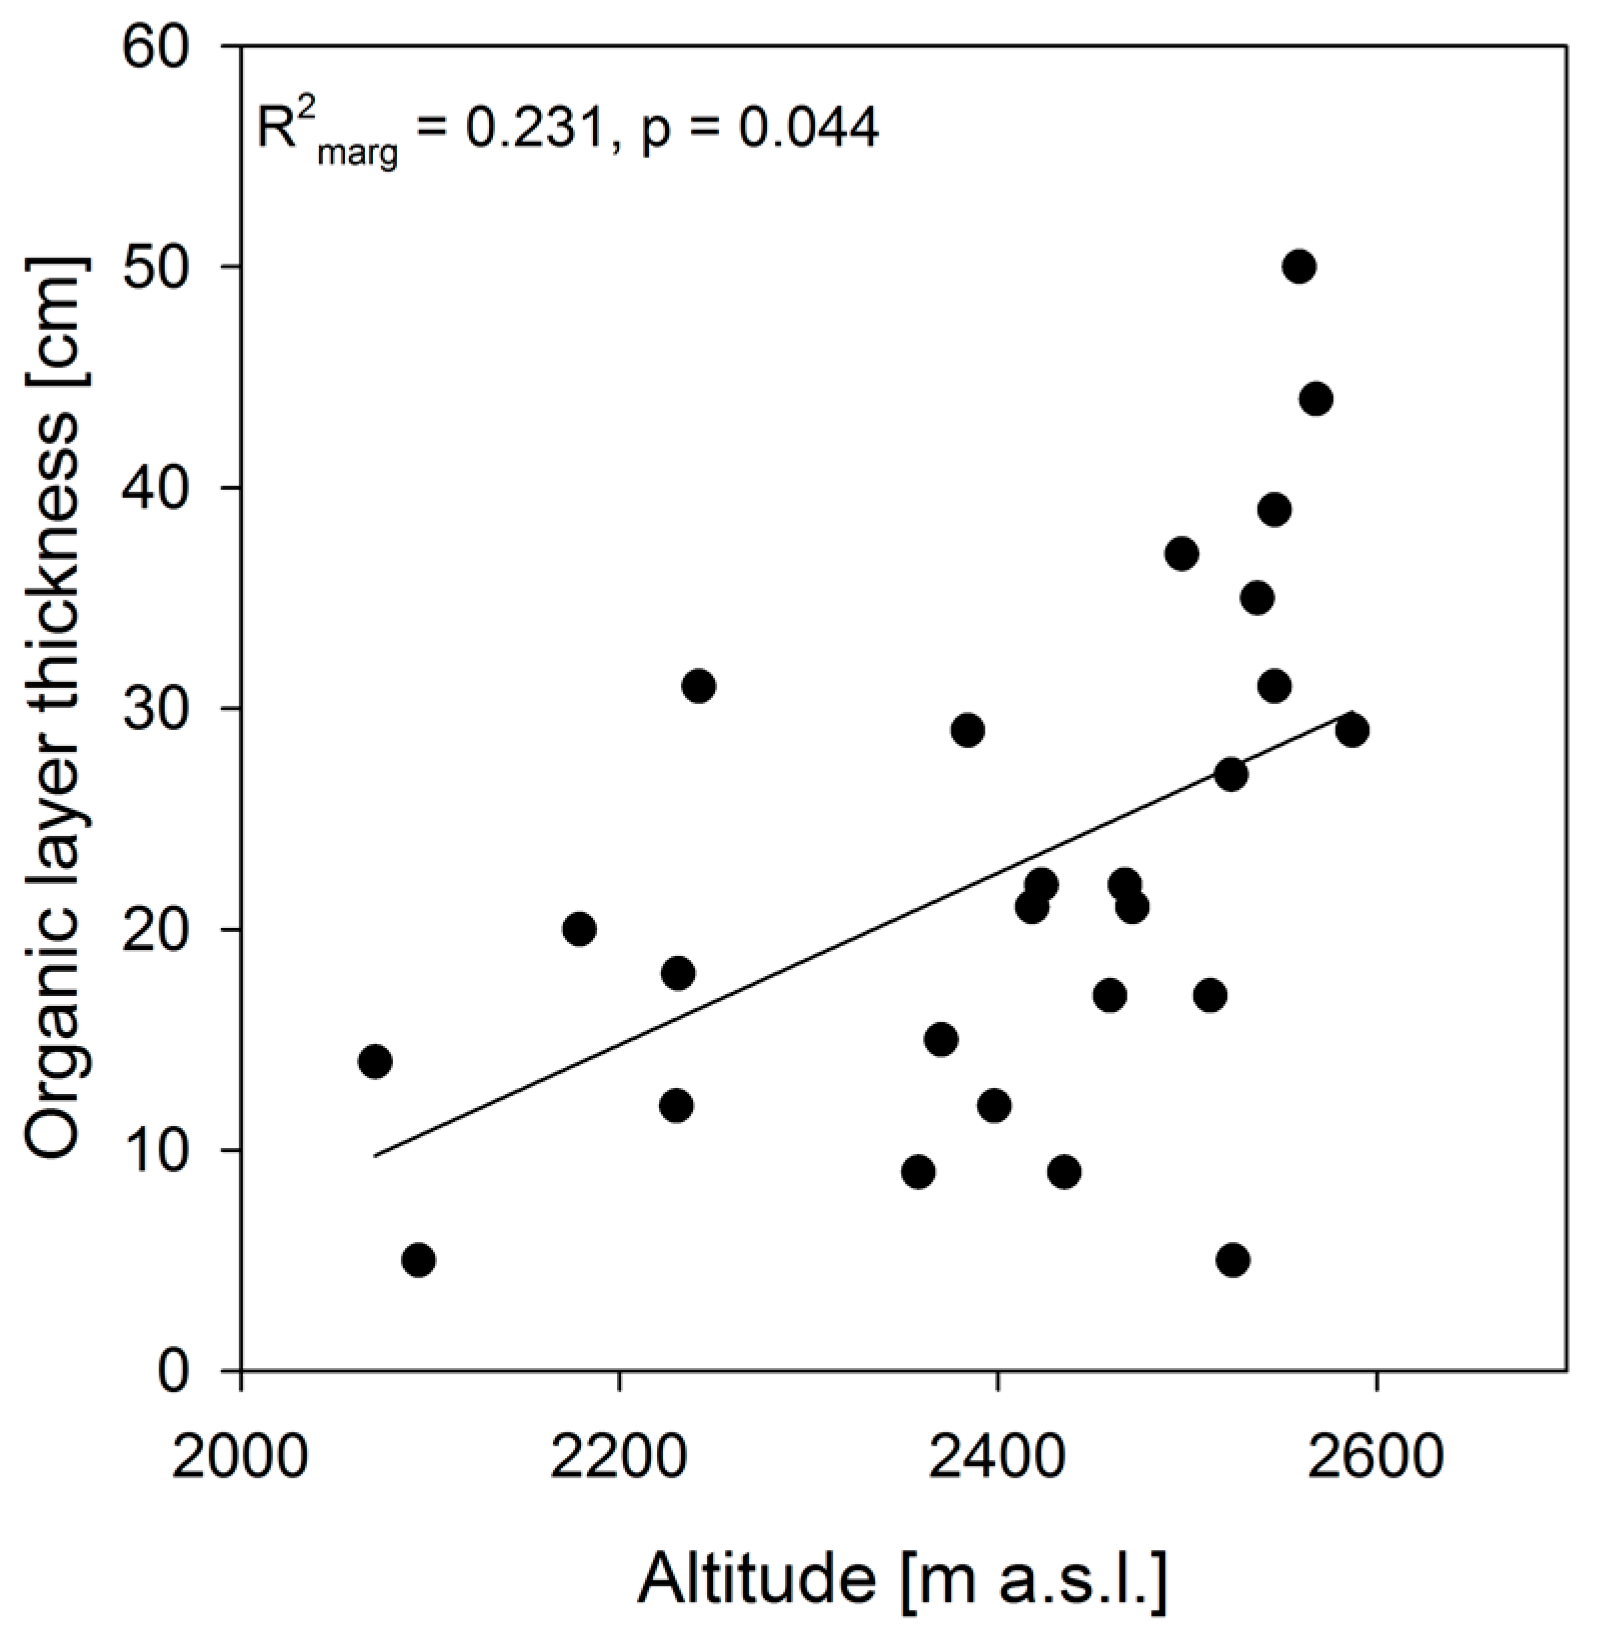
- Altitudinal niche shifts of plants along the gradients of declining temperature, increasing moisture, and increasing humus accumulation towards higher elevation have to be considered.
- A decisive goal-orientation of forest restoration can affect afforestation activities. Species that are rare, endemic, and/or threatened, and thus have a high significance for nature conservation could be used as target species for suitable habitat structure and functions along the biocorridors and to guarantee an ecologically sustainable development of the Pomacochas region.
Acknowledgments
Author Contributions
Conflicts of Interest
References
- Armenteras, D.; Gast, F.; Villareal, H. Andean forest fragmentation and the representativeness of protected natural areas in the Eastern Andes, Colombia. Biol. Conserv. 2003, 113, 245–256. [Google Scholar] [CrossRef]
- Beck, E.; Bendix, J.; Kottke, I.; Makeschin, F.; Mosandl, R. (Eds.) Gradients in a Tropical Mountain Ecosystem of Ecuador; Springer Science & Business Media: Berlin, Germany, 2008; Volume 198. [Google Scholar]
- Kintz, D.B.; Young, K.R.; Crews-Meyer, K.A. Implications of land use/land cover change in the buffer zone of a national park in the tropical Andes. Environ. Manag. 2006, 38, 238–252. [Google Scholar] [CrossRef] [PubMed]
- Spehn, E.M.; Liberman, M.; Körner, C. (Eds.) Land Use Change and Mountain Biodiversity; CRC Press: Boca Raton, FL, USA, 2006. [Google Scholar]
- Young, K.R.; León, B. Biodiversity Conservation in Peru’s Eastern Montane Forests. Mt. Res. Dev. 2000, 20, 208–211. [Google Scholar] [CrossRef]
- Hueck, K.; Seibert, H. Vegetationskarte von Südamerika/Mapa de la Vegetación de America del Sur; Fischer: Stuttgart, Germany, 1972; pp. 1–71. ISBN 9783437200670. [Google Scholar]
- Pires, J.M.; Prance, G.T. The vegetation Types of the Brazilian Amazon. In Key Envonments: Amazonia; Prance, G.T., Lovejoy, T.E., Eds.; Pergamon Press: Oxford, UK, 1985; pp. 109–145. ISBN 9780080307763. [Google Scholar]
- Ledo, A.; Condés, S.; Alberdi, I. Forest Biodiversity Assessment in Peruvian Andean Montane Cloud Forest. J. Mt. Sci. 2012, 9, 372–384. [Google Scholar] [CrossRef]
- Myers, N.; Mittermeier, R.A.; Mittermeier, C.G.; da Fonseca, G.A.B.; Kent, J. Biodiversity hotspots for conservation priorities. Nature 2000, 403, 853–858. [Google Scholar] [CrossRef] [PubMed]
- Quevedo, A.A.; Schleuning, M.; Hensen, I.; Saavedra, F.; Durka, W. Forest fragmentation and edge effects on the genetic structure of Clusia sphaerocarpa and C. lechleri (Clusiaceae) in tropical montane forests. J. Trop. Ecol. 2013, 29, 321–329. [Google Scholar] [CrossRef]
- Barthlott, W.; Lauer, W.; Placke, A. Global Distribution of Species Diversity in Vascular Plants: Towards a World Map of Phytodiversity. Erdkunde 1996, 50, 317–327. [Google Scholar] [CrossRef]
- Myers, N. Biodiversity hotspots revisited. BioScience 2003, 53, 916–917. Available online: https://doi.org/10.1641/0006-3568053[0916:BHR]2.0.CO;2 (accessed on 20 November 2017).
- Barnes, R.; Butchart, S.; Clay, R.; Davies, C.; Seddon, N. The conservation status of the Cordillera de Colán, Northern Peru. Cotinga 1995, 3, 6–7. [Google Scholar]
- Shanee, S.; Allgas, N.; Shanee, N. Preliminary observations on the behavior and ecology of the Peruvian night monkey (Aotus miconax: Primates) in a remnant cloud forest patch, North Eastern Peru. Trop. Conserv. Sci. 2013, 6, 138–148. [Google Scholar] [CrossRef]
- Campbell, N.; Daoudi, S.M.; Nekaris, K.A.I. Abundance of Critically Endangered Yellow-Tailed Woolly Monkeys (Oreonax flavicauda) and Peruvian Night Monkeys (Aotus miconax) in Two Forest Habitats in La Esperanza and Abra Patricia, Peru, Using Occupancy Modelling. Fol. Primat. 2011, 82, 389–390. [Google Scholar]
- Eisenberg, J.F.; Redford, K.H. Mammals of the Neotropics, Ecuador, Bolivia, Brazil; The University of Chicago Press: Chicago, IL, USA, 1999; Volume 3, ISBN 0-226-19542-2. [Google Scholar]
- Garrigues, R.L. Is Marvellous Spatuletail Loddigesia mirabilis threatened by hunting? Cotinga 2000, 4, 13. [Google Scholar]
- Gallegos, S.C.; Hensen, I.; Saavedra, F.; Schleuning, M. Bracken fern facilitates tree seedling recruitment in tropical fire-degraded habitats. For. Ecol. Manag. 2015, 337, 135–143. [Google Scholar] [CrossRef]
- Hartig, K.; Beck, E. The bracken fern (Pteridium arachnoideum (Kaulf.) Maxon) dilemma in the Andes of southern Ecuador. Ecotropica 2003, 9, 3–13. [Google Scholar]
- Clark, D.B.; Palmer, M.W.; Clark, D.A. Edaphic factors and the landscape-scale distributions of tropical rain forest trees. Ecology 1999, 80, 2662–2675. [Google Scholar] [CrossRef]
- Gentry, A.H. Changes in plant community diversity and floristic composition on environmental and geographical gradients. Ann. Mo. Bot. Gard. 1988, 75, 1–34. [Google Scholar] [CrossRef]
- Medina, W.F. Geología. Convenio Suscrito Entre el Instituto de Investigaciones de la Amazonía Peruana y el Gobierno Regional de Amazonas; Estudios Temáticos para Zonificación Ecológia y Económica del Departamento de Amazonas: Loreto, Peru, 2011. [Google Scholar]
- Borsdorf, A.; Stadel, C. Die Anden. Ein Geographisches Portrait; Springer Spektrum Verlag: Berlin, Germany, 2013. [Google Scholar]
- IUSS Working Group WRB. World Reference Base for Soil Resources 2014, Update 2015. International Soil Classification System for Naming Soils and Creating Legends for Soil Maps; World Soil Resources Reports No. 106; FAO: Rome, Italy, 2015. [Google Scholar]
- Anderson, J.M.; Ingram, J.S. (Eds.) Tropical Soil Biology and Fertility: A Handbook of Methods, 2nd ed.; CAB International: Wallingford, UK, 2007; pp. 93–94. [Google Scholar]
- Day, P.R. Particle fractionation and particle-size analysis. In Methods of Soil Analysis, Part 1; Black, C.A., Ed.; American Society of Agronomy: Madison, WI, USA, 1965; Chapter 43; pp. 545–567. [Google Scholar]
- Gee, G.W.; Bauder, J.W. Particle-size analysis. In Methods of Soil Analysis, 2nd ed.; Physical and Mineralogical Methods, Agronomy Monograph No. 9; Klute, C.A., Ed.; Soil Science Society of America: Madison, WI, USA, 1986; pp. 383–411. [Google Scholar]
- Kunze, G.W. Pretreatment for Mineralogical Analysis. In Methods of Soil Analysis, Part 1; Black, C.A., Ed.; American Society of Agronomy: Madison, WI, USA, 1965; Chapter 44; pp. 568–577. [Google Scholar]
- Carmo Horta, M.; Torrent, J. The Olsen P method as an agronomic and environmental test for predicting phosphate release from acid soils. Nutr. Cycl. Agroecosyst. 2007, 77, 283–292. [Google Scholar] [CrossRef]
- Olsen, S.; Cole, C.; Watanabe, F.; Dean, L. Estimation of available phosphorus in soils by extraction with sodium bicarbonate. In USDA Circular; US Gov. Print. Office: Washington, DC, USA, 1954; Volume 939. [Google Scholar]
- Dufrêne, M.; Legendre, P. Species assemblages and indicator species: The need for a flexible asymmetrical approach. Ecol. Monogr. 1997, 67, 345–366. [Google Scholar] [CrossRef]
- McCune, B.; Grace, J.B. Analysis of Ecological Communities; MjM Software Design: Gleneden Beach, OR, USA, 2002; pp. 1–304. ISBN 0-9721290-0-6. [Google Scholar]
- R Core Team. R: A Language and Environment for Statistical Computing; R Foundation for Statistical Computing: Vienna, Austria, 2017; Available online: https://www.R-project.org/ (accessed on 1 February 2018).
- Pinheiro, J.; Bates, D.; DebRoy, S.; Sarkar, D.; R Core Team. nlme: Linear and Nonlinear Mixed Effects Models. R Package Version 3.1-131. Available online: https://cran.r-project.org/web/packages/nlme/index.html (accessed on 1 February 2018).
- Lefcheck, J.S. piecewiseSEM: Piecewise structural equation modeling in R for ecology, evolution, and systematics. Methods Ecol. Evol. 2015, 7, 573–579. [Google Scholar] [CrossRef]
- Hothorn, T.; Bretz, F.; Westfall, P. Simultaneous Inference in General Parametric Models. Biom. J. 2008, 50, 346–363. [Google Scholar] [CrossRef] [PubMed]
- Oksanen, J.; Blanchet, F.G.; Kindt, R.; Legendre, P.; Minchin, P.R.; O’Hara, R.B.; Simpson, G.L.; Solymos, P.; Stevens, M.H.H.; Wagner, H. Vegan: Community Ecology Package. R Package Version 2.0-7. 2013. Available online: http://CRAN.R-project.org/package=vegan (accessed on 1 February 2018).
- Roberts, D.W. Labdsv: Ordination and Multivariate Analysis for Ecology. R Package Version 1.8-0. Available online: https://CRAN.R-project.org/package=labdsv (accessed on 1 February 2018).
- Christensen, N.L. An historical perspective on forest succession and its relevance to ecosystem restoration and conservation practice in North America. For. Ecol. Manag. 2014, 330, 312–322. [Google Scholar] [CrossRef]
- Marrs, R.H.; Le Duc, M.G.; Mitchell, R.J.; Goddard, D.; Paterson, S.; Pakeman, R.J. The ecology of bracken: Its role in succession and implications for control. Ann. Bot. 2000, 85 (Suppl. B), 3–15. [Google Scholar] [CrossRef]
- Den Ouden, J. The Role of Bracken (Pteridium aquilinum) in Forest Dynamics. Ph.D. Thesis, Wageningen University, Wageningen, The Netherlands, 2000. [Google Scholar]
- Benıtez-Malvido, J.; Martinez-Ramos, M.; Ceccon, E. Seed rain vs. seed bank, and the effect of vegetation cover on the recruitment of tree seedlings in tropical successional vegetation. In Life Forms and Dynamics in Tropical Forests; Gottsberger, S., Liede, S., Eds.; Cramer: Berlin, Germany, 2001; pp. 185–204. ISBN 3443642594. [Google Scholar]
- Douterlungne, D.; Thomas, E. Fast-growing pioneer tree stands as a rapid and effective strategy for bracken elimination in the Neotropics (ed Q Paynter). J. Appl. Ecol. 2013, 50, 1257–1265. [Google Scholar]
- Gómez-Aparicio, L. The role of plant interactions in the restoration of degraded ecosystems: A meta-analysis across life-forms and ecosystems. J. Ecol. 2009, 97, 1202–1214. [Google Scholar] [CrossRef]
- Shoo, L.P.; Catterall, C.P. Stimulating natural regeneration of tropical forest on degraded land: Approaches, outcomes, and information gaps. Restor. Ecol. 2013, 21, 670–677. [Google Scholar] [CrossRef]
- Sánchez Saenz, M. Catálogo Preliminar Comentado de la Flora del Medio Caquetá (Commented Catalogue on the Middle Caquetá Flora); Tropenbos Colombia: Santafé de Bogotá D.C., Colombia, 1997; p. 557. ISBN 958-9365-04-3. [Google Scholar]
- Stadel, C. Altitudinal Belts in the Tropical Andes: Their Ecology and Human Utilization. Benchmark Conf. Latin Am. Geogr. 1990, 17–18, 45–60. [Google Scholar]
- Wilcke, W.; Oelmann, Y.; Schmitt, A.; Valarezo, C.; Zech, W.; Homeier, J. Soil properties and tree growth along an altitudinal transect in Ecuadorian tropical montane forest. J. Plant Nutr. Soil Sci. 2008, 171, 220–230. [Google Scholar] [CrossRef]
- Hertel, D.; Hölscher, D.; Leuschner, C. Size and Structure of Fine Root Systems in Old-growth and Secondary Tropical Montane Forests (Costa Rica). BIOTROPICA 2003, 35, 143–153. [Google Scholar] [CrossRef]
- Leuschner, C.; Moser, G.; Bertsch, C.; Röderstein, M.; Hertel, D. Large altitudinal increase in tree root/shoot ratio in tropical mountain forests of Ecuador. Basic Appl. Ecol. 2007, 8, 219–230. [Google Scholar] [CrossRef]
- Unger, M.; Leuschner, C.; Homeier, J. Variability of indices of macronutrient availability in soils at different spatial scales along an elevation transect in tropical moist forests (NE Ecuador). Plant Soil 2010, 336, 443–458. [Google Scholar] [CrossRef]
- Förster, M.; Frick, A.; Walentowski, H.; Kleinschmit, B. Approaches to utilising Quickbird-Data for the Monitoring of NATURA 2000 habitats. Community Ecol. 2008, 9, 155–168. [Google Scholar] [CrossRef]
- Ewald, J. Evaluation of forest sites and communities using plant indicator ecograms. Tuexenia 2007, 27, 7–18. [Google Scholar]
- Walentowski, H.; Falk, W.; Mette, T.; Kunz, J.; Bräuning, A.; Meinardus, C.; Zang, C.; Sutcliffe, L.; Leuschner, C. Assessing future suitability of tree species under climate change by multiple methods: A case study in southern Germany. Ann. For. Res. 2017, 60, 101–126. [Google Scholar] [CrossRef]
- Hohnwald, S.; Rischkowsky, B.; King, J.M.; Camarão, A.P.; Rodrigues Filho, J.A.; Zeppenfeld, T. Intensive Cattle Browsing Did Not Prevent Fallow Recuperation on Smallholder Grass-Capoeira Pastures in the NE-Amazon. Agrofor. Syst. 2015, 89, 813–828. [Google Scholar] [CrossRef]
- Hohnwald, S.; Trautwein, J.; Camarão, A.P.; Wollny, C.B.A. Relative palatability and growth performance of capoeira species as supplementary forages in the NE-Amazon. Agric. Ecosyst. Environ. 2016, 218, 107–115. [Google Scholar] [CrossRef]
- Hohnwald, S.; Acioli de Abréu, E.; Krummel, T.; da Veiga, J.B.; Wollny, C.B.A.; Calandrini de Azevedo, C.M.B.; Gerold, G. Degraded Pasture Expansion and Woody Enrichment Strategies for Pasture Fertility Preservation in the Bragantina Region, North-Eastern Amazon. Erdkunde 2010, 64, 17–31. [Google Scholar] [CrossRef]


| Chonta/Chúlec | Grupo Oriente | Forest Sites | Succession Sites | |
|---|---|---|---|---|
| n = 10 | n = 8 | n = 18 | n = 6 | |
| altitude [m a.s.l.] | 2473 (18) | 2293 (58) | 2393 (34) | 2311 (58) |
| slope [°] | 14.4 (3.4) | 18.1 (4.4) | 16.1 (2.6) | 29.4 (5.2) |
| vegetation structure | ||||
| cover tree layer [%] | 78.5 (4.8) | 80.0 (6.2) | 79.2 (3.7) | 16.7 (6.2) |
| cover shrub layer [%] | 63.0 (8.4) | 34.0 (6.2) | 50.1 (6.3) | 60.8 (51) |
| tree height [m] | 27.2 (2.5) | 23.8 (2.3) | 25.7 (1.7) | 19.6 (7.7) |
| vegetation diversity | ||||
| no. of plant families/plot | 15.0 (0.9) | 15.5 (1.9) | 15.2 (0.9) | 10.2 (1.4) |
| species number/plot | 19.7 (1.9) | 20.1 (2.3) | 19.9 (1.4) | 14.8 (2.1) |
| no. fern species/plot | 1.4 (0.3) | 1.4 (0.3) | 1.4 (0.2) | 0.5 (0.5) |
| no. grass species/plot | 0.6 (0.2) | 0.3 (0.2) | 0.4 (0.1) | 1.3 (0.4) |
| no. herb species/plot | 1.7 (0.4) | 1.5 (0.4) | 1.6 (0.3) | 2.2 (0.3) |
| no. shrub species/plot | 2.9 (0.6) | 2.0 (0.7) | 2.5 (0.4) | 4.0 (0.9) |
| no. tree species/plot | 13.1 (1.4) | 14.9 (1.1) | 13.9 (0.9) | 6.5 (1.8) |
| % ferns | 7.5 (1.6) | 7.0 (1.1) | 7.3 (1.0) | 4.6 (2.7) |
| % grasses | 3.2 (1.1) | 0.9 (0.6) | 2.2 (0.7) | 10.3 (2.9) |
| % herbs | 9.1 (1.9) | 6.6 (1.7) | 8.0 (1.3) | 14.9 (1.0) |
| % shrubs | 14.0 (1.5) | 8.4 (2.4) | 11.6 (1.5) | 28.1 (5.5) |
| % trees | 66.2 (3.0) | 76.5 (3.7) | 70.8 (2.6) | 40.3 (7.6) |
| Geology | Land-Use Type | ||||||
|---|---|---|---|---|---|---|---|
| Live Form | IV | p | IV | p | |||
| Hedyosmum racemosum | Tree | Grupo Oriente | 0.61 | 0.036 | |||
| Piper cf. macrotrichum | shrub/tree | Grupo Oriente | 0.57 | 0.037 | |||
| Leonia glycycarpa | Tree | forest | 0.76 | 0.018 | |||
| Ocotea sp. | Tree | forest | 0.72 | 0.005 | |||
| Cyathea sp. | tree fern | forest | 0.71 | 0.013 | |||
| Asplundianthus stuebelii | Shrub | succession | 0.50 | 0.014 | |||
| Baccharis latifolia | Shrub | succession | 0.50 | 0.011 | |||
| Rubus glaucus | Shrub | succession | 0.50 | 0.019 | |||
| Munnozia sp. | Herb | succession | 0.50 | 0.012 | |||
| Oxalis medicaginea | Herb | succession | 0.49 | 0.035 | |||
| Formations Chonta/Chúlec | Formation Grupo Oriente | p-value | |
|---|---|---|---|
| N | 16 | 10 | |
| Altitude | 2492 (14) | 2276 (34) | 0.215 |
| Slope | 13.7 (2.1) | 18.2 (3.7) | 0.265 |
| Organic Layer | |||
| O-layer thickness (cm) | 25.8 (3.1) | 17.8 (3.0) | 0.130 |
| POL (mg/kg) | 63.9 (10.0) | 40.4 (4.7) | 0.297 |
| KOL (mg/kg) | 354.6 (29.3) | 228.8 (41.3) | 0.137 |
| pHOl | 4.4 (0.3) | 4.4 (0.1) | 0.833 |
| Topsoil | |||
| % Sandtopsoil | 53.7 (4.1) | 69.3 (2.9) | 0.182 |
| % Silttopsoil | 17.1 (1.2) | 14.6 (1.1) | 0.526 |
| % Claytopsoil | 29.3 (3.5) | 16.1 (2.0) | 0.126 |
| Ptopsoil (mg/kg) | 5.3 (1.3) | 10.2 (2.2) | 0.300 |
| Ktopsoil (mg/kg) | 273.3 (32.9) | 137.9 (32.6) | 0.058 |
| pHtopsoil | 4.5 (0.3) | 4.1 (0.1) | 0.713 |
| Subsoil | |||
| % Sandsubsoil | 44.3 (2.9) | 62.5 (1.8) | 0.099 |
| % Siltsubsoil | 18.8 (1.8) | 19.2 (1.9) | 0.995 |
| % Claysubsoil | 35.5 (3.5) | 18.3 (1.2) | 0.079 |
| Psubsoil (mg/kg) | 3.2 (0.5) | 3.6 (0.6) | 0.704 |
| Ksubsoil (mg/kg) | 255.0 (39.0) | 208.4 (43.7) | 0.984 |
| pHsubsoil (mg/kg) | 5.1 (0.3) | 4.5 (0.1) | 0.590 |
© 2018 by the authors. Licensee MDPI, Basel, Switzerland. This article is an open access article distributed under the terms and conditions of the Creative Commons Attribution (CC BY) license (http://creativecommons.org/licenses/by/4.0/).
Share and Cite
Walentowski, H.; Heinrichs, S.; Hohnwald, S.; Wiegand, A.; Heinen, H.; Thren, M.; Gamarra Torres, O.A.; Sabogal, A.B.; Zerbe, S. Vegetation Succession on Degraded Sites in the Pomacochas Basin (Amazonas, N Peru)—Ecological Options for Forest Restoration. Sustainability 2018, 10, 609. https://doi.org/10.3390/su10030609
Walentowski H, Heinrichs S, Hohnwald S, Wiegand A, Heinen H, Thren M, Gamarra Torres OA, Sabogal AB, Zerbe S. Vegetation Succession on Degraded Sites in the Pomacochas Basin (Amazonas, N Peru)—Ecological Options for Forest Restoration. Sustainability. 2018; 10(3):609. https://doi.org/10.3390/su10030609
Chicago/Turabian StyleWalentowski, Helge, Steffi Heinrichs, Stefan Hohnwald, Alexander Wiegand, Henry Heinen, Martin Thren, Oscar A. Gamarra Torres, Ana B. Sabogal, and Stefan Zerbe. 2018. "Vegetation Succession on Degraded Sites in the Pomacochas Basin (Amazonas, N Peru)—Ecological Options for Forest Restoration" Sustainability 10, no. 3: 609. https://doi.org/10.3390/su10030609
APA StyleWalentowski, H., Heinrichs, S., Hohnwald, S., Wiegand, A., Heinen, H., Thren, M., Gamarra Torres, O. A., Sabogal, A. B., & Zerbe, S. (2018). Vegetation Succession on Degraded Sites in the Pomacochas Basin (Amazonas, N Peru)—Ecological Options for Forest Restoration. Sustainability, 10(3), 609. https://doi.org/10.3390/su10030609