Article

A Spatial Decision Support System Framework for the Evaluation of Biomass Energy Production Locations: Case Study in the Regional Unit of Drama, Greece

by
Konstantinos Ioannou
1,*,
Georgios Tsantopoulos
2,
Garyfallos Arabatzis
2,
Zacharoula Andreopoulou
3 and
Eleni Zafeiriou
4
1
Hellenic Agricultural Organization “DEMETER”, Forest Research Institute, Vasilika, Thessaloniki 57006, Greece
2
Department of Forestry and Management of the Environment and Natural Resources, Democritus University of Thrace, Pantazidou 193, Orestiada 68200, Greece
3
Department of Forestry and Natural Environment, Lab. Of Forest Informatics, Aristotle University of Thessaloniki, POBOX 247, Thessaloniki 54124, Greece
4
Department of Agricultural Development, Democritus University of Thrace, Pantazidou 193, Orestiada 68200, Greece
*
Author to whom correspondence should be addressed.
Sustainability 2018, 10(2), 531; https://doi.org/10.3390/su10020531
Submission received: 23 January 2018 / Revised: 12 February 2018 / Accepted: 12 February 2018 / Published: 16 February 2018

Abstract

:
Renewable Energy Sources are expected to play a very important role in energy production in the following years. They constitute an energy production methodology which, if properly enabled, can ensure energy sufficiency as well as the protection of the environment. Energy production from biomass in particular is a very common method, which exploits a variety of resources (wood and wood waste, agricultural crops and their by-products after cultivation, animal wastes, Municipal Solid Waste (MSW) and food processing wastes) for the production of energy. This paper presents a Spatial Decision Support System, which enables managers to locate the most suitable areas for biomass power plant installation. For doing this, fuzzy logic and fuzzy membership functions are used for the creation of criteria layers and suitability maps. In this paper, we use a Multicriteria Decision Analysis methodology (Analytical Hierarchy Process) combined with fuzzy system elements for the determination of the weight coefficients of the participating criteria. Then, based on the combination of fuzzy logic and theAnalytic Hierarchy Process (AHP), a final proposal is created thatdivides the area into four categories regarding their suitability forsupporting a biomass energy production power plant. For the two optimal locations, the biomass is also calculated.The framework is applied to theRegional Unit of Drama, which is situated in Northern Greece and is very well known for the area’s forest and agricultural production.

1. Introduction

Energy is a very important part of human life and the economy.Many researchers consider it as a key element forimproving quality of life [1,2], although there are differing opinions [3]. In any case, energy plays a vital role,whethernegative or positive, in our way of life.
Also, many researchers have proven that overthe last decades we are witnessing a constant increase in energy usage, which is followed by a constant need toincrease energy production [4,5,6]. The International Energy Outlook for the year 2017, published by the U.S. Energy Information Administration [6], suggests that the total energy consumption will rise from 575 quadrillion Btus in 2015 to 735 Btus in 2040. Most of this increase will come from countries that are not part of the Organization for Economic Co-operation and Development (OECD). These countries are characterized by strong economic growth, increased access to marketed energy and quickly growing populations, which lead to rising energy demands. It is estimated that the energy consumption in non-OECD countries will increase by 41% between 2015 and 2040 in contrast to a 9% increase in OECD countries [6]. One of the most important drivers that leads to increased energy demand is population. Studies showed that in OECD countries the estimation of population growth is only 0.2% per year, whereas in non-OECD countries in Africa, Middle East and India are expected to experience among the highest rates of population growth in the world [6].
Apart from the energy usage increase caused from population growth there are numerous other reasons causing similar phenomena. Τhe average household consumes more energy mainly because there are new appliances introduced and used every day [7]. Furthermore, it is estimated that the increase in the number of appliances like TV sets per household, gaming consoles, computers as well as the diffusion of usage of others (vacuum cleaners, dish washers etc.) also increases the average energy usage [8,9]. The same researchers have shown that between the years 2005 and 2011 an increase of 102 kWh/year has been made only from the usage of high definition consoles.
Other researchers, by analysing micro-level data from the National Survey of Family and Expenditure, revealed that the family and income structure of households affects appliance usage [7]. Additionally, it is proven that the need for larger houses also leads to a subsequent increase in energy consumption which is caused by the residents need to utilize the entire structure [9,10,11], Another increase factor in energy usage is caused by the increment of the number of cooling days. It is proven that since the year 1990 there is a constant increase in the number of cooling days and heating days per year, which causes a subsequent increase in energy demand [12,13,14].
Currently the most popular methods of energy production are mainly based on the usage of fossil fuels, which will represent 77% of energy production by 2040 according to IEO [6]. However, these methods have an enormous environmental impact mainly because they produce contaminants which play a very important role in climate change (fossil fuels) or their bi-products are difficult to be processed and stored (nuclear fuels) [15,16,17,18,19,20].
Furthermore, the usage of non-renewable energy sources has a limited time frame. Studies have proven that oil, coal and gas reserves will be extinct in 35, 107 and 37 years respectively, based on the current usage rate and energy demands prediction [21,22,23].
The most promising solution to these problems is the usage of renewable energy sources (RES) which can be exploited without the subsequent side effects caused by the typical energy production forms.
Under this scope the aim of this paper is the presentation of a methodology in the form of a spatial decision support system framework, which is based on the combination of fuzzy systems and multicriteria decision analysis and will enable researchers, managers and local or regional authorities to identify the locations where potentially a RES power plant can be installed in order to maximise its usage and minimise environmental annoyance and installation cost. Additionally, the methodology will provide sufficient data in order to make a first estimation regarding the overall energy potential of the proposed area.
Finally, in order to validate the results of the system, the methodology is applied to the Regional unit of Drama. The regional unit was selected because it combined all the types of biomass energy sources. In detail, Drama has the largest forest and transitional forest areas in Greece as well as significant agricultural areas, pastures. Additionally, in the regional unit there is the largest number of livestock units in the prefecture of Eastern Macedonia and Thrace and it is in the top 10 regional units in Greece [24].

2. Literature Review

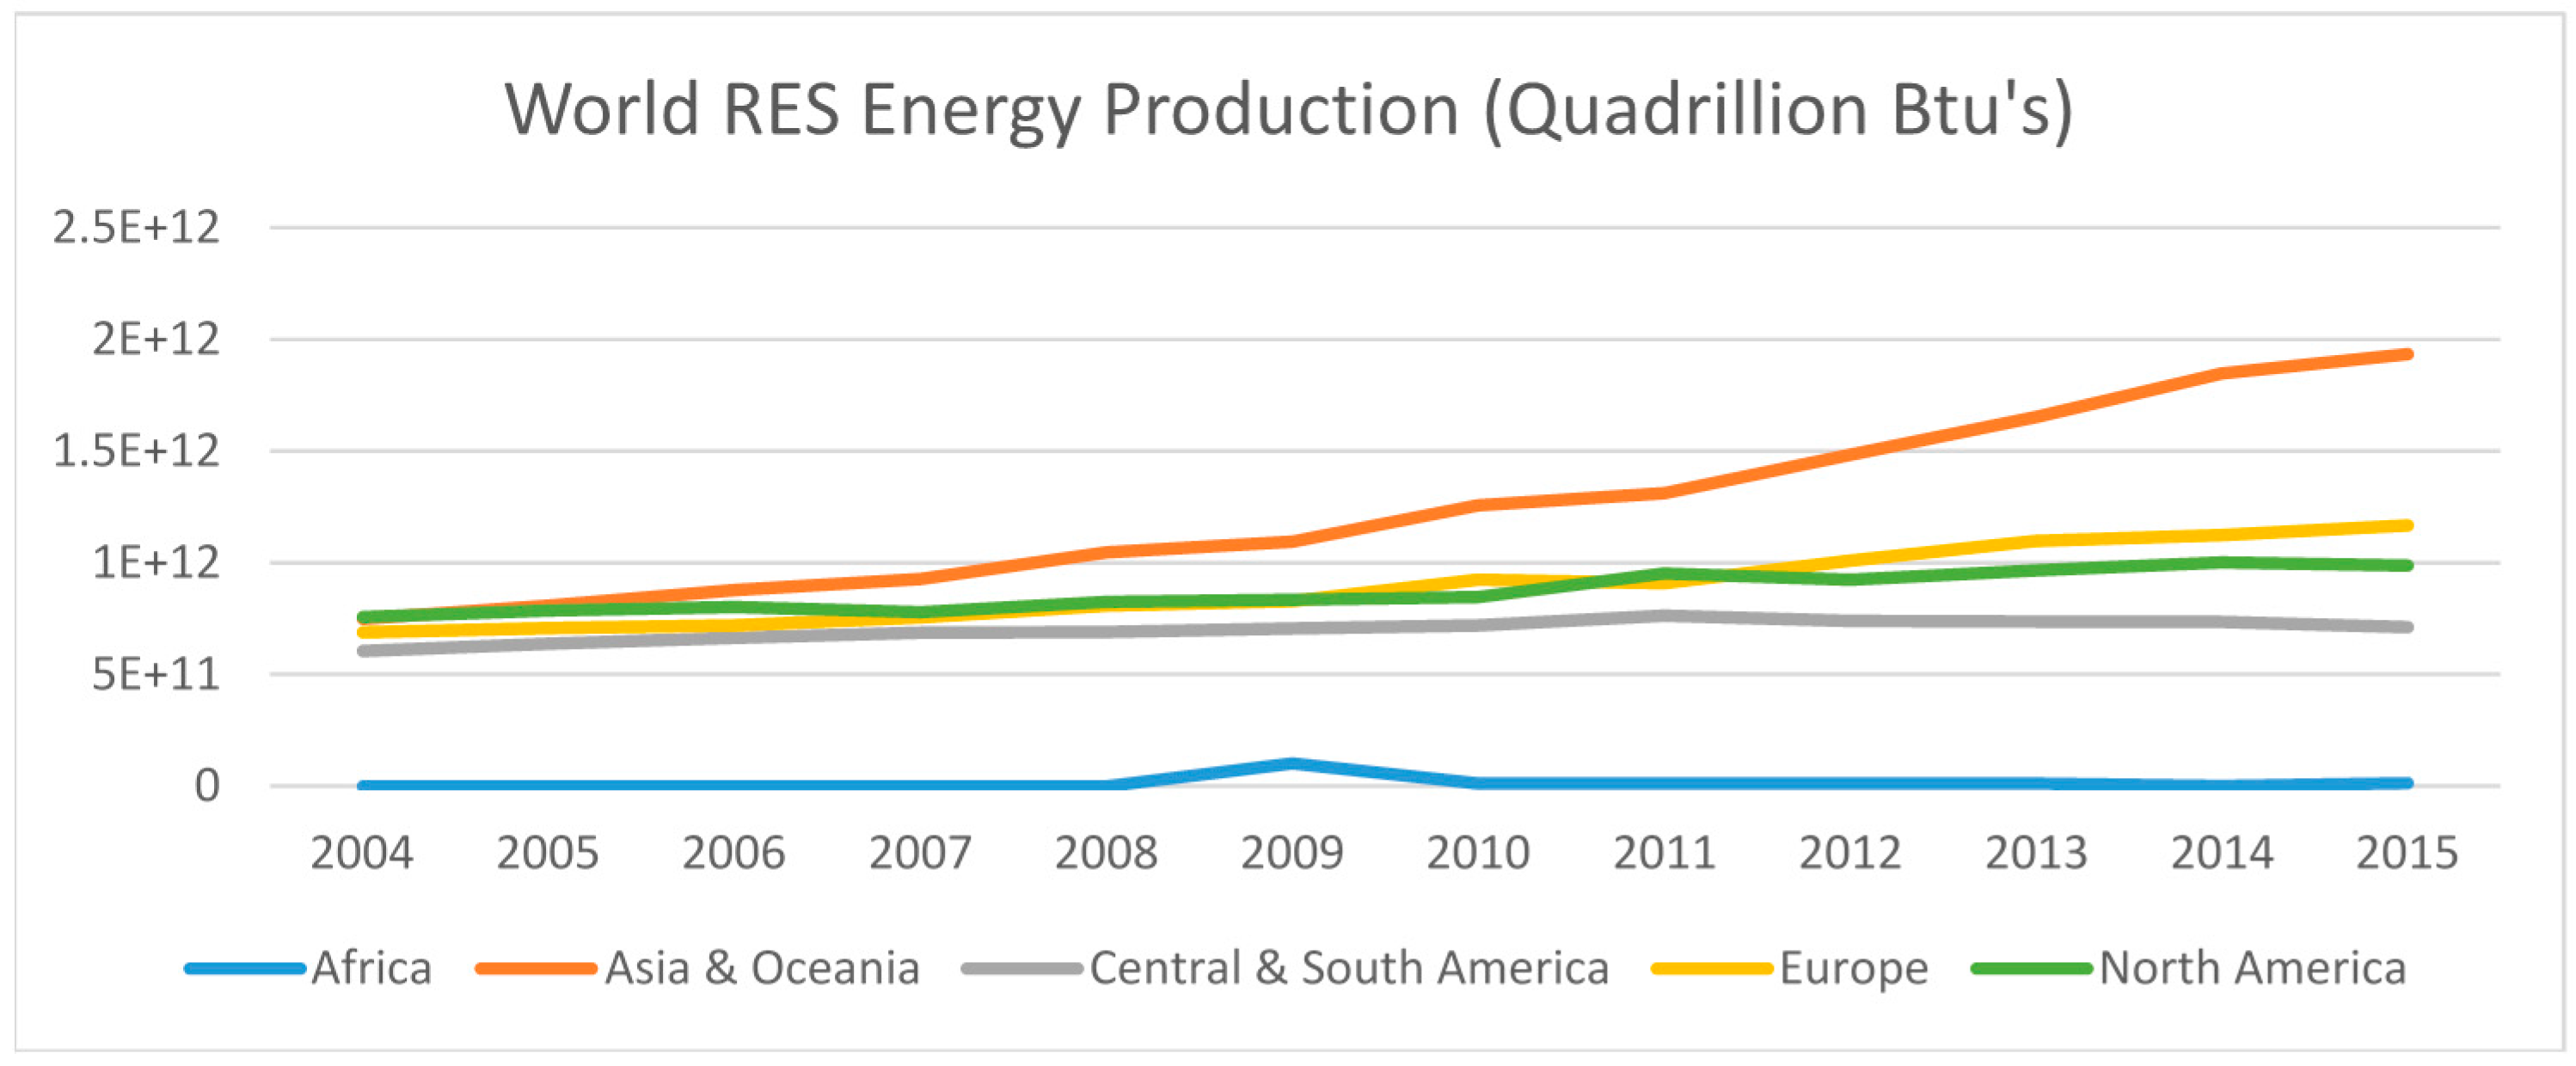
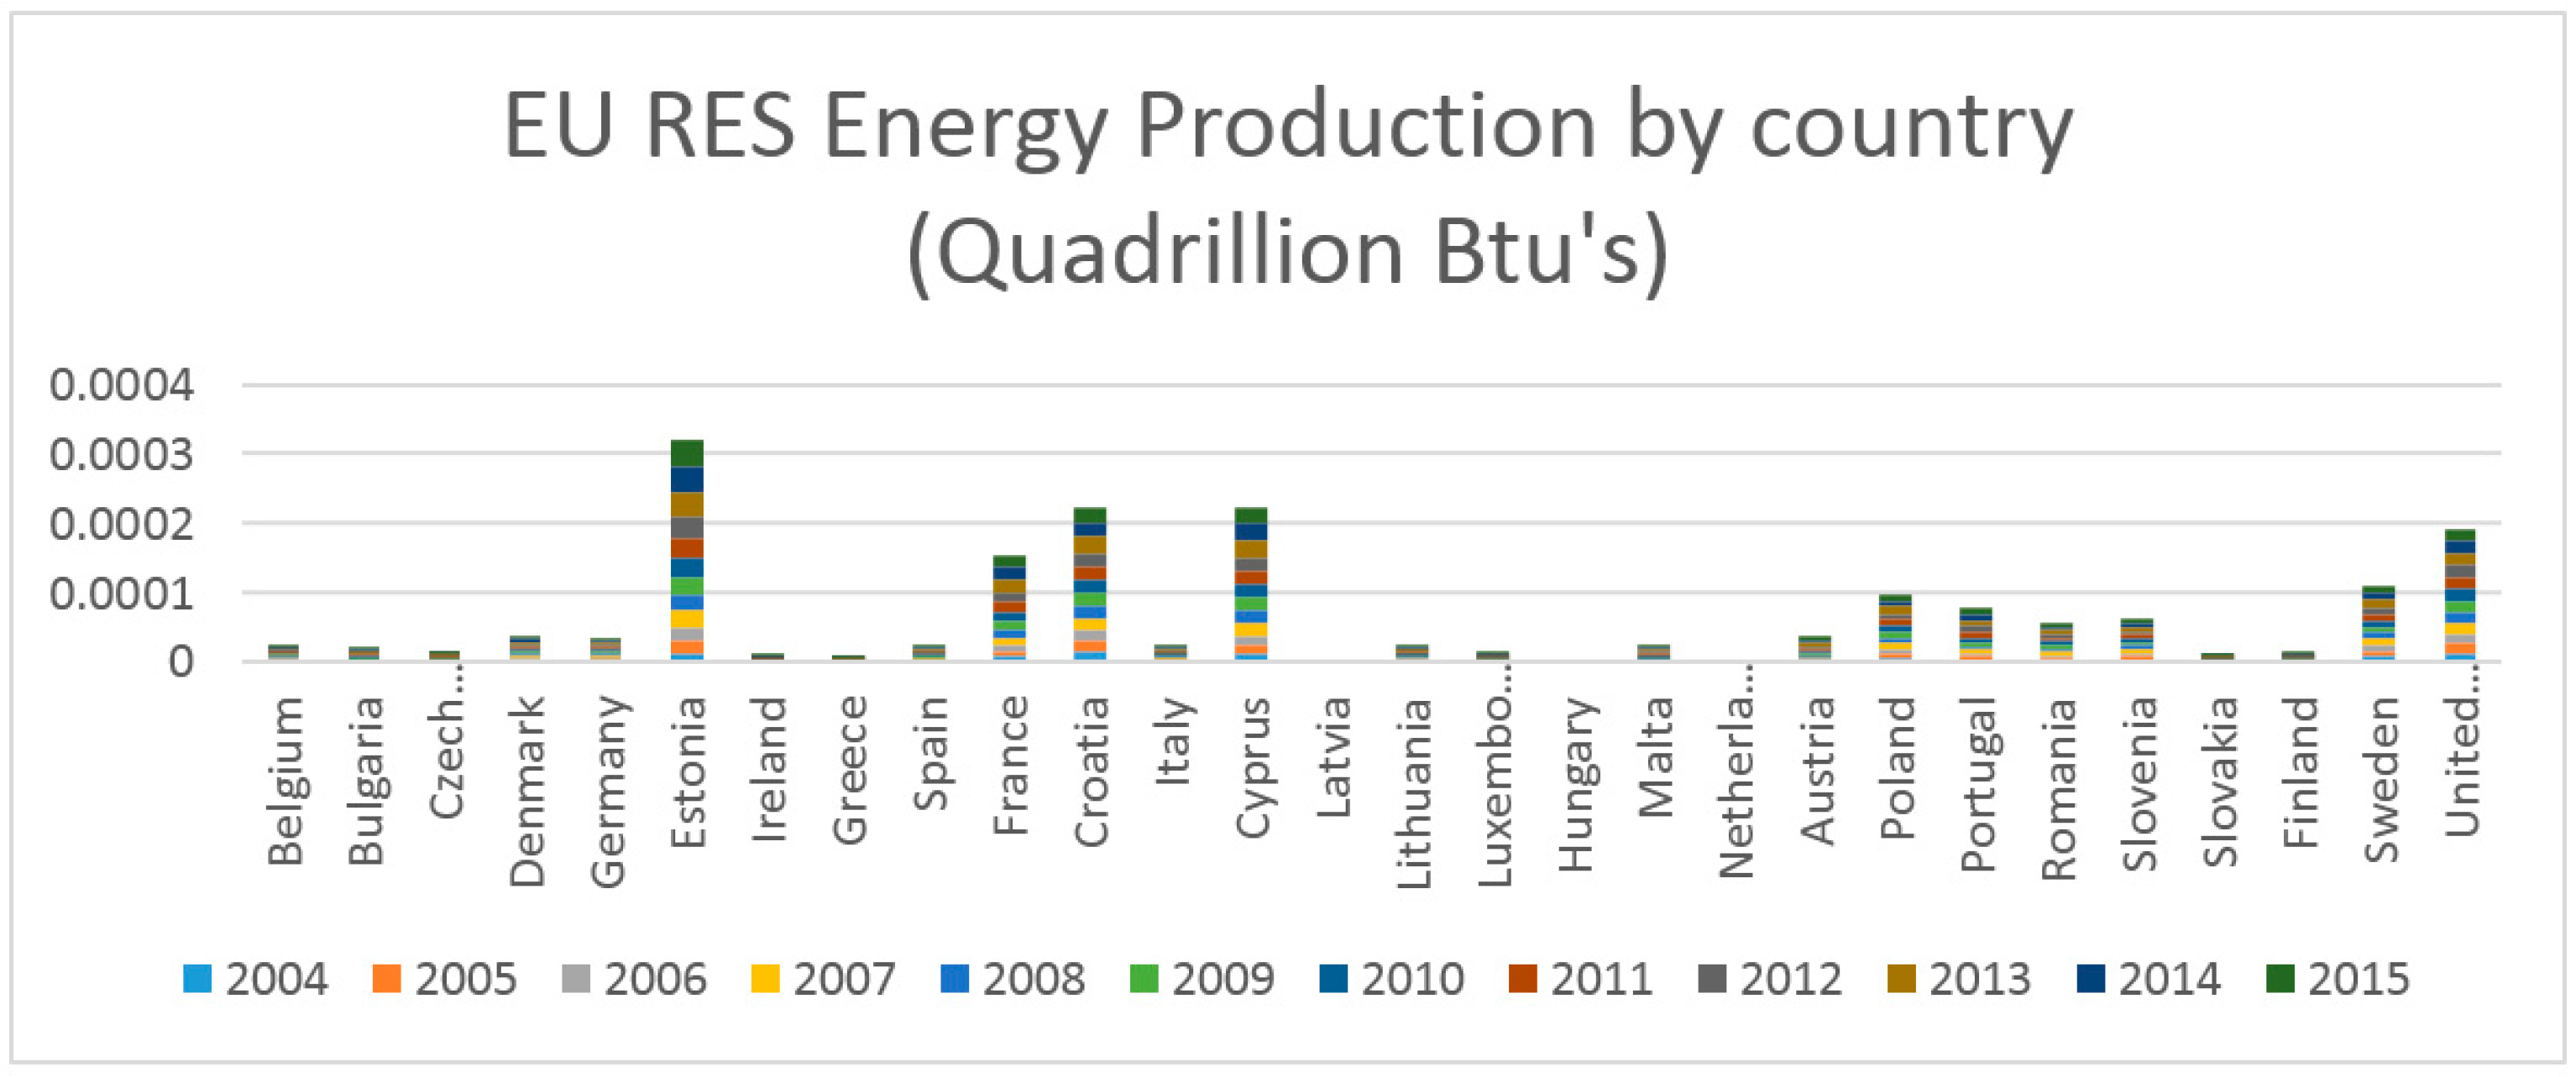
2.1. Renewable Energy Sources

It is already stated that there is a rapidly increasing need for producing energy using cleaner more environmental friendly methods like Renewable Energy Sources (RES).
The most common forms of RES include the usage of hydroelectric power, solar and wind energy, geothermal energy and biomass for the production of electricity generation [25]. RES constitutes for many countries (developed and developing), an important, alternative energy source, which reduces energy dependency and strengthens the security of their energy supply [26].
Global electricity energy production from renewable energy is expected to grow 2.7 times until 2035 [27]. Renewables are the fastest-growing source of energy for electricity generation (Figure 1). The average increase is estimated to be 2.8%/year from 2015 to 2040. From all RES technologies, non-hydropower renewable resources are the fastest-growing energy sources for new generation capacity in both OECD and non-OECD regions. Non-hydropower renewables accounted for 7% of total world generation in 2015; their share in 2040 is 15% in the IEO2017 Reference case, with more than half of the growth coming from wind power [6].
In Europe, renewable energy production within the 28 member states in 2015 was 204 Mtoe (Figure 2) (8.08 quadrillion Btus). The quantity of renewable energy produced within the member states has increased overall by 70.2% from 2005 until 2015 [29]. This increase in RES usage is triggered by the EU legislation framework. The EU Directive 2009/28/EC set the obligatory level of contribution of RES to energy mixture as 20% by 2020. In order to achieve this level EU member must double the share of electricity from RES from 16% to over 30%. In 2012 the penetration of RES in all 28 member states was 14.1%. Sweden is the leading country with 51% of energy production covered by RES, followed by Finland, Austria and Latvia with 30% [29].
In Greece, due to its geographic position, there is an enormous potential for energy production by RES. The geo-morphologic profile and the weather conditions favour energy production from the exploitation of wind and solar energy [30,31]. In 2015 the percentage of electricity generated by RES was 22.1% [29].
From Figure 3 it is evident that Hydro Power, Solar and Biofuels are the dominant forms of RES production. However, there can be vast improvements in order for the country to reach the EU average.

2.2. Biomass Energy Production

Biomass is a very important form of RES, mainly because its usage can be done in raw form without any process. Among other factors the growing interest in biomass usage is based on the following facts [32]:
  • Its contribution to poverty reduction in developing countries
  • Its ability to constantly meet energy demand
  • Its capability on delivering energy in all forms people need (liquid, gas, heat and electricity)
  • Its carbon dioxide neutrality
  • It helps on the restoration of unproductive and degraded lands, increases biodiversity, soil fertility and water retention
The most common biomass energy sources are wood and wood waste, agricultural crops and their by-products after cultivation, animal wastes, Municipal Solid Waste (MSW) and food processing wastes. Currently the available biomass resources can provide approximately 6 × 10¹⁵ Btus of energy [33]. Wood and wood waste produce 64% of the total Biomass energy, followed by MSW (24%), agricultural wastes and by-products (5%) and landfill gases (5%) [33,34,35].
There are many economic benefits deriving from the usage of biomass as a source for energy production [36]:
  • Inexpensive resources
  • Locally distributed
  • Price stability
  • Generation of employment opportunities
  • Biomass export opportunities
  • Potentially inexhaustible fuel resource
In Greece, it is estimated that the total of the available biomass consists of 7,500,000 tones of Agricultural crop residues (cereals, maize, cotton, tobacco, sunflower, strawberries, olive kernels, vines etc.) and 2,700,000 tones from forestry residues (branches, roots, barks etc.). The vast percentage of this biomass remains unused and is causing the development of forest fires or is acting as a mean for disease spreading. Additionally, in Greece, the available agricultural and forest residues are estimated to be equivalent to 3–4 million tons of oil, which constitute approximately 30–40% of the total oil consumption in Greece. At the same time the potential of energy cultivations can surpass the energy produced by these residues. Until now, biomass in Greece is mainly used on a limited scale for heating purposes (households, greenhouses etc.) and in industry (cotton ginners, timber products, lime kilns etc.). In these cases, the main biomass products used are residues from wood industry, almond shells, cereal straws, ginning residues etc. From the aforementioned it is evident that the prospects of biomass usage in Greece are very promising. This is due to the fact that there is considerable potential, much of which is readily available. At the same time, the energy that can be produced is, in many cases, economically [37].
However, there are also significant disadvantages in biomass usage. Biomass fuels gave low energy density, collection and transportation can be cost prohibitive, Biomass usage for energy production requires a constant supply of fuels which are bulk and must be stored near the biomass plant. Additionally, there is also a constant requirement of other inputs which include water, crops and fossil energy which also have cost [38].
Therefore, although biomass usage for energy production is technologically well established, the price paid for electricity seldom offsets the full cost of the biomass fuel. It is clear that for the optimization of biomass exploitation for energy production a Decision Support System (DSS) is needed. This system must take under consideration biomass production as well as biomass accessibility, land uses etc. and provide managers with the optimal solution which will help them determine the best site for installing a biomass power plant.

2.3. MCDA and AHP

Multi Criteria Decision Analysis (MCDA) combined with Geographical Information Systems are valuable tools for the determination of the optimal solution for a problem. In general, MCDA is a sub-field of operational research which focuses on the development of decision support systems which can help in the resolution of complex problems which depend in a variety of criteria and parameters [39]. MCDA and GIS were used by many researchers for the solution of environmental problems. For the determination of the optimal solution to post fire regeneration [40], for the creation of an algorithm which will help on the determination of the optimal design of biomass supply chain networks [41], for determining the optimal location of a log yard [42] and the optimal usage of biomass for electricity generation [43].
Analytical Hierarchy Process (AHP) is an MCDA methodology introduced by Thomas L. Saaty. AHP is based on the determination of a goal as well as the criteria and alternatives which affect the achievement of the preselected goal. The pairwise comparisons among the criteria and the alternatives help the researchers to determine the weight coefficients of each of them. By determining the weight coefficients, the researchers know the level of effect to the final solution [44].
AHP in combination with GIS has been used for the selection of the optimal location of offshore wind farms [45], for performing solar farms feasibility analysis in India [46,47,48], for selecting the optimal location for solar PV power plants [49] and large wind farms [50,51], for reinforcing the hydropower strategy in Nepal [52] and for exploring geothermal resources and locations [53,54].
Fuzzy AHP is an enhanced version of the classic AHP methodology. The usage of fuzzy AHP for multiple criteria decision making requires scientific weight derivation from fuzzy pairwise comparison matrices [55]. Fuzzy AHP has been used in water loss managements in developing countries [56], for the evaluation of solar farms locations in Iran [57], for energy planning in Istanbul [58], for the evaluation of the capability of renewable energy sources to generate electricity [59,60,61,62], for the selection of solar-thermal plants investment projects [63], for creating spatial decision support systems for solar farm location planning [64], for selecting the optimal renewable energy type in Indonesia [65] and for analysing the assessment factors for renewable energy dissemination [66].
In this paper, we present a spatial DSS which based on the usage of Multi Criteria Decision Analysis (MCDA), fuzzy Analytical Hierarchy Process (AHP), Python programming will analyse a series of parameters and criteria affecting the selection of optimal installation sites and propose the optimal location. For the visualization of the installation site Geographical Information Systems (GIS) are used.
Multi criteria decision making using fuzzy Analytical Hierarchy Process is a powerful tool which enables researchers to explore various possible problem solutions and at the same time accepting the fact that the solution to a problem cannot only expressed as a binary result (yes or no). The usage of fuzzy techniques allows researchers to map the vagueness of an answer, by allowing the interviewed person to express an uncertainty to his answer. Furthermore, the usage of AHP, a well-established multi criteria decision making method can easily identify the weight coefficients of the problems criteria and thus allow the researchers to map the optimal solution more efficiently.
The combination of the aforementioned methodologies (MCDA and fuzzy system elements) with a spatial analysis tool like Geographic Information Systems can enhance the produced results by allowing researchers to determine more efficiently the locations were biomass energy production plants can be installed by determining the overall biomass potential.

3. Methodology

Energy produced from a biomass plant is directly related to the amount of biomass available as well as to the amount of accessible biomass in the wider area. The greater the amount of biomass available in a given area the greater the potential of electricity generation [67].
The information on biomass availability in Regional unit of Drama was provided from two sources, the biomass potential from shape files created from the Greek Centre for Renewable Energy Sources (CRES) and data regarding farms which were provided from the department of environment of Regional unit of Drama.

3.1. Criteria Selection

The installation of a biomass energy production plant is affected by some factors which can be classified in three main categories: Technical, Economic and Environmental. These factors depend on the geographical location, the socio-economical structure of the studied area and the biophysical attributes.
All of the aforementioned factors were expressed as GIS layers. For the creation of these layers’ fuzzy logic and fuzzy membership functions were used. Each layer has a value ranging from zero to one. The value of one represents the most suitable site for the installation of a biomass energy production plant while the value of zero represents the least suitable site for installation of the plant. The Analytical Hierarchy Process was finally used to combine the three layers as well as the layer of human and environmental limitations (exclusion zones). The resulting layer provided the most suitable areas for the installation of biomass energy production plants in Regional unit of Drama.

3.2. Human and Environmental Considerations

Prior to selecting the most suitable locations for the installation site we must exclude the areas were due to legislation, human or environmental considerations we cannot propose the installation. These locations include cities, villages, settlements, lakes, roads, protected areas, rivers, wetlands, agricultural lands, wetlands etc. Greek legislation under law 2742/1999 regarding the National spatial planning and sustainable development clearly defines the areas were the installation of RES is forbidden (Table 1). These limitations were ultimately combined in a separate layer (Constraint Layer).

Constraint Areas Fuzzy Datasets

Current land use is one of the main criteria which affect the installation location. Water bodies, protected areas, urban and residential areas, roads, railroads and steep slopes cannot be used for the installation of the proposed power plant. Additionally, agricultural land, land covered by orchards or other high productivity areas cannot be used [76].
As a result, only areas with poor vegetation, logged areas or barren land can be considered as ideal locations.
For this reason, a buffer zone must be created around these areas. The buffer zone acceptability regarding the installation increases from zero to one from the border of the arable land to a distance of 400 m from that border [72].
Figure 4 shows the fuzzy membership value (μ) for land. Values between zero and one represent the land suitability inside the buffer zone. Clearly the suitability equals one outside the buffer zone.
Data for the land uses in Regional unit of Drama where obtained from the CORINE programme. The fuzzy membership function considering that restriction is:
μ P A = { 0 ,   x 100 x 100 300 ,   100 < x 400 1 ,   x > 400
where: x, is the distance from the arable land, orchards etc. and μPA is the fuzzy membership function.
The power plants cannot be installed inside heavily forested areas or protected areas, therefore the buffer zone created around these types of areas is expressed through the following membership function:
μ F = { 0 ,   x 100 x 100 400 ,   100 < x 500 1 ,   x > 500
where: x is the distance from the protected or heavily forested areas and μF is the fuzzy membership function.
Similarly, we cannot propose as a potential installation site area inside or in close proximity to urban areas, water bodies and over road or railroad network. The membership function for the exclusion of this areas are:
μ u = { 0 ,   x 1000 x 1000 4000 , 1000 < x 5000 1 , x > 5000
μ w b = { 0 , x 200 x 200 200 , 200 < x 400 1 ,   x > 400
μ r r = { 0 ,   x 100 x 100 300 ,   100 < x 400 1 , x > 400
where μu, μwb and μrr are the fuzzy membership functions for urban areas, water bodies and rail and road network.
The last fuzzy membership function is created for determining the slope value. Slope is a topographic feature which is strongly related to the overall project cost. In order to select the optimal site, the slope value must be low. In any other case the accessibility of the plant will be reduced because trucks cannot access steep slopes and furthermore the overall construction cost will rise due to excavations or embankments. For the determination of slope, the Digital Elevation Model (DEM) of Regional unit of Drama was created based on satellite data provided by the Copernicus programme. From the DEM, the slope map was created, each cell of the raster slope map contains a slope value. The fuzzy membership function for the slope is:
μ s = { 1 ,   x 3 10 x 7 ,   3 < x 10 0 , x > 10
whereas x is the slope value expressed in percentage.
One of the constraint layers was modelled as a raster layer in GIS with a 50 m spatial resolution. Finally, all the constraint layers were multiplied together and formed the final constraint layer. Areas with value of zero will also be zero in the final layer. For example, if a location is inside a river buffer zone the location’s value will be zero (fuzzy membership function is zero), the final constraint layer will be also zero even if the values of all the other layers are one. Areas with value of one in all sub layers will also have a value of one in the final constraint layers and are the most prominent areas because they lack restrictions. Finally, locations with values between zero and one will receive a final score based on the multiplication of each layer’s values.

3.3. Techno-Economic Criteria

The amount of available biomass plays a key role in the selection of the proper installation site. For this reason, the biomass potential database provided by the Centre for Renewable Energy Sources (CRES). The database the entire regional unit and includes the following data:
  • Point sources of biomass
  • Arable crops
  • Greenhouse crops
  • Tree crops
  • Vineyards
  • Forests
The aforementioned data provide the residues from these types of cultivations for the various municipalities inside Regional unit of Drama and they are estimated in tones.
Figure 5 represents the biomass potential for the municipalities of Drama (in light blue). The biomass potential was calculated by adding the individual data provided by the database of CRES. Higher values are depicted in yellow, orange and red, while lower values are depicted in shades of green.
Another essential factor is the availability of transport links (railroads and road network). It is easier to move supplies through the existing transport network. Furthermore, the existence of transportation network reduces the cost and the probable damages to the environment which can be caused by the creation of new network. The maximum acceptable distance varies depending on the study. Our approach values potential locations near roads and railroads to be of better value compared to other potential sites which are further from the transportation network. Similar approaches have been made by researchers trying to allocate the optimal installation sites for other types of RES like wind farms and P/V farms [77,78,79].
The membership function describing the distance from the transportation network is:
μ t = { 1 ,   x 500 1000 x 500 ,   500 < x 1000 0 ,   x 1000
whereas x is the distance from the transportation network and μt is the fuzzy membership function.
Additional techno-economic criteria that must be taken under consideration is the proximity to farms and to the energy transfer grid. Proximity to farms is important because they constitute a continuing mean of biomass production from animal wastes. Studies have shown that animal waste can efficiently be used for energy production [80,81,82,83].
The membership function describing the distance from farms is:
μ f = { 1 ,   x 500 3000 x 2500 ,   500 < x 3000 0 ,   x > 3000
whereas x is the distance of the potential installation site and the farm location and μf is the membership function. From Equation (8) it is evident that the optimal installation locations are the ones which are 500 m or less from farms, less preferred location are inside a zone ranging from 500 m up to 3000 m and the least preferred locations are the ones which are located 3000 m or more from farms.
The final techno-economic criteria which must be taken under consideration is the distance from the existing energy transfer network. This criterion is similar to the proximity to the existing transportation network. Locations that are closer to the existing transfer network are preferred compared to locations which are further. The main reason is that the connection of the biomass power plant to the existing energy grid will be more economical and the environmental disturbance will be minimal. The member transfer function describing the distance from the transportation network is:
μ t e = { 1 ,   x 100 1000 x 900 ,   100 < x 1000 0 ,   x 1000
whereas x is the distance of the potential installation site and the energy transfer network and μfe is the membership function.
Membership function described from Equations (7)–(9) can be depicted in the following diagram (Figure 6).

3.4. AHP

Analytical Hierarchy Process (AHP) is a well-established Multi Criteria Decision Methodology which is widely used in optimizing decision making [44]. It provides a comprehensive framework for structuring a decision problem, representing and quantifying the comprising elements, relating those elements to goals and evaluating possible solutions.AHP is based on pairwise comparisons among the criteria and the parameters affecting the achievement of a goal [44].
AHP is widely used in the field of sustainable energy [45,49,50,51].
The implementation of AHP involves the following steps [44]:
  • Determination of the goal, the alternatives involved in reaching this goal and the criteria affecting the alternatives.
  • Definition of the priorities among the alternatives by performing pairwise comparisons (Table 2).
  • Synthetization of the priorities to yield a set of overall priorities for the hierarchy.
  • Consistency check.
  • Final decision.
In this study, we used PYTHON code for performing the AHP methodology in GIS. The code allows the determination of matrices for each criterion and alternative and performs the comparisons based on the user inputs. At the end, it provides the weight coefficients and performs a consistency check of the results.
For implementing the analysis, we defined a tree, with nodes for the criteria and the alternatives:
 +--(alt. a)
    +--[node 1]--+--(alt. b)
    |    +--(alt. c)
[root]--+
    |        +--(alt. a)
    |    +--[node 2.1]--+--(alt. b)
    |    |     +--(alt. c)
    +--[node 2]--+
        |    +--(alt. a)
        +--[node 2.2]--+--(alt. b)
The example represents a two level AHP tree, having 4 nodes and 3 alternatives. there are three ‘edge nodes,’ known as “node 1,”“node 2.1” and “node 2.2.”
An example of the code used to calculate weight coefficients inside a node is shown below:
def__wc(n):
if not isinstance(n, AHPTreeNode):
return;
ret = {};
   # first, we process childrens
forch in n.iter_childrens():
ifisinstance(ch, AHPTreeNode):
    w = ch.calculate_weights();
    d = __dive(ch);
if d != None:
ret[ch.get_name()] = (w, d);
else: # leaf
ret[ch.get_name()] = w;
    ##
if ret != {}:
if n == self__TreeRoot:
     w = n.calculate_weights();
return {‘Root’: (w, ret)};
else:
return ret;
else:
return None;

4. Results

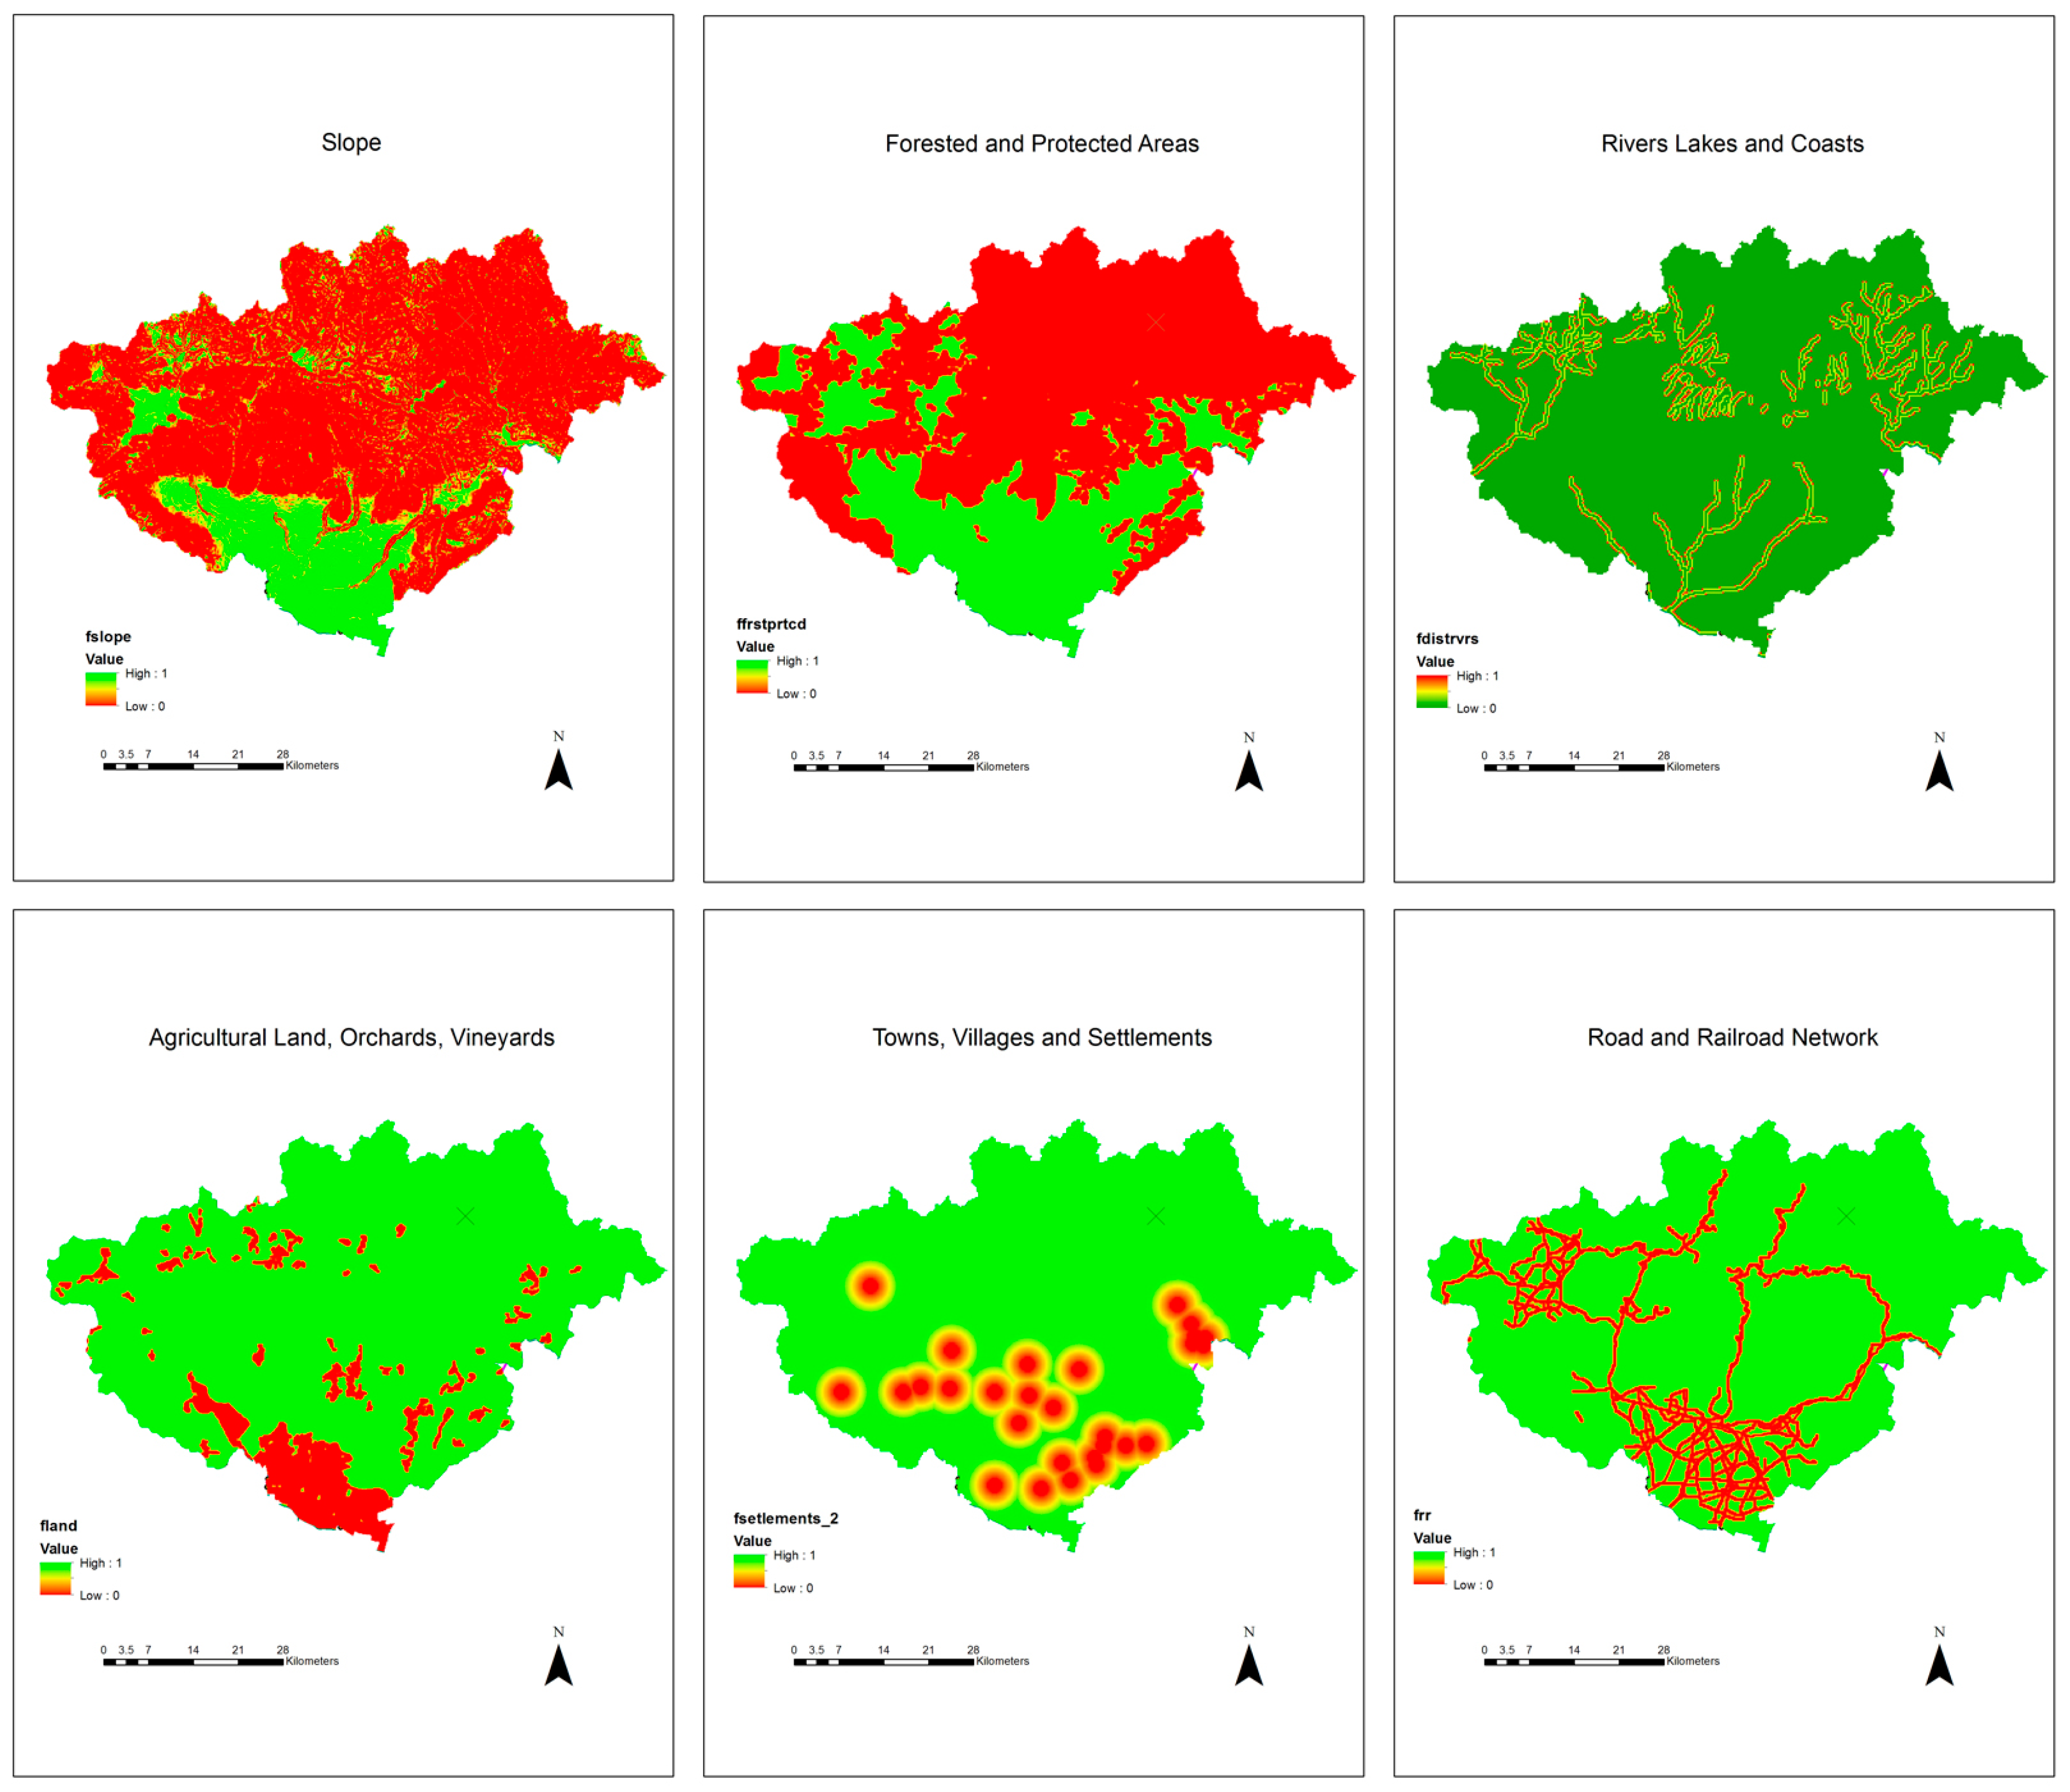
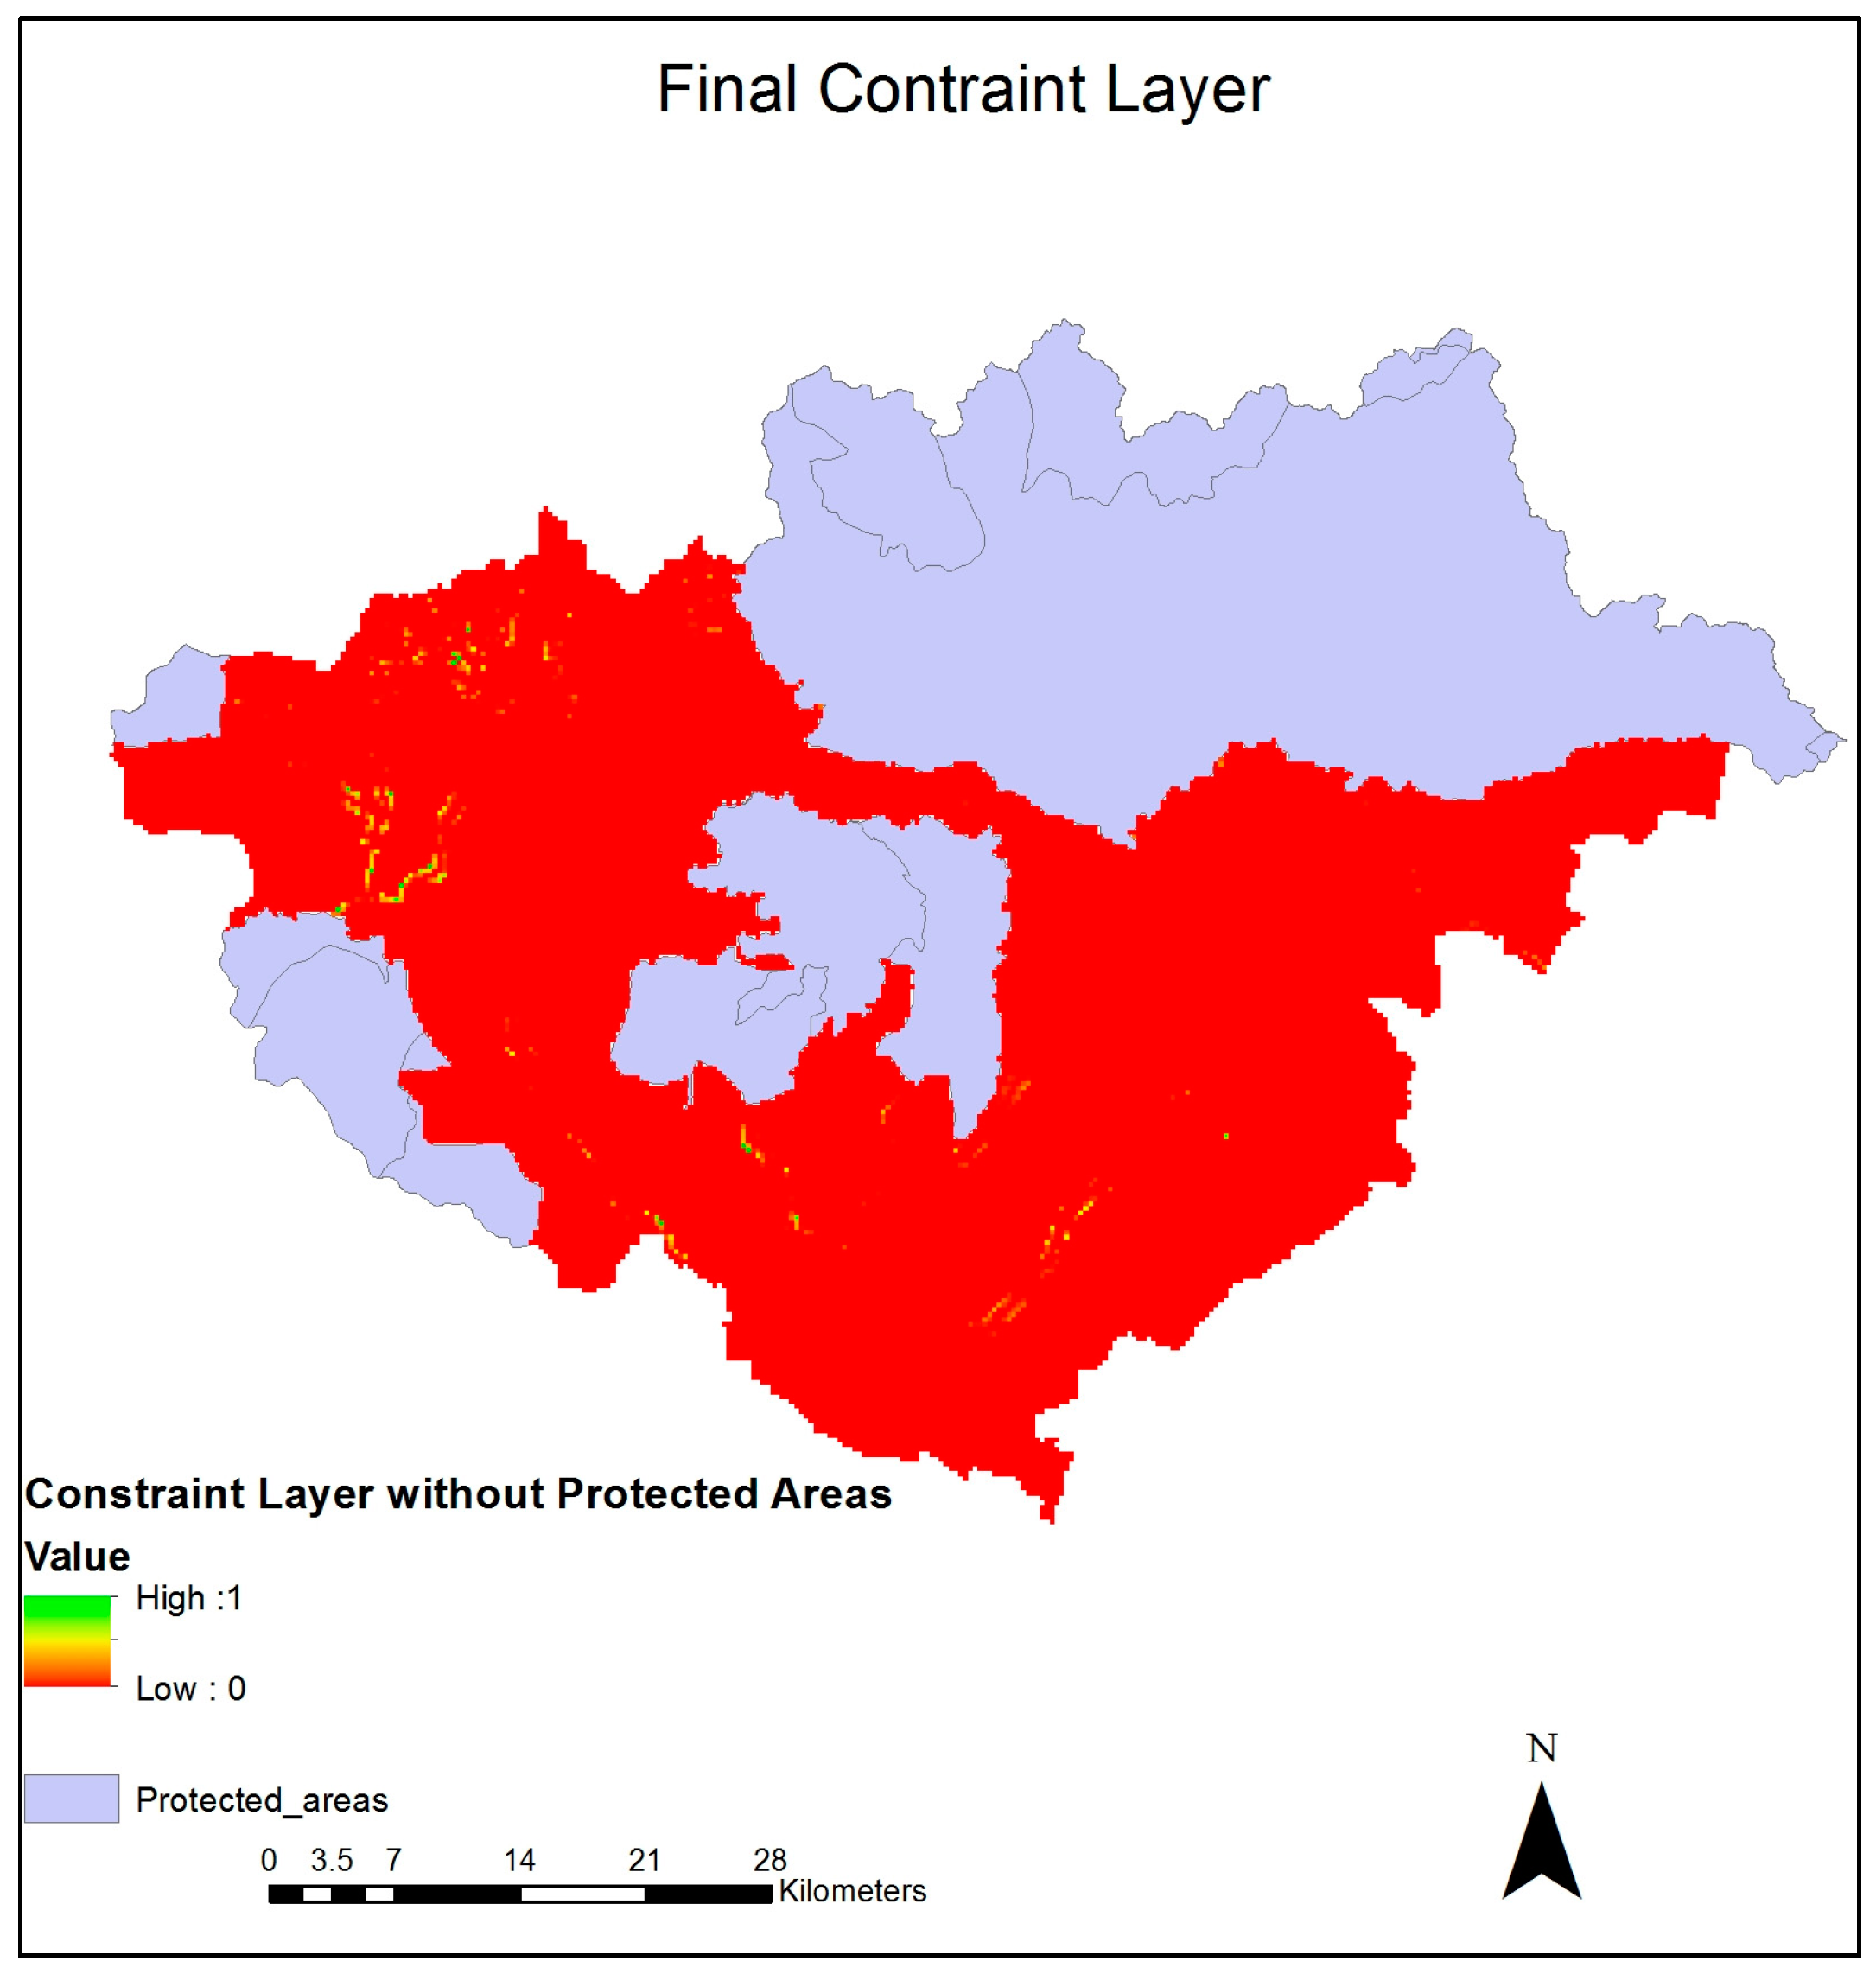
4.1. Constraint Layer

The Constraint layer has been produced by the multiplication of the individual constraint layers (slope, heavily forested and protected areas, rivers lakes and coasts, Agricultural land, pastures Orchards, Urban areas (towns, villages, settlements) and distance from Road and railroad network).
Figure 7, presents the constraint layers after the implementation of the fuzzy membership functions for each layer. Areas in shades of green are more suitable for the installation of the biomass energy production plant. Areas in shades of yellow are less suited and finally areas in red are not suitable for installation. The final constraint layer is presented in Figure 7. From this layer, we have excluded protected areas (Natura 2000, Ramsar sites etc.) regardless of their capability to support the installation, as Greek legislation prohibits the exploitation of these areas.
Figure 8 presents the result from the multiplication of the individual layers. The areas in purple are excluded as possible installation sites because they are protected. Areas in red are the least suitable for installing the power plant, whereas areas in green and yellow are the most suitable.

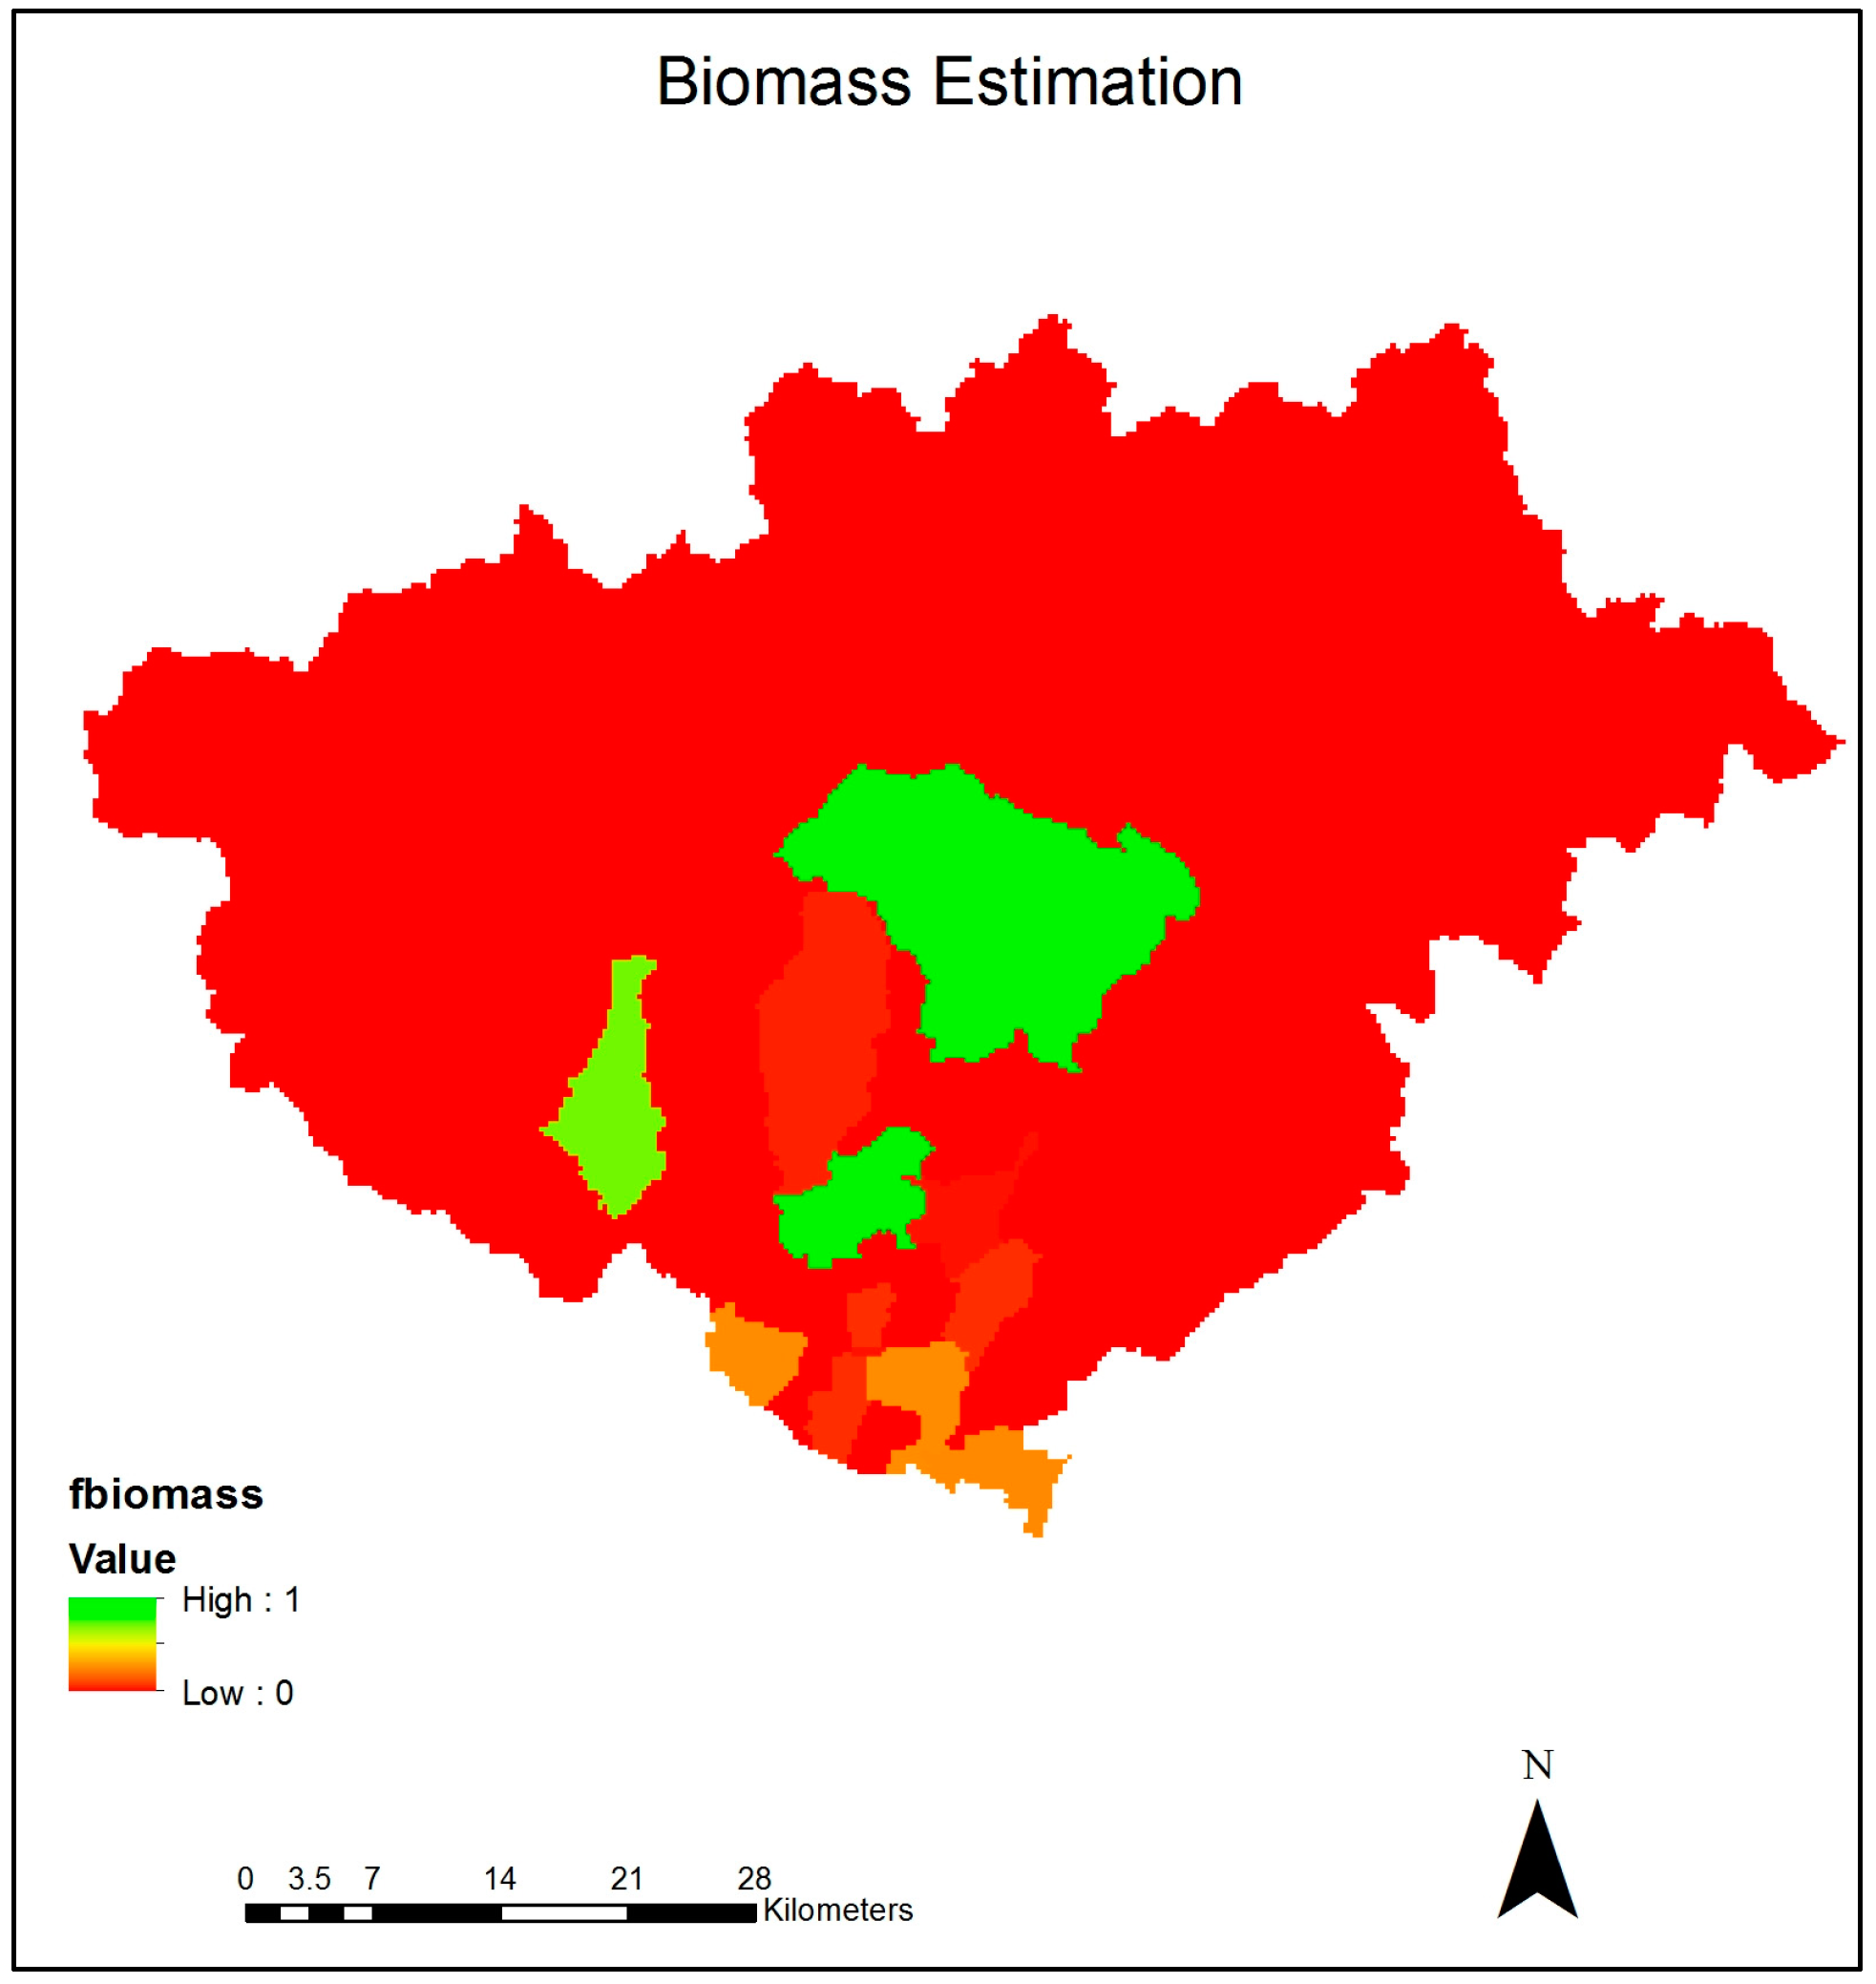
4.2. Biomass Potential

Figure 9 shows the total biomass potential of Regional unit of Drama. As it is apparent the amount of biomass varies in the regional unit. Areas depicted in red colour have low biomass potential whereas areas in orange and yellow are more suitable for exploitation. Finally, areas in shades of green are the most suitable for the installation of power plant that exploit biomass.

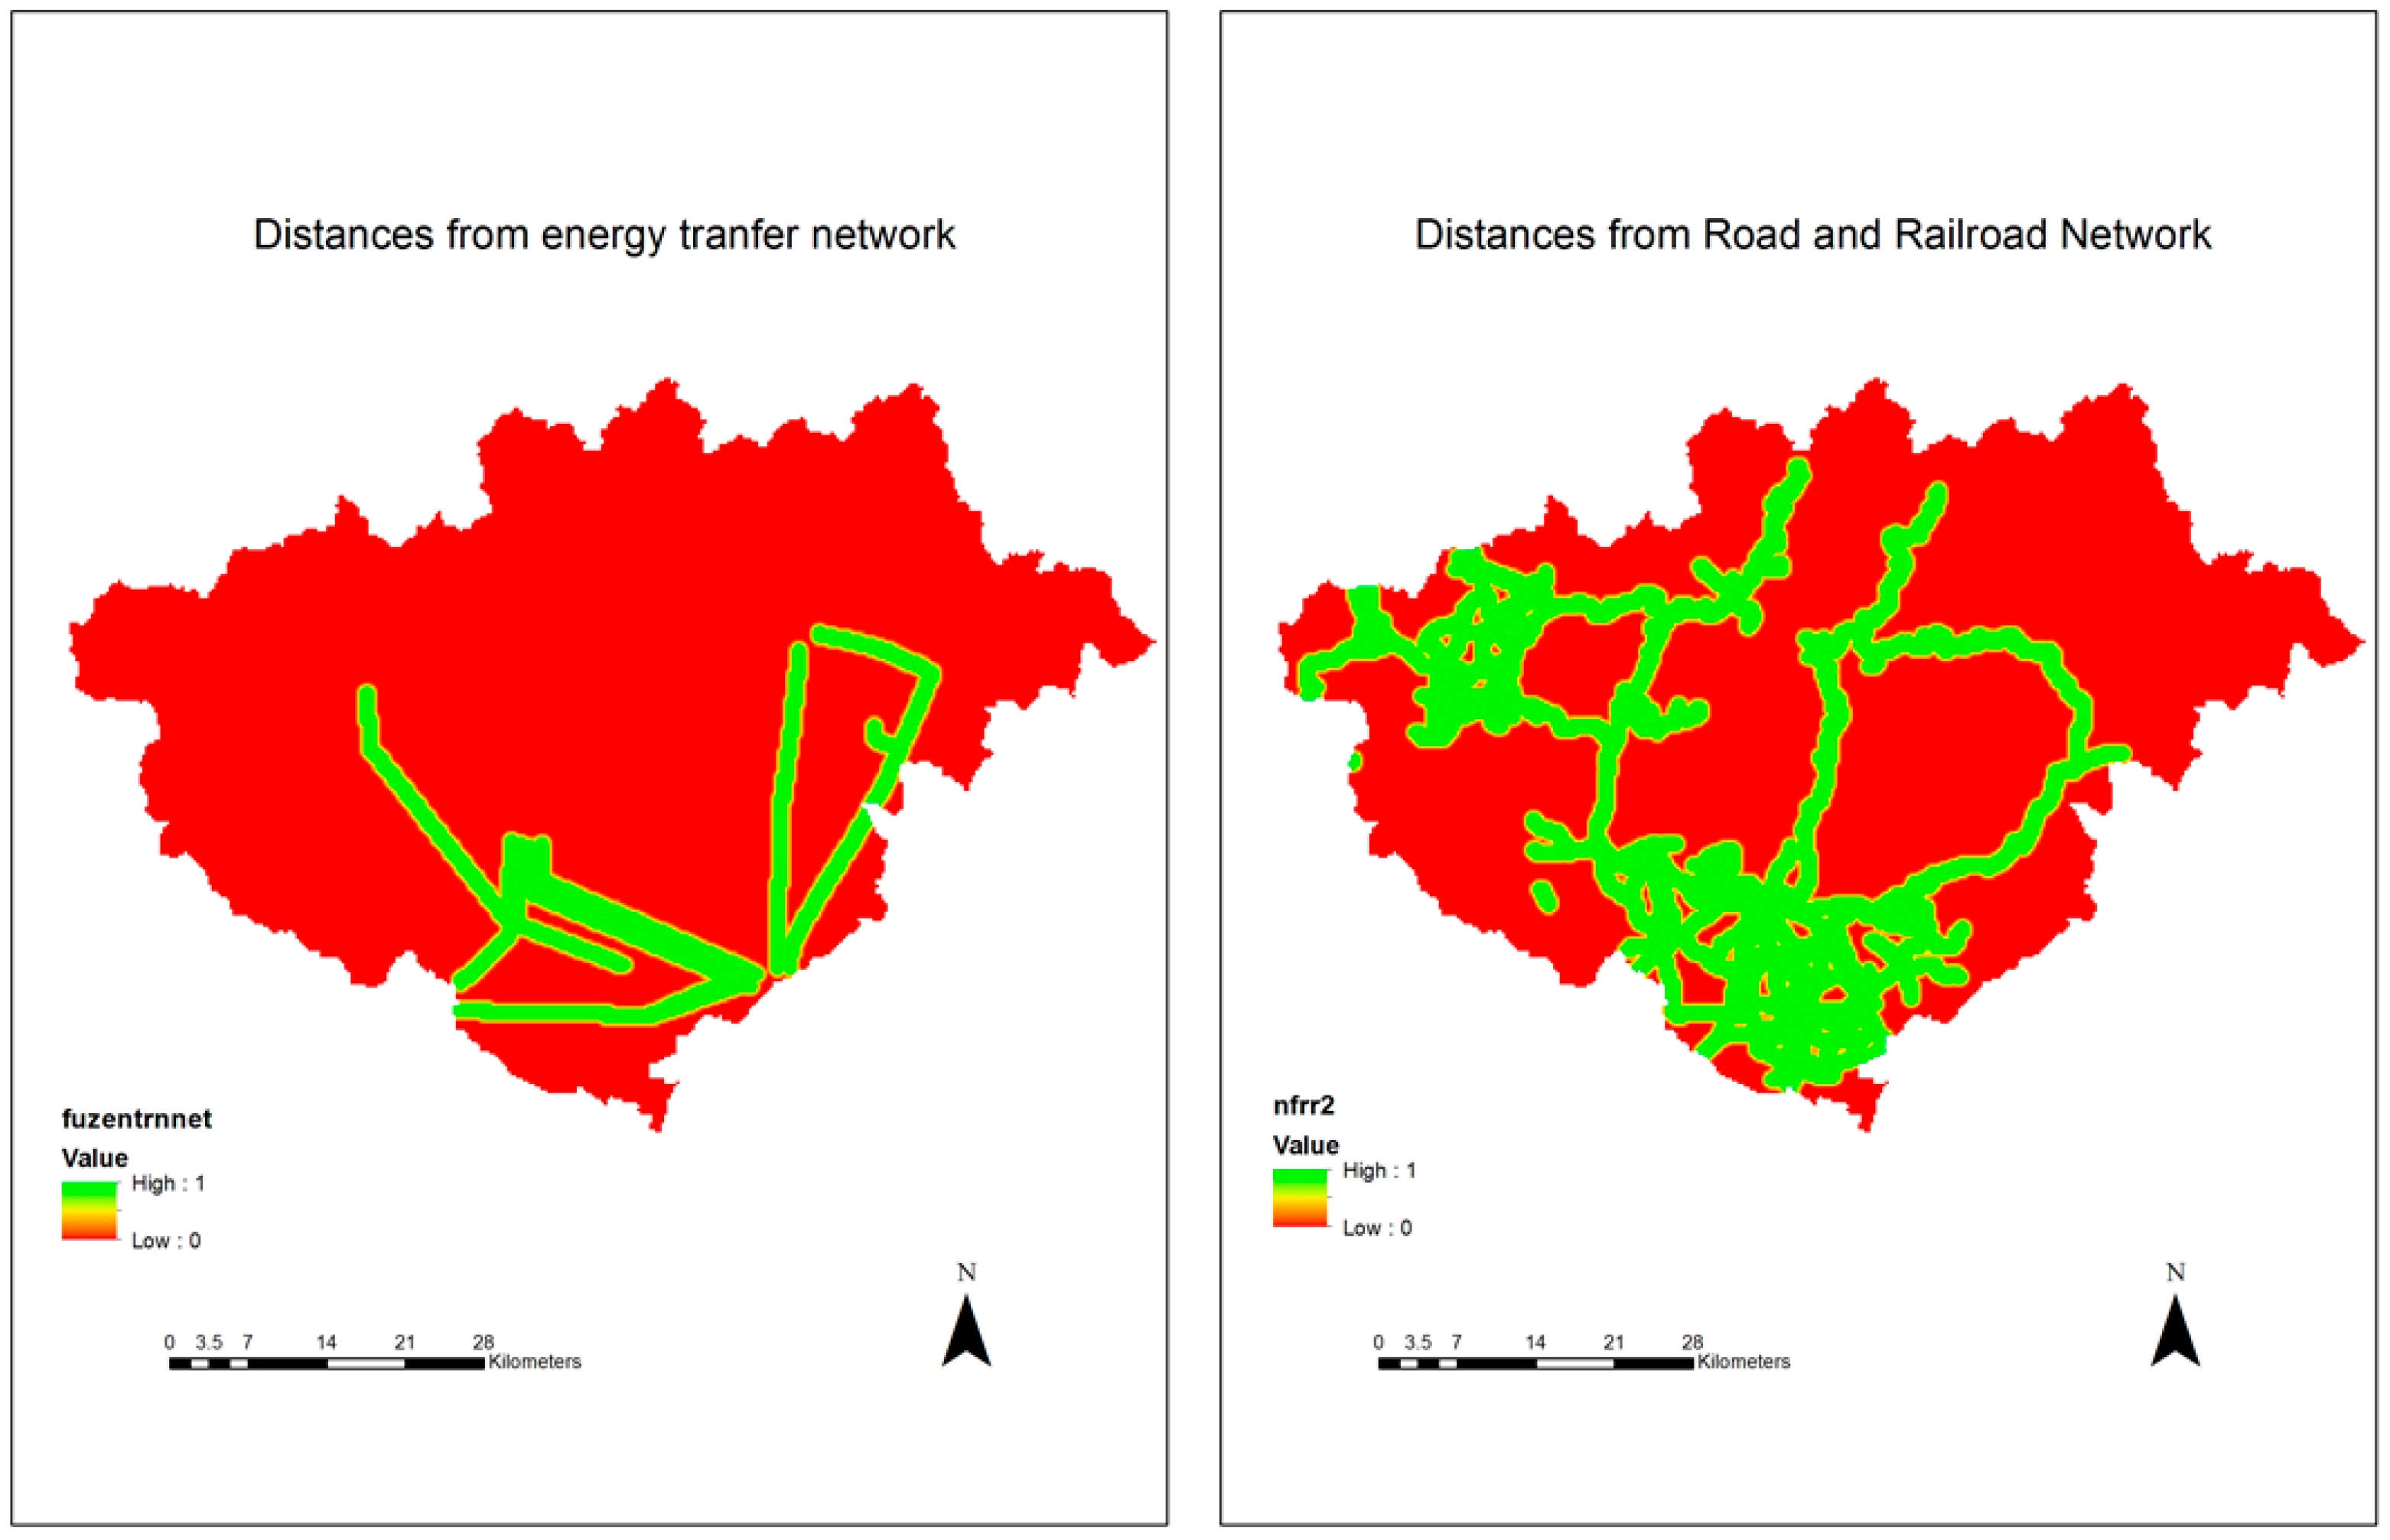
4.3. Access to Transportation Network and Energy Grid

The access of the proposed installation site to the current transportation network as well as to the current energy grid plays a vital role. Almost all areas of the regional unit outside the protected areas have good access to the road network. The energy transfer grid depicts only medium and high voltage power lines which are suitable for long distances transfer (Figure 10).

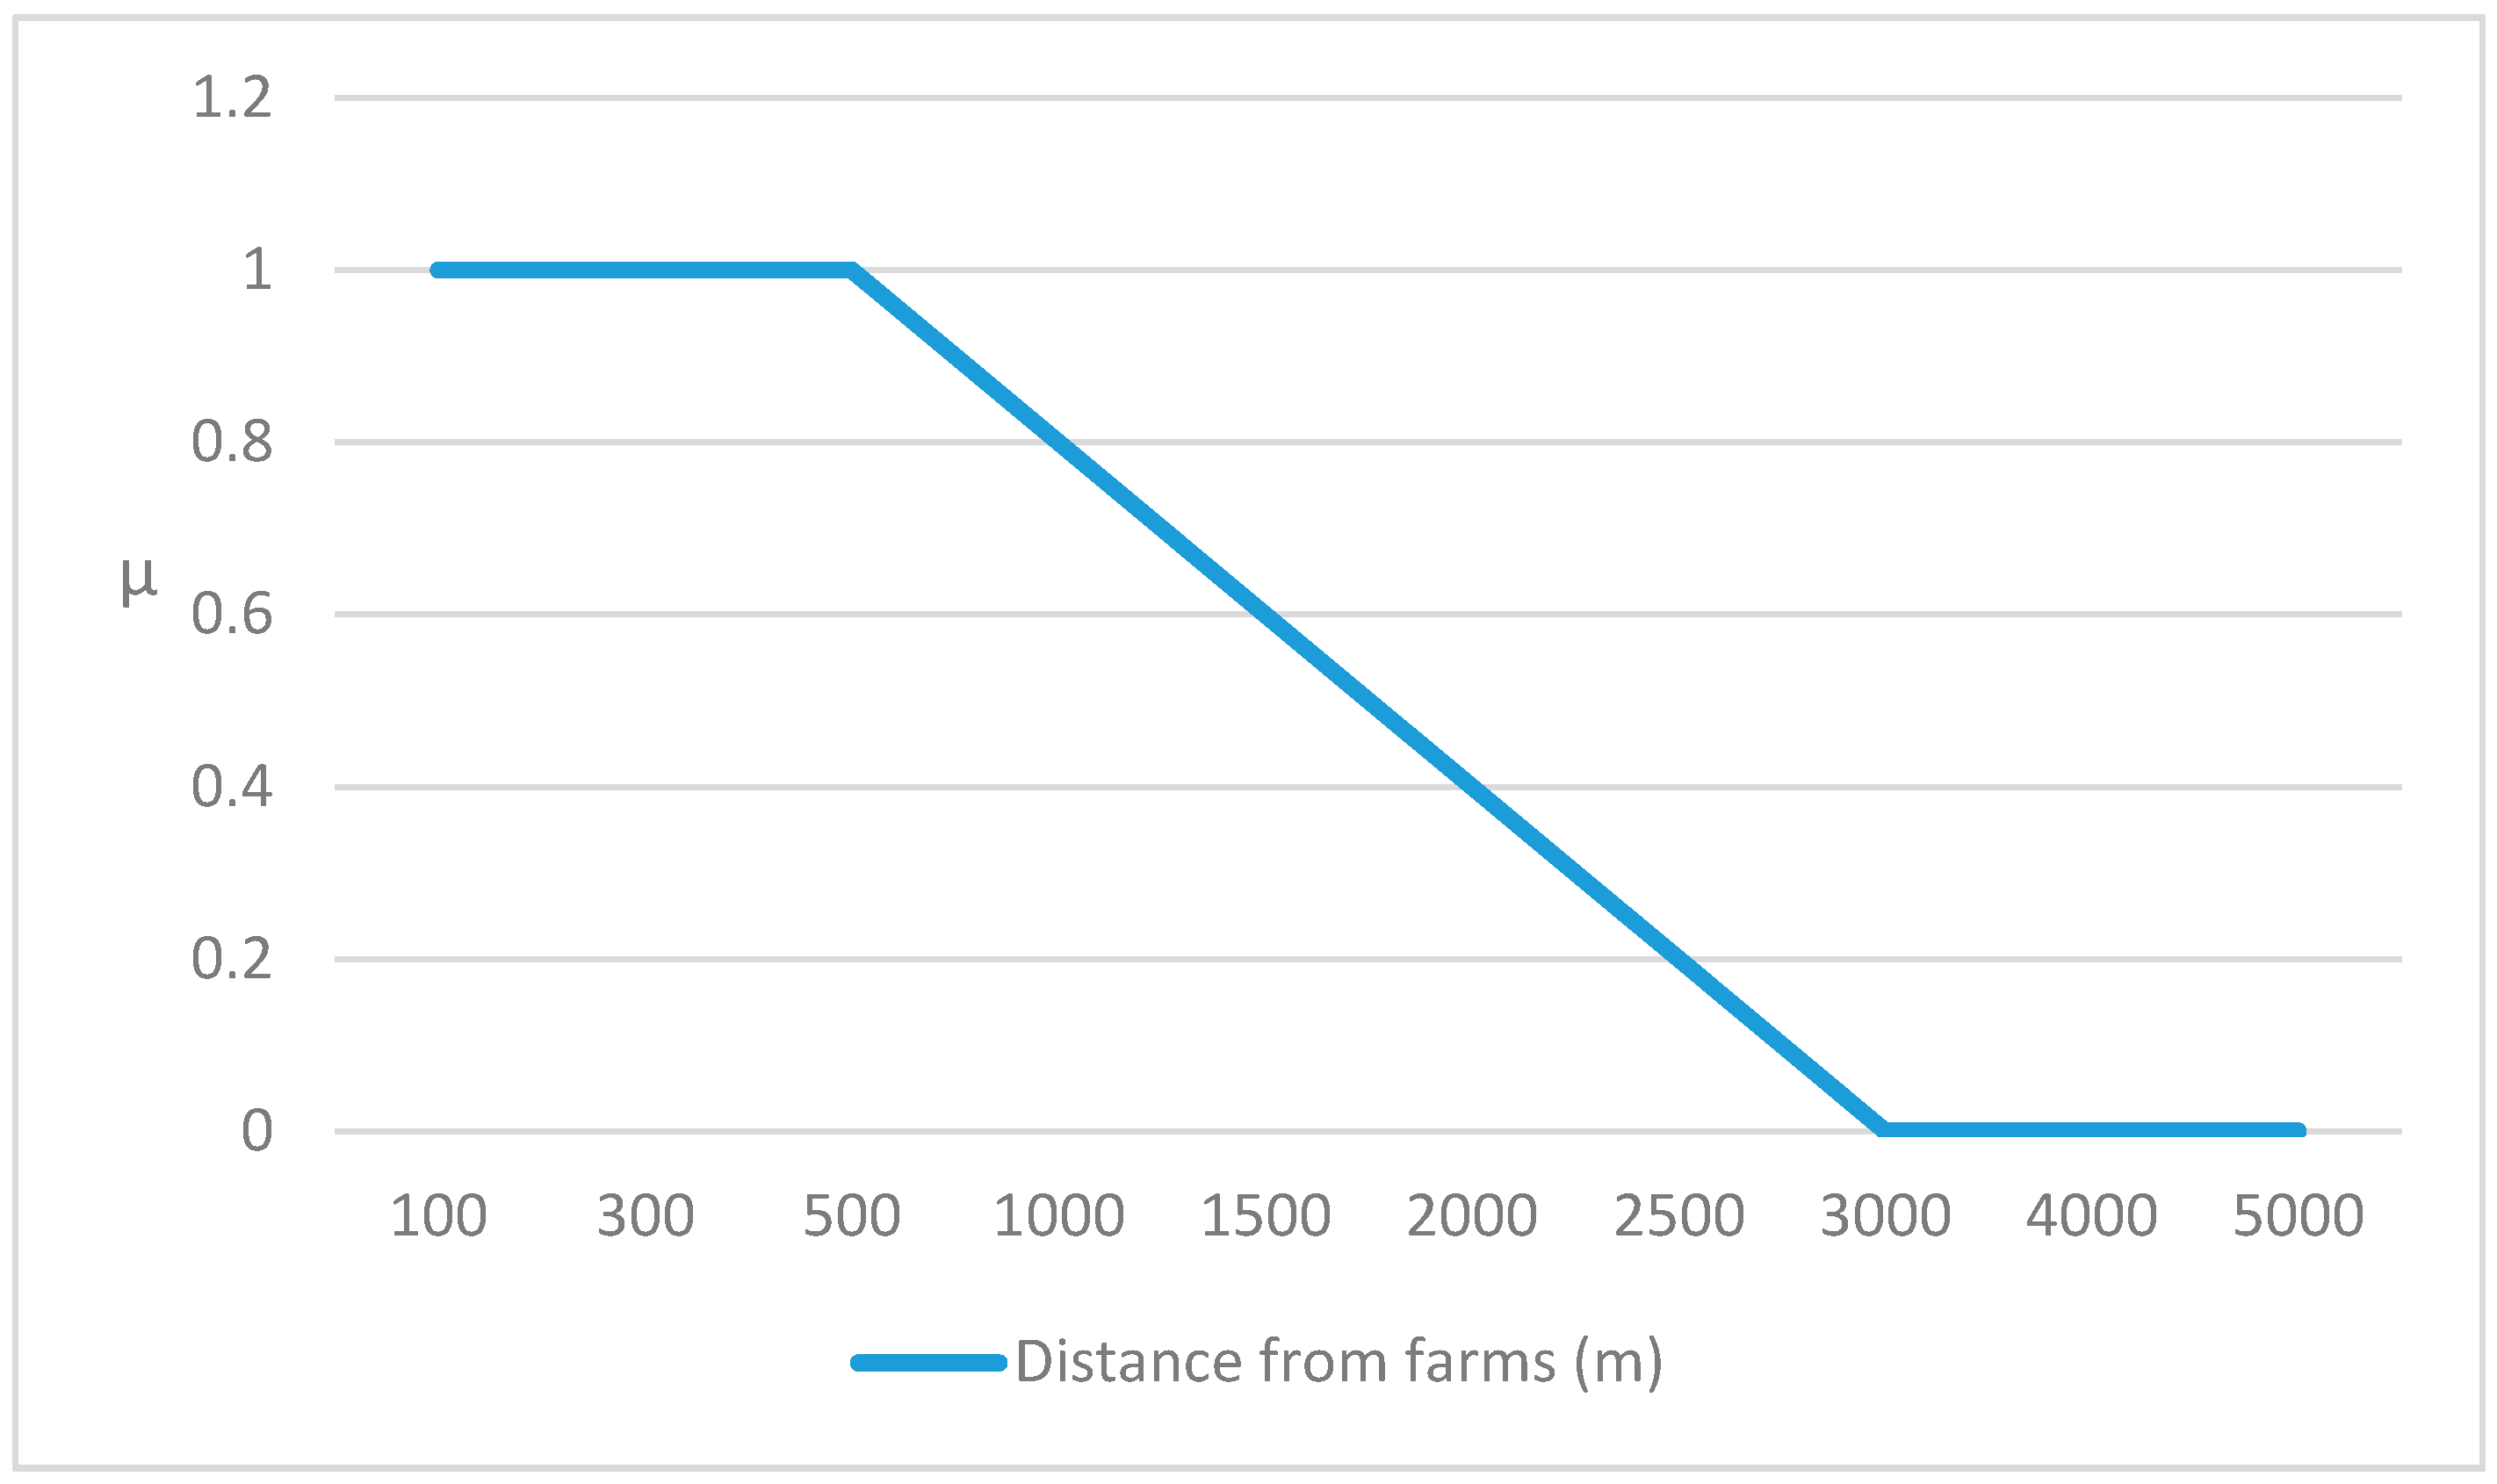
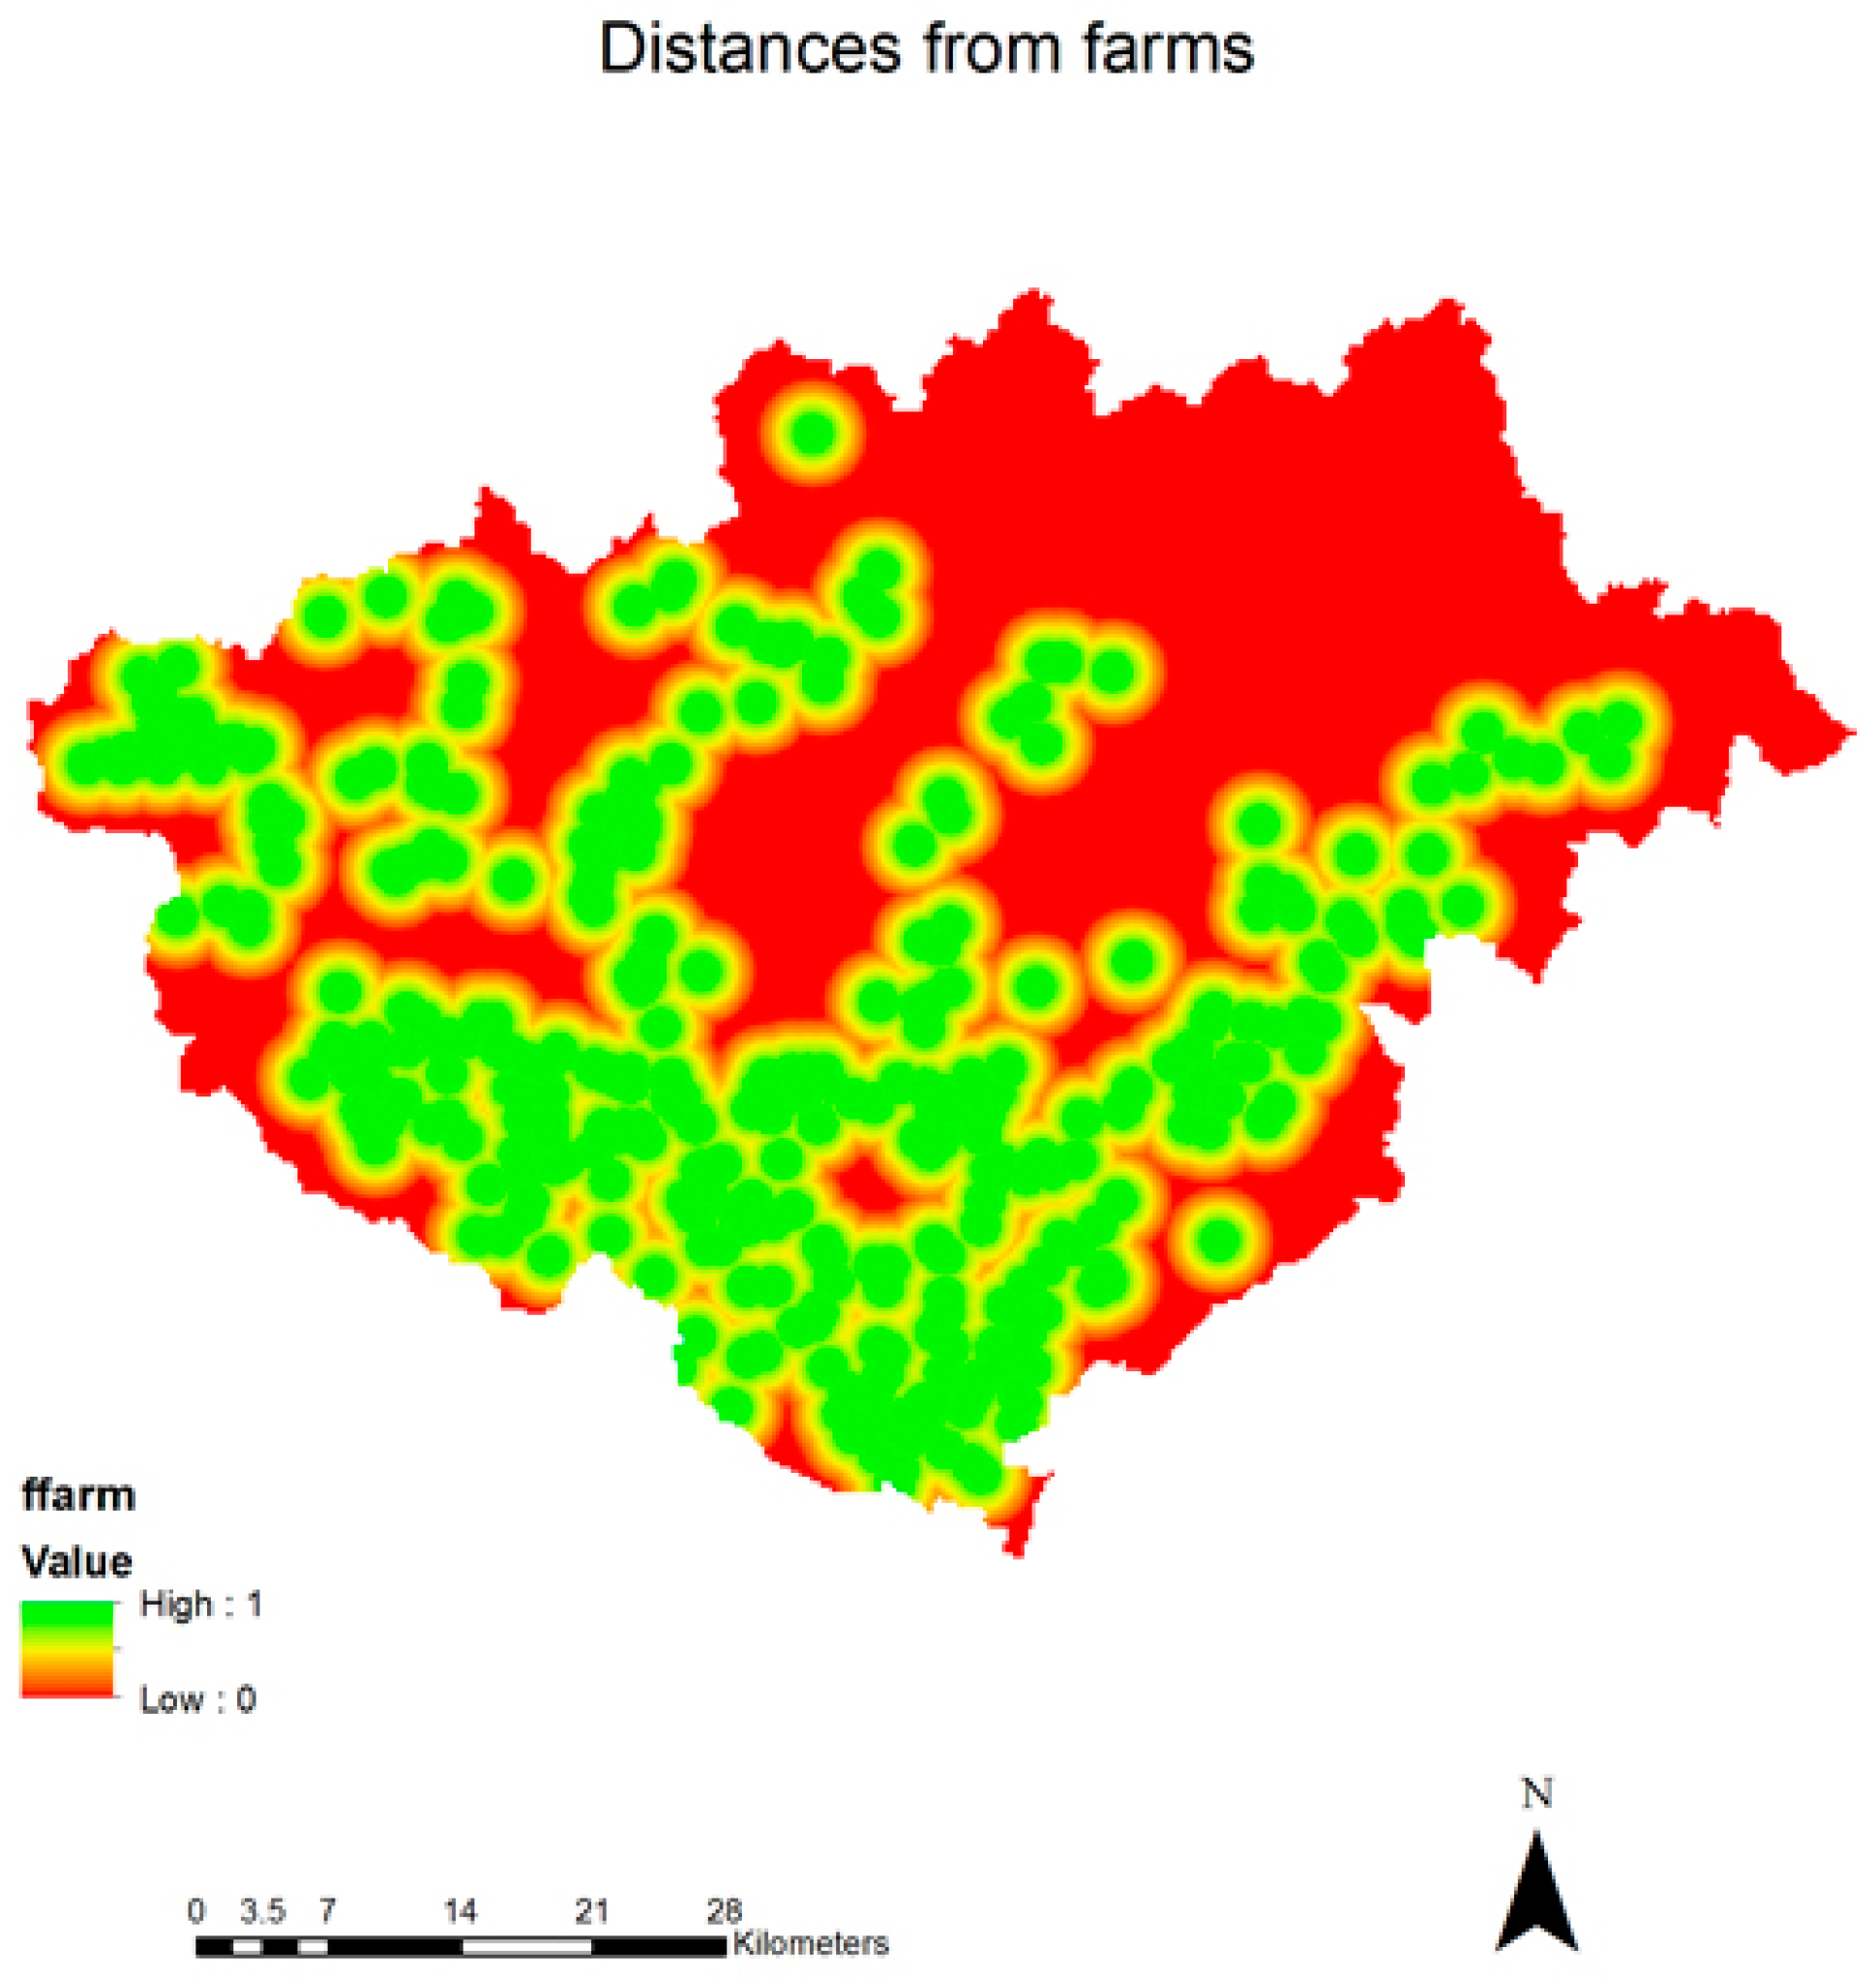
4.4. Distances from Farms

Data for the location of farms in Regional unit of Drama were provided from the Department of Environment of the regional unit. The data include the locations of currently running farms and in a shape file and were transformed to raster using the GIS software (Figure 11).

4.5. Determining Suitable Land

Finally, the aforementioned criteria were compared using the AHP methodology implemented in PYTHON. The importance of each criterion was set based on the opinions of experts as these were depicted in similar studies. Therefore, the greatest weight was given to the constraint layer, which determines the land suitability at the first level of the research. The second most important weight coefficient was the biomass potential of the area, followed by farm proximity, proximity to the energy grid and finally proximity to the current transportation network (Table 3).
For the determination of the suitable installation locations, areas which have a fuzzy value of zero in all layers were excluded at the beginning. Then the layers were combined based on the coefficients presented in Table 3. At the end, the final layer was created based on AHP (Figure 9).
Four suitability levels were created based on the fuzzy membership functions of the location, unsuitable (0, 0.3), poor (0.3, 0.5), good (0.5, 0.7) and excellent (0.7, 1). Figure 9 presents the result for Regional unit of Drama. It should be pointed out again that the areas on the North and West of the regional unit (in purple) are protected areas, which are not available for exploitation according to Greek legislation.
From Figure 12 it is also clear that only a small portion of the entire regional unit area is available for exploitation. However, these areas if managed properly are sufficient for providing sufficient energy.

4.6. Results Validation

For the areas with suitability levels good or excellent (Figure 9) an effort was made to estimate the biomass potential based on the maps provided by CRES. These maps include arable crops, greenhouse residuals, tree crops, vineyards and forest residuals. The results of the estimation showed that although the selected areas represent only the 8% of the total area of the regional unit of Drama the biomass potential is estimated to be 25.5% of the total biomass potential. This corresponds to approximately 586.067 tones of biomass available for energy production.
This result must be enhanced by incorporating in these areas the number farm situated in these regions. The spatial analysis showed that in these areas there are a total of 44 farm units which can further enhance biomass production.
These results also show the efficiency of the proposed methodology by evaluating an entire regional unit and localizing the proposed installation locations to a small fraction of the total regional unit’s area.

5. Discussion

Renewable energy sources are expected to play a vital role in energy production in the future. Both the environmental degradation caused by the usage of fossil fuels as well as the legislation framework developed, aim toward the dissemination and increase of their usage. Although there are a variety of RES forms, it is up to the managers to select the most appropriate type, in each case, based on the environmental constraints and production characteristics of the region under investigation, as well as the type that causes the least reactions from citizens [84,85]. The exploitation of national RES potential contributes both to the diversification of the national energy mix and to the security of energy supply, while at the same time strengthening the development of the local and national economy [31].
During the last years, the adoption of common European policies on energy sector, mainly in relation with the necessities underlined by international contracts to limit greenhouse gases, has affected both the European and National energy systems. In particular, an increasing penetration of RES is observed both in power generation as well as the final usage of energy.
Renewable energy sources constitute a key element for enabling global energy policy, with biomass in particular representing an important factor in meeting energy demand towards a more autonomous growth in global scale [86].
Biomass can be used to meet energy needs, either by direct combustion or by conversion to gaseous, liquid and/or solid fuels by thermochemical or biochemical processes. The exploitation of biomass usually encounters the disadvantages of large spreading, large volumes as well as the difficulties of collecting-processing-transporting-storing it is very important that the usage of biomass for energy production must be performed as close as possible to its place of production [37].
Therefore, it is common that the society's attitude toward such types of investments is sometimes negative, mainly due to the fact that the resulting energy production facility causes environmental disturbance to a certain level. Under this scope the Greek state has legislated an extensive framework which clearly defines the rules towards the installation locations of RES facilities in general and Biomass energy production plants in particular (law N2742/1999 regarding the National spatial planning and sustainable development).
The purpose of the paper was achieved by determining the locations where, after research, the optimal conditions exist, for biomass exploitation and therefore, managers can achieve the best possible results both in terms of energy production as well as in terms of minimization of environmental disturbance and economic impact. Additionally, the selected locations are compatible with the legislation regarding RES investments as it is described by N2742/1999.
The aforementioned were performed by providing a framework for a spatial Decision Support System which can be used in order to determine the optimal locations for biomass power plant installation. The research takes under consideration the current biomass production as well as environmental and techno economic constraints related to the final location selection.
The usage of AHP allows the determination of the weight coefficients of each constraint with great accuracy and thus makes the result of the analysis more objective. AHP can be used in two distinctive ways within a GIS environment. It can be either employed to derive the weights associated with suitability map layers or alternatively the AHP principle can be used to aggregate the priority for all level of hierarchy structure including the level representing alternatives. (Malczewski). Fuzzy datasets are used to further enhance the results. In a complex land-use suitability analysis, like the one performed in this paper, it is difficult, (or even impossible) to provide the precise numerical information required by the conventional methods based on the Boolean algebra. In conventional approaches a cut-off (a constraint or threshold) is defined as ‘the acceptable site must be located within 1 km of a river,’ for example. Such a cut-off however is not a natural one [85]. Fuzzy datasets enhance the results by allowing the determination of areas that are between these two cases. Thus, allowing mapping an area more accurately and combining results from different constraints with higher accuracy. This approach manages to deal with impression and ambiguity in the input data (attribute values and decision maker’s preferences [85]. The end result of this approach is the creation of a detailed map which depicts the most suitable locations for the installation of a biomass energy power plant. After the proposal of the most suitable locations, managers should perform visits to the areas for selecting the final installation locations.

6. Conclusions

One of the advantages of the proposed framework is that it can be easily modified in order to study other types of RES by simply modifying the relating criteria. The results of the framework can be further enhanced by incorporating more criteria and alternatives, using high resolution satellite data etc.
The energy produced in the selected areas can be increased by using sludge and other urban waste water. Wastewater reuse in forest plantations has several advantages including rehabilitation of fragile ecological zones, reduced discharge of wastewater into natural water bodies and thus reduced pollution of aquatic ecosystems [87].
The usage of this DSS and other similar methodologies constitutes a valuable tool for energy planning in regional and national level, shaping the framework of investment activities, thus contributing to the implementation of the country’s development policy.
It is important to form the appropriate policies which will promote and encourage at the same time the cultivation of energy crops for energy production. A key problem of biomass related projects is funding. Therefore, it is very important to investigate alternative means of funding. Additionally, it is also very important to simplify procedures and to minimize delays regarding the environmental licensing of these types of projects.
The results of this research are very useful, both to the scientific community for further research and review and to the managers which perform energy planning. Furthermore, the results can provide the Greek state with a tool for decision making both in energy planning as well as in environmental protection.
Additionally, it is very important for the Greek state to take under serious consideration the increasing biomass volumes and modify the legislation framework. Finally, it could be possible to modify the existing power transfer network for the exploitation of energy production from biomass and reduce the stress of Public Power Corporation, especially in high demand periods.
Further improvements of the proposed methodology can include the capability of scenarios with the aim of developing a sustainable methodology for alternate locations [88] or other mapping techniques [89], which can be used to further enhance the spatial multicriteria analysis.

Author Contributions

Konstantinos Ioannou and Georgios Tsantopoulos designed the model and the computational framework and analyzed the data. Konstantinos Ioannou carried out the implementation, performed the calculations and the computer programming. Konstantinos Ioannou and Georgios Tsantopoulos, Garyfallos Arabatzis and Zacharoula Andreopoulou, wrote the manuscript with input from all authors. Georgios Tsantopoulos and Zacharoula Andreopoulou, and Eleni Zafeiriou reviewed and discussed the results of the study.

Conflicts of Interest

The authors declare no conflicts of interest.

References

  1. Pasten, C.; Santamarina, J.C. Energy and quality of life. Energy Policy 2012, 49, 468–476. [Google Scholar] [CrossRef]
  2. Lambert, J.G.; Hall, C.A.S.; Balogh, S.; Gupta, A.; Arnold, M. Energy, EROI and quality of life. Energy Policy 2014, 64, 153–167. [Google Scholar] [CrossRef]
  3. Mazur, A. Does increasing energy or electricity consumption improve quality of life in industrial nations? Energy Policy 2011, 39, 2568–2572. [Google Scholar] [CrossRef]
  4. Arto, I.; Capellán-Pérez, I.; Lago, R.; Bueno, G.; Bermejo, R. The energy requirements of a developed world. Energy Sustain. Dev. 2016, 33, 1–13. [Google Scholar] [CrossRef]
  5. Andreoni, V. Energy Metabolism of 28 World Countries: A Multi-scale Integrated Analysis. Ecol. Econ. 2017, 142, 56–69. [Google Scholar] [CrossRef]
  6. International Energy Outlook, IEO 2017. U.S. Energy Information Administration, September 2017. Available online: https://www.eia.gov/outlooks/ieo/pdf/0484(2017).pdf (accessed on 10 January 2018).
  7. Matsumoto, S. How do household characteristics affect appliance usage? Application of conditional demand analysis to Japanese household data. Energy Policy 2016, 94, 214–223. [Google Scholar] [CrossRef]
  8. Webb, A.; Mayers, K.; France, C.; Koomey, J. Estimating the energy use of high definition games consoles. Energy Policy 2013, 61, 1412–1421. [Google Scholar] [CrossRef]
  9. Richardson, I.; Thomson, M.; Infield, D. A high-resolution domestic building occupancy model for energy demand simulations. Energy Build. 2008, 40, 1560–1566. [Google Scholar] [CrossRef] [Green Version]
  10. Viggers, H.; Keall, M.; Wickens, K.; Howden-Chapman, P. Increased house size can cancel out the effect of improved insulation on overall heating energy requirements. Energy Policy 2017, 107, 248–257. [Google Scholar] [CrossRef]
  11. Stephan, A.; Crawford, R.H. The relationship between house size and life cycle energy demand: Implications for energy efficiency regulations for buildings. Energy 2016, 116, e221. [Google Scholar] [CrossRef]
  12. Cartalis, C.; Synodinou, A.; Proedrou, M.; Tsangrassoulis, A.; Santamouris, M. Modifications in energy demand in urban areas as a result of climate changes: An assessment for the southeast Mediterranean region. Energy Convers. Manag. 2001, 42, 1647–1656. [Google Scholar] [CrossRef]
  13. Isaac, M.; van Vuuren, D.P. Modeling global residential sector energy demand for heating and air conditioning in the context of climate change. Energy Policy 2009, 37, 507–521. [Google Scholar] [CrossRef]
  14. Sailor, D.J.; Pavlova, A.A. Air conditioning market saturation and long-term response of residential cooling energy demand to climate change. Energy 2003, 28, 941–951. [Google Scholar] [CrossRef]
  15. Alvarez-Herranz, A.; Balsalobre-Lorente, D.; Shahbaz, M.; Cantos, J.M. Energy innovation and renewable energy consumption in the correction of air pollution levels. Energy Policy 2017, 105, 386–397. [Google Scholar] [CrossRef]
  16. Zecca, A.; Chiari, L. Fossil-fuel constraints on global warming. Energy Policy 2010, 38, 1–3. [Google Scholar] [CrossRef]
  17. Hansen, J.; Ruedy, R.; Lacis, A.; Sato, M.; Nazarenko, L.; Tausnev, N.; Tegen, I.; Koch, D. Chapter 4 Climate modeling in the global warming debate. Int. Geophys. 2001, 70, 127–164. [Google Scholar]
  18. Hoffert, M.I.; Covey, C. Deriving Global Climate Sensitivity from Paleoclimate Reconstructions. Nature 1992, 360, 573–576. [Google Scholar] [CrossRef]
  19. Intergovernmental Panel on Climate Change. Fourth Assessment Report (AR4), Working Group I, UNEP; Cambridge University Press: New York, NY, USA, 2007. [Google Scholar]
  20. Seinfeld, J.H.; Pandis, S.N. Atmospheric Chemistry and Physics: From Air Pollution to Climate Change; Wiley: New York, NY, USA, 1963. [Google Scholar]
  21. Shafiee, S.; Topal, E. When will fossil fuel reserves be diminished? Energy Policy 2009, 37, 181–189. [Google Scholar] [CrossRef]
  22. Mohr, S.H.; Wang, J.; Ellem, G.; Ward, J.; Giurco, D. Projection of world fossil fuels by country. Fuel 2015, 141, 120–135. [Google Scholar] [CrossRef]
  23. Sorrell, S.; Speirs, J.; Bentley, R.; Brandt, A.; Miller, R. Global oil depletion: A review of the evidence. Energy Policy 2010, 38, 5290–5295. [Google Scholar] [CrossRef]
  24. Hellenic Statistical Authority. 2015. Available online: http://www.statistics.gr/en/statistics/-/publication/SPK33/ and http://www.statistics.gr/en/statistics/-/publication/SPG06/ (accessed on 5 December 2017).
  25. Stram, B.N. Key challenges to expanding renewable energy. Energy Policy 2016, 96, 728–734. [Google Scholar] [CrossRef]
  26. Malesios, C.; Arabatzis, G. Small hydropower stations in Greece: The local people’s attitudes in a mountainous prefecture. Renew. Sustain. Energy Rev. 2010, 14, 2492–2510. [Google Scholar] [CrossRef]
  27. World Energy Outlook 2012—Executive Summary—English version. IEA, 2012. pp. 6, 24, 28. Available online: https://www.iea.org/publications/freepublications/publication/weo-2012---executive-summary----english-version.html (accessed on 10 January 2018).
  28. U.S. Energy Information Administration. Available online: https://www.eia.gov/beta/international/data/browser/#/?pa=000000000000000000000000000001&c=4100000002000020000000000000g0002&ug=4&tl_id=2-A&vs=INTL.29-12-AFRC-QBTU.A&vo=0&v=H&start=2004&end=2015 (accessed on 4 December 2017).
  29. Eurostat. Share of energy from renewable sources. 2017. Available online: http://appsso.eurostat.ec.europa.eu/nui/show.do?query=BOOKMARK_DS-253950_QID_-7A8FB502_UID_-3F171EB0&layout=TIME,C,X,0;GEO,L,Y,0;UNIT,L,Z,0;INDIC_EN,L,Z,1;INDICATORS,C,Z,2;&zSelection=DS-253950UNIT,PC;DS-253950INDICATORS,OBS_FLAG;DS-253950INDIC_EN,119800;&rankName1=UNIT_1_2_-1_2&rankName2=INDICATORS_1_2_-1_2&rankName3=INDIC-EN_1_2_-1_2&rankName4=TIME_1_0_0_0&rankName5=GEO_1_2_0_1&sortC=ASC_-1_FIRST&rStp=&cStp=&rDCh=&cDCh=&rDM=true&cDM=true&footnes=false&empty=false&wai=false&time_mode=ROLLING&time_most_recent=true&lang=EN&cfo=%23%23%23%2C%23%23%23.%23%23%23 (accessed on 5 December 2017).
  30. Koundouri, P.; Kountouris, Y.; Remoundou, K. Valuing a wind farm construction: A contingent valuation study in Greece. Energy Policy 2009, 37, 1939–1944. [Google Scholar] [CrossRef]
  31. Arabatzis, G.; Kyriakopoulos, G.; Tsialis, P. Typology of regional units based on RES plants: The case of Greece. Renew. Sustain. Energy Rev. 2017, 78, 1424–1434. [Google Scholar] [CrossRef]
  32. Coelho, S.T. Traditional biomass energy: Improving its use and moving to modern energy use. In Renewable Energy: A Global Review of Technologies, Policies and Markets; Earthscan: London, UK; Sterling, VA, USA, 2012; pp. 230–261. ISBN 9781849772341. [Google Scholar]
  33. Demirbas, A.; Ozturk, T.; Demirbas, M.F. Recovery of energy and chemicals from carbonaceous materials. Energy Sources Part A Recover. Util. Environ. Eff. 2006, 28, 1473–1482. [Google Scholar] [CrossRef]
  34. Demirbaş, A. Biomass resource facilities and biomass conversion processing for fuels and chemicals. Energy Convers. Manag. 2001, 42, 1357–1378. [Google Scholar] [CrossRef]
  35. Demirbas, A. Conversion of corn stover to chemicals and fuels. Energy Sources Part A Recover. Util. Environ. Eff. 2008, 30, 788–796. [Google Scholar] [CrossRef]
  36. Ruiz, J.A.; Juárez, M.C.; Morales, M.P.; Muñoz, P.; Mendívil, M.A. Biomass gasification for electricity generation: Review of current technology barriers. Renew. Sustain. Energy Rev. 2013, 18, 174–183. [Google Scholar] [CrossRef]
  37. Center for Renewable Energy Sources (CRES). 2017. Available online: http://www.cres.gr/energy-saving/images/pdf/biomass_guide.pdf (accessed on 3 January 2018).
  38. Ellabban, O.; Abu-Rub, H.; Blaabjerg, F. Renewable energy resources: Current status, future prospects and their enabling technology. Renew. Sustain. Energy Rev. 2014, 39, 748–764. [Google Scholar] [CrossRef]
  39. Kougkoulos, I.; Cook, S.J.; Jomelli, V.; Clarke, L.; Symeonakis, E.; Dortch, J.M.; Edwards, L.A.; Merad, M. Use of multi-criteria decision analysis to identify potentially dangerous glacial lakes. Sci. Total Environ. 2017. [Google Scholar] [CrossRef] [PubMed]
  40. Ioannou, K.; Lefakis, P.; Arabatzis, G. Development of a decision support system for the study of an area after the occurrence of forest fire International. J. Sustain. Soc. 2011, 3, 5–32. [Google Scholar]
  41. Grigoroudis, E.; Petridis, K.; Arabatzis, G. RDEA: A recursive DEA based algorithm for the optimal design of biomass supply chain networks. Renew. Energy 2014, 71, 113–122. [Google Scholar] [CrossRef]
  42. Arabatzis, G.; Petridis, K.; Galatsidas, S.; Ioannou, K. A demand scenario based fuelwood supply chain: A conceptual model. Renew. Sustain. Energy Rev. 2013, 25, 687–697. [Google Scholar] [CrossRef]
  43. Kyriakopoulos, G.L.; Arabatzis, G.; Chalikias, M. Renewables exploitation for energy production and biomass use for electricity generation. A multi-parametric literature-based review. AIMS Energy 2016, 4, 762–803. [Google Scholar] [CrossRef]
  44. Saaty, T.L. Fundamentals of Decision Making and Priority Theory; RWS Publications: Pittsburgh, PA, USA, 2001; ISBN 0-9620317-6-3. [Google Scholar]
  45. Chaouachi, A.; Covrig, C.F.; Ardelean, M. Multi-criteria selection of offshore wind farms: Case study for the Baltic States. Energy Policy 2017, 103, 179–192. [Google Scholar] [CrossRef]
  46. Aly, A.; Jensen, S.S.; Pedersen, A.B. Solar power potential of Tanzania: Identifying CSP and PV hot spots through a GIS multicriteria decision making analysis. Renew. Energy 2017, 113, 159–175. [Google Scholar] [CrossRef]
  47. Kausika, B.B.; Dolla, O.; van Sark, W.G.J.H.M. Assessment of policy based residential solar PV potential using GIS-based multicriteria decision analysis: A case study of Apeldoorn, The Netherlands. Energy Procedia 2017, 134, 110–120. [Google Scholar] [CrossRef]
  48. Al Garni, H.Z.; Awasthi, A. Solar PV power plant site selection using a GIS-AHP based approach with application in Saudi Arabia. Appl. Energy 2017, 206, 1225–1240. [Google Scholar] [CrossRef]
  49. Tsoutsos, T.; Tsitoura, I.; Kokologos, D.; Kalaitzakis, K. Sustainable siting process in large wind farms case study in Crete. Renew. Energy 2015, 75, 474–480. [Google Scholar] [CrossRef]
  50. Latinopoulos, D.; Kechagia, K. A GIS-based multi-criteria evaluation for wind farm site selection. A regional scale application in Greece. Renew. Energy 2015, 78, 550–560. [Google Scholar] [CrossRef]
  51. Singh, R.P.; Nachtnebel, H.P. Analytical hierarchy process (AHP) application for reinforcement of hydropower strategy in Nepal. Renew. Sustain. Energy Rev. 2016, 55, 43–58. [Google Scholar] [CrossRef]
  52. Yalcin, M.; Kilic Gul, F. A GIS-based multi criteria decision analysis approach for exploring geothermal resources: Akarcay basin (Afyonkarahisar). Geothermics 2017, 67, 18–28. [Google Scholar] [CrossRef]
  53. Kiavarz, M.; Jelokhani-Niaraki, M. Geothermal prospectivity mapping using GIS-based Ordered Weighted Averaging approach: A case study in Japan’s Akita and Iwate provinces. Geothermics 2017, 70, 295–304. [Google Scholar] [CrossRef]
  54. Wang, Y.M.; Chin, K.S. Fuzzy analytic hierarchy process: A logarithmic fuzzy preference programming methodology. Int. J. Approx. Reason. 2011, 52, 541–553. [Google Scholar] [CrossRef]
  55. Zyoud, S.H.; Kaufmann, L.G.; Shaheen, H.; Samhan, S.; Fuchs-Hanusch, D. A framework for water loss management in developing countries under fuzzy environment: Integration of Fuzzy AHP with Fuzzy TOPSIS. Expert Syst. Appl. 2016, 61, 86–105. [Google Scholar] [CrossRef]
  56. Asakereh, A.; Soleymani, M.; Sheikhdavoodi, M.J. A GIS-based Fuzzy-AHP method for the evaluation of solar farms locations: Case study in Khuzestan province, Iran. Sol. Energy 2017, 155, 342–353. [Google Scholar] [CrossRef]
  57. Kaya, T.; Kahraman, C. Multicriteria renewable energy planning using an integrated fuzzy VIKOR & AHP methodology: The case of Istanbul. Energy 2010, 35, 2517–2527. [Google Scholar] [CrossRef]
  58. Sadeghi, A.; Larimian, T.; Molabashi, A. Evaluation of Renewable Energy Sources for Generating Electricity in Province of Yazd: A Fuzzy Mcdm Approach. Procedia Soc. Behav. Sci. 2012, 62, 1095–1099. [Google Scholar] [CrossRef]
  59. Şengül, Ü.; Eren, M.; Eslamian Shiraz, S.; Gezder, V.; Sengül, A.B. Fuzzy TOPSIS method for ranking renewable energy supply systems in Turkey. Renew. Energy 2015, 75, 617–625. [Google Scholar] [CrossRef]
  60. Haddad, B.; Liazid, A.; Ferreira, P. A multi-criteria approach to rank renewables for the Algerian electricity system. Renew. Energy 2017, 107, 462–472. [Google Scholar] [CrossRef]
  61. Sindhu, S.; Nehra, V.; Luthra, S. Investigation of feasibility study of solar farms deployment using hybrid AHP-TOPSIS analysis: Case study of India. Renew. Sustain. Energy Rev. 2017, 73, 496–511. [Google Scholar] [CrossRef]
  62. Aragonés-Beltrán, P.; Chaparro-González, F.; Pastor-Ferrando, J.P.; Pla-Rubio, A. An AHP (Analytic Hierarchy Process)/ANP (Analytic Network Process)-based multi-criteria decision approach for the selection of solar-thermal power plant investment projects. Energy 2014, 66, 222–238. [Google Scholar] [CrossRef]
  63. Tavana, M.; Santos Arteaga, F.J.; Mohammadi, S.; Alimohammadi, M. A fuzzy multi-criteria spatial decision support system for solar farm location planning. Energy Strateg. Rev. 2017, 18, 93–105. [Google Scholar] [CrossRef]
  64. Tasri, A.; Susilawati, A. Selection among renewable energy alternatives based on a fuzzy analytic hierarchy process in Indonesia. Sustain. Energy Technol. Assess. 2014, 7, 34–44. [Google Scholar] [CrossRef]
  65. Heo, E.; Kim, J.; Boo, K.-J. Analysis of the assessment factors for renewable energy dissemination program evaluation using fuzzy AHP. Renew. Sustain. Energy Rev. 2010, 14, 2214–2220. [Google Scholar] [CrossRef]
  66. Toklu, E. Biomass energy potential and utilization in Turkey. Renew. Energy 2017, 107, 235–244. [Google Scholar] [CrossRef]
  67. Dominguez Bravo, J.; Garcia Casals, X.; Pinedo Pascua, I. GIS approach to the definition of capacity and generation ceilings of renewable energy technologies. Energy Policy 2007, 35, 4879–4892. [Google Scholar] [CrossRef]
  68. Arnette, A.N.; Zobel, C.W. Spatial analysis of renewable energy potential in the greater southern Appalachian mountains. Renew. Energy 2011, 36, 2785–2798. [Google Scholar] [CrossRef]
  69. Baban, S.M.J.; Parry, T. Developing and applying a GIS-assisted approach to locating wind farms in the UK. Renew. Energy 2001, 24, 59–71. [Google Scholar] [CrossRef]
  70. Alabi, O. An investigation on using GIS to prospect for renewable energy in Nigeria. Ph.D. Thesis, University of Missouri-Kansas City, Kansas City, MO, USA, 2010. [Google Scholar]
  71. Aydin, N.Y.; Kentel, E.; SebnemDuzgun, H. GIS-based site selection methodology for hybrid renewable energy systems: A case study from western Turkey. Energy Convers. Manag. 2013, 70, 90–106. [Google Scholar] [CrossRef]
  72. Al-Yahyai, S.; Charabi, Y.; Gastli, A.; Al-Badi, A. Wind farm land suitability indexing using multi-criteria analysis. Renew. Energy 2012, 44, 80–87. [Google Scholar] [CrossRef]
  73. Dunsford, H.; Macfarlane, R.; Turner, K. The Development of a Regional Geographical Information System for the North East Renewable Energy Strategy; Centre for Environmental and Spatial Analysis, University of Northumbria: England, UK, 2003. [Google Scholar]
  74. Sánchez-Lozano, J.M.; Teruel-Solano, J.; Soto-Elvira, P.L.; Socorro García-Cascales, M. Geographical Information Systems (GIS) and Multi-Criteria Decision Making (MCDM) methods for the evaluation of solar farms locations: Case study in south-eastern Spain. Renew. Sustain. Energy Rev. 2013, 24, 544–556. [Google Scholar] [CrossRef]
  75. Tsoutsos, T.; Frantzeskaki, N.; Gekas, V. Environmental impacts from the solar energy technologies. Energy Policy 2005, 33, 289–296. [Google Scholar] [CrossRef]
  76. Brewer, J.; Ames, D.P.; Solan, D.; Lee, R.; Carlisle, J. Using GIS analytics and social preference data to evaluate utility-scale solar power site suitability. Renew. Energy 2015, 81, 825–836. [Google Scholar] [CrossRef]
  77. Charabi, Y.; Gastli, A. PV site suitability analysis using GIS-based spatial fuzzy multi-criteria evaluation. Renew. Energy 2011, 36, 2554–2561. [Google Scholar] [CrossRef]
  78. Watson, J.J.W.; Hudson, M.D. Regional Scale wind farm and solar farm suitability assessment using GIS-assisted multi-criteria evaluation. Landsc. Urban Plan. 2015, 138, 20–31. [Google Scholar] [CrossRef]
  79. Ciolkosz, D.; Jacobson, M.; Heil, N.; Brandau, W. An assessment of farm scale biomass pelleting in the Northeast. Renew. Energy 2017, 108, 85–91. [Google Scholar] [CrossRef]
  80. Purdy, A.; Pathare, P.B.; Wang, Y.; Roskilly, A.P.; Huang, Y. Towards sustainable farming: Feasibility study into energy recovery from bio-waste on a small-scale dairy farm. J. Clean. Prod. 2018, 174, 899–904. [Google Scholar] [CrossRef]
  81. Ferreira, S.; Monteiro, E.; Brito, P.; Vilarinho, C. Biomass resources in Portugal: Current status and prospects. Renew. Sustain. Energy Rev. 2017, 78, 1221–1235. [Google Scholar] [CrossRef]
  82. Villarini, M.; Bocci, E.; Di Carlo, A.; Savuto, E.; Pallozzi, V. The case study of an innovative small scale biomass waste gasification heat and power plant contextualized in a farm. Energy Procedia 2015, 82, 335–342. [Google Scholar] [CrossRef]
  83. Arabatzis, G.; Myronidis, D. Contribution of SHP Stations to the development of an area and their social acceptance. Renew. Sustain. Energy Rev. 2011, 15, 3909–3917. [Google Scholar] [CrossRef]
  84. Tampakis, S.; Tsantopoulos, G.; Arabatzis, G.; Rerras, I. Citizens’ views on various forms of energy and their contribution to the environment. Renew. Sustain. Energy Rev. 2013, 20, 473–482. [Google Scholar] [CrossRef]
  85. Skoulou, V. Design and development of a gasification reactor for energy production from biomass. Ph.D. Thesis, Department of Chemical Engineering, Aristotle University of Thessaloniki, Serres, Greece, 2009. [Google Scholar]
  86. Malcezewski, J. GIS based lan-use suitability analysis: A critical overview. Prog. Plan. 2004, 62, 3–65. [Google Scholar] [CrossRef]
  87. Kalavrouziotis, I.; Hortis, T.; Drakatos, P. The reuse of wastewater and sludge for cultivation of forestry trees in desert areas in Greece. Int. J. Environ. Pollut. 2004, 21, 425. [Google Scholar] [CrossRef]
  88. Torrieri, F.; Bata, A. Spatial Multi-criteria Decision Support System and Strategic Impact Assessment: A case study. Buildings 2017, 7, 96. [Google Scholar] [CrossRef]
  89. Chakhar, S.; Mousseau, V. Multicriteria Decision Making, Spatial. In Encyclopedia of GIS; Shekhar, S., Xiong, H., Eds.; Springer: Boston, MA, USA, 2008. [Google Scholar]
Figure 1. World energy production from RES in quadrillion Btusfor the years 2004–2015 [28].
Sustainability 10 00531 g001
Figure 2. EU RES Energy Production in quadrillion Btus for the years 2004–2015 [29].
Sustainability 10 00531 g002
Figure 3. Energy production by RES in Greece for the year 2015 in Mtoes [29].
Sustainability 10 00531 g003
Figure 4. Agricultural land fuzzy membership function.
Sustainability 10 00531 g004
Figure 5. Regional unit of Drama Biomass Potential.
Sustainability 10 00531 g005
Figure 6. Distance from farms fuzzy membership function.
Sustainability 10 00531 g006
Figure 7. The individual constraint layers.
Sustainability 10 00531 g007
Figure 8. The final constraint layer.
Sustainability 10 00531 g008
Figure 9. Biomass estimation in Regional unit of Drama.
Sustainability 10 00531 g009
Figure 10. Distances from energy transfer network and transportation network.
Sustainability 10 00531 g010
Figure 11. Distances from farms.
Sustainability 10 00531 g011
Figure 12. Land suitability for biomass power plant installation.
Sustainability 10 00531 g012
Table 1. Legislation, human and environmental considerations.
CriterionLimitationsReferences
SlopeBetween 0 and 10% for constructions and accessibility from vehicles[68]
Heavily forested areas and
Protected areas
Restriction: these zones are completely off limitsΝ2742/1999 (Greek Legislation)
Water Bodies, wetlands, rivers500 m buffer zone for wetlands
400 m buffer zone for wetlands
300 m buffer zone for wetlands
500 m buffer zone for rivers
400 m buffer zone for rivers
1000 m from coast
200 m from rivers
[69]
[70]
[71]
[69]
[70]
Ν2742/1999 (Greek Legislation)
Agricultural land, pastures,
Orchards
Agricultural land, pastures and orchards are unsuitable[68,72]
Urban areas2000 m from urban areas
1–5 km from urban areas
Ν2742/1999 (Greek Legislation), [72]
Road and railroad network500 m buffer zone
150 m buffer zone
railroad area restriction
[73]
[74]
[75]
Ν2742/1999 (Greek Legislation)
Table 2. Pairwise comparison values.
DefinitionIndexDefinitionIndex
Equally Important1Equally important1/1
Equally or slightly more important2Equally or slightly less important1/2
Slightly more important3Slightly less important1/3
Slightly to much more important4Slightly-to-way less important1/4
Much more important5Way less important1/5
Much-to-far more important6Way to far less important1/6
Far more important7Far less important1/7
Far more important to extremely more important8Far less important to extremely less important1/8
Extremely more important9Extremely less important1/9
Table 3. Weight coefficients after the implementation of AHP.
CriteriaWeight Coefficient
Constraint Layer0.458
Transportation network0.033
Proximity to farms0.142
Energy grid0.07
Biomass potential0.297

