Article

Assessing the Merits of the Urban-Led Policy in China: Spread or Backwash Effect?

Department of Finance, Chung-Yuan Christian University, Taoyuan City 32023, Taiwan
Sustainability 2018, 10(2), 451; https://doi.org/10.3390/su10020451
Submission received: 29 December 2017 / Revised: 29 January 2018 / Accepted: 3 February 2018 / Published: 9 February 2018

Abstract

:
Shanghai and Beijing, as two megacities, are often regarded as the most successful examples of China’s growth pole policy, which has stirred up a great deal of controversy behind the spread–backwash effects. It is believed that the spread–backwash effects for these two mega metropolitan regions are particularly valuable when evaluating the merits of adopting an “urban-led” policy in China. Moreover, a great deal of effort has been devoted to the cross-section analysis of relevant data. What seems to be lacking, however, is a time-series econometric method. The estimation results using real gross regional product (GRP) over the last 50 years (1967–2016) reveal that a long-run equilibrium exists for these central cities and their suburbs. More noteworthy is the finding that spread and backwash effects coexist in these two metropolitan regions, namely, the central city has spread and backwash effects on its medium-level and low-level suburbs, respectively. Thus, how to diminish the city–suburb gap is our concern and this argument is consistent with the spirit of new-type urbanization policy in China now to create a balanced and equalized metropolitan economy.

1. Introduction

China has enjoyed very rapid economic growth and development over the past several decades on the grounds that the authorities decided to pour massive amounts of public resources into certain specified regions, in particular, the central cities in the coastal region. This arguably came about at the expense of increased regional inequality and is often referred to as an “urban-led policy”, as pointed out by the growth pole theory [1,2]. Urban-led policy is to put most public and financial resources on urban areas at the expense of rural and other regions to catch up to developed nations [3]. However, the concept of a growth pole is proposed to emphasize the importance of economic domination to national growth through centrifugal and centripetal forces [4]. In other words, the growth pole strategy may be accompanied by positive or negative impacts on surrounding regions. If the positive effect is larger than the negative one, then growth pole theory may not only promote economic growth, but may also accelerate convergence among regions. On the contrary, growth pole theory may lead to a deterioration in regional equality. What is more, past studies in relation to spread–backwash effects are devoted to cross-sectional estimation [5,6,7,8,9]. In addition, It has been argued that the merits of growth poles should be examined by a long-term evaluation [10]. Thus, using a time-series econometric model is indispensable to filling the gap in the literature. For these reasons, the spread–backwash effects of urban growth on the suburban areas are very critical to evaluating the merits of adopting an urban-led policy in China over the last half century.
In fact, the most famous symbols of such an urban-led policy are bound up with two Chinese megacities: Shanghai as the economic and financial center with a population of more than 24 million is selected as the central city within the greater Yangtze River Delta (YRD) metropolitan region, where it is also comprised of Jiangsu and Zhejiang provinces in southern China, and Beijing as the national capital and political core with a population of more than 20 million is regarded as the central city within the Jingjinji (JJJ) metropolitan region, with it also comprising Tianjin city and Hebei province in northern China. At the same time, the data on gross regional product (GRP) in each of the above areas cover a span of 50 years, namely, 1967–2016, so it is natural to use such data to explore the possibility of a spread–backwash effect.
In regard to the econometric approach adopted, we have decided to use a popular time-series econometric model, namely, the error-correction model (ECM), rather than the more frequently used partial adjustment mechanism based on two-period data in order to track the evolution of the central city–suburb relationship. The results of the estimation reveal that an urban-led policy can achieve the goal of the coexistence of growth and equality based on the condition that there are relatively similar positions between the central city and neighboring areas, for example, medium-level suburbs. Otherwise, the fact that the central city may generate a huge attraction (the polarization effect) for the lower level of its suburban places leads to more serious divergence among them. From the viewpoint of the political implications, in implementing the urban-led policy, the authorities must evaluate the relationships and levels of the urban and suburban areas in advance in order to reap the maximal benefits of local economic growth. More importantly, since a more balanced and equalized relationship between central city and its suburbs can generate the highest degree of spread effects, how to improve the low-level suburbs is important. This conclusion is fully consistent with new urbanization policy [11] with an explicit emphasis on development on suburbs and shortening the gap between the core and adjoining areas.
The remainder of this paper is organized as follows. Section 2 reviews some research on the relationship between the central city and suburban areas. Section 3 provides a dynamic framework for the core-periphery model and describes the data for the YRD metropolitan region (Shanghai) as well as the national capital region (Beijing). Section 4 first develops a co-integration system after performing unit root tests to estimate the dynamic interaction between the central city and its surrounding areas and then specially points out the relevant economic implications that emerge from the results. Section 5 presents the general conclusions of this paper.

2. Review of the Central-Suburban Relationship

Growth pole theory was developed by [4], who described economic domination as a magnet that inspired economic growth. His concept has been expressed in geographical dimensions since it is emphasized that growth poles should be located in large cities [12]. Although this theory tells us that pouring massive resources into a specific city can promote faster national development in order for a country to catch up with the developed economies, urban economists have chosen to take a closer look at the core–periphery relationship or distribution. That is, there is concern that a growth pole strategy may harm the development of surrounding areas. In actual fact, these concerns are fully reflected in [13,14] who stated that there are either positive (spread, trickling-down) or negative (backwash, polarization) effects of central cities on nearby areas. The former includes the migration of unemployed workers, the demand for agricultural and raw materials and eventually investment and the relocation of firms from the central cities to the outlying areas, while the latter includes, for example, the migration of educated, skilled workers from the rural areas, rural capital flight and the “fiscal exploitation” of central cities [15]. Since the spread–backwash effects of the core regions on the peripheries may appear simultaneously in growth pole theory, how to assess their net influences (i.e., the spread minus the backwash effects) is critical for development strategy, especially for an “urban-led” policy in China.
More specifically, it is argued that a successful growth pole promotion needs a very long time horizon that functions in an asymmetrical manner, that is, a backwash in the short run but a spread in the long run, in order to defend the validity of growth pole theory [10]. However, it is surveyed that the spread effects were smaller than the backwash effects based on earlier studies [16]. Over the past few decades, a considerable number of studies have been conducted on different geographical levels. First, at the most disaggregated level (the central city-surrounding areas relationship), the suburban dependence hypothesis argues that central cities and their suburbs are inextricably intertwined, and that healthy cities foster faster growing suburbs. Thus, there exists a positive externality from the central cities to their suburbs [17,18,19,20,21,22,23,24]. However, a local input–output model is applied to find that the backwash effect is stronger than the spread effect in the case of the Washington economy [25]. Moreover, by additionally using the employment–population model, the county growth model of [6] is extended to divide metropolitan areas into central cities and suburbs [26]. Intra-metropolitan population and employment between cities and their suburbs is used to investigate the changing evolution of interaction in the 1970s, 1980s and 1990s [27]. Canadian data is used to estimate population and employment between urban and suburban places [28]. Furthermore, by adding a distance factor [5], a critical contribution to setting up a core-periphery framework was provided to investigate the interaction between central cities and suburbs. As mentioned above, most of these studies reveal that central cities generate spread effects on their suburbs.
Next, some research has been extended to more remote areas like rural, hinterland or ex-urban locations. Density functions are formulated for 8 economically functional economic areas and found that the biggest backwash effects appeared in rural areas [29]. Some studies further divided employment into export and service industries to show that there are different spread and backwash effects of urban export and service sectors on rural areas [30,31]. A population–employment model of urban, suburban and ex-urban areas to the Rockies mountain region in the U.S. is applied to show the kinds of spread effects generated [32]. Two studies used the cities and counties of three regions in China and found that there was mixed evidence regarding the spread and backwash effects of large cities [1,33]. The spread and backwash effects for nonmetropolitan areas using multiple cities are examines and still found that central cities have spread effects on these remote areas [8].
At the provincial or regional level, spatial correlation analysis among China’s provinces is utilized to show that there were some spread effects in the coastal region, but backwash effects in the non-coastal regions [34]. It is emphasized that, based on provincial-level panel data, there were spread effects from coastal regions to noncoastal regions [35], while it is argued that more serious regional inequalities were a consequence of backwash effects from the coastal region to inland regions [36].
Finally, the central place theory states that there are different functions at different levels of urban system, so spread and backwash effects should be estimated across the urban hierarchy. It is found that there are differentiated effects of urban growth on suburban, rural and hinterland areas in the cases of the U.S., France and Denmark. Schmitt [37] and it is revealed that medium-sized cities gave rise to the strongest spread effects on rural communities in France [9]. Similarly, it is also indicated that medium-sized cities have the most spread effects across different urban sizes in China [2].
To sum up, the majority of studies on spread–backwash effects use cross-sectional estimation, namely, a partial adjustment model, to show that central cities generate a spread effect on suburban, even rural or exurban areas and this is consistent with the suburbanization and urban sprawl in U.S. history. On the contrary, mixed effects are found in developing economies like China. However, the above results show that the speed of adjustment is surprisingly slower on the grounds that most economic variables of a non-stationary nature lead to unreasonably long adjustment periods, sometimes spanning more than one century [38]. In addition, the lead–lag relationship between a central city and its surrounding areas is essential to the validity of growth pole theory and this relation can be estimated by causality test. However, testing for causality must rely on time-series data and econometrics. For example, past studies have suggested that a central city has a spread effect on its suburbs due to a positive correlation. However, this may not be a formal reference on the grounds that a positive correlation between the central city and the suburb can be explained by the spread effect “from the central city to the suburbs” or “from the suburbs to the central city”. For these reasons, the only solution is to directly build up a time-series econometric model [39]. However, time-series studies have only made a few attempts to examine the spread and backwash effects. For example, a structural vector autoregressive (SVAR) model is constructed to evaluate the sources of sectoral employment in central cities and suburbs and found that central cities give rise to positive spillovers in their suburbs [40]. A study is used a panel ECM to estimate the long-run equilibrium between central cities and their suburbs within Spanish metropolitan areas in order to find support for the validity of the spread effect from central cities [41]. Another case which applies to the Taipei metropolitan area is that where the relationship between Taipei city (the central city) and its surrounding area (New Taipei city) was examined using an ECM [42] and the findings indicated that there was evidence of a significant spread effect from the former to the latter. As far as China is concerned, they applied their model to three and six broad regions, respectively, to estimate the spread effects of the core region on the other regions using a VAR model [43,44].
As mentioned above, time-series econometric models possess many advantages, in that they track the development process, long-run equilibrium and causality over time, as compared with the cross-sectional models. In addition, the spread and backwash effects of large cities in China have been subject to controversy based on past studies, which fail to grasp the interaction between the central city and surrounding provinces from a long-run viewpoint. Moreover, how to arrive at a compromise between growth and inequality lies at the heart of China’s policy and hence we believe that the spread and backwash effects of Shanghai and Beijing as central cities on nearby areas can provide the most compelling evidence. Based on the central place theory, we will apply three-level design of these two metropolitan regions to investigate possible spread and backwash effects. After all, the purpose of this paper is to apply the ECM to these two largest metropolitan regions in order to evaluate the magnitudes of the spread–backwash effects.

3. Empirical Model and Data Description

As stated above, real regional output is used to estimate the net spread (positive) or backwash (negative) effects among regions [43]. However, the merits of growth pole theory, namely, the urban-led policy, make it necessary to further investigate the interaction between central cities and their suburbs. This section will propose a model that can adequately capture this relationship.

3.1. Economic Models and the ECM

Based on the preceding analysis, we would like to know more about the interaction between central cities and their suburbs within two mega metropolitan regions, where a central city is associated with two surrounding areas. In addition, since central place theory stresses the concept of urban ranking, we set up a three-variable vector ( Z ), that includes the real output ( Y C ) of the central city and the real outputs ( Y M and Y L ) of medium-level (M) and low-level (L) suburban locations to respond to urban hierarchy and the central place theory in (1). These variables are measured in log form, and thus the first-differenced variables can be interpreted as being growth rates:
Z t = ( Y C ,   Y M , Y L ) t
The relationships among these variables can ordinarily be established by using the VAR model that is limited to stable variables. Its advantage is that all variables can be treated systematically as endogenous variables to avoid the issue of endogeneity. In addition, if some of the variables are found to be unstable, VAR is not appropriate, and we will further need to determine whether cointegrated (long-run) relationships exist. If there are no cointegrated equations (CEs), then an analysis based on VAR in differences will be conducted. Otherwise, the ECM which is composed of short-run dynamics (in differences, Δ Z ) and a long-run equilibrium (in levels, Z) will generally be employed to replace the VAR approach in (2). In fact, it is showed that the forecasting ability of the ECM is generally better than VAR [45].
Δ Z t = α μ + α β Z t 1 + k = 1 K Γ k Δ Z t k + ε t
where α and β are ( n × r ) adjustment coefficients and long-run parameters with r co-integrating relationships; Γ k denotes an ( n × n ) matrix of coefficients that contains information on the short-run dynamics among these variables; and the subscript k implies the maximum lag. Finally, μ is the individual effect that is specific to the constant in the CE.

3.2. Data Description

China is characterized by a fast-growing economy with three regions, which are defined based on Figure 1, where there are 12 provinces/municipalities in the Eastern region: Liaoning, Beijing, Tianjin, Hebei, Shandong, Jiangsu, Shanghai, Zhejiang, Fujian, Guangdong, Guangxi and Hainan. There are 9 provinces/municipalities in the Central region: Heilongjiang, Jilin, Inner Mongolia, Shanxi, Hunan, Anhui, Hubei, Henan and Jiangxi. There are a further 10 provinces/municipalities in the Western region: Xinjiang, Tibet, Gansu, Qinghai, Chongqing, Sichuan, Ningxia, Shaanxi, Guizhou and Yunnan.
Our data are obtained from the National Bureau of Statistics (NBS) and all data are expressed on the basis of a constant price level and measured in billions of RMB with the base year being 2000. It is also observed that only annual GRP data from 1967 to 2016, namely, half a century, can be used to investigate the long-run impacts of an urban-led policy based on growth pole theory. As Richardson (1976) pointed out, growth pole theory needs a long period of time before its validity can be proved.

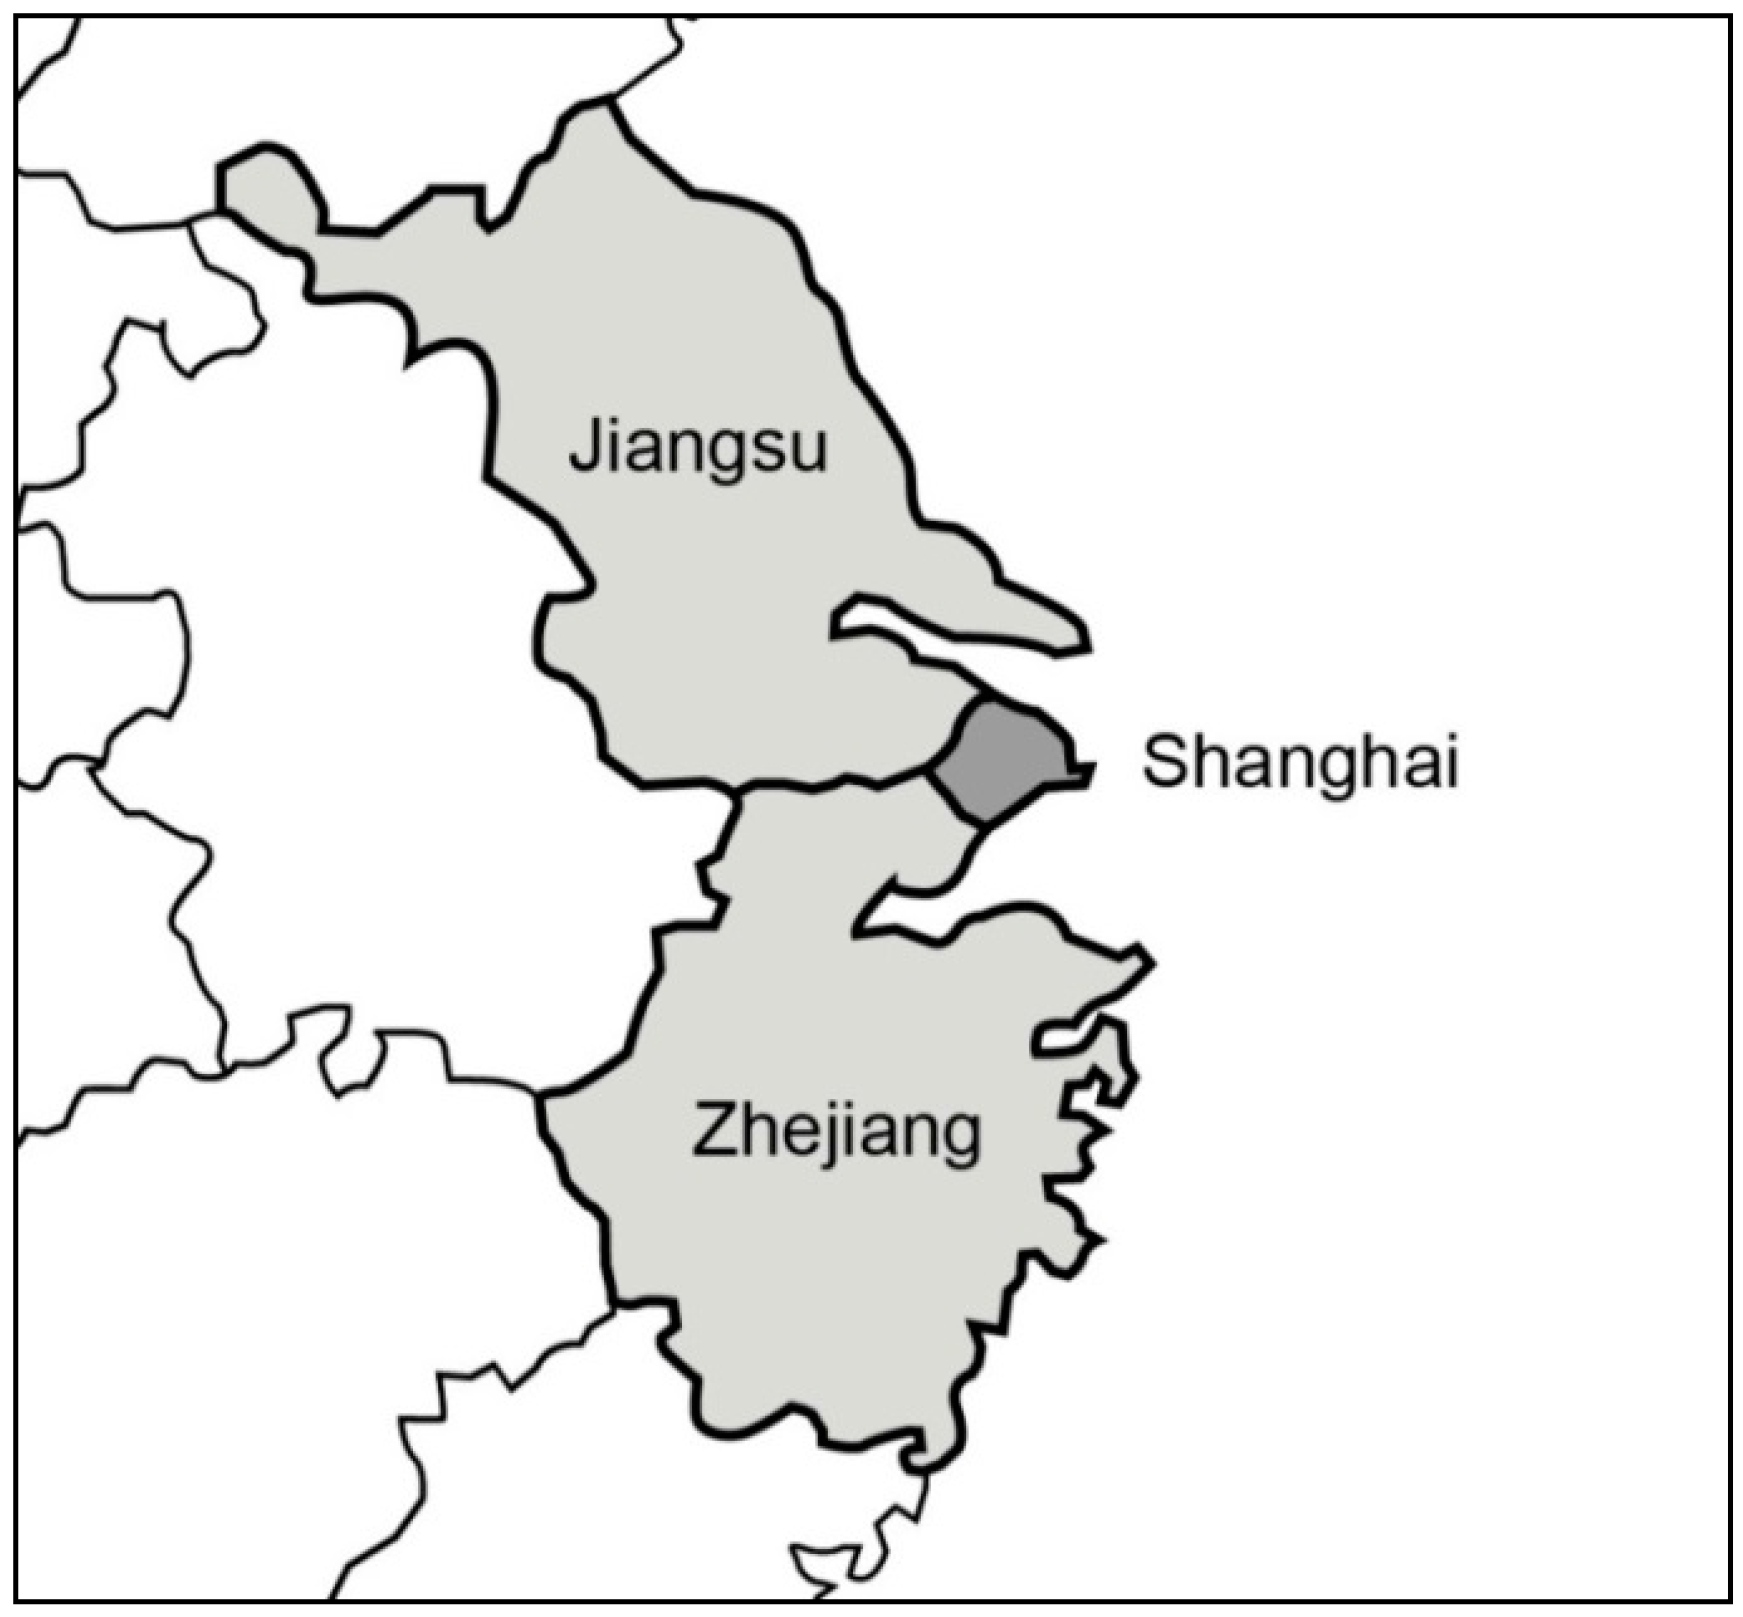
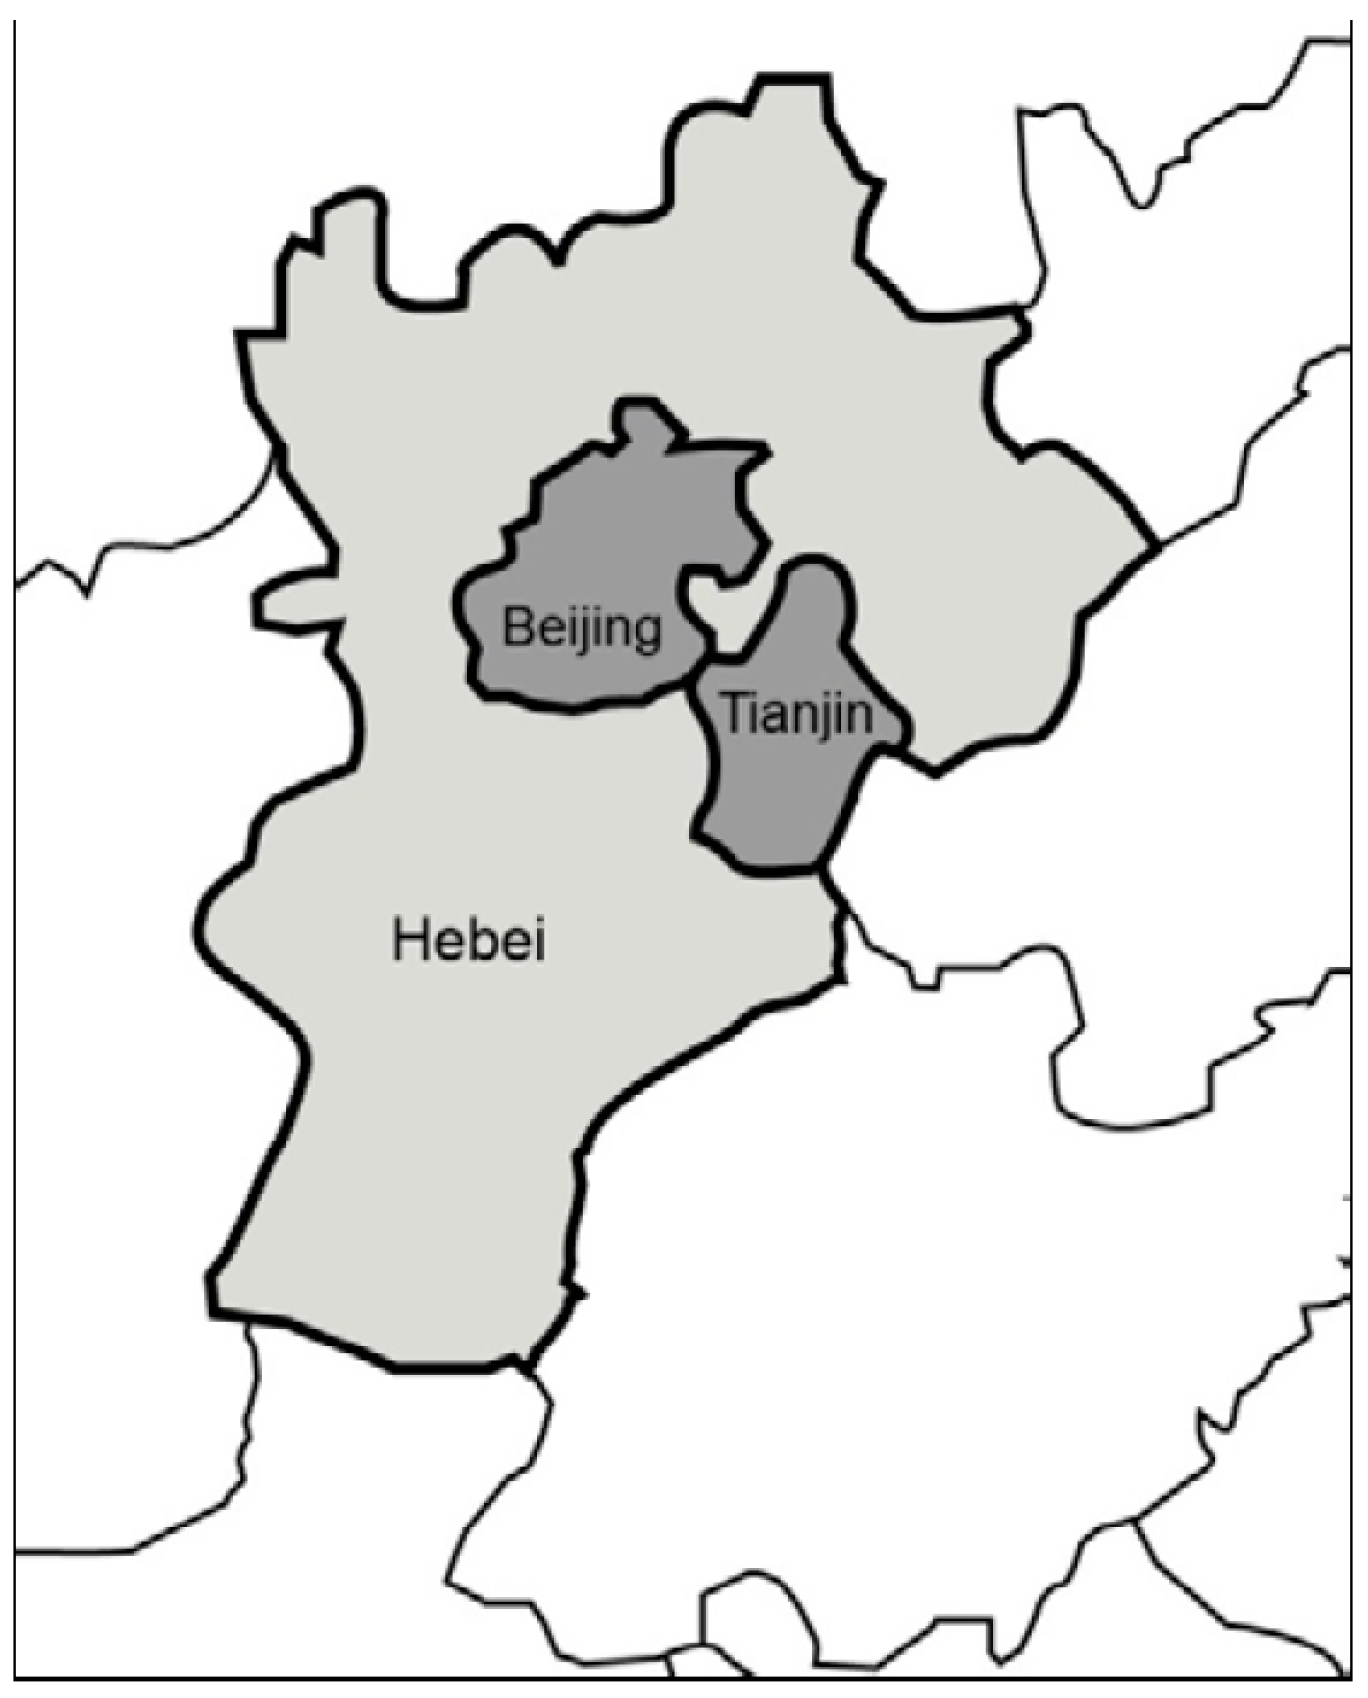
3.3. Two Metropolitan Regions: Beijing and Shanghai

However, in the development process, China has adopted strategies in regard to regional clusters to rapidly improve national competitiveness and a notable example relates to the urban-led policies that channel huge amounts of social resources into mega cities according to growth pole theory. Two typical cases are the YRD metropolitan region and JJJ metropolitan region.
In fact, the YRD metropolitan region around Shanghai city and the JJJ metropolitan region around Beijing city are the most famous cases of growth poles in China. In Figure 2 with the map of the YRD metropolitan region, it is found that Shanghai city lies in the middle of this region, while Jiangsu and Zhejiang provinces are located in the north and south of this region, respectively. This metropolitan region is believed to be the area with the highest concentration in the world with an area of 99,600 square kilometers and more than 115 million people. Based on the ratios of local economies to national GDP in 2016, Jiangsu, Zhejiang and Shanghai accounted for 12.68%, 7.79% and 5.22% of the total, respectively. In other words, this metropolitan region accounts for more than 25% of the national economy.
Similarly, the national capital region as Figure 3 is another notable example of an “urban-led” policy in China. This region in the northern part of China has been rising very rapidly and Beijing, Tianjin and Hebei account for 2.89%, 3.27% and 6.06% of national GDP, respectively. In fact, Beijing is at the center of political power, culture, innovation and education and Tianjin is the main port in this region with the highest per-capita GDP in China, while the economy of Hebei province is focused on agriculture and heavy manufacturing with high pollution. In other words, compared to the YRD metropolitan area, this region is relatively small and the inequality in terms of the regional distribution is significant.
Finally, we try to construct a basic urban system to respond to possibly various spread–backwash effects. From the economic statistics for 2015 as shown in Table 1, it is clear that Beijing and Shanghai as central cities have become service-based economies with shares for tertiary industries of 67.76% and 79.65% relative to their GRPs, while Zhejiang and Hebei possess the highest ratios for secondary industries as well as the lowest GRP per capita in their corresponding metropolitan regions. In sum, Shanghai, Jiangsu and Zhejiang are designed three-level, namely, core, medium-level and low-level suburban areas, respectively in YRD metropolitan region, while Beijing, Tianjin and Hebei are appointed to core, medium-level and low-level suburban areas in JJJ metropolitan region.

3.4. Data Analysis and Unit Root Tests

Figure 4 and Figure 5 both show the economic development process of two mega metropolitan areas using real GRP. The former reveals that from the angle of economic size, Jiangsu province is the largest, Zhejiang province is the next largest and Shanghai is the smallest of the three. The latter shows that Hebei province is larger than the two twin cities, Beijing and Tianjin. In other words, the economic scales of the suburban areas are larger than the central cities in these two mega metropolitan regions. In addition, it is clear that high growth rates are fully reflected in all units, including the provinces, cities and metropolitan regions as a whole.
Whether all variables are I(1) or not is critical when choosing either VAR or the ECM. If some of the variables are found to be unstable, namely, I(1), VAR will not be appropriate and we will further need to determine whether cointegrated (long-run) relationships exist. If there are no cointegrated equations (CEs), then the VAR in differences approach can be used. We first apply the unit root test, which in this case involves the augmented Dickey–Fuller (ADF) test. Every series is examined using the ADF test, as shown in Table 2, and the null hypothesis of the ADF test is that a unit root exists.
It is found that most variables and their first differences are accepted and rejected in the null hypothesis of three kinds of ADF tests to support the argument that the GRPs of central cities and their surrounding areas mostly belong to I(1) variables. Thus, the ECM is a possible approach that is used to evaluate the long-run relationship between cities and their suburbs.

4. Estimation Results and Policy Implications

In this section, we implement the Pantula principle to simultaneously search for the number of co-integrating relationships and better model specifications. More importantly, the ECM can be used to understand the long-run relationships between the central cities and their suburbs in order to evaluate the spread–backwash effects. It is strongly believed that the outcome of the estimation is essential to the policy implications.

4.1. Estimation Results: Co-Integration

First, we should note that the lags are specified as lags of the first-differenced term used in the auxiliary regression and the lag orders are equal to 5 and 3 in the YRD and JJJ metropolitan regions, respectively. Second, the co-integration test is widely used in Johansen’s maximum likelihood method. Based on the Pantula principle, we can select the best model through the joint hypothesis of both the rank order and the five types of deterministic components, and the null hypothesis that the number of co-integrating vectors is less than or equal to r co-integrating relations as shown in Table 3. Among the different specifications, Model 1 indicates that there is no intercept in both the short-run and co-integration space; Model 2 is that the intercept is restricted to the co-integration space; Model 3 reveals that a drift appears in both the short-run and long-run relationships; Model 4 allows for a linear trend in the co-integration vectors to be added to Model 3; and Model 5 extends Model 4 to allow for a linear trend in the short-run term.
From Table 3, we can make the following two points: one is that a long-run equilibrium between the central city and its surrounding areas exists regardless of whether in the YRD or JJJ metropolitan region. Another is that there is no intercept in either the short-run or long-run terms, that is in Model 1 for the YRD metropolitan region, while the intercept appears in the short-run and long-run relations with a linear trend, that is in Model 4 for the JJJ metropolitan region. These results are displayed in Table 4.
Just as it has mentioned that the spread–backwash effects of central cities on their surrounding areas must be investigated on a long-run basis [16], so a co-integration system with its long-run time-series estimation is especially adequate. In Table 4, it is surprising to find that as far as the YRD and JJJ metropolitan regions are concerned, the two central cities both have positive and negative effects on their suburbs. The former tells us that Shanghai city as a central city is positively related to Jiangsu province but is negatively correlated to Zhejiang province and the latter reveals that Beijing is positively related to Tianjin city, but is negatively related to Hebei province. Thus, the spread–backwash effects of growing central cities on the surrounding suburban areas prevail in China’s mega metropolitan regions, so an urban-led policy in China must be implemented very carefully.
More importantly, we can see three things based on urban hierarchic systems of YRD and JJJ metropolitan regions from Table 1 and Table 4. First, economic situations of the central cities are closer to their medium-level suburbs (Shanghai vs. Jiangsu; Beijing vs. Tianjin), so the central cities are positively related to their medium-level areas. Secondly, the difference between the central cities and their low-level suburbs (Shanghai vs. Zhejiang; Beijing vs. Hebei) are relatively large, so the central cities are negatively related to their low-level suburbs. Finally, we should notice the third condition: the difference between medium-level and low-level areas (Jiangsu vs. Zhejiang; Tianjin vs. Hebei) is also small, so they positively influence each other. All these things make it clear that only when the economic levels among the central city and its surrounding areas are approximately equivalent to avoid backwash effects, can the central city generate the most spread effects on other areas. In other words, the more convergence among central cities and their suburbs, the more opportunities to maximize overall megalopolis growth by a growing central city.
Although we obtain some critical meanings of two metropolitan economies from the above, it remains an unsettled question what is exactly spread–backwash effect between the central city and its suburb on the grounds that only causality test can decide what causes what. Thus, when we apply the causality test in Section 4.2, spread–backwash effects between the central city and its suburb can be formally discussed.

4.2. Long-Run Causalities: Weak Exogeneity Tests

Although the long-run equilibrium under a co-integration system is obtained based on the spread–backwash effects in two of China’s mega metropolitan regions, the question of whether “central cities lead their suburban areas” remains unanswered. It would be better to state that the long-run causality between central cities and suburban areas needs to be detected to support the effectiveness of an urban-led policy and growth pole theory. Fortunately, long-run causality can be estimated by weak exogeneity tests under the co-integration system [48,49]. To complete the weak exogeneity test, we first estimate a complete model and then test the weak exogeneity issue, which amounts to equivalently testing which columns of α have zero values. In fact, since α as the speed of adjustment means that the cointegrating vector enters the short-run equation, a value of zero in α for a variable implies that this variable is weakly exogenous as H 0 :   α = 0 . To sum up, when the null hypothesis cannot be rejected (accepted), this variable is identified as the cause (consequence) as shown in Table 5.
Table 5 indicates that weak exogeneity can be accepted for Shanghai and Zhejiang in the YRD metropolitan region as well as for Beijing and Hebei in the JJJ metropolitan region, while it can be rejected for Jiangsu in the YRD metropolitan region and for Tianjin in the JJJ metropolitan region. Thus, it is found that a unidirectional causal relationship is found to exist from Shanghai and Zhejiang (Beijing and Hebei) to Jiangsu (Tianjin) in the YRD (JJJ) metropolitan region. We can arrive at three critical conclusions: one is that medium-level areas are the biggest beneficiaries by the spread effects “from” the central city and low-level suburb, rather than “to” central city and low-level suburb. In other words, medium-level suburb is only a typical receiver, so the argument that there is the largest spread effect of the medium-level city [2] may be wrong due to omitting the causality tests. Another statement lends support to the view that central cities (namely, Beijing and Shanghai) can be regarded as engines of metropolitan regions, and so we are still in favor of a growth pole and urban-led policy in China. Finally, since we are sure about causality between central city and suburb, it is reasonable to conclude that central cities have spread effects on their medium-level suburbs, but they have backwash effects on their low-level suburbs.

4.3. Policy Implications

Judging from the above, when the economic condition of a suburban area is far different from that of its central city, a huge polarization effect will channel many resources from the suburban area to the central city and this will negatively affect the low-level area. On the contrary, the similar economic circumstances between the central city and medium-level suburb as well as medium-level and low-level suburbs can create significantly spread effects. It would be better to say that only when the economic levels among the central city and its surrounding areas are approximately equivalent can the metropolitan economy across central city and suburbs obtain the best achievement for coexistence between growth and balance (equality).
Since the spread effects of a central city on its suburban areas are conditional on a balanced and equalized metropolitan distribution across all areas, how to inspire economic development of low-level suburbs becomes necessary. In fact, China’s authorities have put forward “the New-type Urbanization plan” in 2014 to redirect urban development in the future. The goal of this policy is to grow the suburbs in order to diminish the core-periphery gap. Coincidentally, the aim of this new urbanization policy is very similar with our finding. Thus, we believe that this new urban policy will successfully obtain the bigger gain from more spread effects between central cities and their suburbs.
It is interesting to note that our empirical outcomes provide a good compromise between central city and suburbs: central city is the engine of metropolitan economy by spread effects on suburbs; at the same time, only devoting to improving low-level suburbs can show the highest spread effects of the central city.

5. Conclusions

China’s economy is best known for being the most representative model of growth pole theory, that is, where an urban-led policy inspires a speedy economic growth. What seems to be lacking, however, is to take a closer look at the spread–backwash effects using a time-series econometric method, such like ECM and causality. We propose two megacities: the YRD and JJJ metropolitan regions as investigating the effectiveness of an urban-led policy in China. Fortunately, by being able to use 50 years of data for the central cities and their surrounding provinces or cities, it becomes possible to further explore the long-run relationships between the central cities and their surrounding areas under the co-integration system.
Our estimation results based on ECM and weak exogeneity tests reveal that an urban-led policy is not unanimously good for the suburbs, that is to say, both spread and backwash effects may coexist in two mega metropolitan regions. Moreover, a metropolitan region can be characterized by the urban hierarchy system: central city, medium-level and low-level suburbs. Combining these concepts, our findings indicate that Shanghai (Beijing) as the core of the YRD (JJJ) metropolitan region has a positive effect on its medium-level suburb, namely, Jiangsu (Tianjin), but a negative effect on its low-level suburb, that is to say, Zhejiang (Hebei). This is a brand new and interesting evidence of spread–backwash effects and some critical policy implications deserve explicit emphasis. We may, therefore, reasonably conclude that the more similar position between the central city and its suburb, the more likely the spread effect of the central city on this suburb. On the contrary, the more differentiated position between the central city and its suburb, the more likely the backwash effect of the central city on its suburb. In other words, the key to success in urban-led policy and growth pole theory is to shorten the city–suburb gap in order to capture the most spread effect of a growing central city. This outcome is consistent with new-type urbanization policy in China recently to improve and inspire the abilities to suburban growth. Finally, as far as the metropolitan governance is concerned, our results suggest that a more balanced and equalized metropolitan economy across the central city and suburbs must become a top priority.
To sum up, a revised version of urban-led policy by the compromise between growing central cities and refreshing suburban vitality is proposed by our Chinese experience; however, this is never easy work based on two reasons. One is that estimation results tell us that the authorities must encourage the central city and low-level suburb simultaneously, but the national resources are always limited. Another is that, as far as public resources are concerned, how to distribute an adequate proportion of central city to its suburb is very difficult. These questions deserve to be noted and understood in the future research.

Acknowledgments

This study is funded by the ministry of science and technology (MOST) program (MOST 105-2410-H-033-035-MY2). I also want to show my gratitude for my father, Shang-hsien Chiang and my family to inspire my research career. Moreover, I must thank an associate professor, Ying Liang (Jiangxi University of Finance and Economics, China) to give me many advices about data and policy implications. Finally, I want to thank editors and all three reviewers for their valuable comments to improve this paper greatly.

Conflicts of Interest

The authors declare no conflict of interest.

References

  1. Ke, S.; Feser, E. Count on the growth pole strategy for regional economic growth? Spread-backwash effects in greater Central China. Reg. Stud. 2010, 44, 1131–1147. [Google Scholar] [CrossRef]
  2. Chen, A.; Partridge, M.D. When are cities engines of growth? Spread and backwash effects across the Chinese urban hierarchy. Reg. Stud. 2013, 47, 1313–1331. [Google Scholar] [CrossRef]
  3. Yang, D.T. Urban-biased policies and rising income inequality in China. Am. Econ. Rev. 1999, 89, 306–310. [Google Scholar] [CrossRef]
  4. Perroux, F. Economic space: Theory and application. Q. J. Econ. 1950, 64, 89–104. [Google Scholar] [CrossRef]
  5. Boarnet, M.G. The monocentric model and employment location. J. Urban Econ. 1994, 40, 45–57. [Google Scholar] [CrossRef]
  6. Carlino, G.A.; Mills, E.S. The determinants of county growth. J. Reg. Sci. 1987, 27, 39–54. [Google Scholar] [CrossRef] [PubMed]
  7. Deitz, R. A joint model of residential and employment location in urban areas. J. Urban Econ. 1998, 44, 197–215. [Google Scholar] [CrossRef]
  8. Ganning, J.P.; Baylis, K.; Lee, B. Spread and backwash effects for nonmetropolitan communities in the U.S. J. Reg. Sci. 2013, 53, 464–480. [Google Scholar] [CrossRef]
  9. Henry, M.S.; Schmitt, B.; Kristensen, K.; Barkley, D.L.; Bao, S. Extending Carlino-Mills models to examine urban size and growth impacts on proximate rural areas. Growth Chang. 1999, 30, 526–548. [Google Scholar] [CrossRef]
  10. Richardson, H.W. Growth pole spillovers: The dynamics of backwash and spread. Reg. Stud. 1976, 10, 1–9. [Google Scholar] [CrossRef]
  11. Wang, X.; Hui, E.C.; Choguill, C.; Jia, S. The new urbanization policy in China: Which way forward? Habitat Int. 2015, 47, 279–284. [Google Scholar] [CrossRef]
  12. Boudeville, J.R. Problems of Regional Economic Planning; Edinburgh University Press: Edinburgh, UK, 1966. [Google Scholar]
  13. Hirschman, A.O. The Strategy of Economic Development; Yale University Press: New Haven, CT, USA, 1961. [Google Scholar]
  14. Myrdal, G. Economic Theory and Underdeveloped Regions; Harper & Row: New York, NY, USA, 1957. [Google Scholar]
  15. Haughwout, A. Management of large city regions: Designing efficient metropolitan fiscal policies. J. Reg. Sci. 2010, 50, 401–421. [Google Scholar] [CrossRef]
  16. Gaile, G.L. The spread-backwash concept. Reg. Stud. 1980, 14, 15–25. [Google Scholar] [CrossRef]
  17. Savitch, H.V.; Collins, D.; Sanders, S.; Markham, J.P. Ties that blind: Central cities, suburbs and the new metropolitan region. Econ. Dev. Q. 1993, 7, 341–357. [Google Scholar] [CrossRef]
  18. Hill, E.W.; Wolman, H.L.; Ford, C.C., III. Can suburbs survive without their central cities? Examining the suburban dependent hypothesis. Urban Aff. Rev. 1995, 31, 147–174. [Google Scholar] [CrossRef]
  19. Hollar, M.K. Central cities and suburbs: Economic rivals or allies? J. Reg. Sci. 1958, 51, 231–252. [Google Scholar] [CrossRef]
  20. Howe, S.R.; Allor, D.; Bier, T.; Finnerty, T. The shrinking central city amidst growing suburbs: Case of Ohio’s inelastic cities. Urban Geogr. 1998, 19, 714–734. [Google Scholar] [CrossRef]
  21. Kolenda, R.; Liu, C.Y. Are central cities more creative? The intrametropolitan geography of creative industries. J. Urban Aff. 2012, 34, 487–512. [Google Scholar] [CrossRef]
  22. Savitch, H.V.; Vogel, R.K. Suburbs without a city: Power and city-county consolidation. Urban Aff. Rev. 2004, 39, 758–790. [Google Scholar] [CrossRef]
  23. Voith, R. City and Suburban Growth: Substitutes or Complements? Business Review; Federal Reserve Bank of Philadelphia: Philadelphia, PA, USA, 1992. [Google Scholar]
  24. Voith, R. Do suburbs need cities. J. Reg. Sci. 1992, 38, 445–464. [Google Scholar] [CrossRef]
  25. Hughes, D.W.; Holland, D.W. Core-periphery economic linkage: A measure of spread and possible backwash effects for the Washington economy. Land Econ. 1994, 70, 364–377. [Google Scholar] [CrossRef]
  26. Palumbo, G.; Sacks, S.; Wasylenko, M. Population decentralization with metropolitan areas: 1970–1980. J. Urban Econ. 1957, 27, 151–167. [Google Scholar] [CrossRef]
  27. Leichenko, R.M. Growth and change in U.S. cities and suburbs. Growth Chang. 2001, 32, 326–354. [Google Scholar] [CrossRef]
  28. Ferguson, M.; Ali, K.; Olfert, M.R.; Partridge, M. Voting with their feet: Jobs versus amenities. Growth Chang. 2007, 38, 77–110. [Google Scholar] [CrossRef]
  29. Barkley, D.L.; Henry, M.S.; Bao, S. Identifying ‘spread’ versus ‘backwash’ effects in regional economic areas: A density functions approach. Land Econ. 1996, 72, 336–357. [Google Scholar] [CrossRef]
  30. Schmitt, B. Economic geography and contemporary rural dynamics: An empirical test on some French regions. Reg. Stud. 2000, 33, 697–711. [Google Scholar] [CrossRef]
  31. Schmitt, B.; Henry, M.S.; Piguet, V.; Hilal, M. Urban growth effects on rural population, export and service employment: Evidence from Eastern France. Ann. Reg. Sci. 2006, 40, 779–801. [Google Scholar] [CrossRef]
  32. Carruthers, J.I.; Vias, A.C. Urban, suburban, and exurban sprawl in the Rocky Mountain west: Evidence from regional adjustment Models. J. Reg. Sci. 2005, 45, 21–48. [Google Scholar] [CrossRef]
  33. Ke, S. Determinants of economic growth and spread-backwash effects in Western and Eastern China. Asian Econ. J. 2010, 24, 179–202. [Google Scholar] [CrossRef]
  34. Ying, L.G. Measuring the spillover effects: Some Chinese evidence. Pap. Reg. Sci. 2000, 79, 75–89. [Google Scholar] [CrossRef]
  35. Brun, J.F.; Combes, J.L.; Renard, M.F. Are there spillover effects between coastal and noncoastal regions in China? China Econ. Rev. 2002, 13, 161–169. [Google Scholar] [CrossRef]
  36. Fu, X. Limited linkage from growth engines and regional disparities in China. J. Comp. Econ. 2004, 32, 148–164. [Google Scholar] [CrossRef]
  37. Schmitt, B.; Henry, M.S. Size and growth of urban centers in French labor market areas: consequences for rural population and employment. Reg. Sci. Urban Econ. 2000, 30, 1–21. [Google Scholar] [CrossRef]
  38. Hunt, G.L. Population-employment models: Stationarity, cointegration and dynamic adjustment. J. Reg. Sci. 2006, 46, 205–244. [Google Scholar] [CrossRef]
  39. Freeman, D.G. Sources of fluctuations in regional growth. Ann. Reg. Sci. 2001, 35, 249–266. [Google Scholar] [CrossRef]
  40. Chang, C.; Coulson, N.E. Sources of sectoral employment fluctuation in central cities and suburbs: Evidence from four eastern U.S. cities. J. Urban Econ. 2001, 49, 199–218. [Google Scholar] [CrossRef]
  41. Solé-Ollé, A.; Viladecans-Marsal, E. Central cities as engines of metropolitan area growth. J. Reg. Sci. 2004, 44, 321–350. [Google Scholar] [CrossRef]
  42. Chiang, S. The dilemma of “Twin Cities”: Is the suburban dependence hypothesis applicable? J. Econ. Policy Reform 2014, 17, 149–163. [Google Scholar] [CrossRef]
  43. Groenewold, N.; Lee, G.; Chen, A. Regional output spillovers in China: Estimates from a VAR model. Pap. Reg. Sci. 2007, 86, 101–122. [Google Scholar] [CrossRef]
  44. Groenewold, N.; Lee, G.; Chen, A. Inter-regional spillovers in China: The importance of common shocks and the definition of the regions. China Econ. Rev. 2008, 19, 32–52. [Google Scholar] [CrossRef]
  45. Engle, R.F.; Yoo, B. Co-integration and error correction: Representation, estimation and testing. Econometrica 1987, 55, 251–276. [Google Scholar] [CrossRef]
  46. MacKinnon, J.G. Critical values for cointegration tests. In Long-Run Economic Relationships: Readings in Cointegration; Engle, R.F., Granger, C.W.J., Eds.; Oxford University Press: Oxford, UK, 2016; pp. 267–276. [Google Scholar]
  47. MacKinnon, J.G.; Haug, A.A.; Michelis, L. Numerical distribution functions of likelihood ratio tests for cointegration. J. Appl. Econ. 1991, 14, 563–577. [Google Scholar] [CrossRef]
  48. Lee, C.; Chien, M. Empirical modeling of regional house prices and the ripple effect. Urban Stud. 2011, 48, 2029–2047. [Google Scholar] [CrossRef]
  49. Lee, C.; Chiang, S. Ripple Effect and Regional House Prices Dynamics in China. Int. J. Strateg. Prop. Manag. 2016, 20, 397–408. [Google Scholar] [CrossRef]
Figure 1. Regional economy in China.
Sustainability 10 00451 g001
Figure 2. Greater Yangtze River Delta (YRD) metropolitan region.
Sustainability 10 00451 g002
Figure 3. Jingjinji (JJJ) metropolitan region.
Sustainability 10 00451 g003
Figure 4. The central city and suburban areas in the YRD region. The bold, thin and broken lines are the real GDPs of Shanghai, Jiangsu and Zhejiang, respectively.
Sustainability 10 00451 g004
Figure 5. The central city and suburban areas in the JJJ region. The bold, thin and broken lines are the real GDPs of Beijing, Tianjin and Hebei, respectively.
Sustainability 10 00451 g005
Table 1. Economic development for all areas in two mega metropolitan regions (2015).
Industrial Structure (%)GRP Per Capita (RMB)
PrimarySecondaryTertiary
YRD metropolitan region
Shanghai0.4431.8167.76103,796
Jiangsu5.6845.748.6187,995
Zhejiang4.2745.9649.7677,644
JJJ metropolitan region
Beijing0.6119.7479.65106,497
Tianjin1.2646.5852.15107,960
Hebei11.5448.2740.1940,255
Table 2. ADF tests.
Table 2. ADF tests.
τ τ μ τ τ
ln Y SH 0.834 (5)−0.075 (5)−2.858 (5)
ln Y JS 13.931 (0)1.857 (0)−4.203 *** (1)
ln Y ZJ 3.122 (1)0.173 (1)−3.428 * (1)
ln Y BJ 7.078 (2)0.261 (2)−2.326 (2)
ln Y TJ 6.807 (2)3.175 (2)−0.514 (2)
ln Y HB 2.120 (4)1.491 (2)−2.418 (2)
Δ ln Y SH −0.660 (4)−6.382 *** (4)−6.719 *** (1)
Δ ln Y JS −1.598 (1)−5.238 *** (0)−5.609 *** (0)
Δ ln Y ZJ −1.673 * (0)−3.868 *** (0)−3.825 ** (0)
Δ ln Y BJ −0.736 (8)−9.536 *** (1)−9.455 ** (1)
Δ ln Y TJ −0.217 (7)−2.235 (6)−7.431 *** (1)
Δ ln Y HB −0.887 (3)−7.272 *** (1)−7.594 ** (1)
Notes: τ , τ μ , and τ τ represent the random walk, random walk with drift and random walk with a constant and time trend, respectively. ***, ** and * represent the 1%, 5% and 10% levels of statistical significance, respectively, based on [46]. The numbers in parentheses are the lags calculated based on the Schwartz Information Criterion.
Table 3. Model specification.
RankModel 1Model 2Model 3Model 4Model 5
YRD metropolitan region (lags = 5)
027.303 **41.308 ***34.356 **65.268 ***59.334 ***
19.775 **20.239 *18.995 *34.896 ***30.545 ***
17.52821.069 **15.361 *30.372 **28.790 ***
7.32213.76514.265 *18.464 *17.148 **
20.2067.3042.45311.908 *11.908 ***
0.2067.3042.45311.908 *11.908 ***
JJJ metropolitan region (lags = 3)
065.171 ***71.679 ***36.572 ***48.627 **32.572 *
46.844 ***47.250 ***20.955 *25.538 *15.874
118.327 ***24.428 **15.617 **23.08916.699 *
16.386 ***16.427 **12.372 *13.20910.066
21.9418.001 *3.245 *9.8816.632 **
1.9418.001 *3.245 *9.8816.632 **
Note: r is the number of co-integrating relations. For critical values, the interested reader can refer to [47]. Two values are computed by the λ t r a c e   and   λ max tests, ***, ** and * represent the 1%, 5% and 10% levels of statistical significance respectively.
Table 4. Long-run equilibrium in two metropolitan regions.
RegionLong-Run Equilibrium
YRD metropolitan region ln Y ZJ = 0 . 678 ( 10 . 103 ) * * * ln Y SH + 1 . 560 ( 24 . 956 ) * * * ln Y JS
JJJ metropolitan region ln Y HB = 149 . 356 + 3 . 608 ( 2 . 727 ) * * * t 59 . 222 ( 18 . 589 ) * * * ln Y BJ + 19 . 130 ( 2.791 ) * * * ln Y TJ
Note: The values in parentheses are the t statistics.
Table 5. Weak exogeneity test.
YRD Metropolitan RegionJJJ Metropolitan Region
JSSHZJHBBJTJ
Statistics7.706 ***0.1551.7471.6500.4763.859 **
p-value0.0060.6940.1860.1990.4900.049
Note: The likelihood-ratio test is based on the χ 2 ( 1 ) value. *** and ** represent the 1% and 5% levels of statistical significance.

