1. Introduction
Land use and land cover change (LUCC), a prominent feature in the field of global change [
1], is the direct effect on the natural environment provoked by human activities [
2]. Approximately more than 45% of the Earth’s surface changed into other kinds of land use type due to human impact [
3]. The land use and cover change also affect the public health and climate through the changes of earth’s surface, which is an important aspect of sustainable development [
4,
5]. Since the 1990s, this has received growing attention from domestic and foreign experts and scholars [
6]. The society has experienced significant urbanization including a huge trend of human migration from the country to big cities, which has caused a great change of land use [
7,
8,
9,
10]. Countries with emerging market economies like China have experienced rapid change from being an agricultural country to becoming an industrialized country [
11]. LUCC has a significant effect on the ecology, environment, economy, and society and has already caused disastrous effects all over the world [
12]. The National Research Committee (NRC) of America first pointed out the worldwide research framework of LUCC as early as 1990. Some scholars like B.L. Turner of Clark University in USA and D. Skole at the University of Michigan mainly studied the driving force of LUCC, the land use’s effect on land cover, the temporal and spatial change of LUCC, and worldwide forecast model research on LUCC [
13,
14,
15].
There are numerous studies on the LUCC in different regions using statistic models [
16,
17]. Existing studies mostly take place on the macro scale and use remote sensing, GIS, and fractal and geo-information map analysis to describe the evolution of regional land use patterns. On small scales, mathematical models have been developed to research land use change such as the diffusion limited aggregation model, cellular automata model, multi-agent model, and more. The early stage of research on the LUCC model is the dynamic static model, which is mainly based on central place theory and has significant limitations since this kind of model assumes the system is static and lacks concern about the history and future development of urban land use [
18,
19,
20,
21,
22]. Since the 1930s, there has been rapid development of the static model of urban space with a focus on spatial change [
6]. This kind of static model can reflect the spatial distribution of the components of urban land use systems and the interaction among those elements. However, the disadvantage is that it cannot explain the dynamic evolution process of urban land use [
23]. In recent years, with the remarkable progress of computer hardware and GIS technology, research on urban land use models is developing rapidly especially with regard to big data and geospatial data. The early, dynamic top-down model has been gradually replaced by the bottom-up model of urban land use, which was based on the study of characteristics of urban land use evolution on small scales [
24,
25,
26].
In order to better manage land use planning, it is crucial to understand the driving forces behind the LUCC. Du et al. described the land use change patterns of Jiangsu province in China and analyzed the driving forces using socio-economic patterns [
27]. Xu et al. used the logistic regression model to analyze the impact of potential driving forces behind the LUCC [
28]. Li et al. characterized the spatiotemporal pattern of LUCC and summarized the landscape aspect driving forces [
29]. Sahana et al. mainly discussed the driving forces of forestry changes as an aspect of ecology [
30]. Li et al. took Tibet as a case study to analyze the driving forces of LUCC in undeveloped regions in Western China [
31]. The existing research about the driving forces mainly uses static models to describe the LUCC spatial or temporal patterns and later analyzes the driving forces for the specific regions [
32,
33,
34,
35].
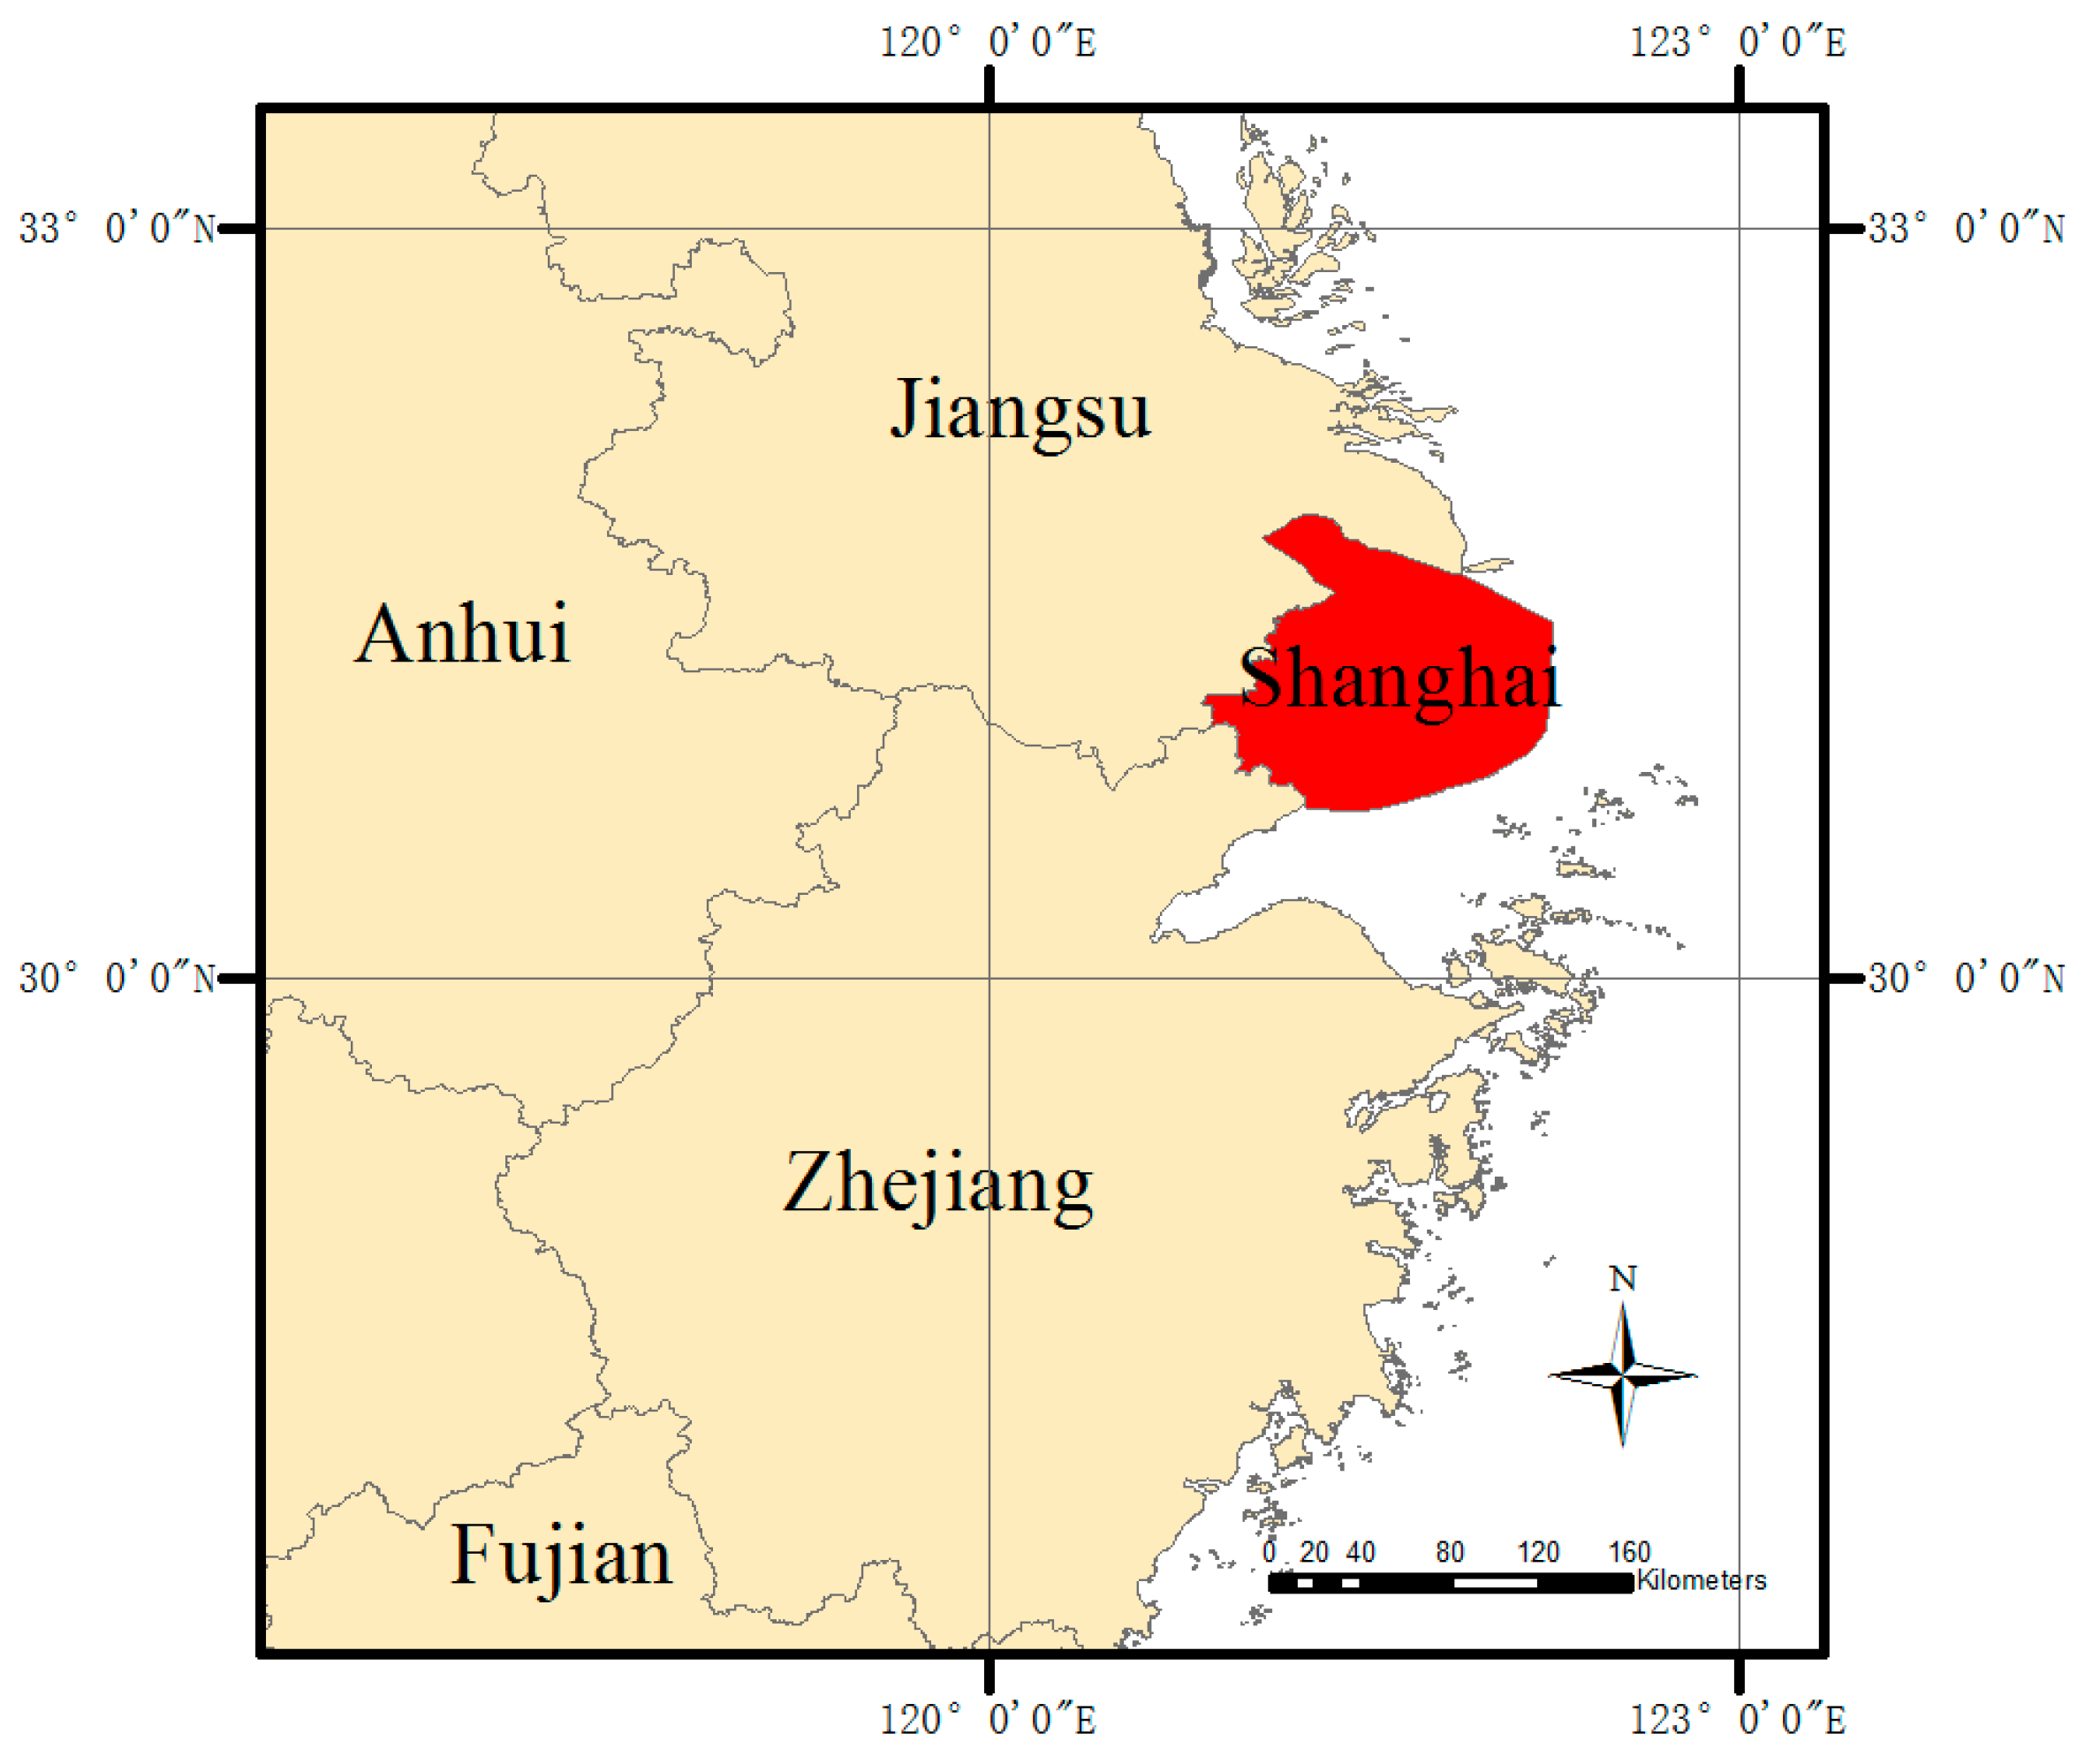
To summarize, existing literature has numerous models to describe the change situation of land use globally, but there is a gap in describing the relationship between LUCC and social driving forces especially in places developing quickly. In this paper, LUCC was quantified for the past 30 years in Shanghai, which is a highly urbanized city with a high economic development speed. This paper analyzes urban areas at large scales with the support of remote sensing and GIS technology to study the spatial pattern of main land use and analyze the land use pattern and evolution characteristics during the past 30 years. This study aims to optimize the future land use type and structure, promote the efficiency of land resource protection, and provide useful guidance for planning departments to make reasonable decisions. The results and conclusions about this LUCC can be adapted to similar regions experiencing fast economic growth.
3. Results
3.1. The Temporal and Spatial Variation Trend of Land Use and Cover Change
The spatial and temporal characteristics of land use and land cover in the past twenty years in Shanghai city were analyzed using the spatial superposition of land use data.
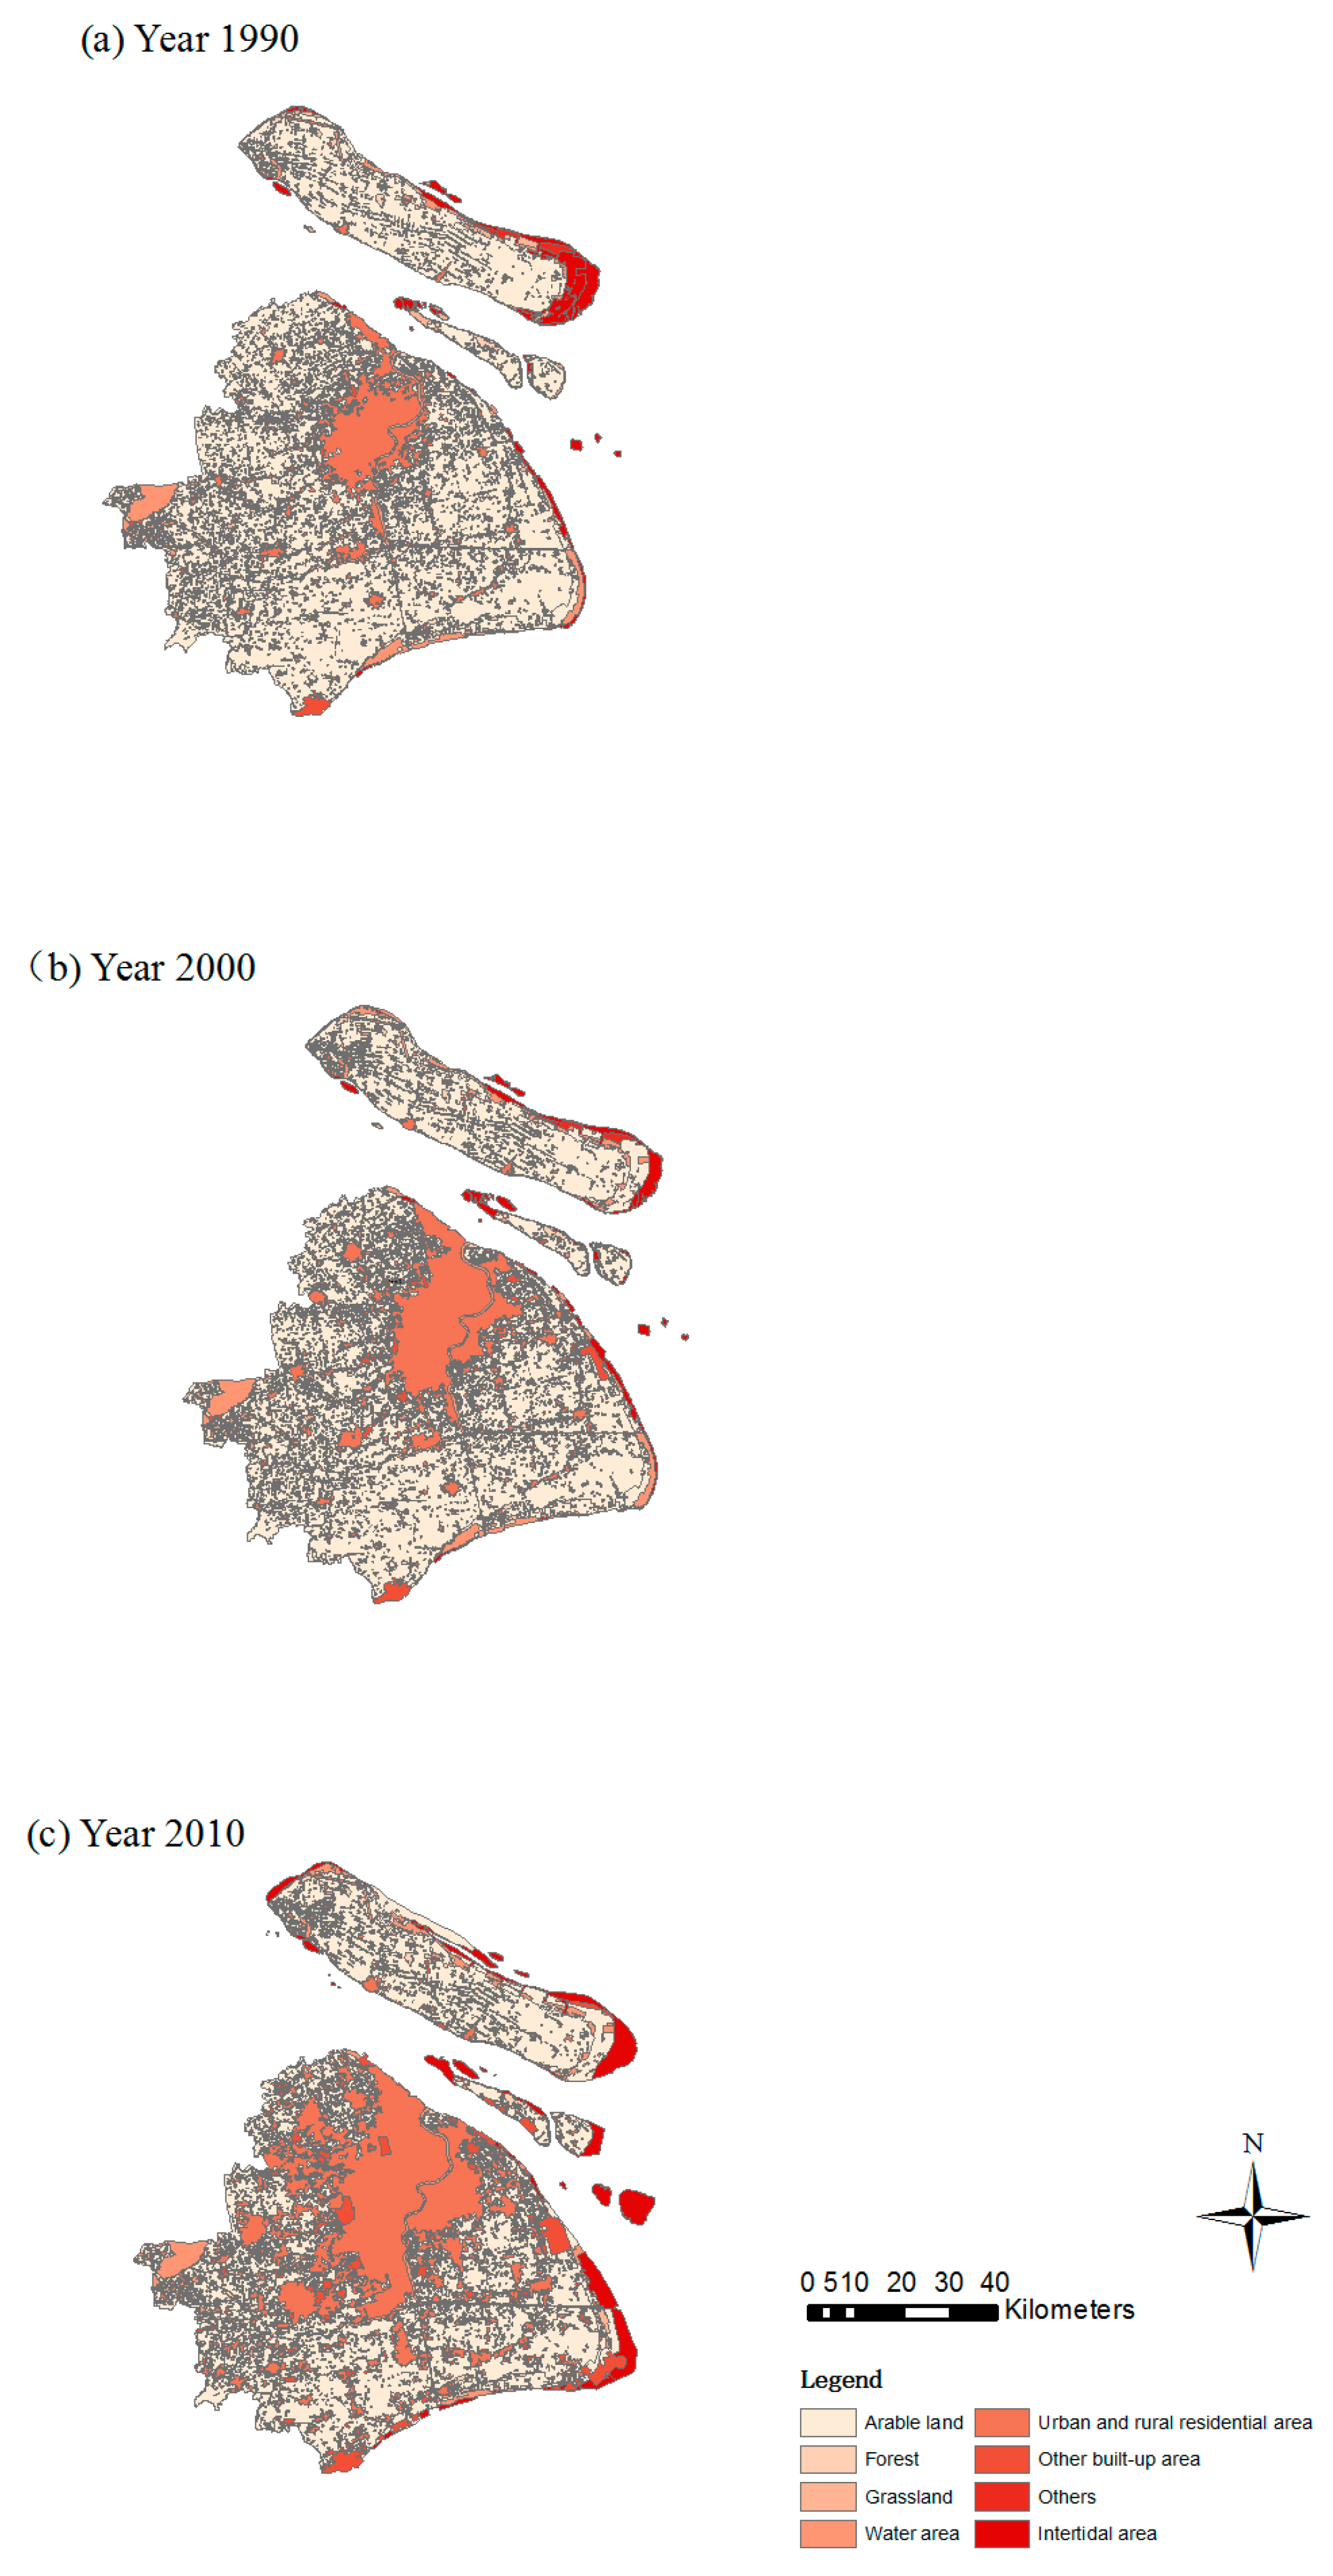
Using the Arc/Info Grid software module (ESRI, Redlands, CA, USA), the spatial data of land use were compared and we generated the spatial distribution of land use types in three periods of Shanghai from 1990 to 2010 (see
Figure 3). The clear variation of land use type was the expansion of built-up area in the Minhang District and the Baoshan District and the expansion of intertidal area along the Yangtze River as a result of deposits from sediment at Yangtze River estuary and Hangzhou Bay. The intertidal area also changed into built-up area, which has caused land use variation. From 2000 to 2010, we can see the change from the figures below. This change of land use type is more clear than from 1990 to 2010. The main change during this period occurred in the Baoshan District, Jiading District, Songjiang District, Minhang District and Pudong District in the city center. There was also intertidal area expansion along the Yangtze River.
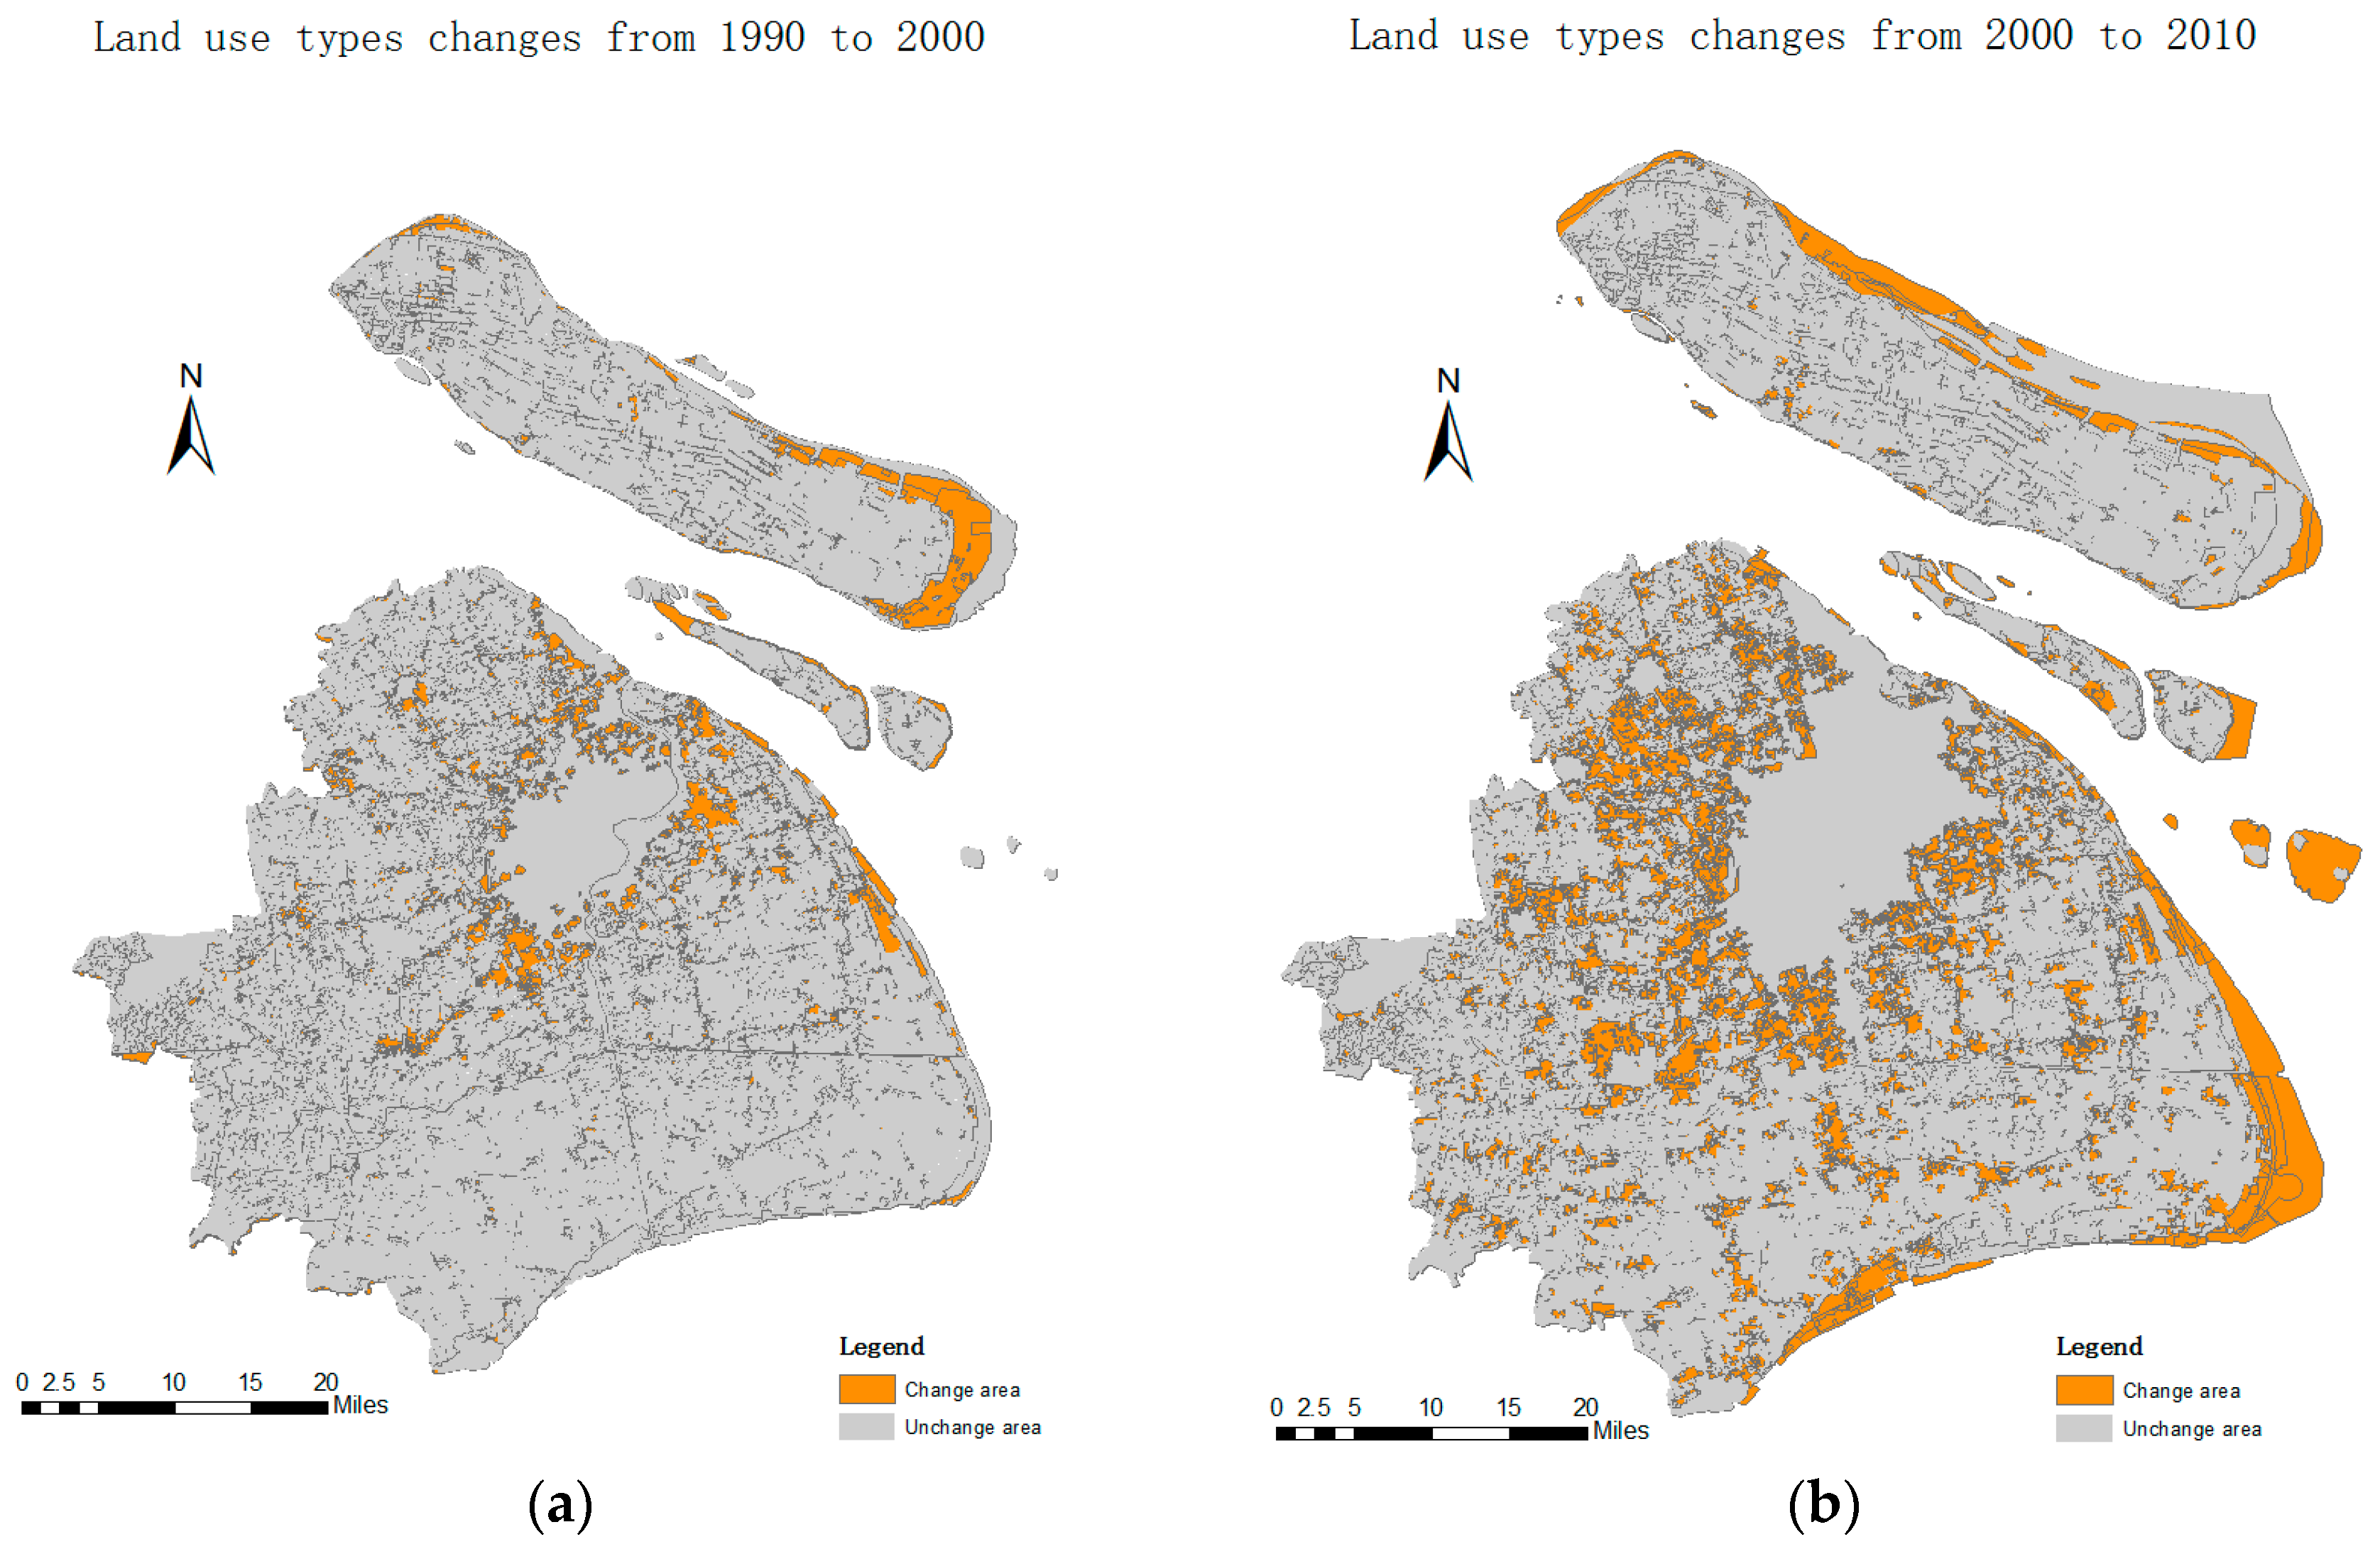
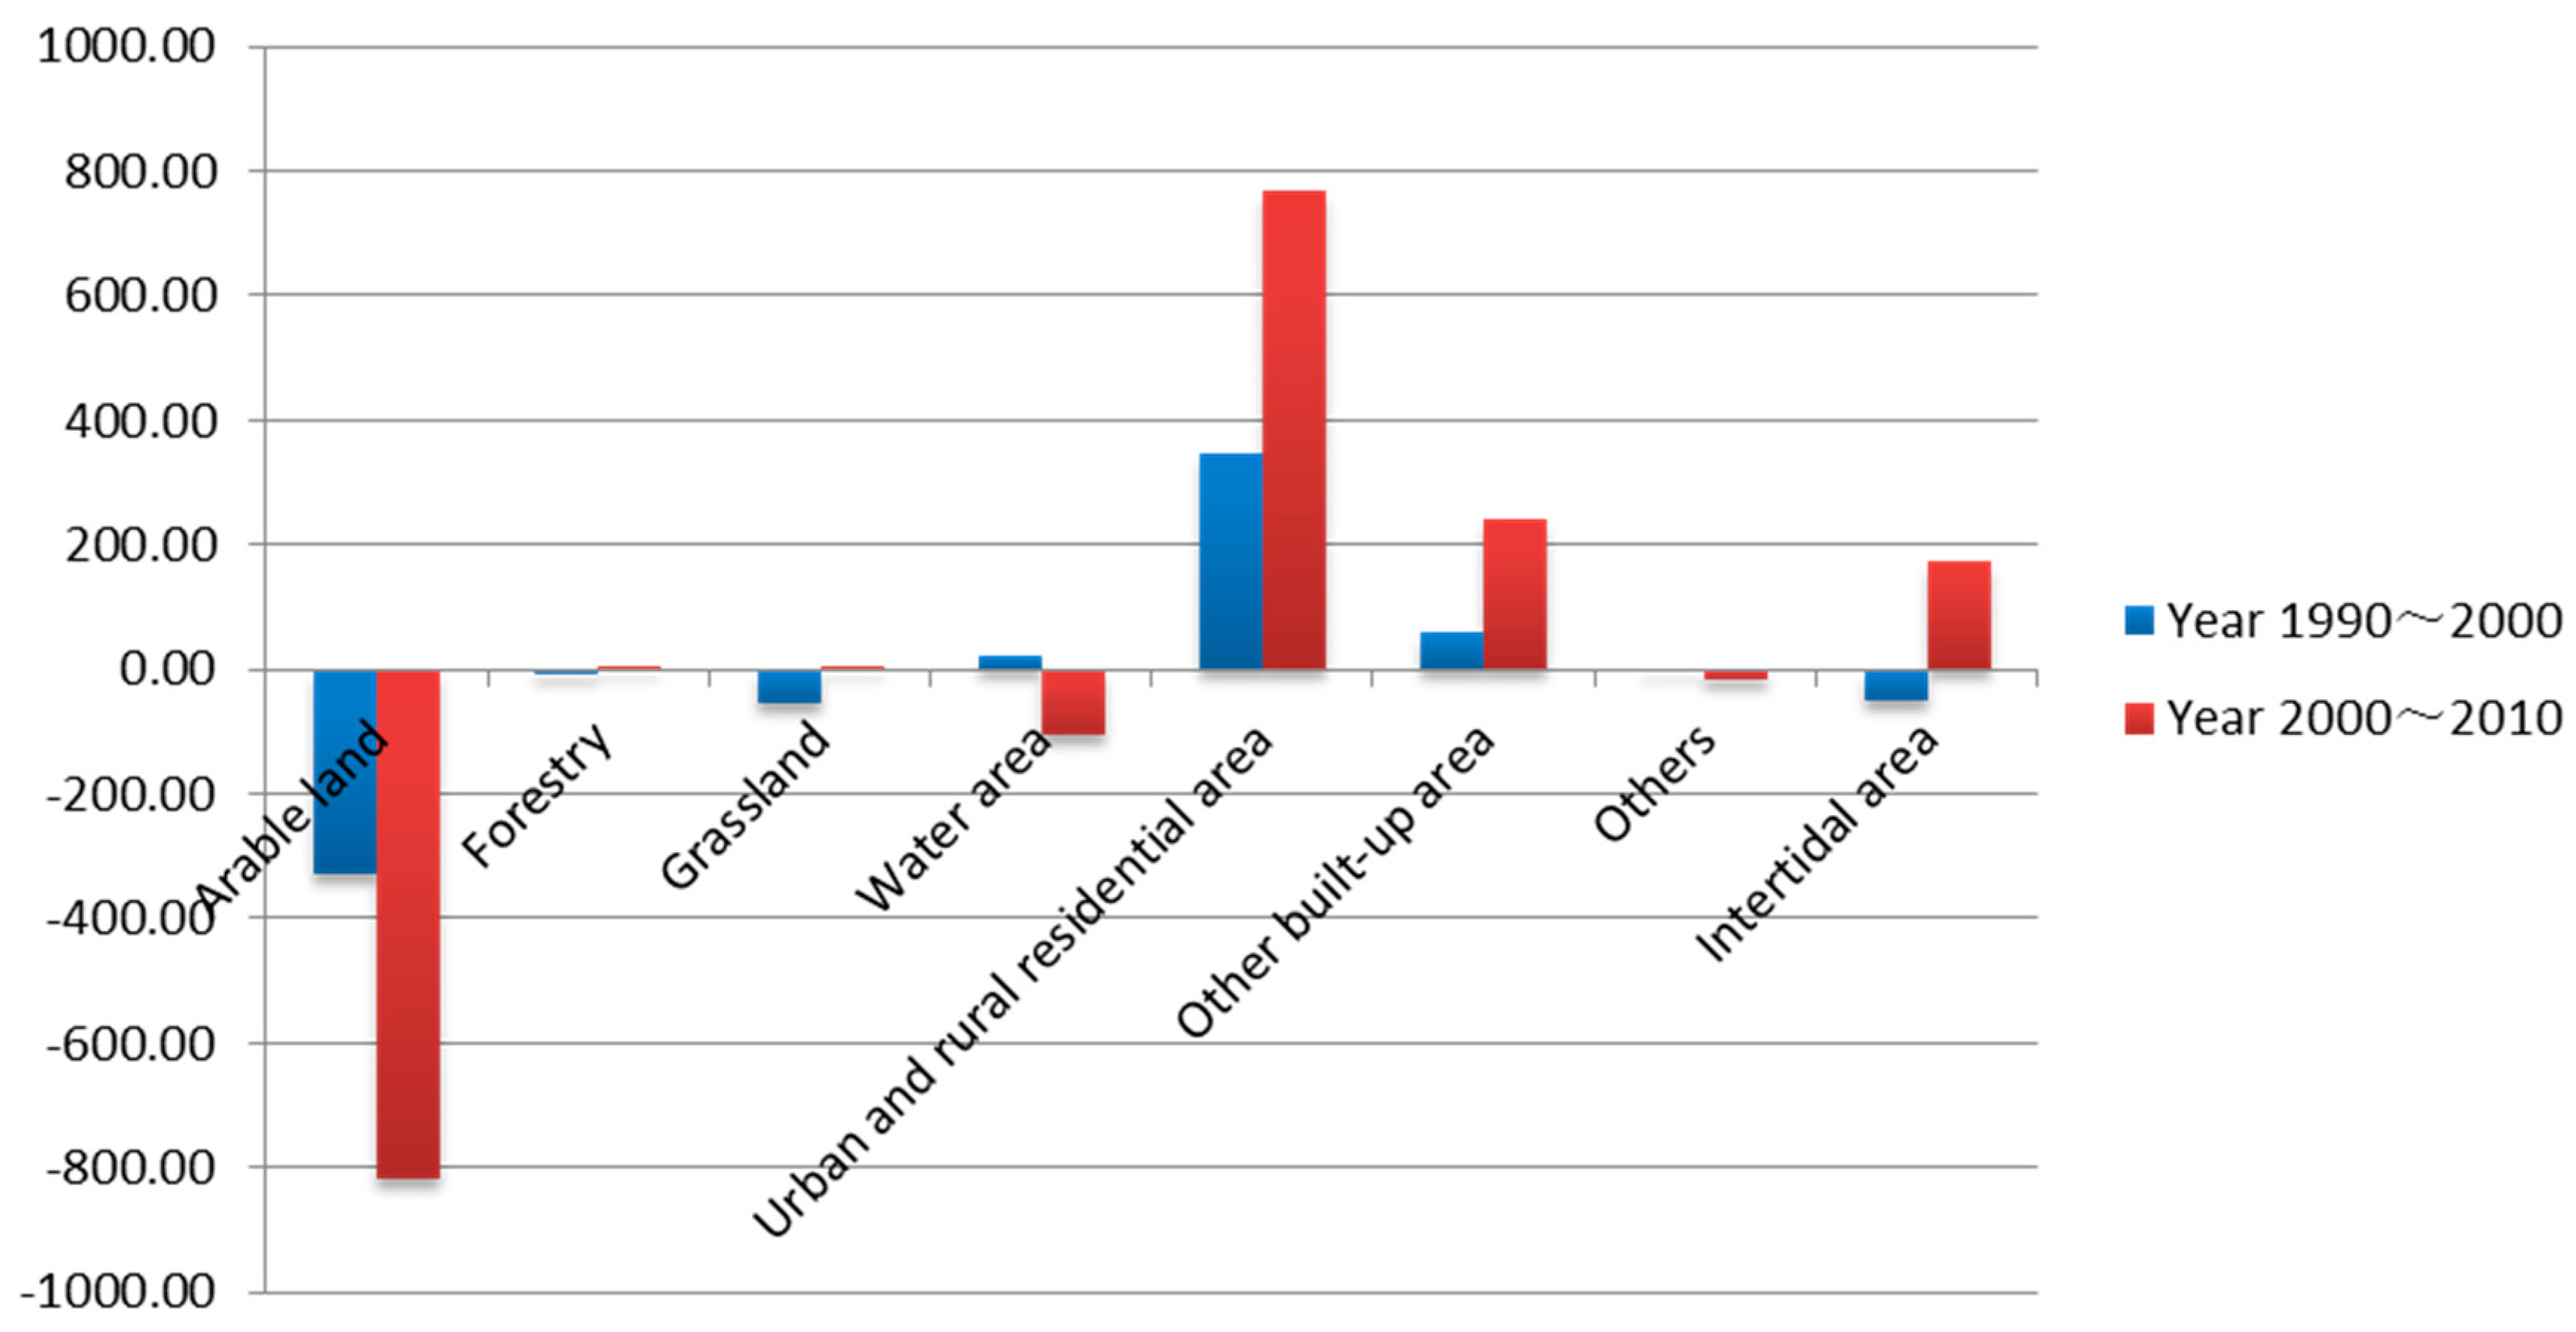
With a further analysis of the three phases of land use change maps, we conducted a deeper comparison of the changes (see
Figure 4). We found that from 1990 to 2000, there was a reduction of arable land, forest, grassland, and intertidal area and an increase in water area, urban and rural residential area, and other built-up area among which the reduction of arable land and the increase of urban and rural residential area was more significant than the others. From 2000 to 2010, there was a reduction of arable land, water area, and other land and an increase in forest, grassland, urban and rural residential area, other built-up area, and intertidal area among which the decrease of arable land and the increase of urban and rural residential area and intertidal area were more significant than the others.
Looking at the area of each land use type change from 1990 to 2010, the change of urban and rural residential area land use type is the clearest. The urban and rural residential area covered 12.4% of the total area of Shanghai in 1990, which changed to 16.73% in 2000. This was an increase of 408.01 km2. In 2010 it covered 25.53%, which was an increase of 1115.46 km2. The second apparent change is the arable land. It covered 60.83% of all city area in 1990, but decreased to 56.82% in 2000 and further decreased to 45.20% in 2010. This was a reduction of 1146.94 km2. The water area showed an increasing trend at first and then a decreasing trend. It covered an area of 20.6% in 1990, increased by 22.83 km2 to 20.9% in 2000, and decreased by 103.65 km2 to 19.07% in 2010.
From the data mentioned above, we can conclude how the main characteristics of Shanghai land use changed from 1990 to 2010. There is an overall reduction trend in the area of arable land, but the arable land is still one of the main types of land use in Shanghai. The area and percentage of urban and rural residential area and other built-up area have a significant increase. Water area reduced significantly while the intertidal area increased rapidly. Additionally, other land use types changed into arable land and other types of land.
We can conclude that there are three main changes in the types of land use change by analyzing three phrases of land use and cover change data in Shanghai. First is the change from one land use type to another. For example, natural grassland changes into arable land or arable land changes into urban and rural residential area. The changing results reflect an improvement of the land use degree and the overall urbanization. The second is the change from one land use type to another and then changing again to a third type after a certain period. Only the original type and the final type will be considered in this study. Multiple changes of land use type fully reflect the rapid development of urbanization of Shanghai in recent years since the land use type change is extremely frequent due to highly concentrated urban construction. The third phrase is the change from one land use type to another but then turning back into the original type after a certain period of development. For example, natural grassland is occasionally reclaimed into arable land for agriculture use but returned back to grassland or forest due to government-established policies about the conversion of degraded farm land into forest and grassland. Another example is when some water area in the metropolitan area was filled and changed into urban construction during the process of urbanization, but years later, turned back into water area due to a government-held city river dredging project. This kind of change in land use type only has influence on short-term land use change research and there is little significance for long-term research. Thus it is an invalid land use type change during the long term.
3.2. The Land Use Transition Matrix from 1990 to 2010
We used the tabulate command of ArcGIS software to calculate the Markov chain transmission matrix of land use in Shanghai with a further goal of analyzing the changing trend of land use types (see
Table 2 and
Table 3). Over twenty years, a steady reduction of arable land changing to other land use types was the most significant feature of land use change in Shanghai. Moreover, the main pattern was the transformation into urban and rural residential areas and other built-up areas. From 1990 to 2000, the reduction of arable land was 420.07 km
2 of which 82.15% changed into urban and rural residential area and 13.04% changed into other construction land. From 2000 to 2010, the reduction of arable land was 965.70 km
2 of which 79.2% changed into urban and rural residential area and 17.88% changed into other construction land. This reflects that from 1990 to 2010, the biggest change of arable land was into urban and rural residential area and other construction area due to the development of urbanization and industrialization as well as the construction of metropolitan areas, which occupy a large amount of arable land. Only some of the land changed into forest, grassland, and intertidal area.
The transition trend between forest, grassland water area, and arable land is also significant. Arable land is one of the main sources changing to forest as well as forest changing back to arable land. From 2000 to 2010, 10.92 km2 of arable land changed into forest and grassland while an area of 3.78 km2 of forest and grassland changed back to arable land. This shows that there is a considerable amount of transition between forestry land, grassland, and arable land. In addition, the intertidal area provides a certain amount of arable land every year due to Shanghai’s specific geographic situation along the Yangtze River. From 1990 to 2000, the changing direction of intertidal area was toward becoming arable land and water area among which 73.5% of intertidal area changed into arable land. From 2000 to 2010, the intertidal area mainly changed into arable land, other built-up land, and water area. The biggest change was toward arable land with 37.9% of the intertidal area changing into arable land. During the 20-year time period, the main change of intertidal area was to arable land with an area of 88.0 km2 reclaimed into arable land. Moreover, the grassland changed into water area and intertidal area from 1990 to 2000, because the Shanghai government promoted the building of some parks within the urban area and along the Yangtze River, which had some collapsed area.
3.3. The Land Use Dynamic Degree
The land use variation dynamic degree model is used to study the intensity of land use and cover change variation to analyze the dynamic changes of land use types. Based on the land use situation, the land use transition matrix model, and the land use variation dynamic degree model described above in
Section 2, we calculated the single land use variation dynamic degree of Shanghai from 1990 to 2000 and 2000 to 2010 (see
Table 4).
We can see that from 1990 to 2000 the single land use dynamic degree of other built-up area was the highest at 11.72%. Next was grassland with a value of −8.51%. Among the rest, the degree value of urban and rural residential area (3.47%) and intertidal area (−2.04%) is significant. From 2000 to 2010, the single land use variation dynamic degree of other built-up area was also high and increased to 21.37%, which is an increase of 1.82 times from 1990 to 2000. The dynamic degree change of other types had a value of −10 with the single land use variation dynamic degree of grassland (8.87%) and intertidal area (6.04%) changing from negative to positive at a very high variation. The dynamic degree of urban and rural residential area increased continuously by 5.74% and is 1.65 times higher from 1990 to 2000. The overall land use variation dynamic degree of Shanghai from 2000 to 2010 was 2.46 times higher from 1990 to 2000.
The entire land use variation dynamic degree of Shanghai from 2000 to 2010 was more pronounced than that from 1990 to 2000. Grassland and intertidal area changed from decreasing to increasing and the increased amount was larger than before. Forest areas also changed from decreasing to increasing, but the variation dynamic degree was decreasing. Urban and rural residential areas and other built-up areas were continuously increasing, and the increasing size was much larger than before. Arable land decreased continuously and the size was larger than before. As a whole, within these 20 years, the land use and cover change situation in Shanghai was active due to rapid economic development and urbanization.
3.4. The Temporal Evolution of Land Use Degree
In the Database of Natural Resource of China (DNRC), Liu et al. pointed out a classification and grading standard of land use degree from the perspective of ecology by dividing land use into four categories (see
Table 5) [
43].
The land use degree model can show us the spatial-temporal changes of land use degree in the study area. Based on the land use degree model, we generated the land use degree of all land use types from 1990 to 2010 incorporating the three phases of the dataset (see
Table 6). We can see that the overall trend of land use degree increased from 1990 to 2010, which reflects that Shanghai is located in the Yangtze River Delta city circle, which is one of China’s economic centers. Human activity has a relatively large effect on land use there. With rapid development of economy, society and urbanization, the effect made by human beings will continue to increase.
Urban and rural residential areas and other built-up areas are continuously increasing, which reflects that Shanghai has experienced a great success in urbanization since 1990 since the land use of urban settlement increased gradually. Intertidal areas changed from negative in 2000 to positive in 2010, which reflects that Shanghai’s intertidal area is in a developing process due to the physical geography. Arable land, forest, and grassland are all experiencing a decreasing period, which shows that during the rapid process of urbanization in Shanghai, large amounts of arable land, forest, and grassland are changed into urban built-up areas.
The reason for the increase of the whole city’s land use degree of Shanghai is mainly unused area changing into forest and grassland, forest and grassland being reclaimed into arable land, and arable land changing into urban and rural residential area. Some areas may have a decline in land use degree due to local policy returning arable land back to forest or grassland.
4. Discussion
The results above provide detailed analysis of the spatial and temporal characteristics of land use in Shanghai during the 20-year period from 1990 to 2010. In general, the reason for the change of land use are probably social factors or government policies affecting social development, changes in the natural environment such as natural factors affecting the intertidal area, and scientific and technological factors affecting the development of humanity and society. However, the land use change in Shanghai caused by the above three factors is relatively slow. The Chinese population migration from rural regions in West China to urban area in East China and the strong economic and population growth of Shanghai should be the main driving forces. We consider human activity and social economic development as the most important factors causing land use change when analyzing the driving forces within a small time scale, which will be discussed in more detail below [
44].
4.1. Driving Force of Human Activity
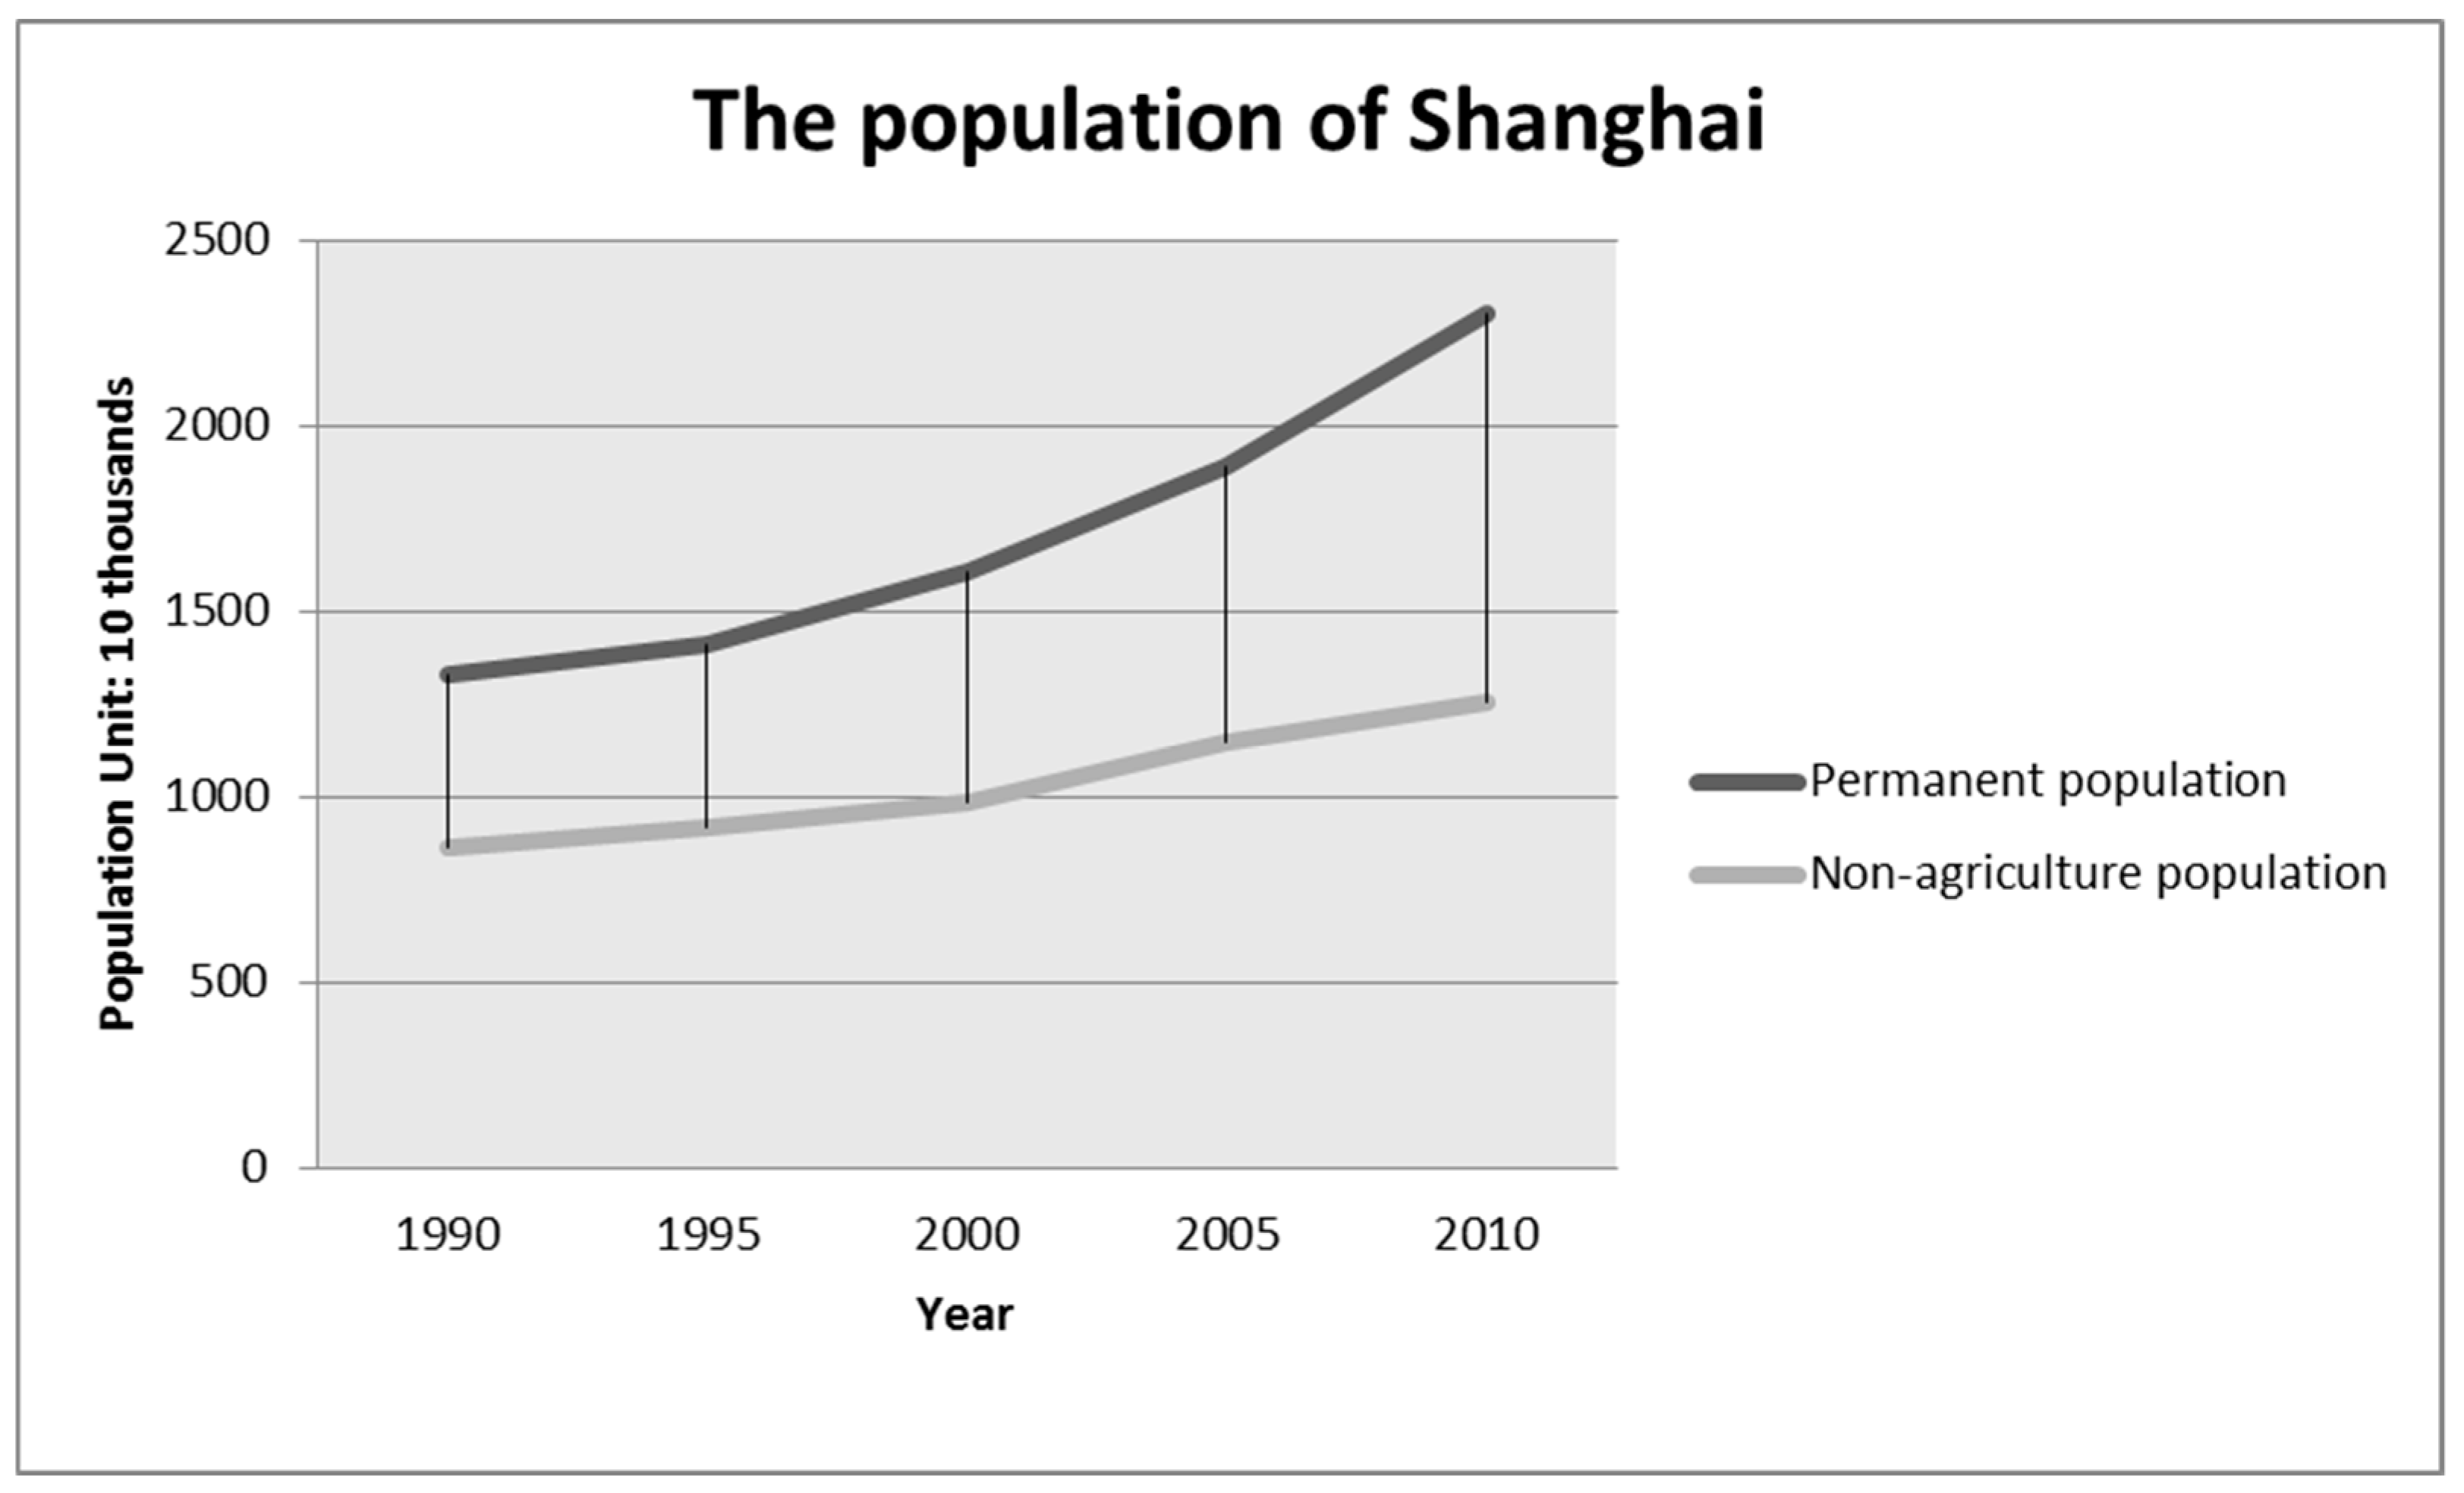
The driving forces of human activity are mainly due to population increases, economic factors, and the macroeconomic policy of government. Urban and rural population increase and its ratio is an important factor to reflect the urban population pressure. Based on the National Bureau of Statistics of China, Shanghai Yearbook [
37], the population of Shanghai, percentage of population increase, and percentage of population working in agriculture are shown in
Table 7 and
Figure 5. The data reflects that the development of Shanghai’s population and the percentage of non-agricultural population is far above the national average and suggests this will increase in the future. Additionally, the population growth is nonlinear and accelerating. The rapid development of Shanghai’s urban area will lead to deterioration of the environment, a rapid rise in land prices, traffic congestion, and rising living costs. As a result, people have begun to move to the suburbs of Shanghai such as Pudong New District and Minhang District to promote the urbanization process of Shanghai, which also affects change on land use.
People’s living standards are one of the main driving forces of land use change. According to the National Bureau of Statistics of China, Shanghai Year book (2015) [
37], Shanghai’s per capita housing area was 20.01 m
2 per person in 1990, which increased to 33.02 m
2 per person in 2000 and 64.70 m
2 per person in 2010. Thus, urban built-up will need more built-up land to meet basic needs as urbanization progresses and people’s living standards develop. Due to the increase in per capita housing area and population development, urban built-up will need to expand the amount of built-up land and occupy more arable land, which would convert arable land into built-up land. With the reduction of arable land, people need to open up wasteland to expand the arable land to meet rising food demands. As a result, forest and grassland need to be converted to arable land, which would decrease the amount of forest area significantly. At the same time, the grain yield per unit area of arable land improved and reduced the pressure on arable land to a certain extent. This is due to the improvement of human society, science technology, and agriculture efficiency. As a whole, arable land is still one of the main land use types of Shanghai. Under the national policy of returning arable land to forest and returning arable land to grassland, some arable land turned back to forest and grassland, which increased the size of artificial forestry land and artificial grassland.
Due to Chinese reform, there have been an increasing number of events and international conferences that may have a certain effect on land use in Shanghai. For example, the international Formula One World Championship events and the World Expo in 2010 all caused a change of land use surrounding the conference area.
4.2. The Driving Force of Social Economy Development
Socioeconomic development is one of the main driving forces of land use and cover change during the process of urbanization. From 1990 to 2010, Shanghai’s economic situation maintained a rapid growth trend. The GDP in 1990 was 78.16 billion yuan, which increased to 477.11 billion yuan in 2000 and increased again to 1716.59 billion in 2010. The GDP grew by a factor of 20.96 times over 20 years. Per capita GDP also increased during the study period. It was 5911 yuan per person in 1990, 30,047 yuan per person in 2000, and 76,074 per person in 2010 [
37].
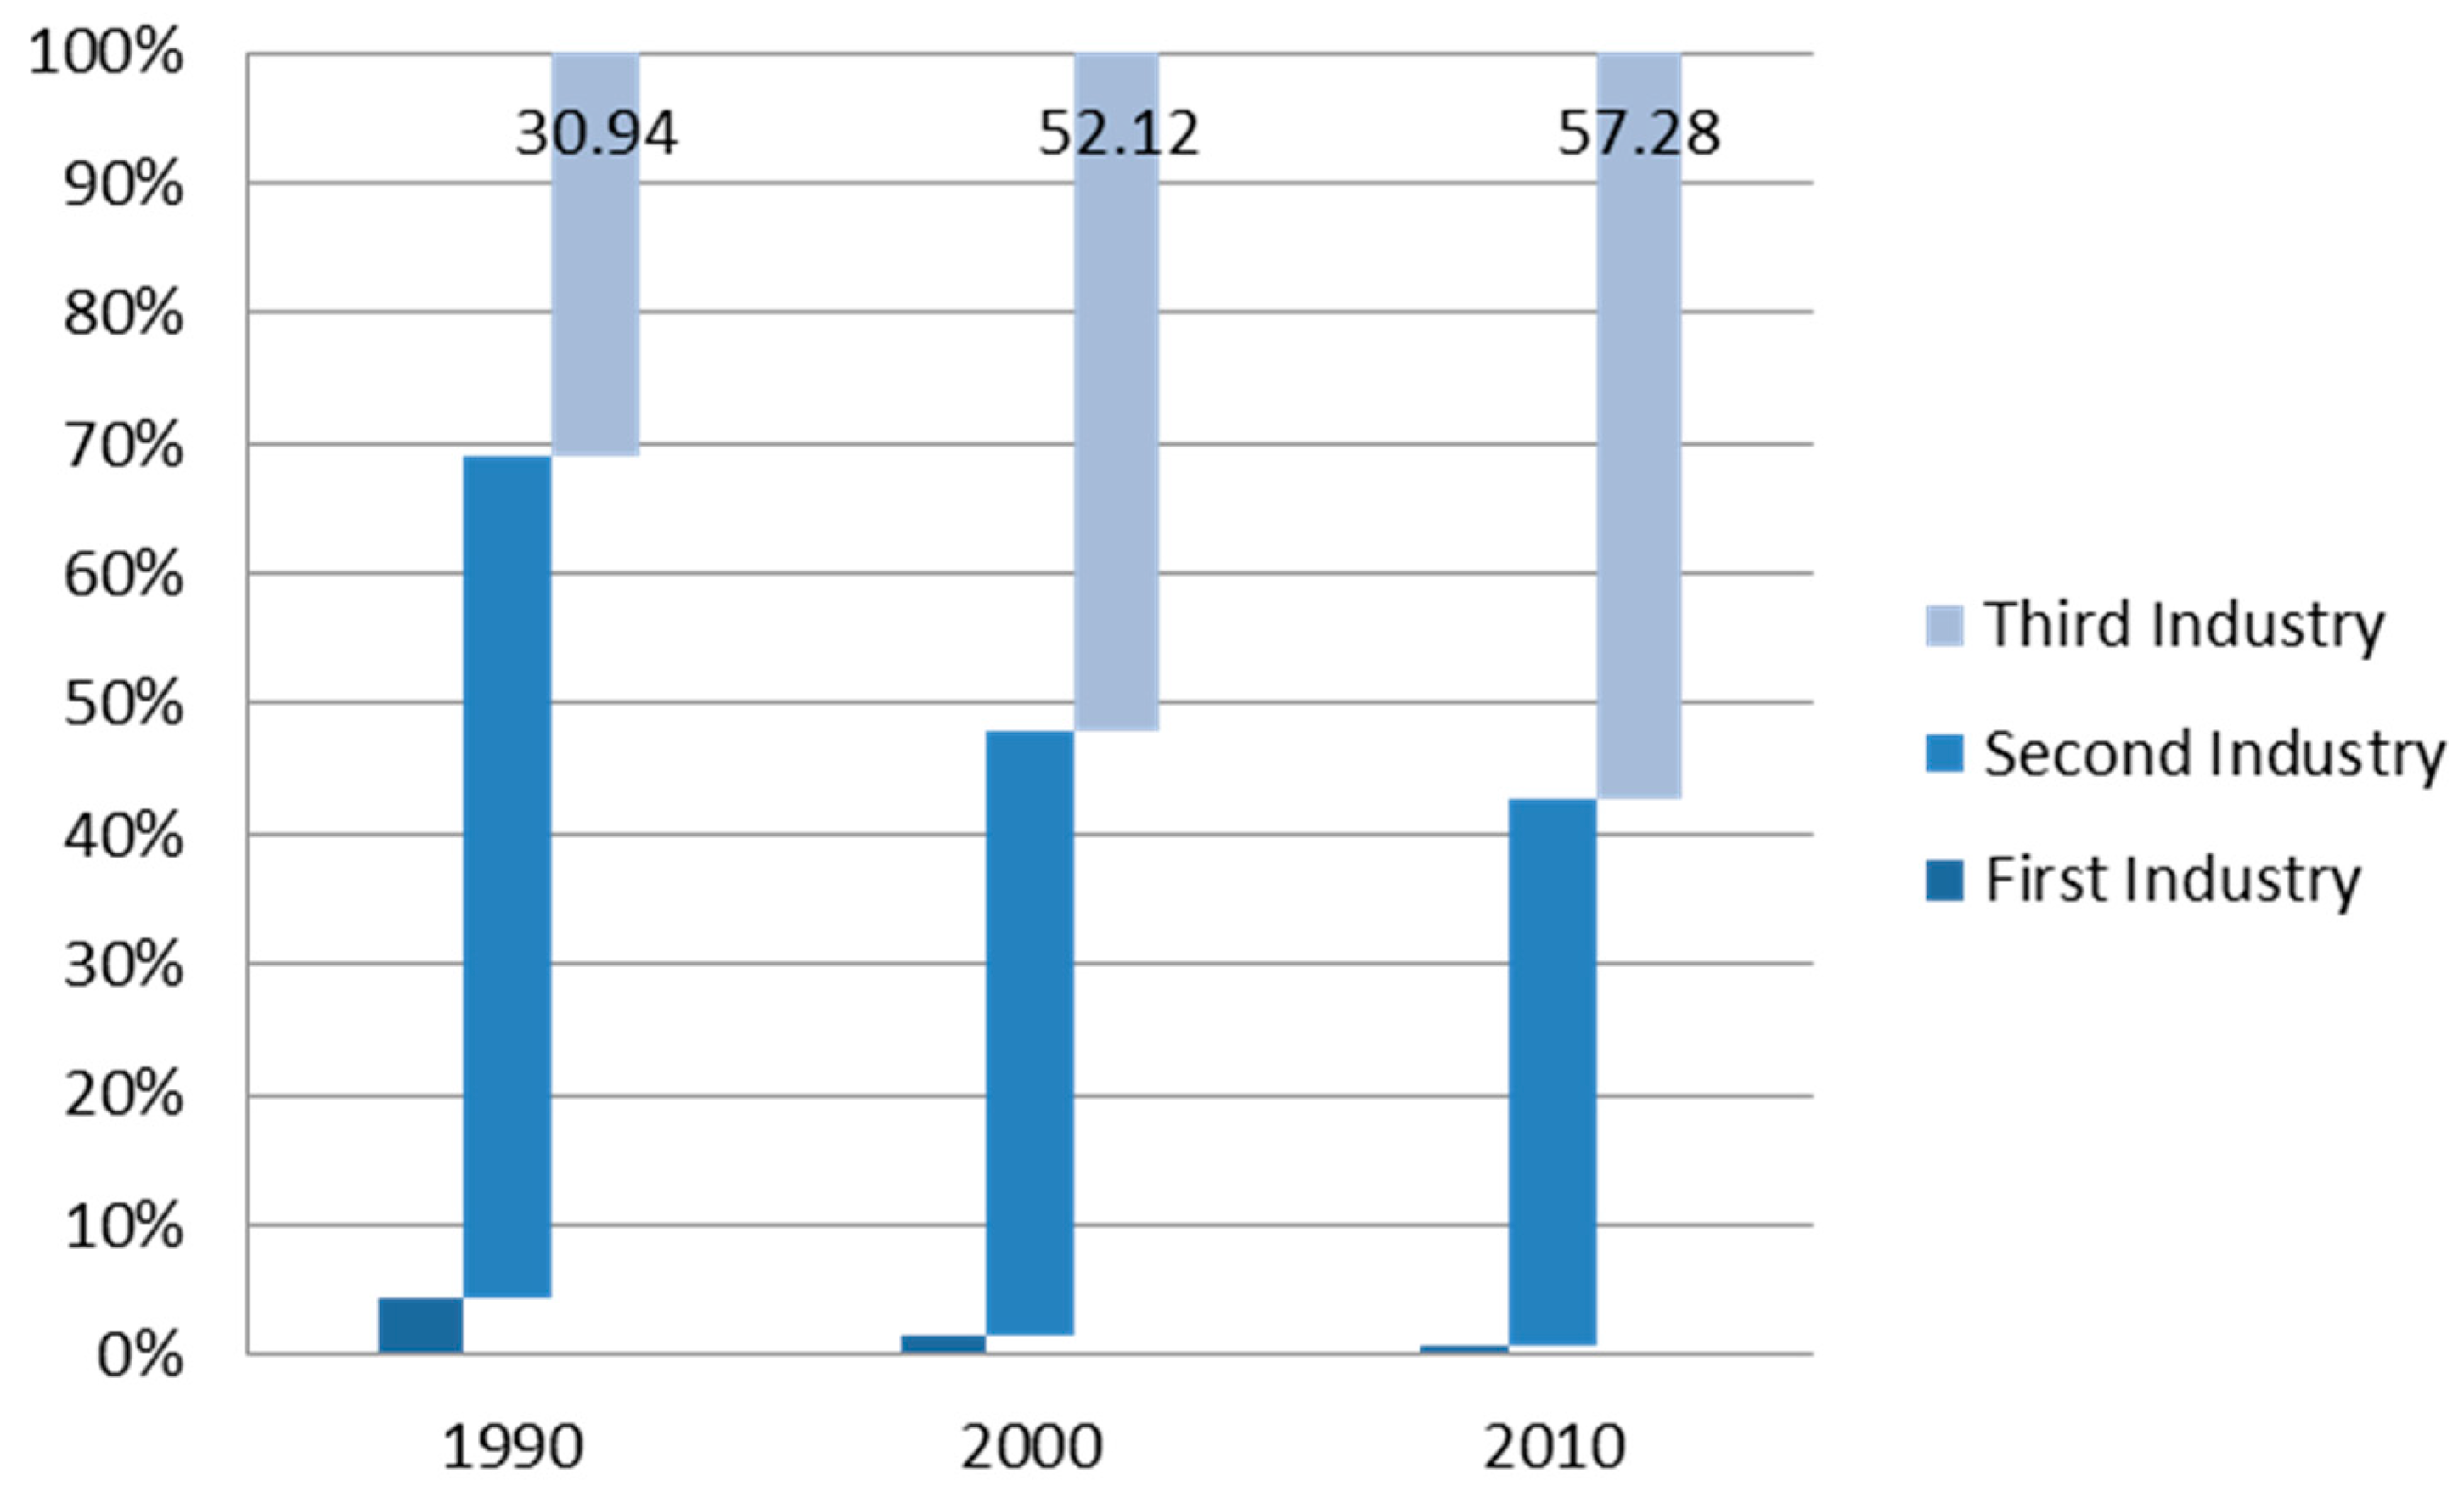
With the rapid development of the economy, the industrial structure is also under constant transformation and optimization. The proportion of the agriculture decreases rapidly and the proportion of the industry also decreases while the proportion of services continues to improve. In 1990, the proportions of the agriculture, industry, and services were 4.38%, 64.68% and 30.94%. In 2000, these factors were 1.61%, 46.27%, and 52.12%. By 2010, they changed to 0.66%, 42.05% and 57.28%. The industrial structure of Shanghai holds industry and services as the main contributors and agriculture a supplement (see
Figure 6).
With fast economic development and changes in industrial structure, the transition of rural area to urban area is further accelerated, the urbanization of the population increases, the urban scale expands, and investments in urban built-up increase. Thus, the need for urban built-up area is increasing, which promotes the transformation of the old city and the expansion of new areas in the city. Reviewing the development of Shanghai in the past 20 years, especially after 2000, investment in real estate has been rapidly increasing. In this period, a lot of large-scale infrastructure projects were completed such as the Shanghai-Hangzhou high-speed railway, metro line two in the downtown area, the International Conference Center, Pudong International Airport, and more. This economic development has promoted the process of urbanization and industrialization, which has led to an expansion of urban built-up land and a decrease of arable land. This has led to clear changes of land use patterns.
5. Conclusions
In this study, taking the land use and cover dataset of Shanghai from 1990 to 2010 as an example, we analyzed the temporal and spatial dynamic characteristic of land use through mathematical models. More specifically, we analyzed the land use type, land use degree, and land use type transmission matrix model. From the discussions above, land use change is significant in Shanghai from 1990 to 2010. The clearest change is the increase of urban and rural residential area. On the contrary, the arable land decreased between 1990 and 2010. This method of using remote sensing and ArcGIS software to analyze LUCC evolution can accurately and objectively collect data and provide a novel idea and method for researching land use and cover change in the future. The LUCC of other region can also be applied with this method.
Shanghai, the fastest growing city in the Yangtze River Delta city circle in the Eastern coastal area of China, will continue to maintain a good economic and social development trend in the future, achieve better economic structure, and improve comprehensive strength. This is certain to further increase pressure to protect arable land, which may lead to higher requirements for Shanghai’s land use structure optimization and environmental protection. The findings have implications for future land use planning. The land use change trend in large cities will change with the development of society and economy. In the future, we should focus on promoting the vitality of the existing built-up land, optimize land use structure, make efforts to realize the high-efficiency of land use patterns, and pay attention to the sustainable use of land under the framework of social, economic, and ecological benefits.


