Analysis of Accessibility in an Urban Mass Transit Node: A Case Study in a Bangkok Transit Station


Abstract
1. Introduction
2. Literature Review
2.1. Transit Accessbility
2.2. Bangkok’s Mass Transit Systems
3. Research Methods
3.1. Research Purpose
3.2. Space Syntax Method
3.3. Betweenness Method
- i = network
- j = origin location
- k = destination location
- r = search radius
- njk = the number of shortest paths between origin (j)
- and destination (k)
- W[j] = the weight of origin j
3.4. Selection of Site Stations
3.5. Overview of Selected Stations
4. Results of Accessibility Analysis
4.1. Analysis of Accessibility around the Stations
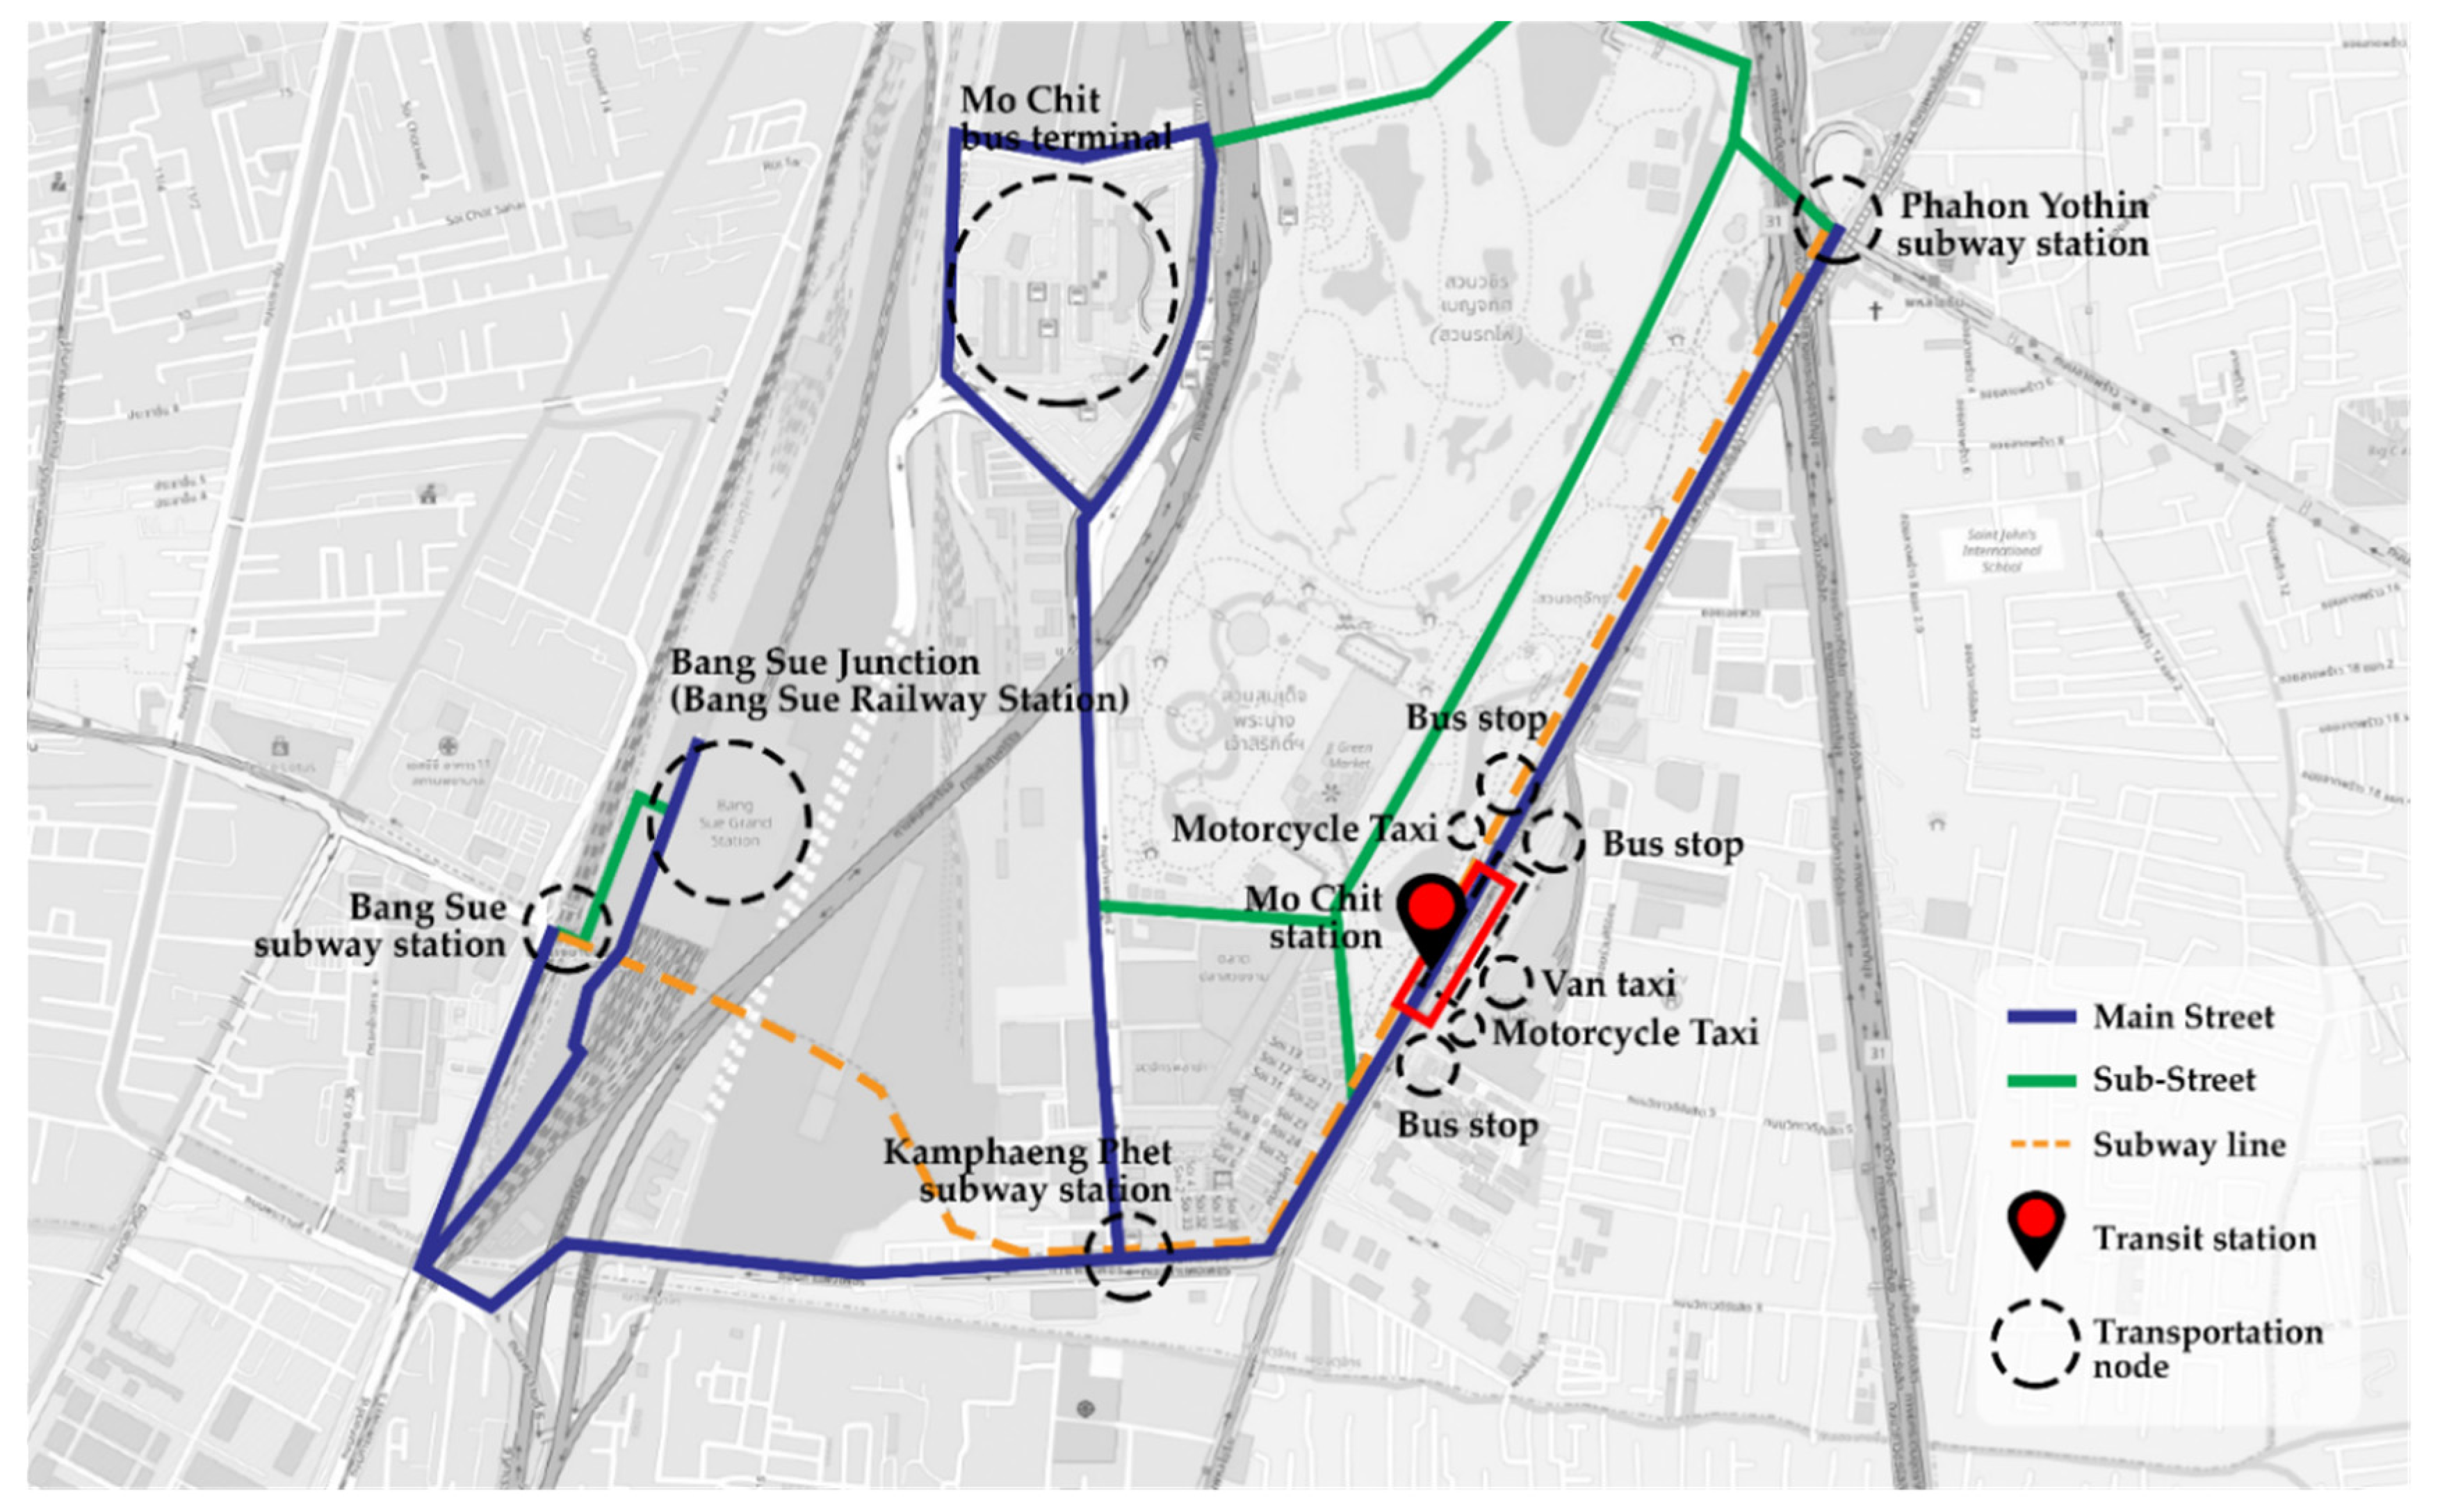
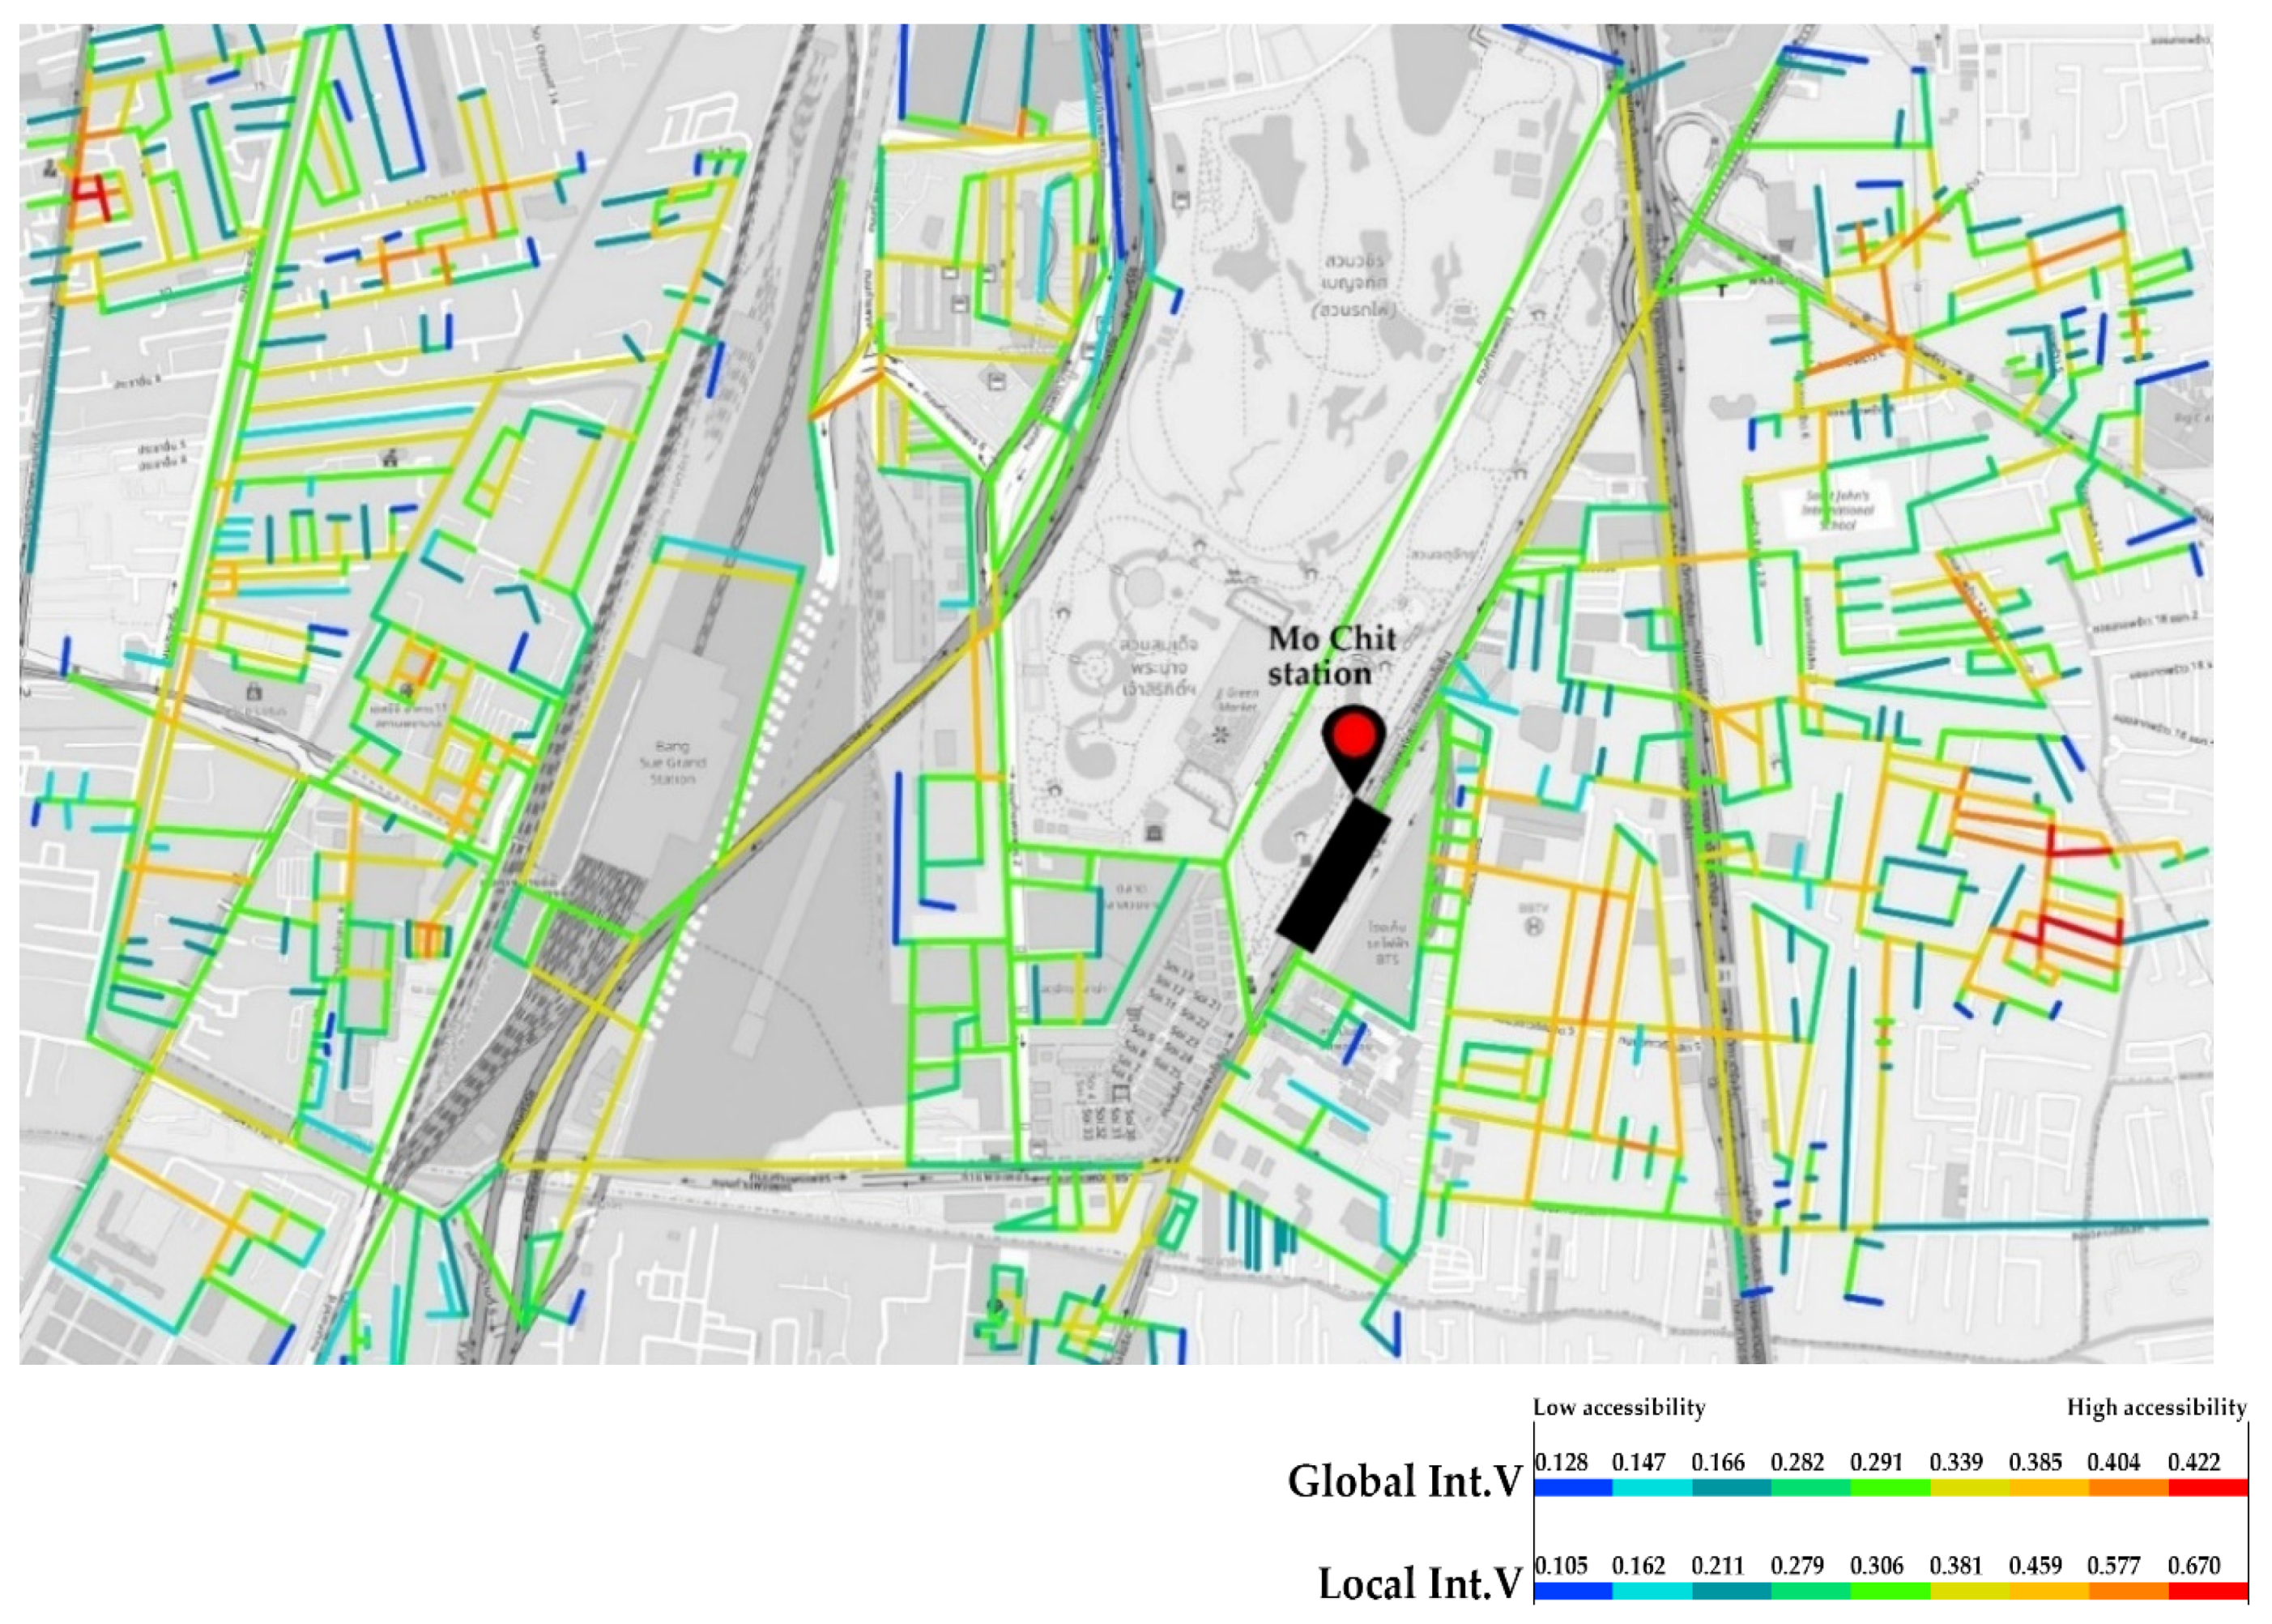
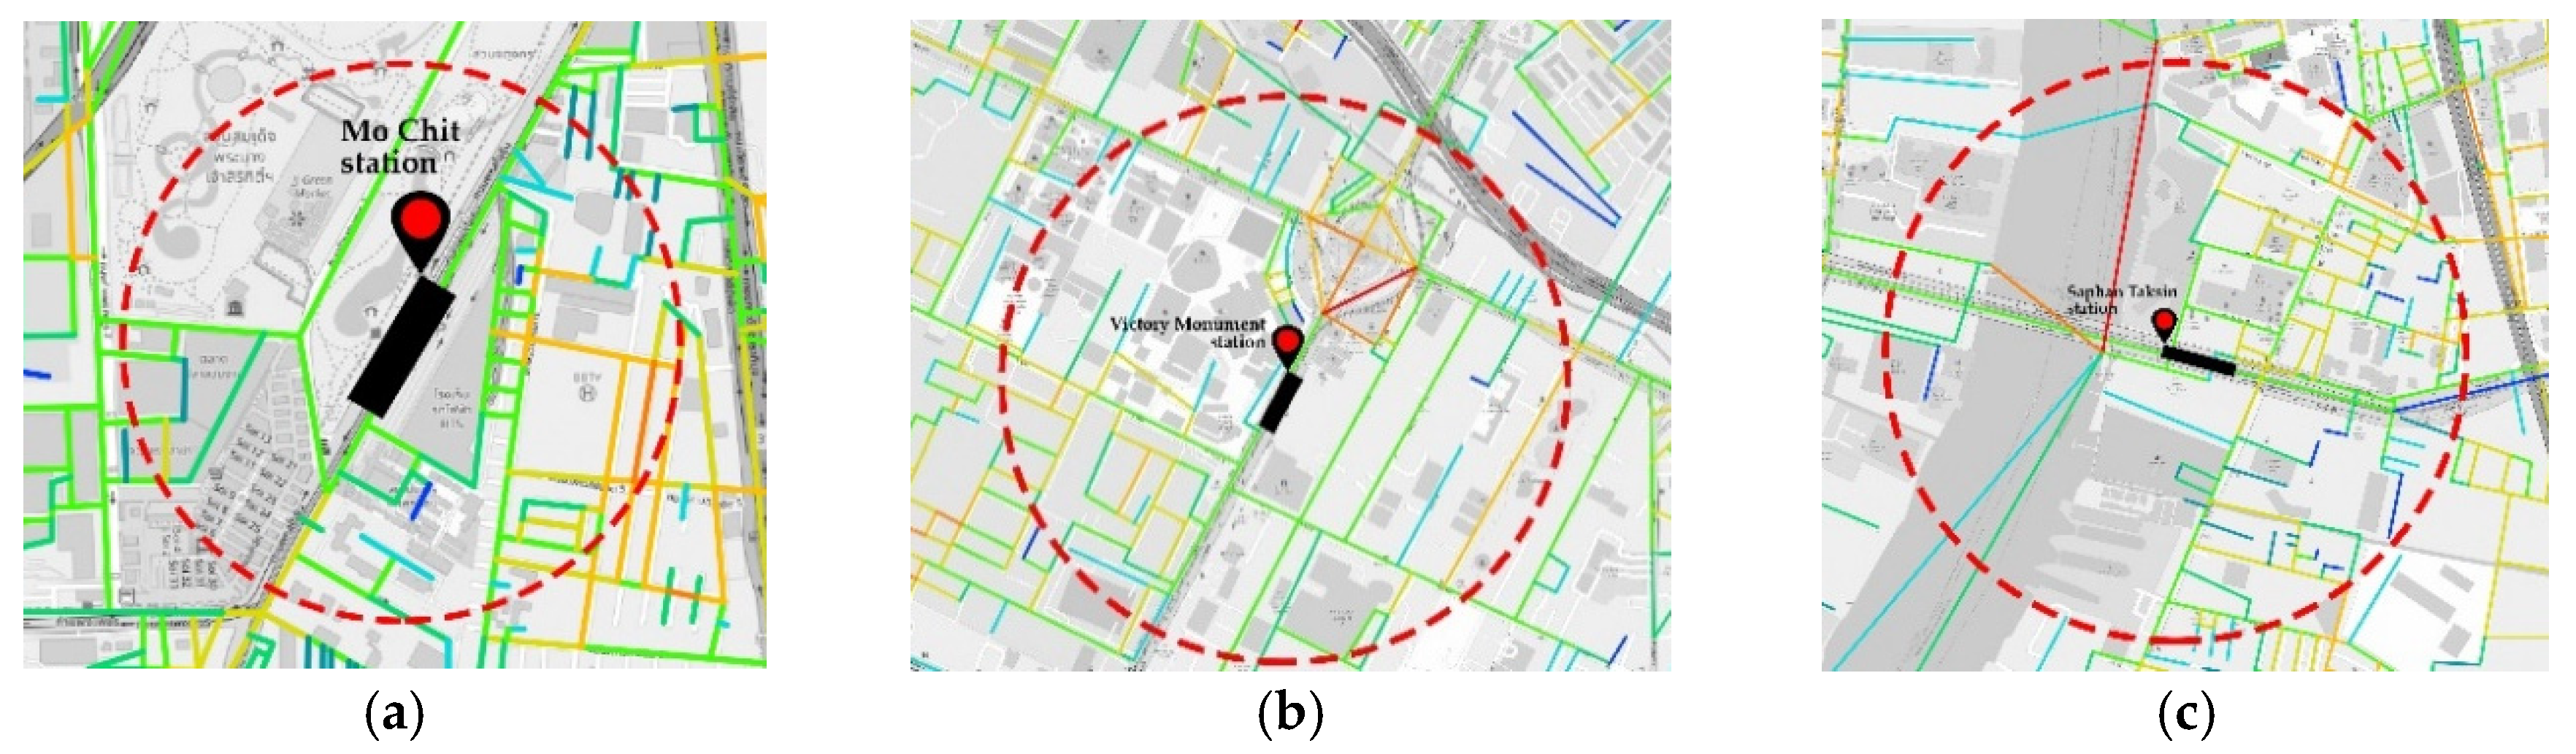
4.1.1. Mo Chit Station
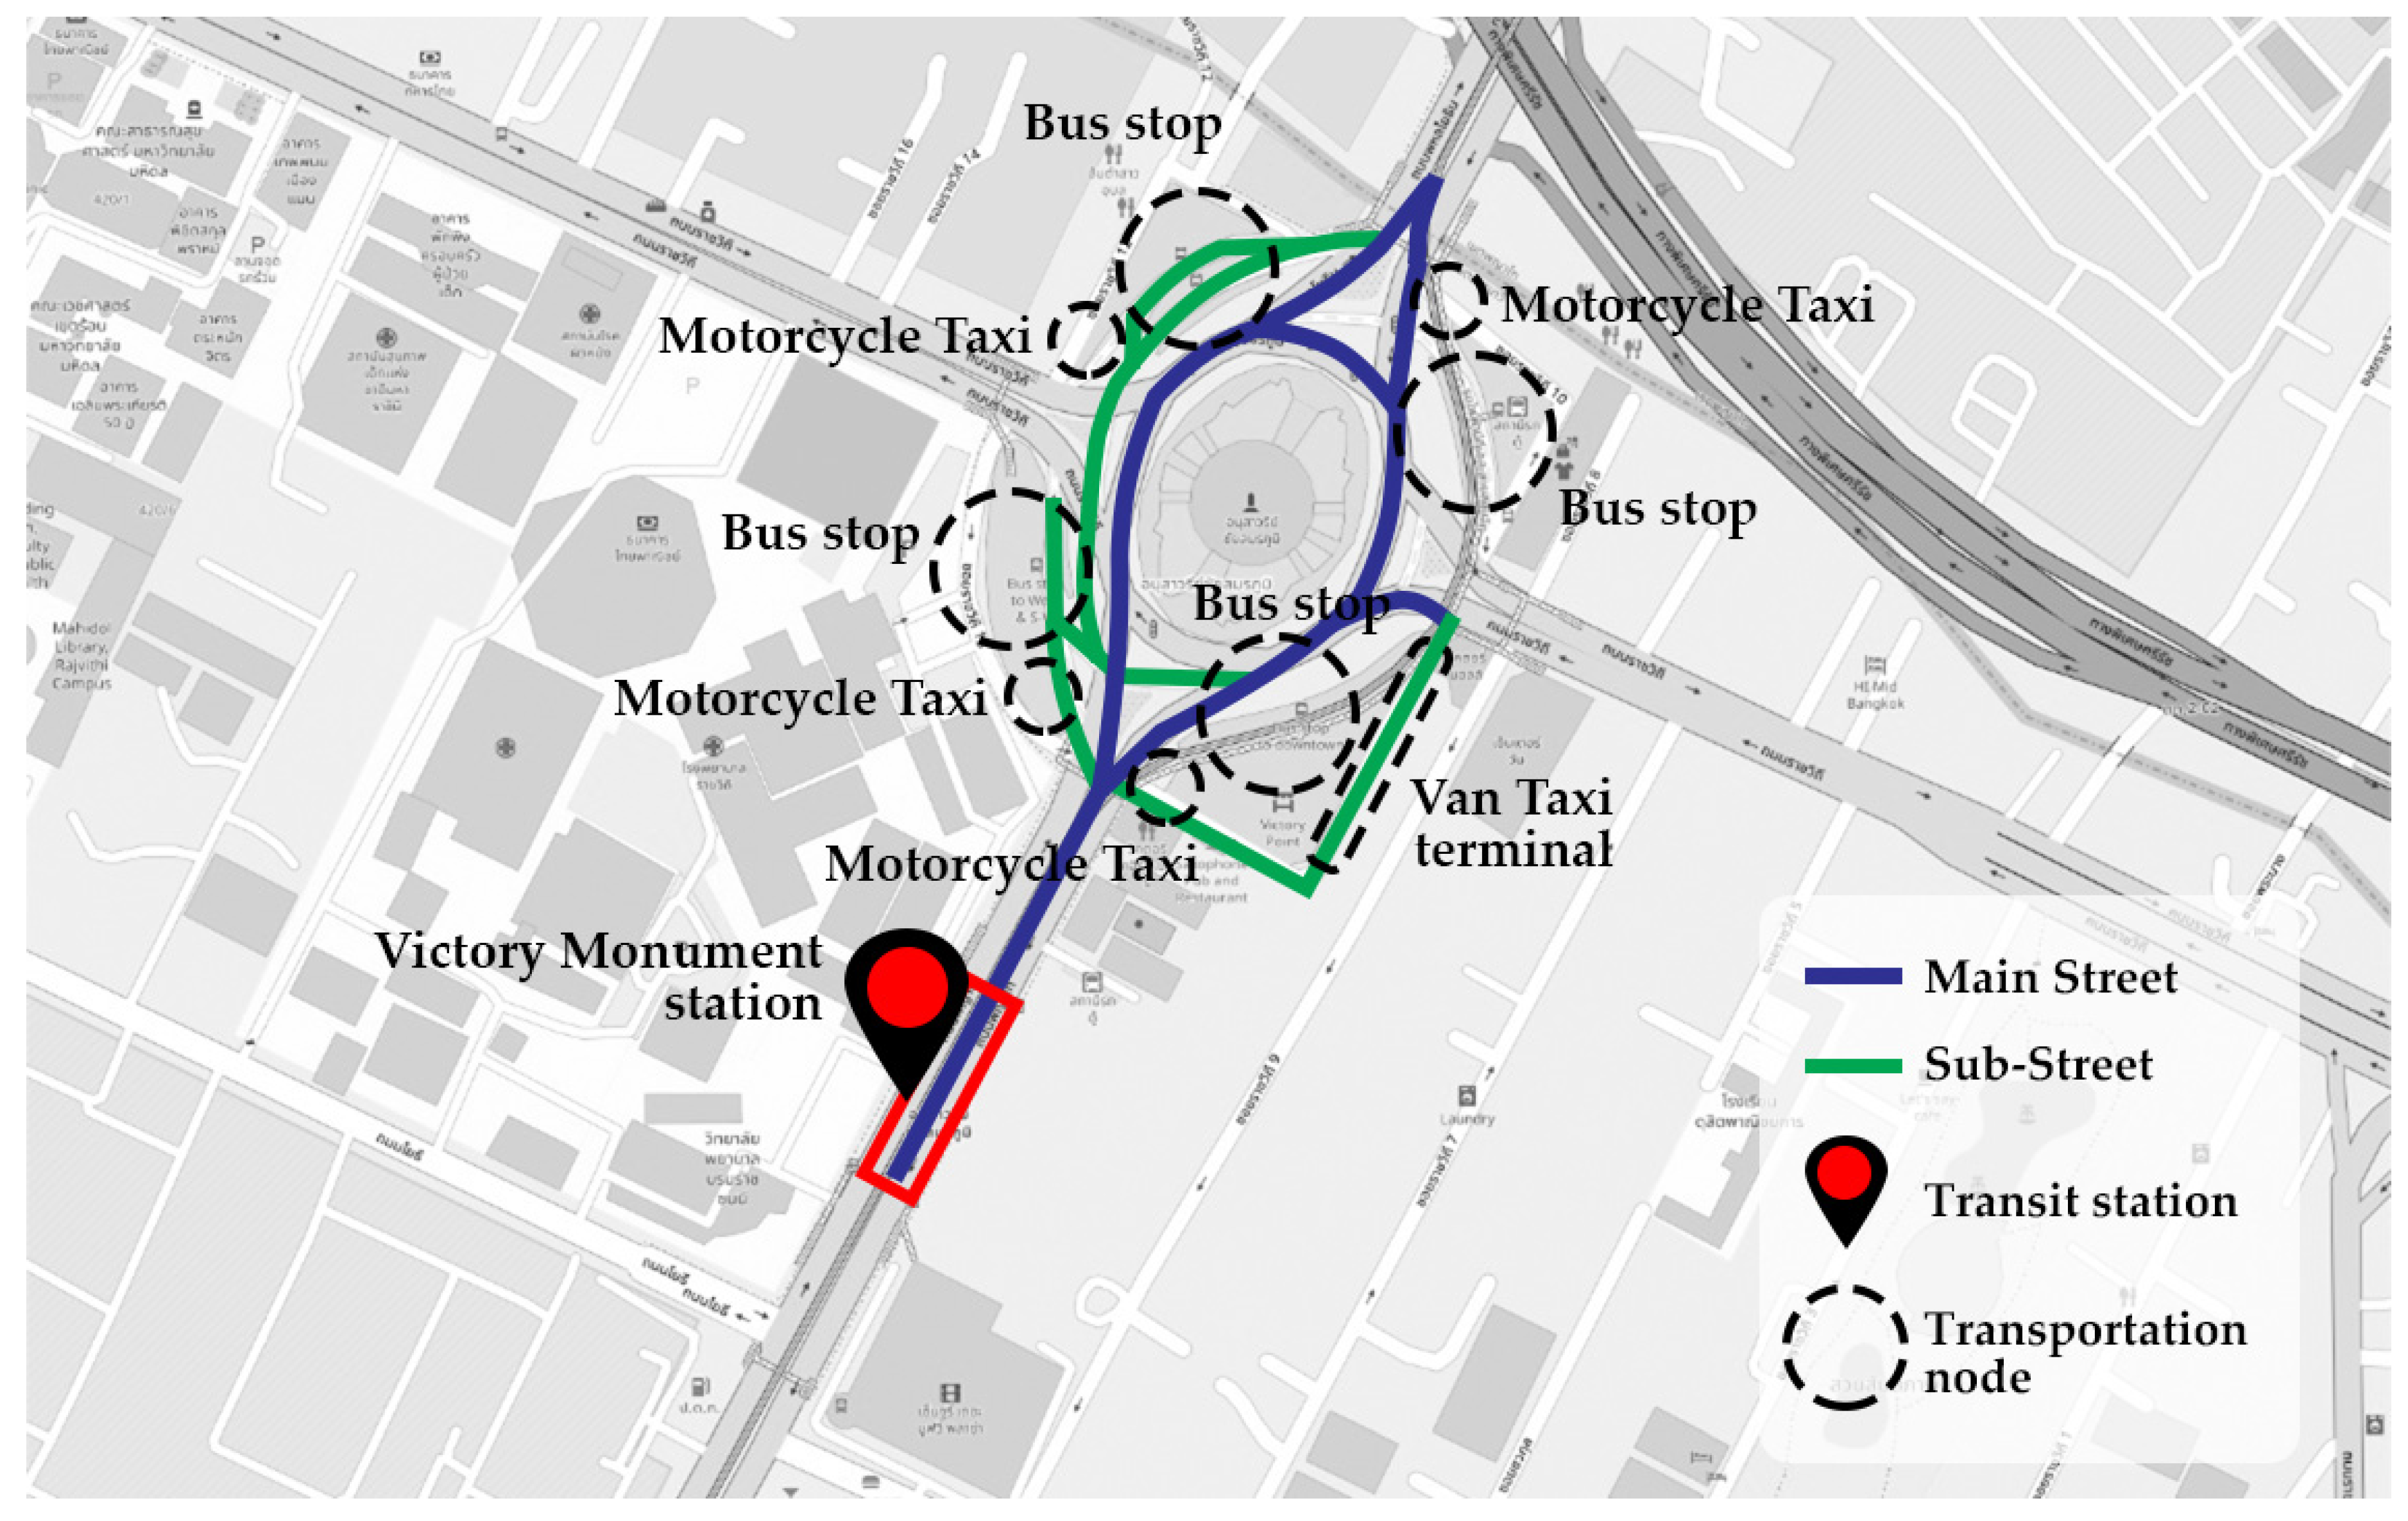
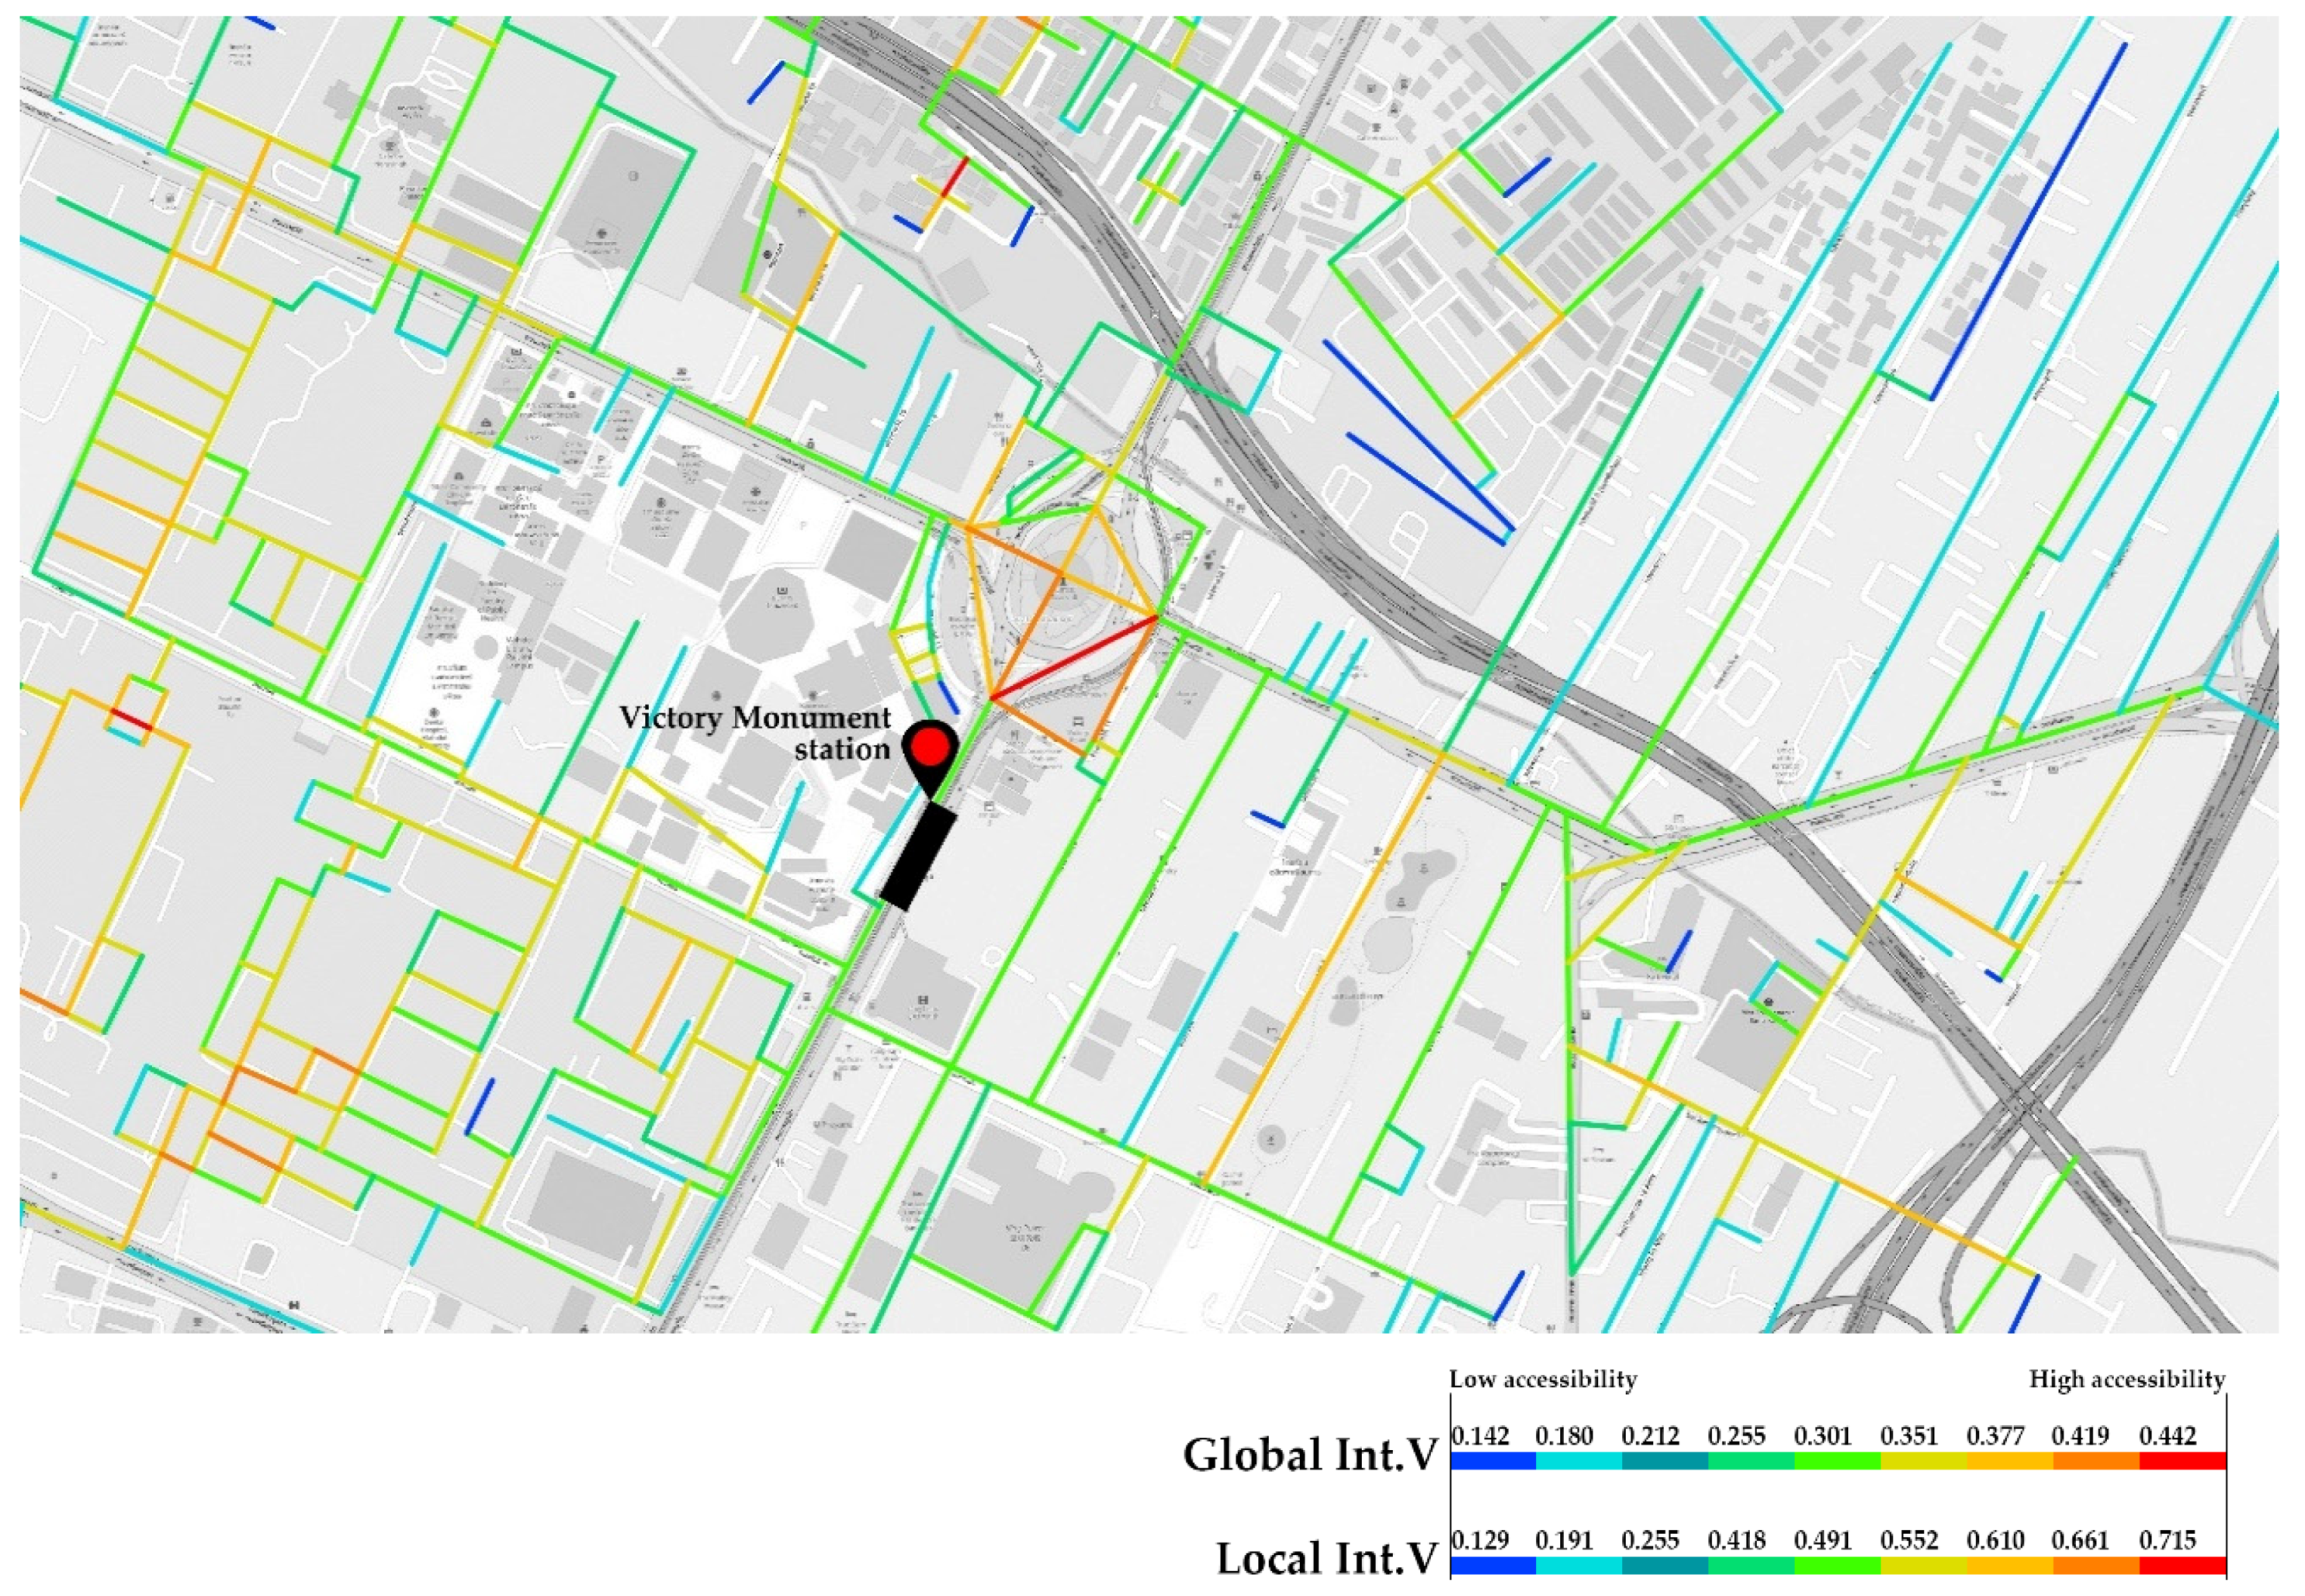
4.1.2. Victory Monument Station
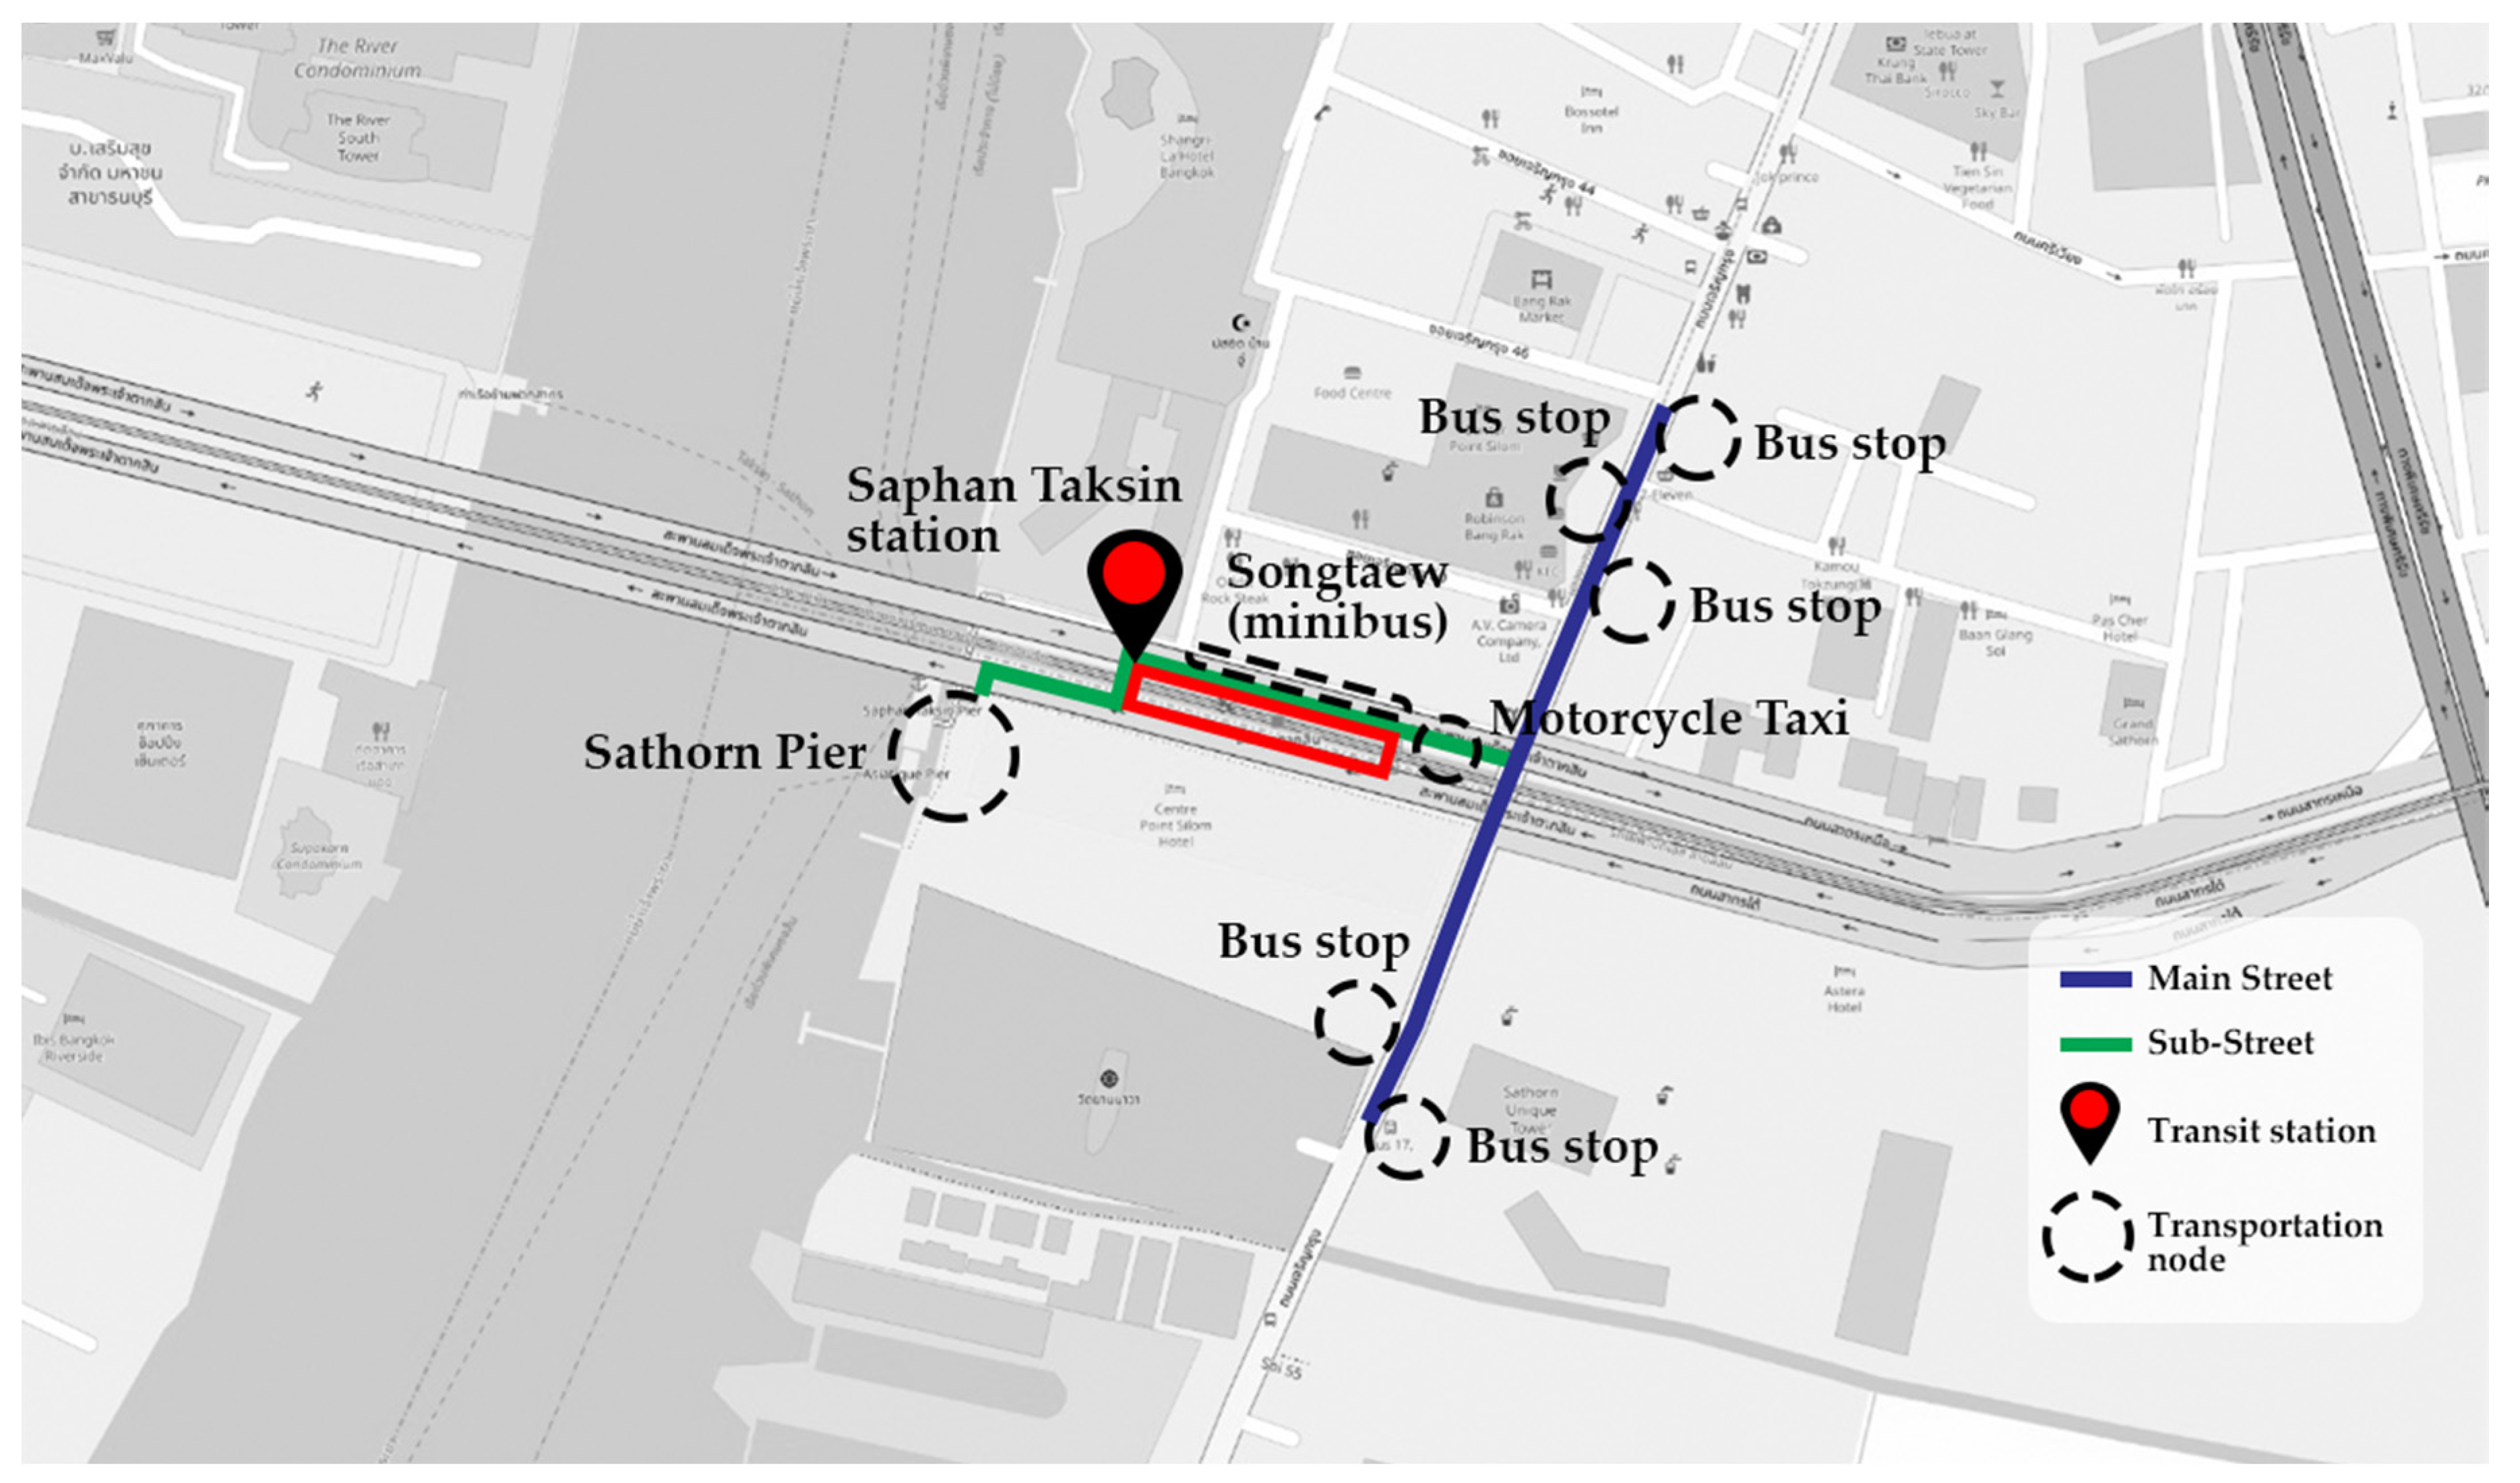
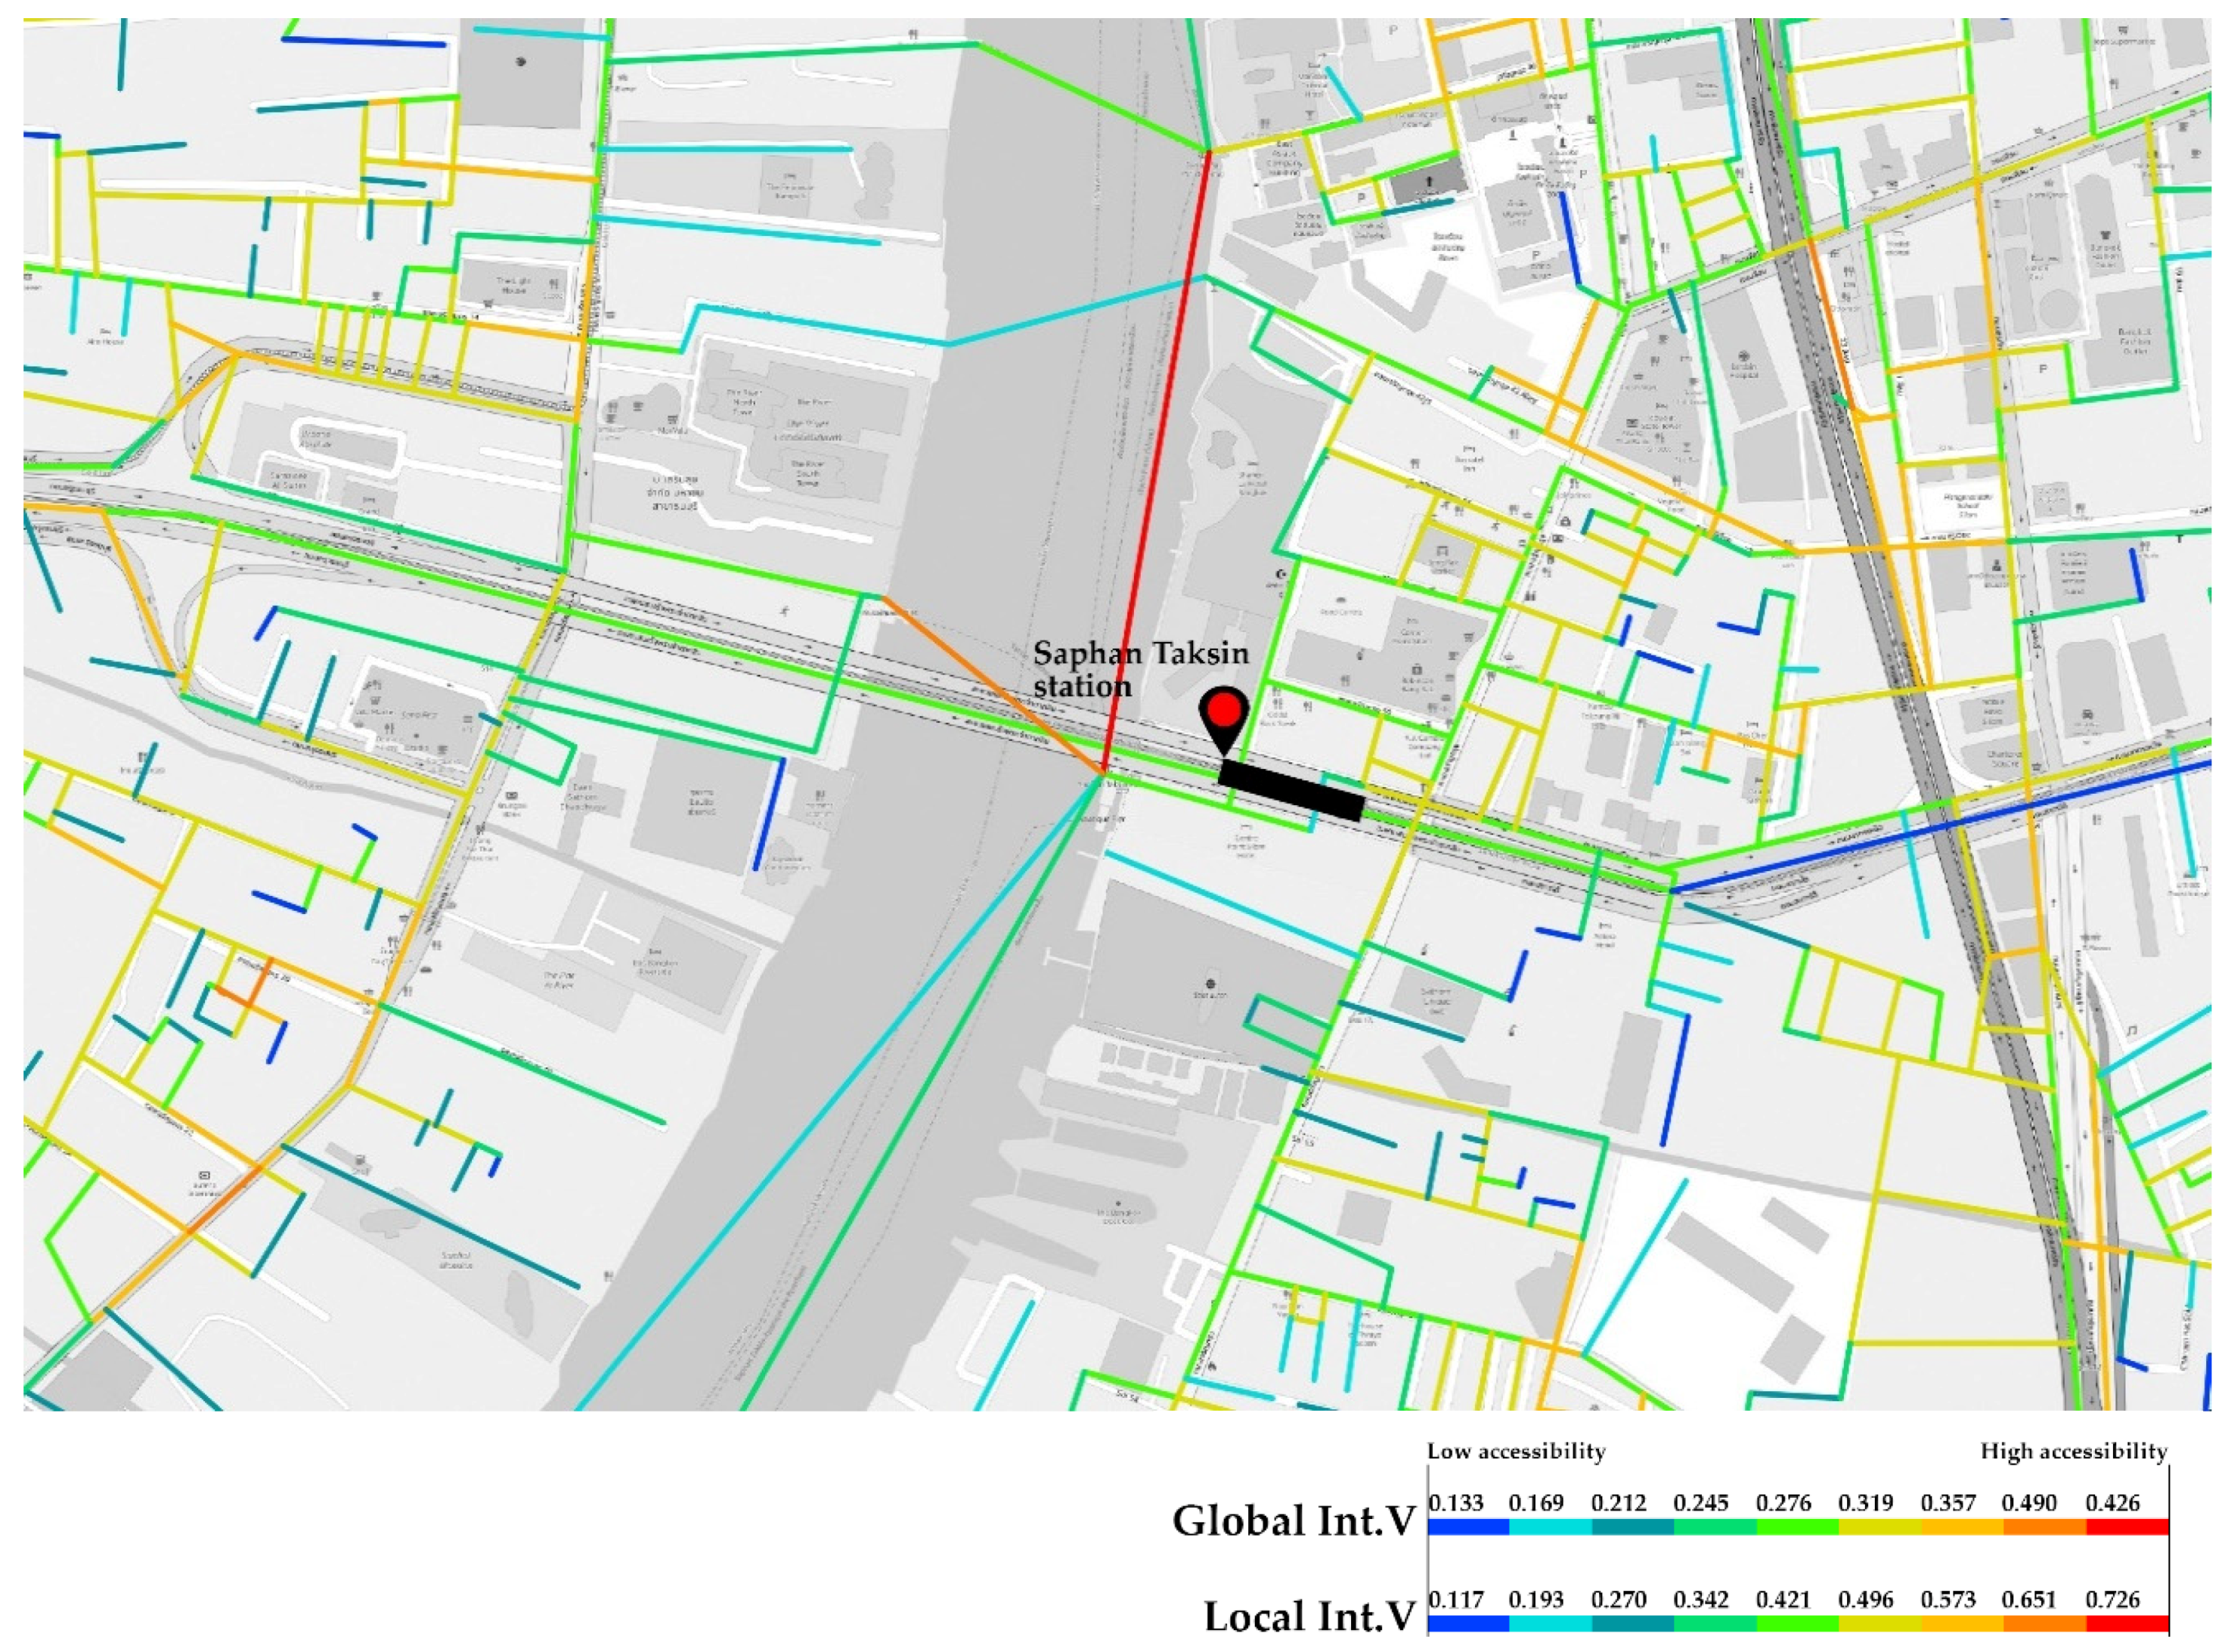
4.1.3. Saphan Taksin Station
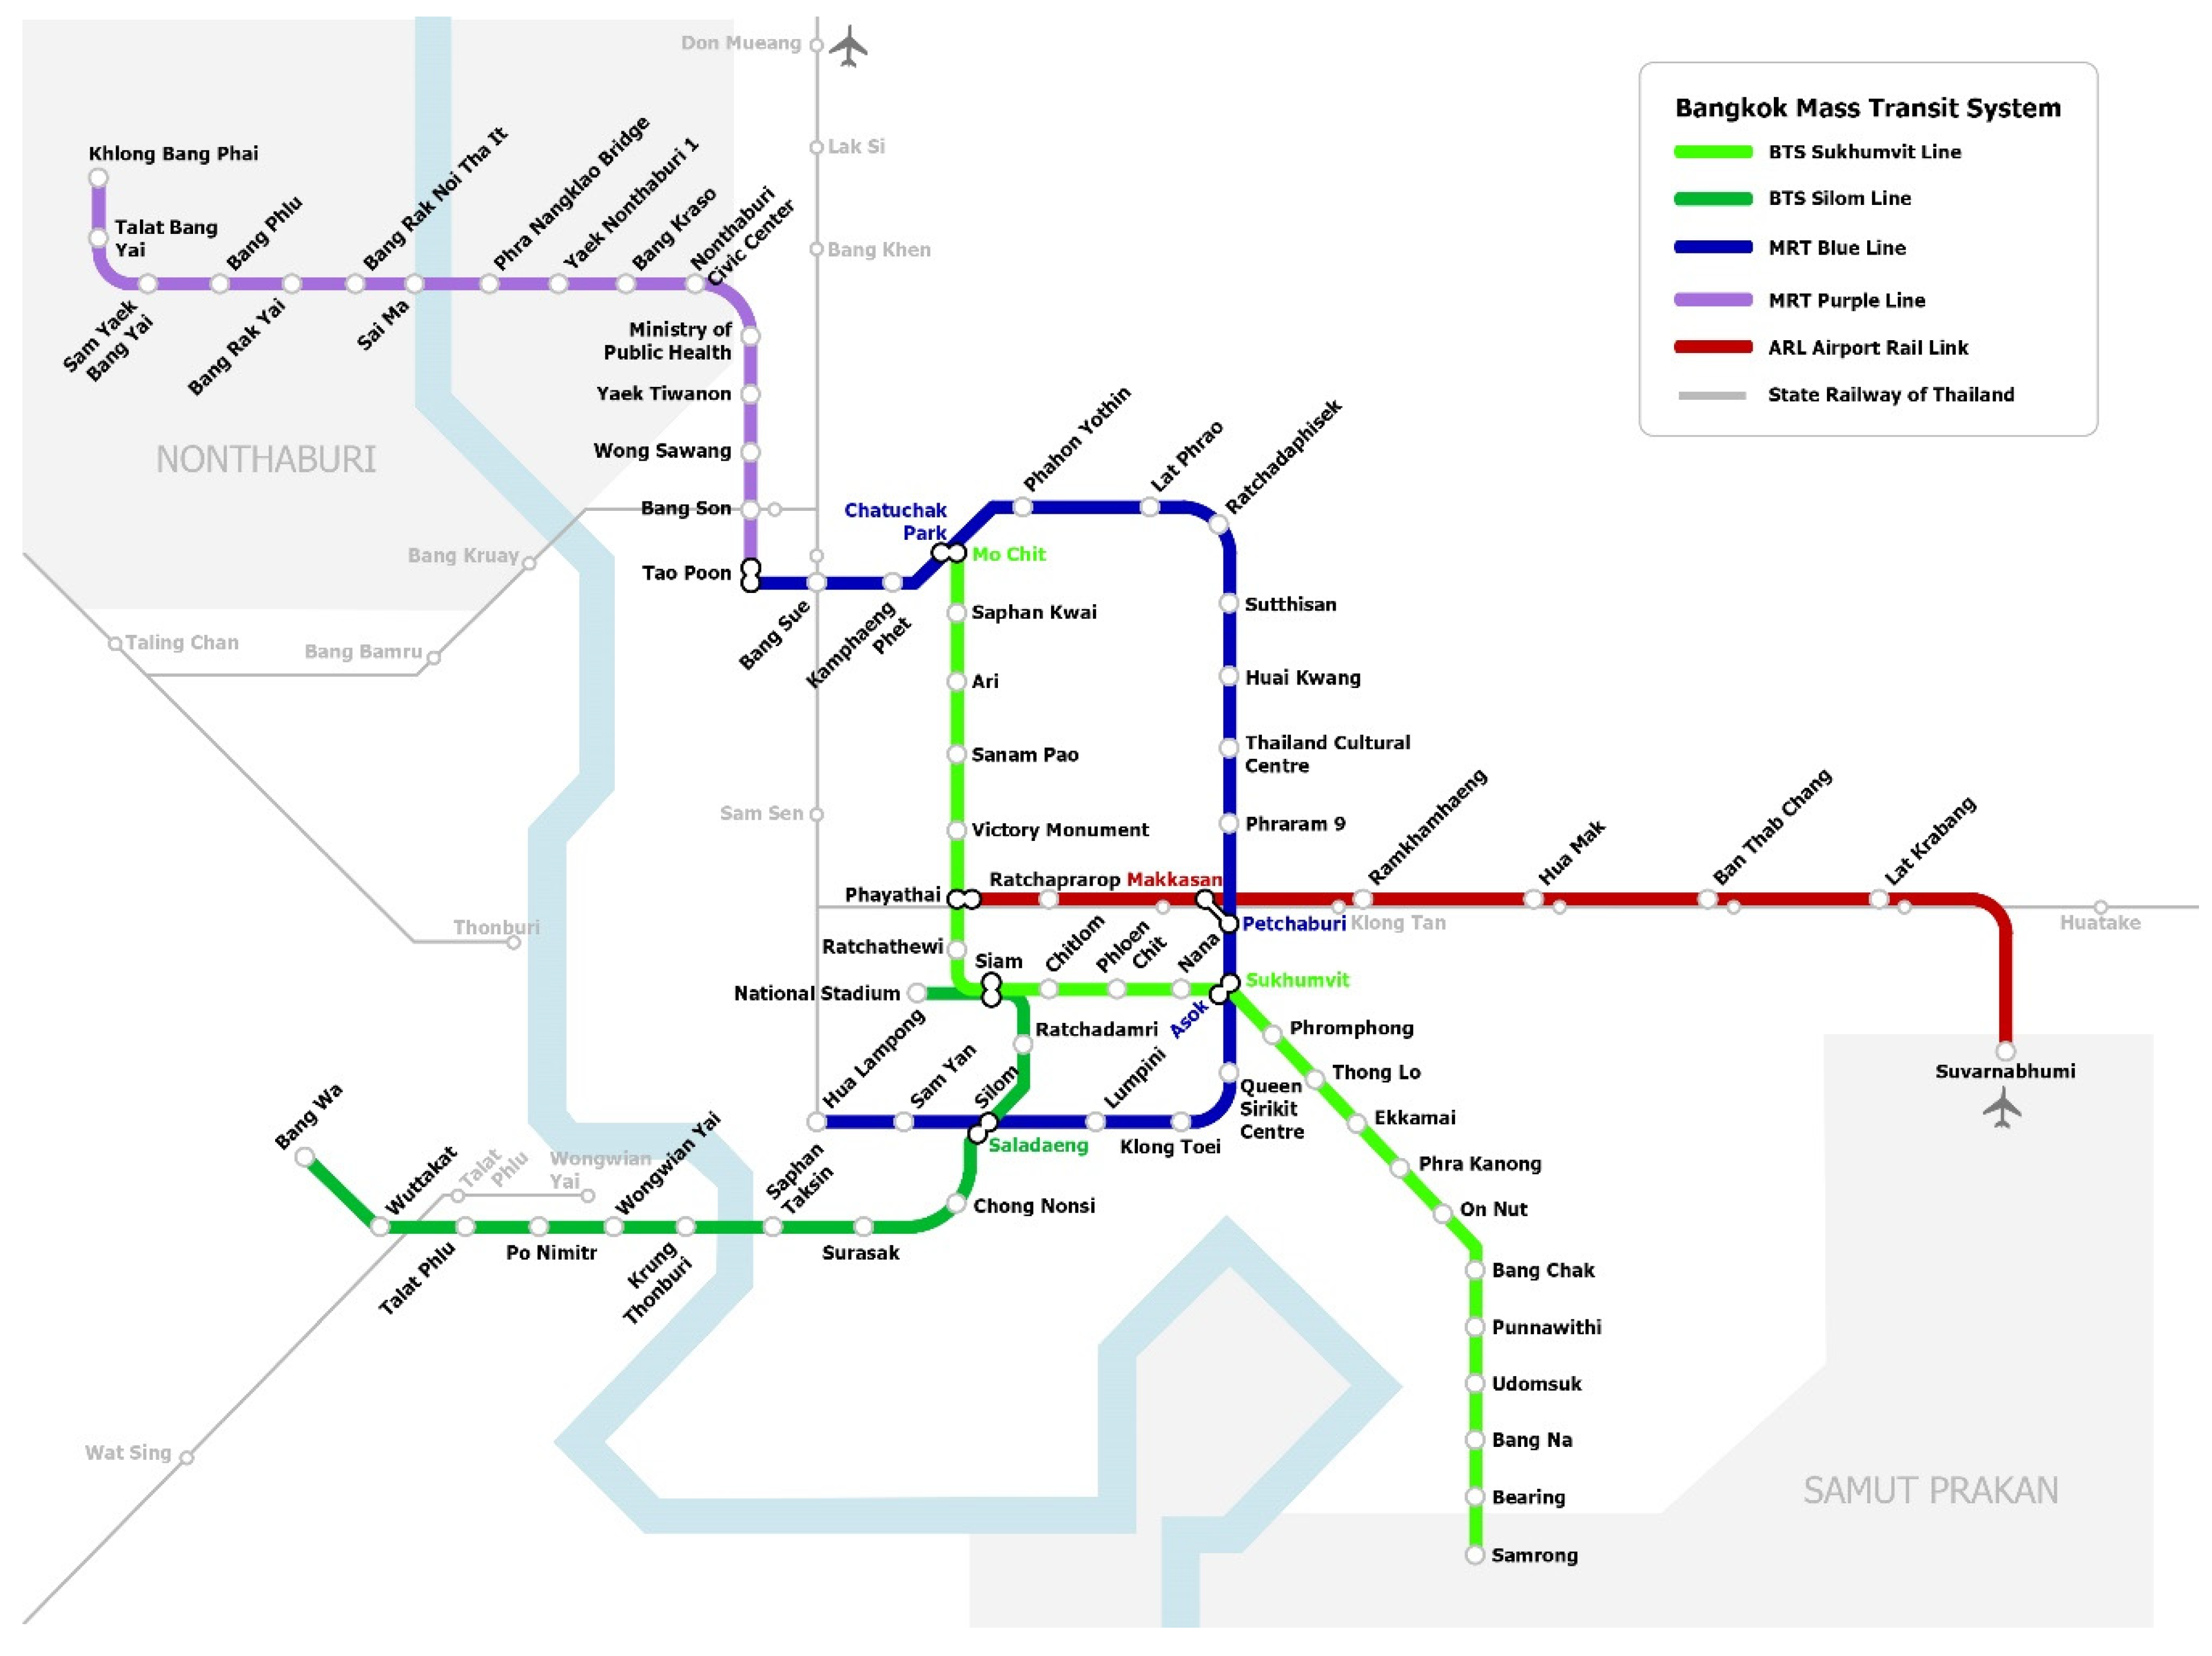
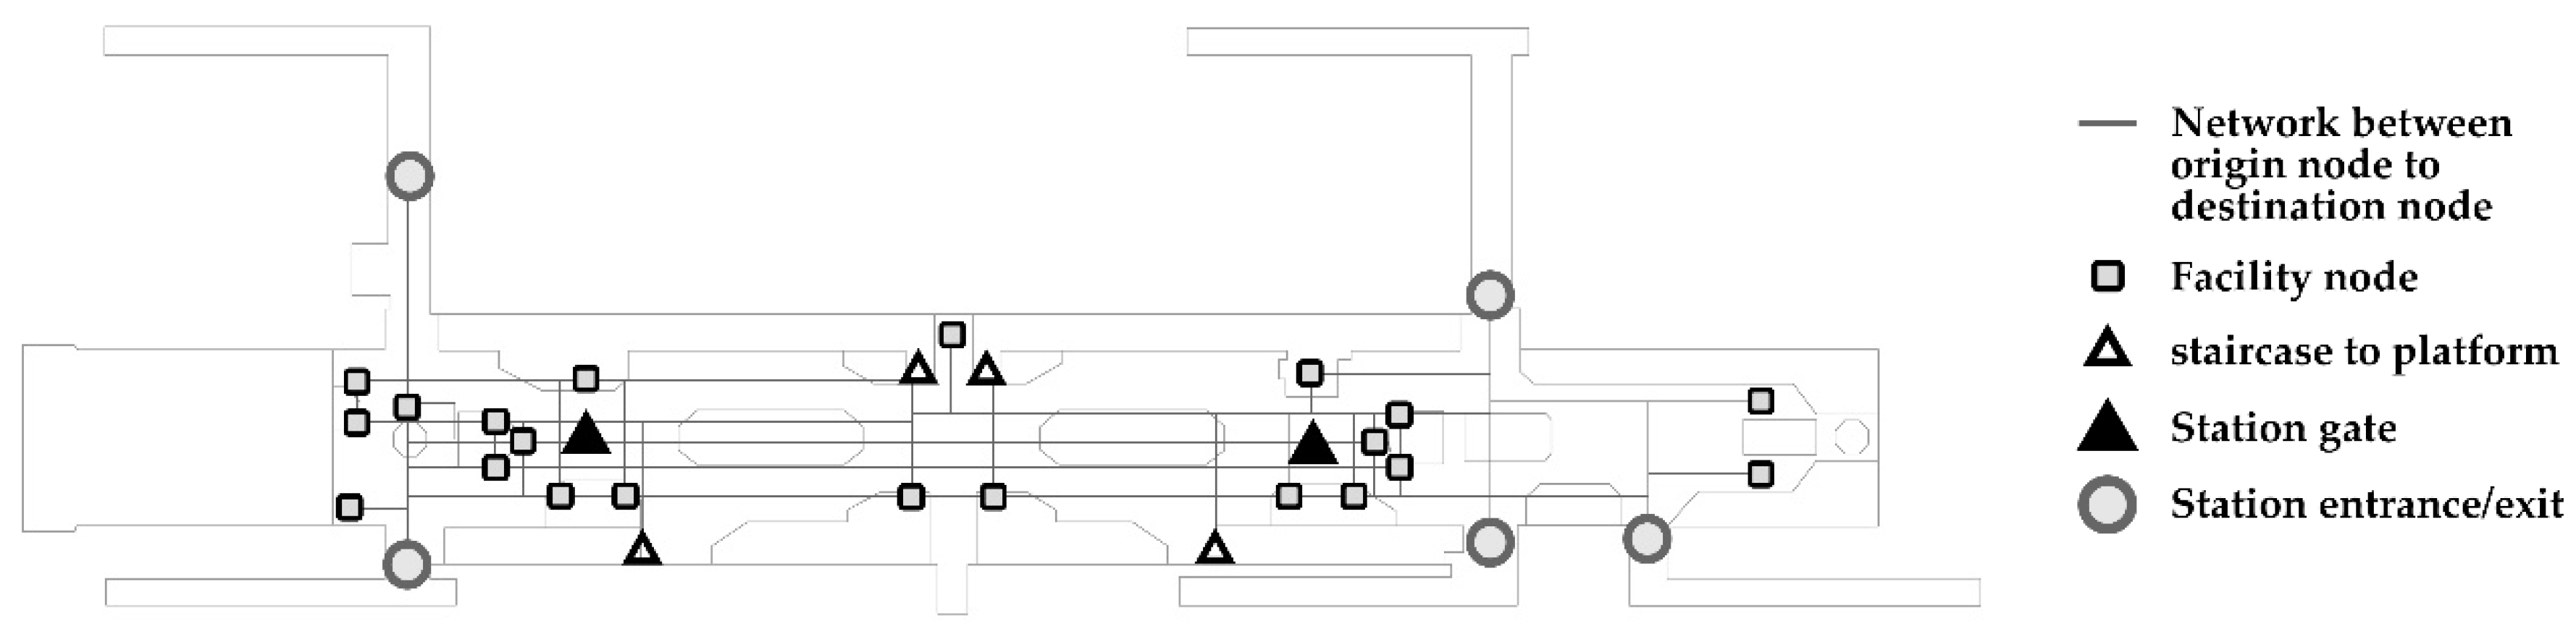
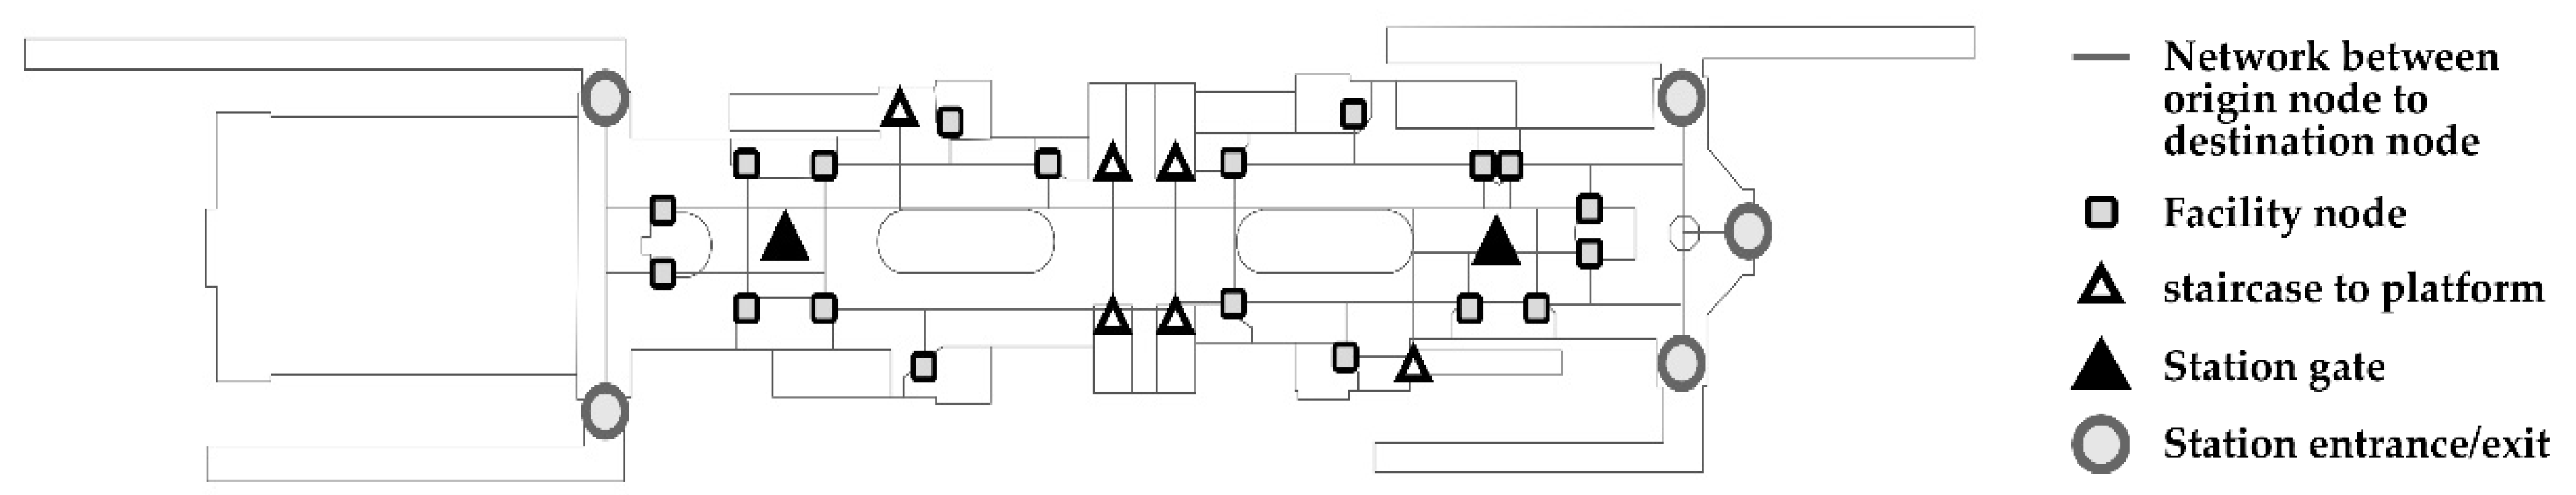
4.2. Accessibility Analysis Inside the Station Building
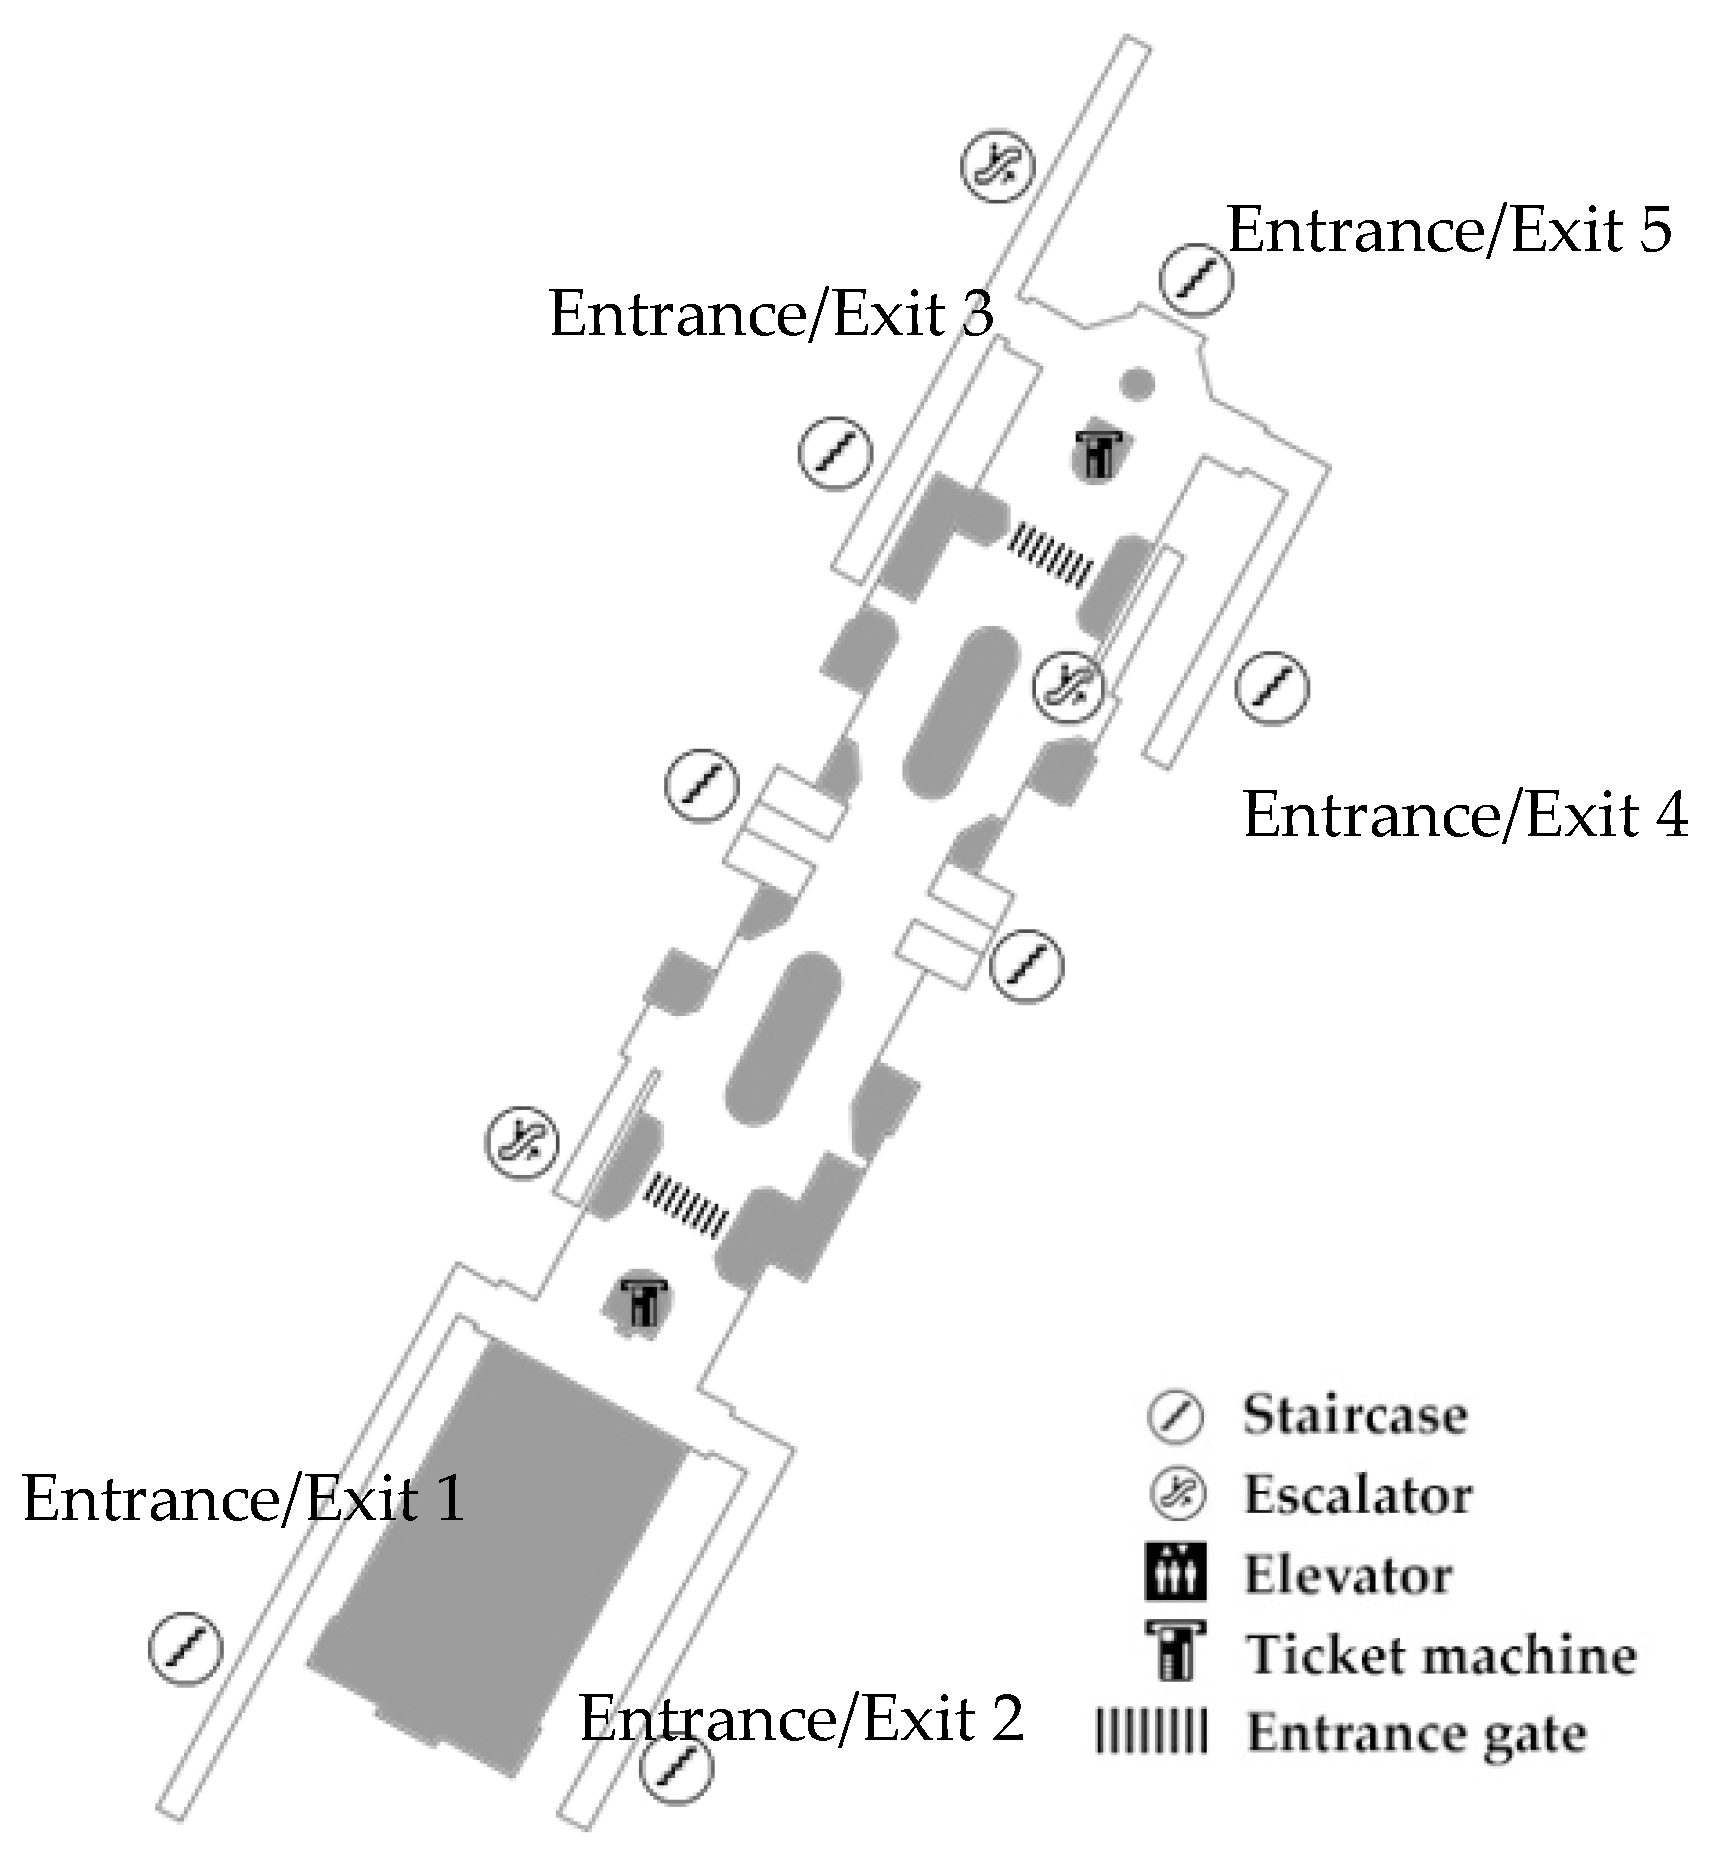
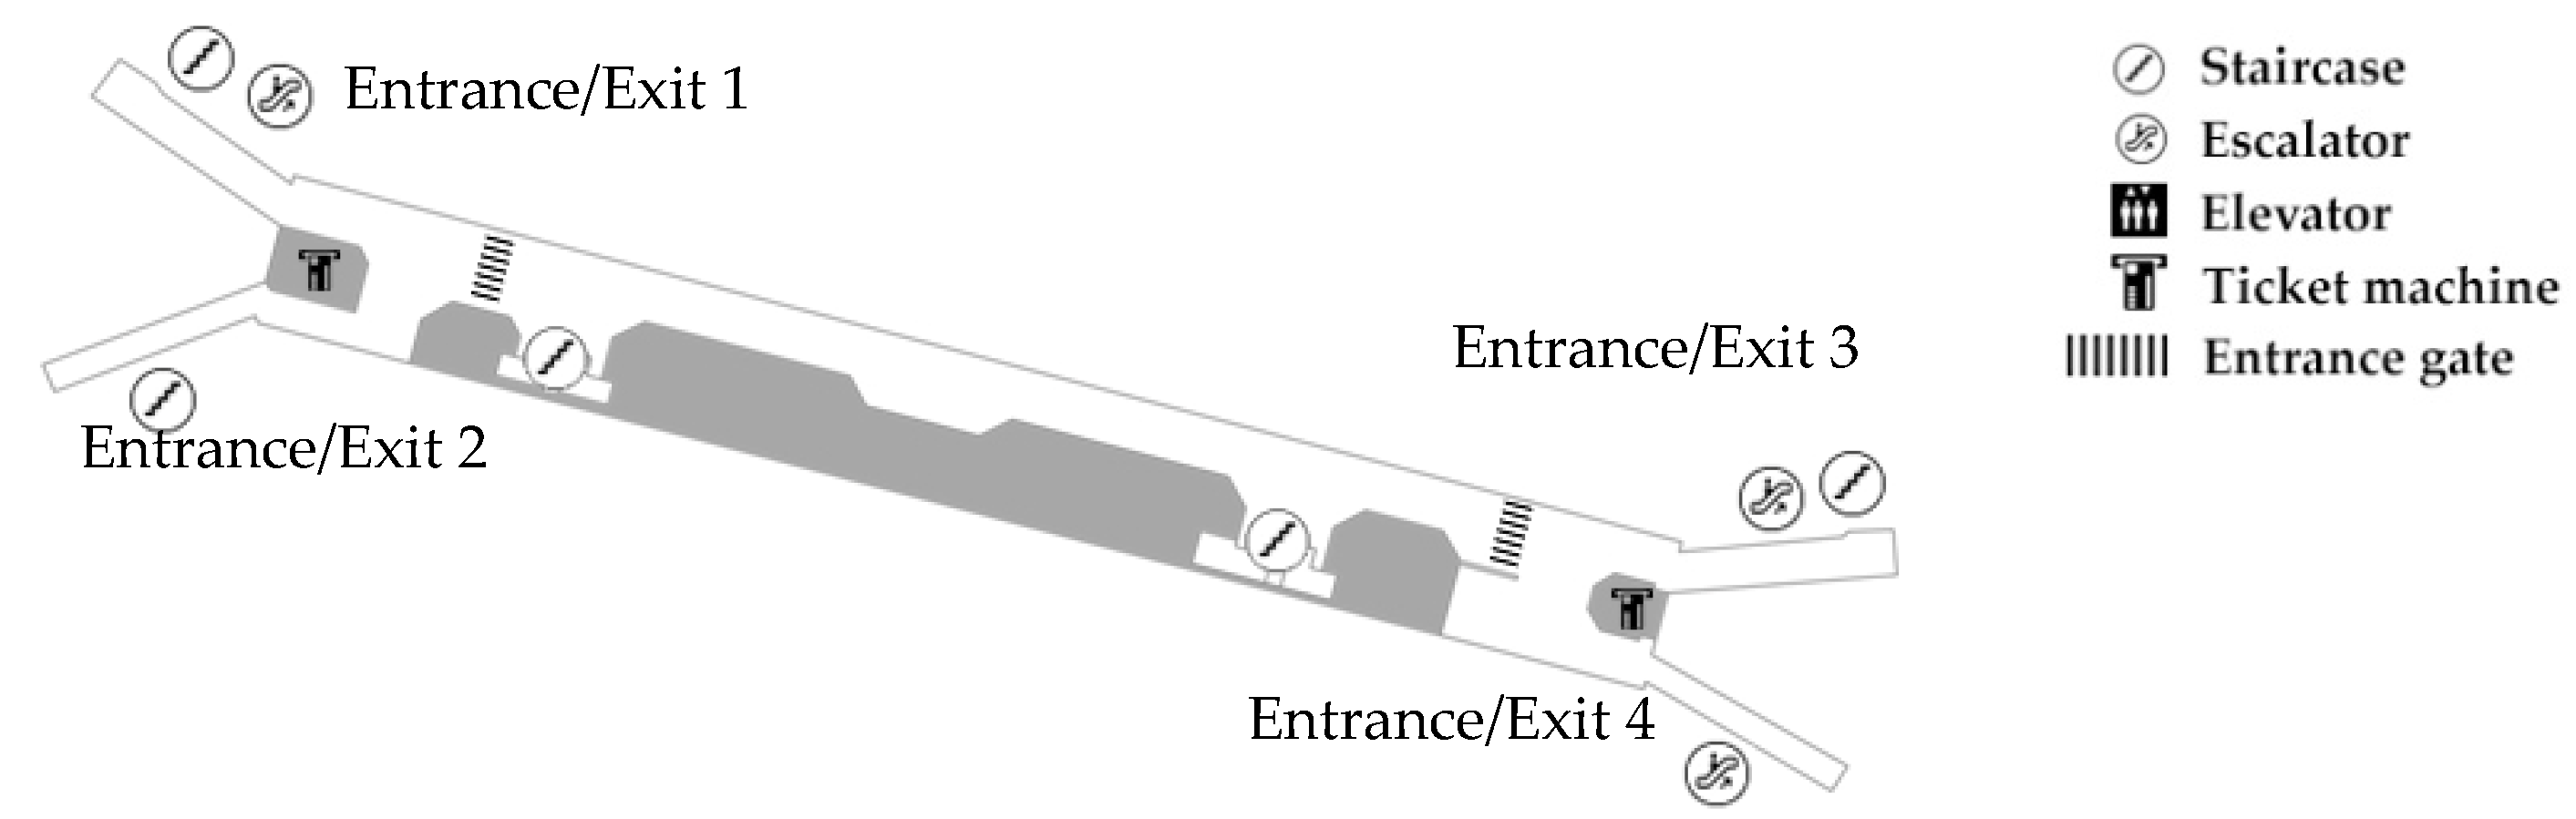
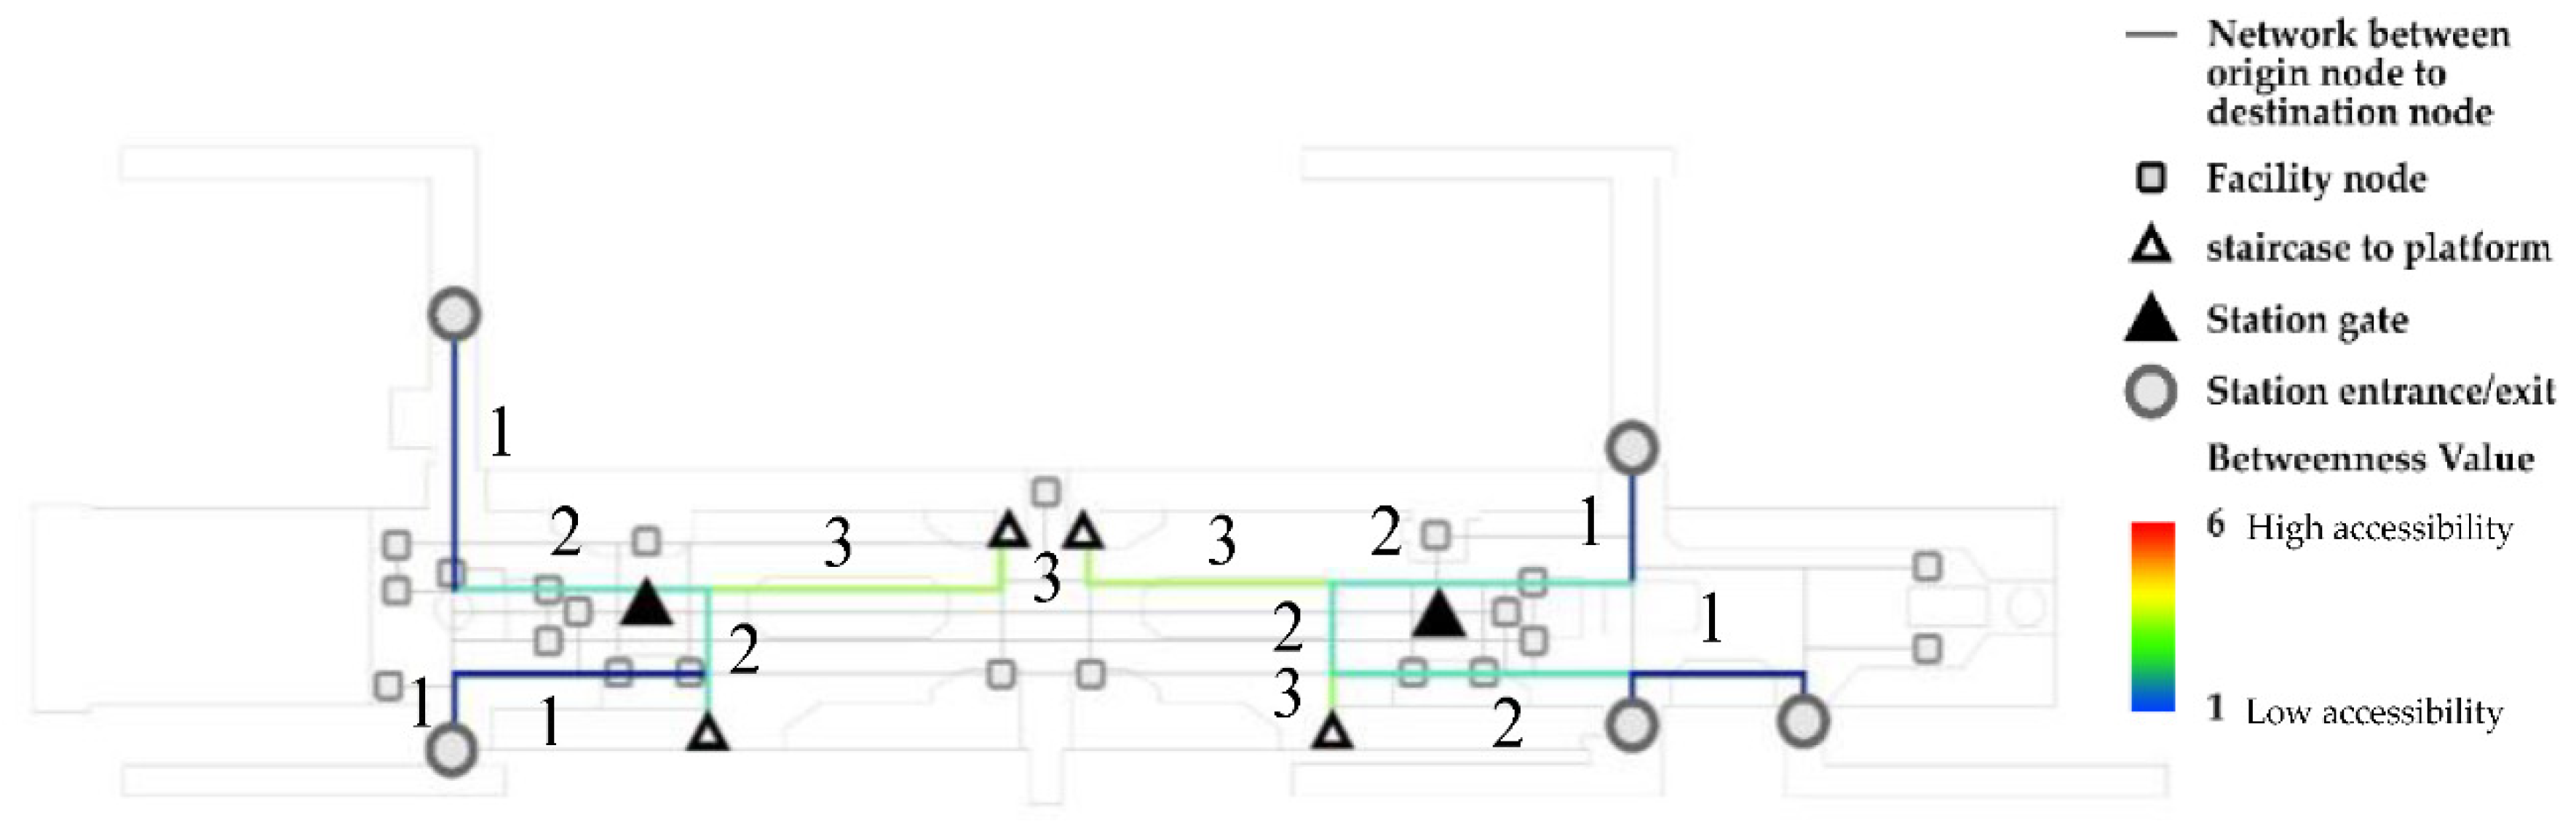
4.2.1. Mo Chit Station
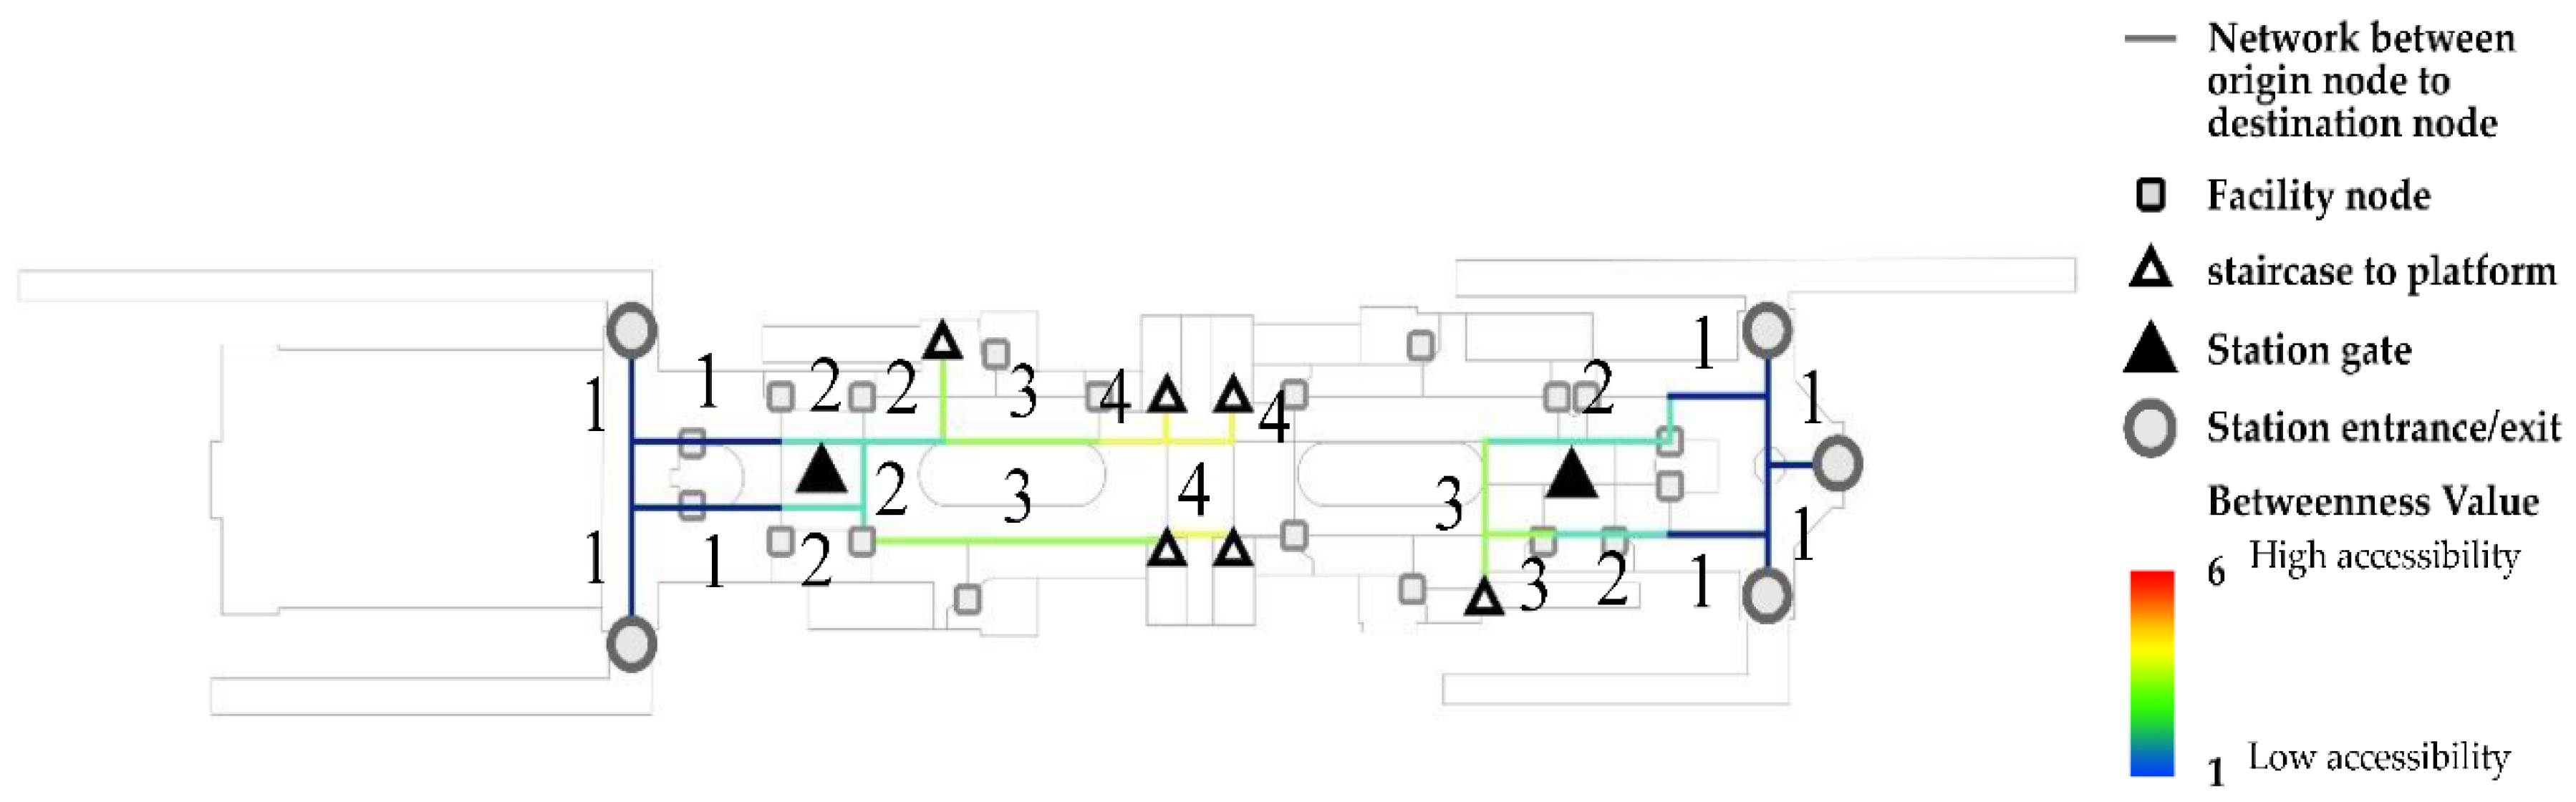
4.2.2. Victory Monument Station
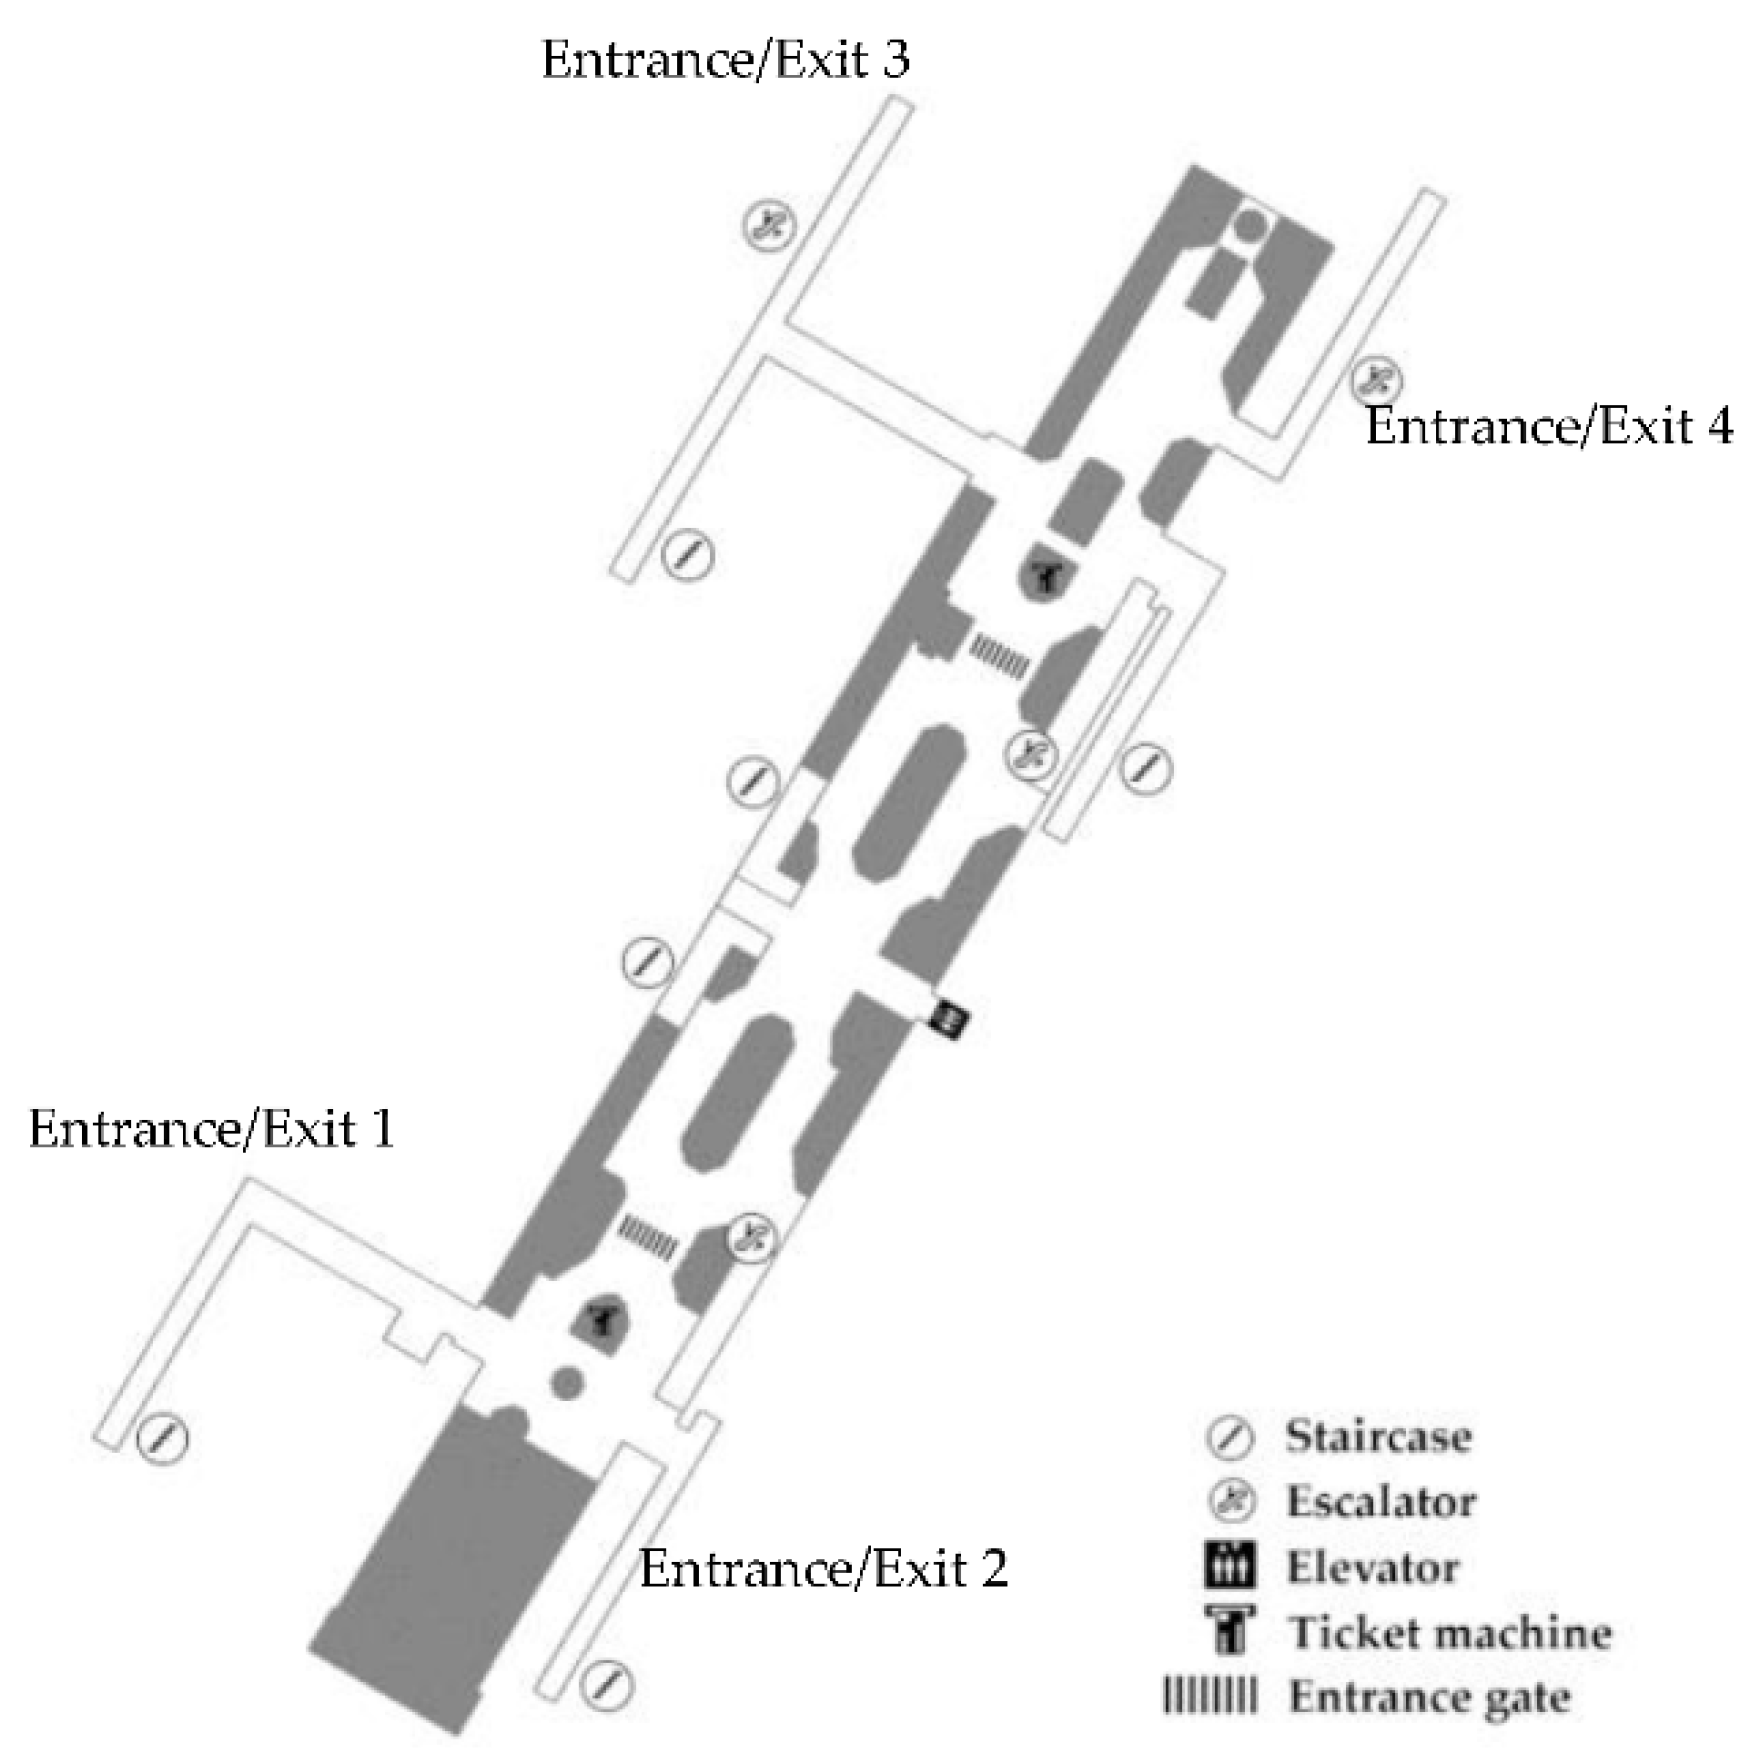
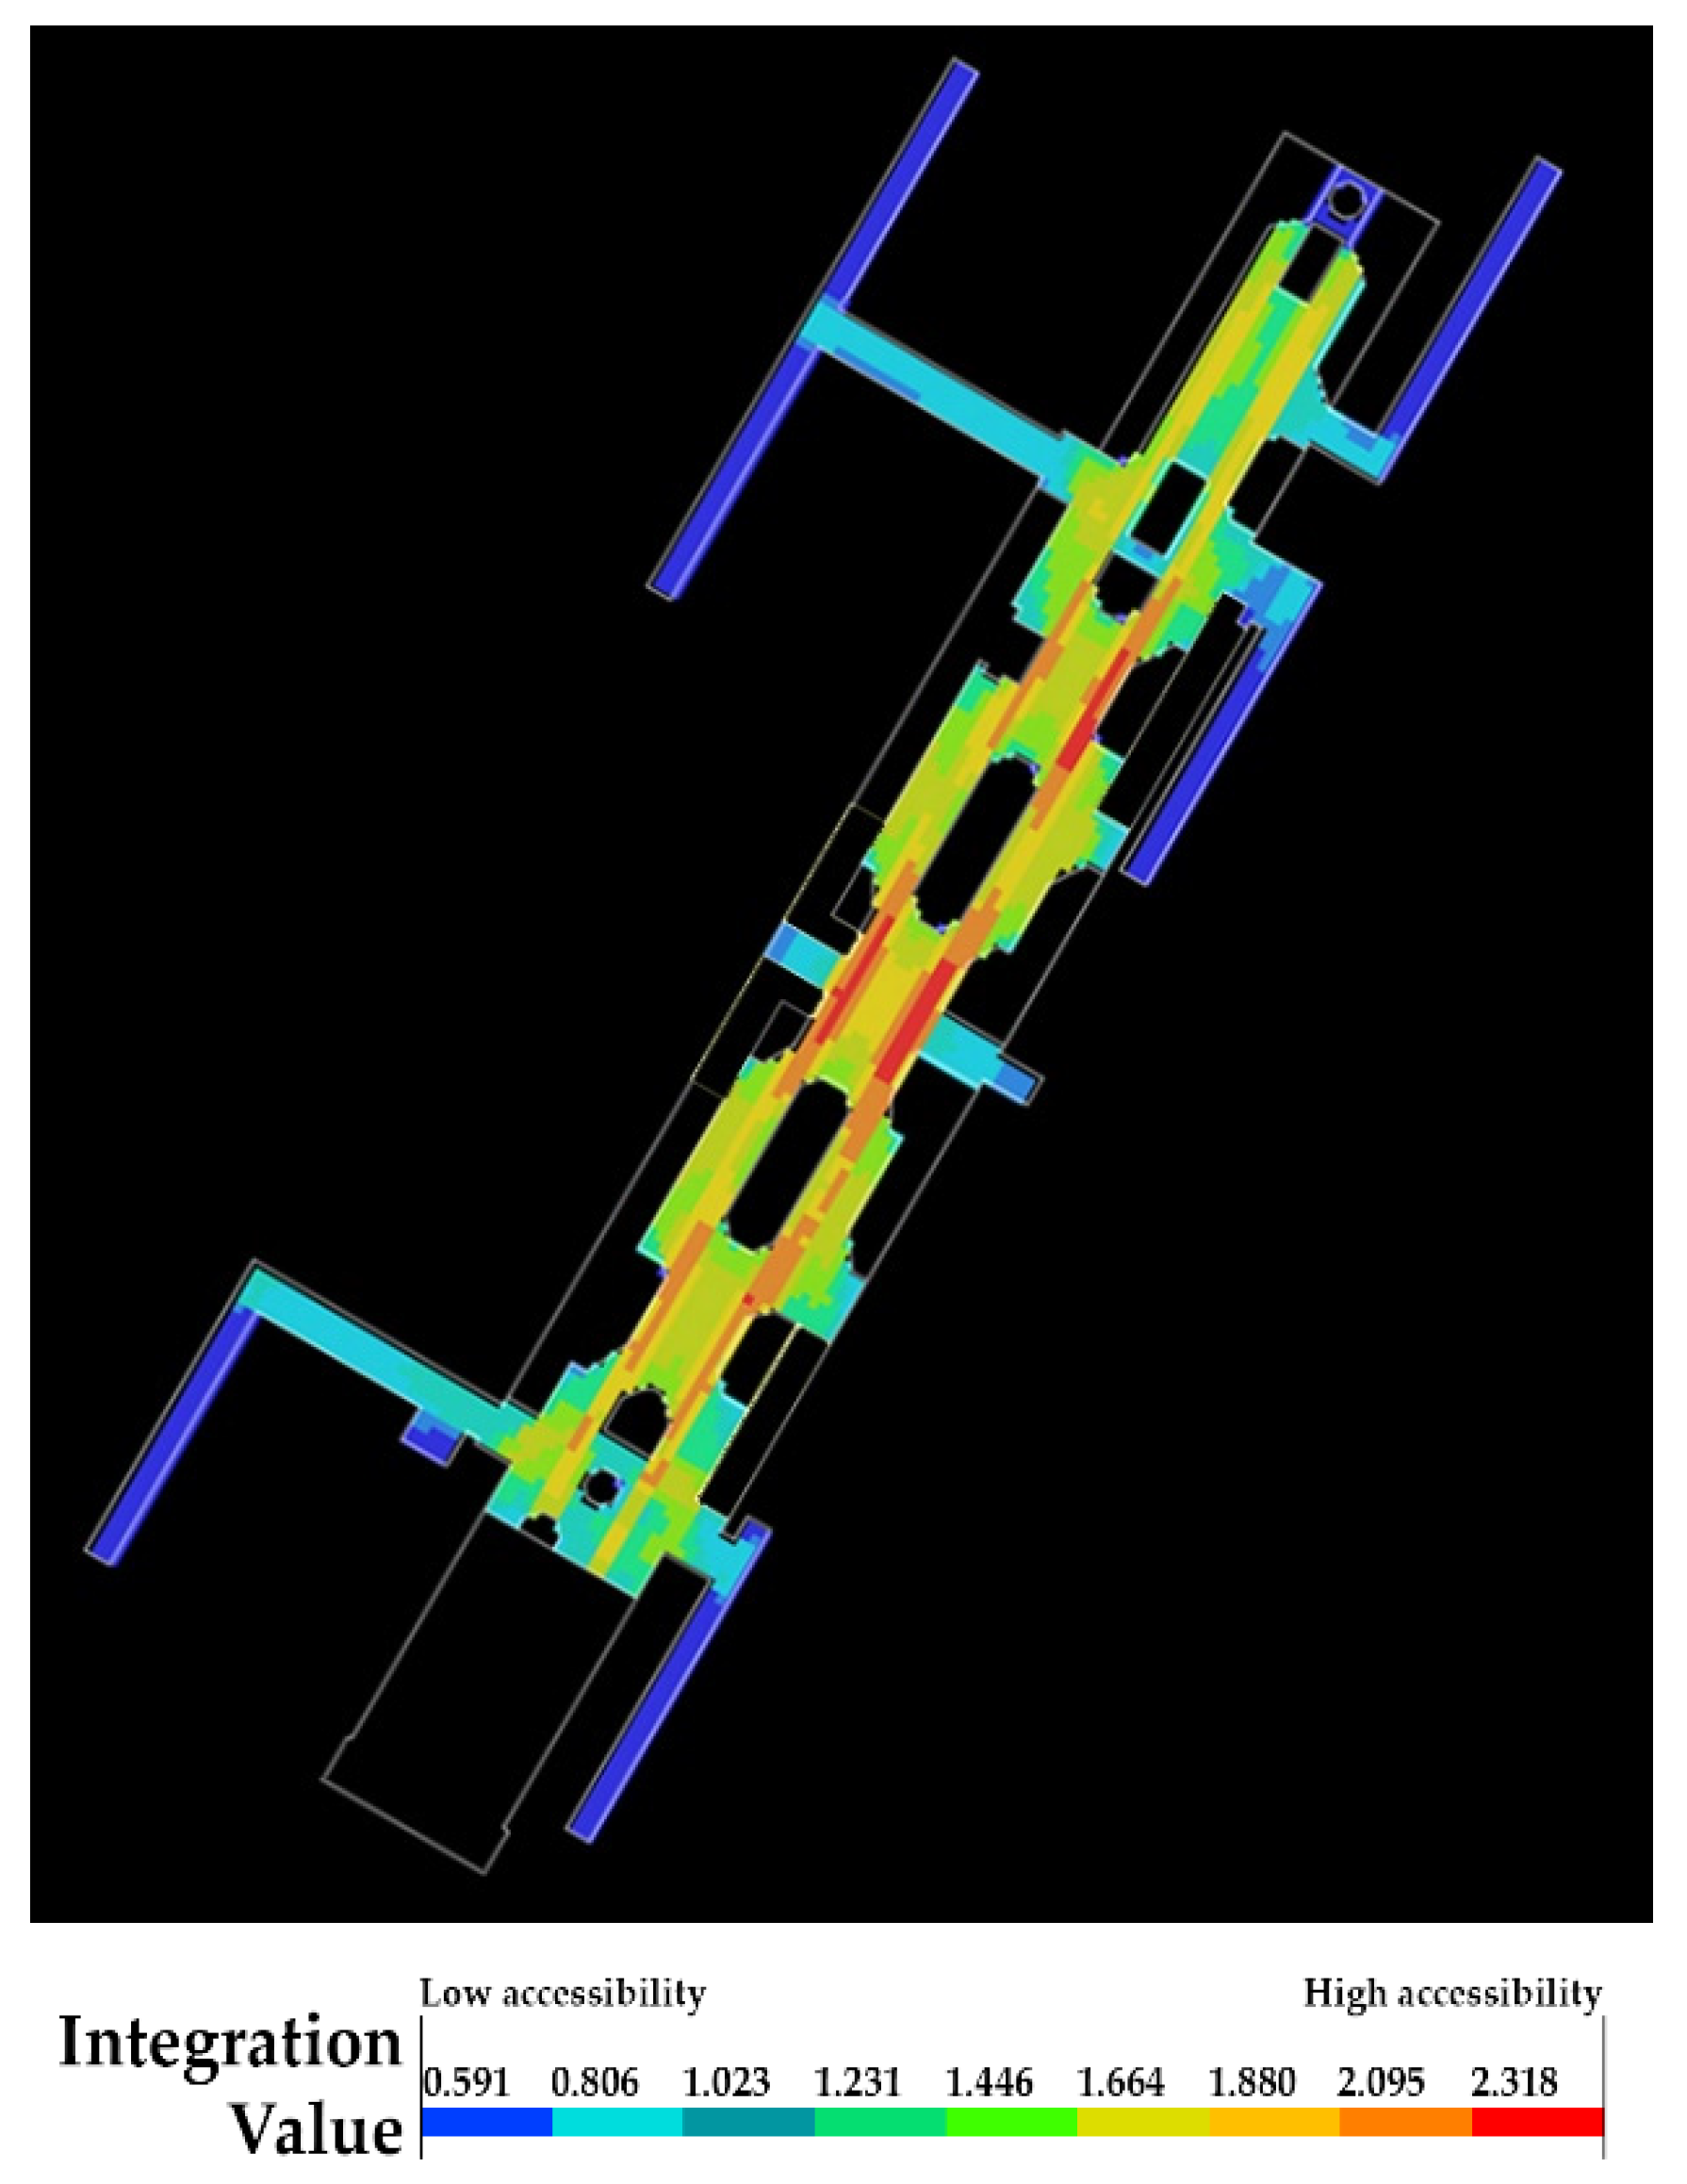
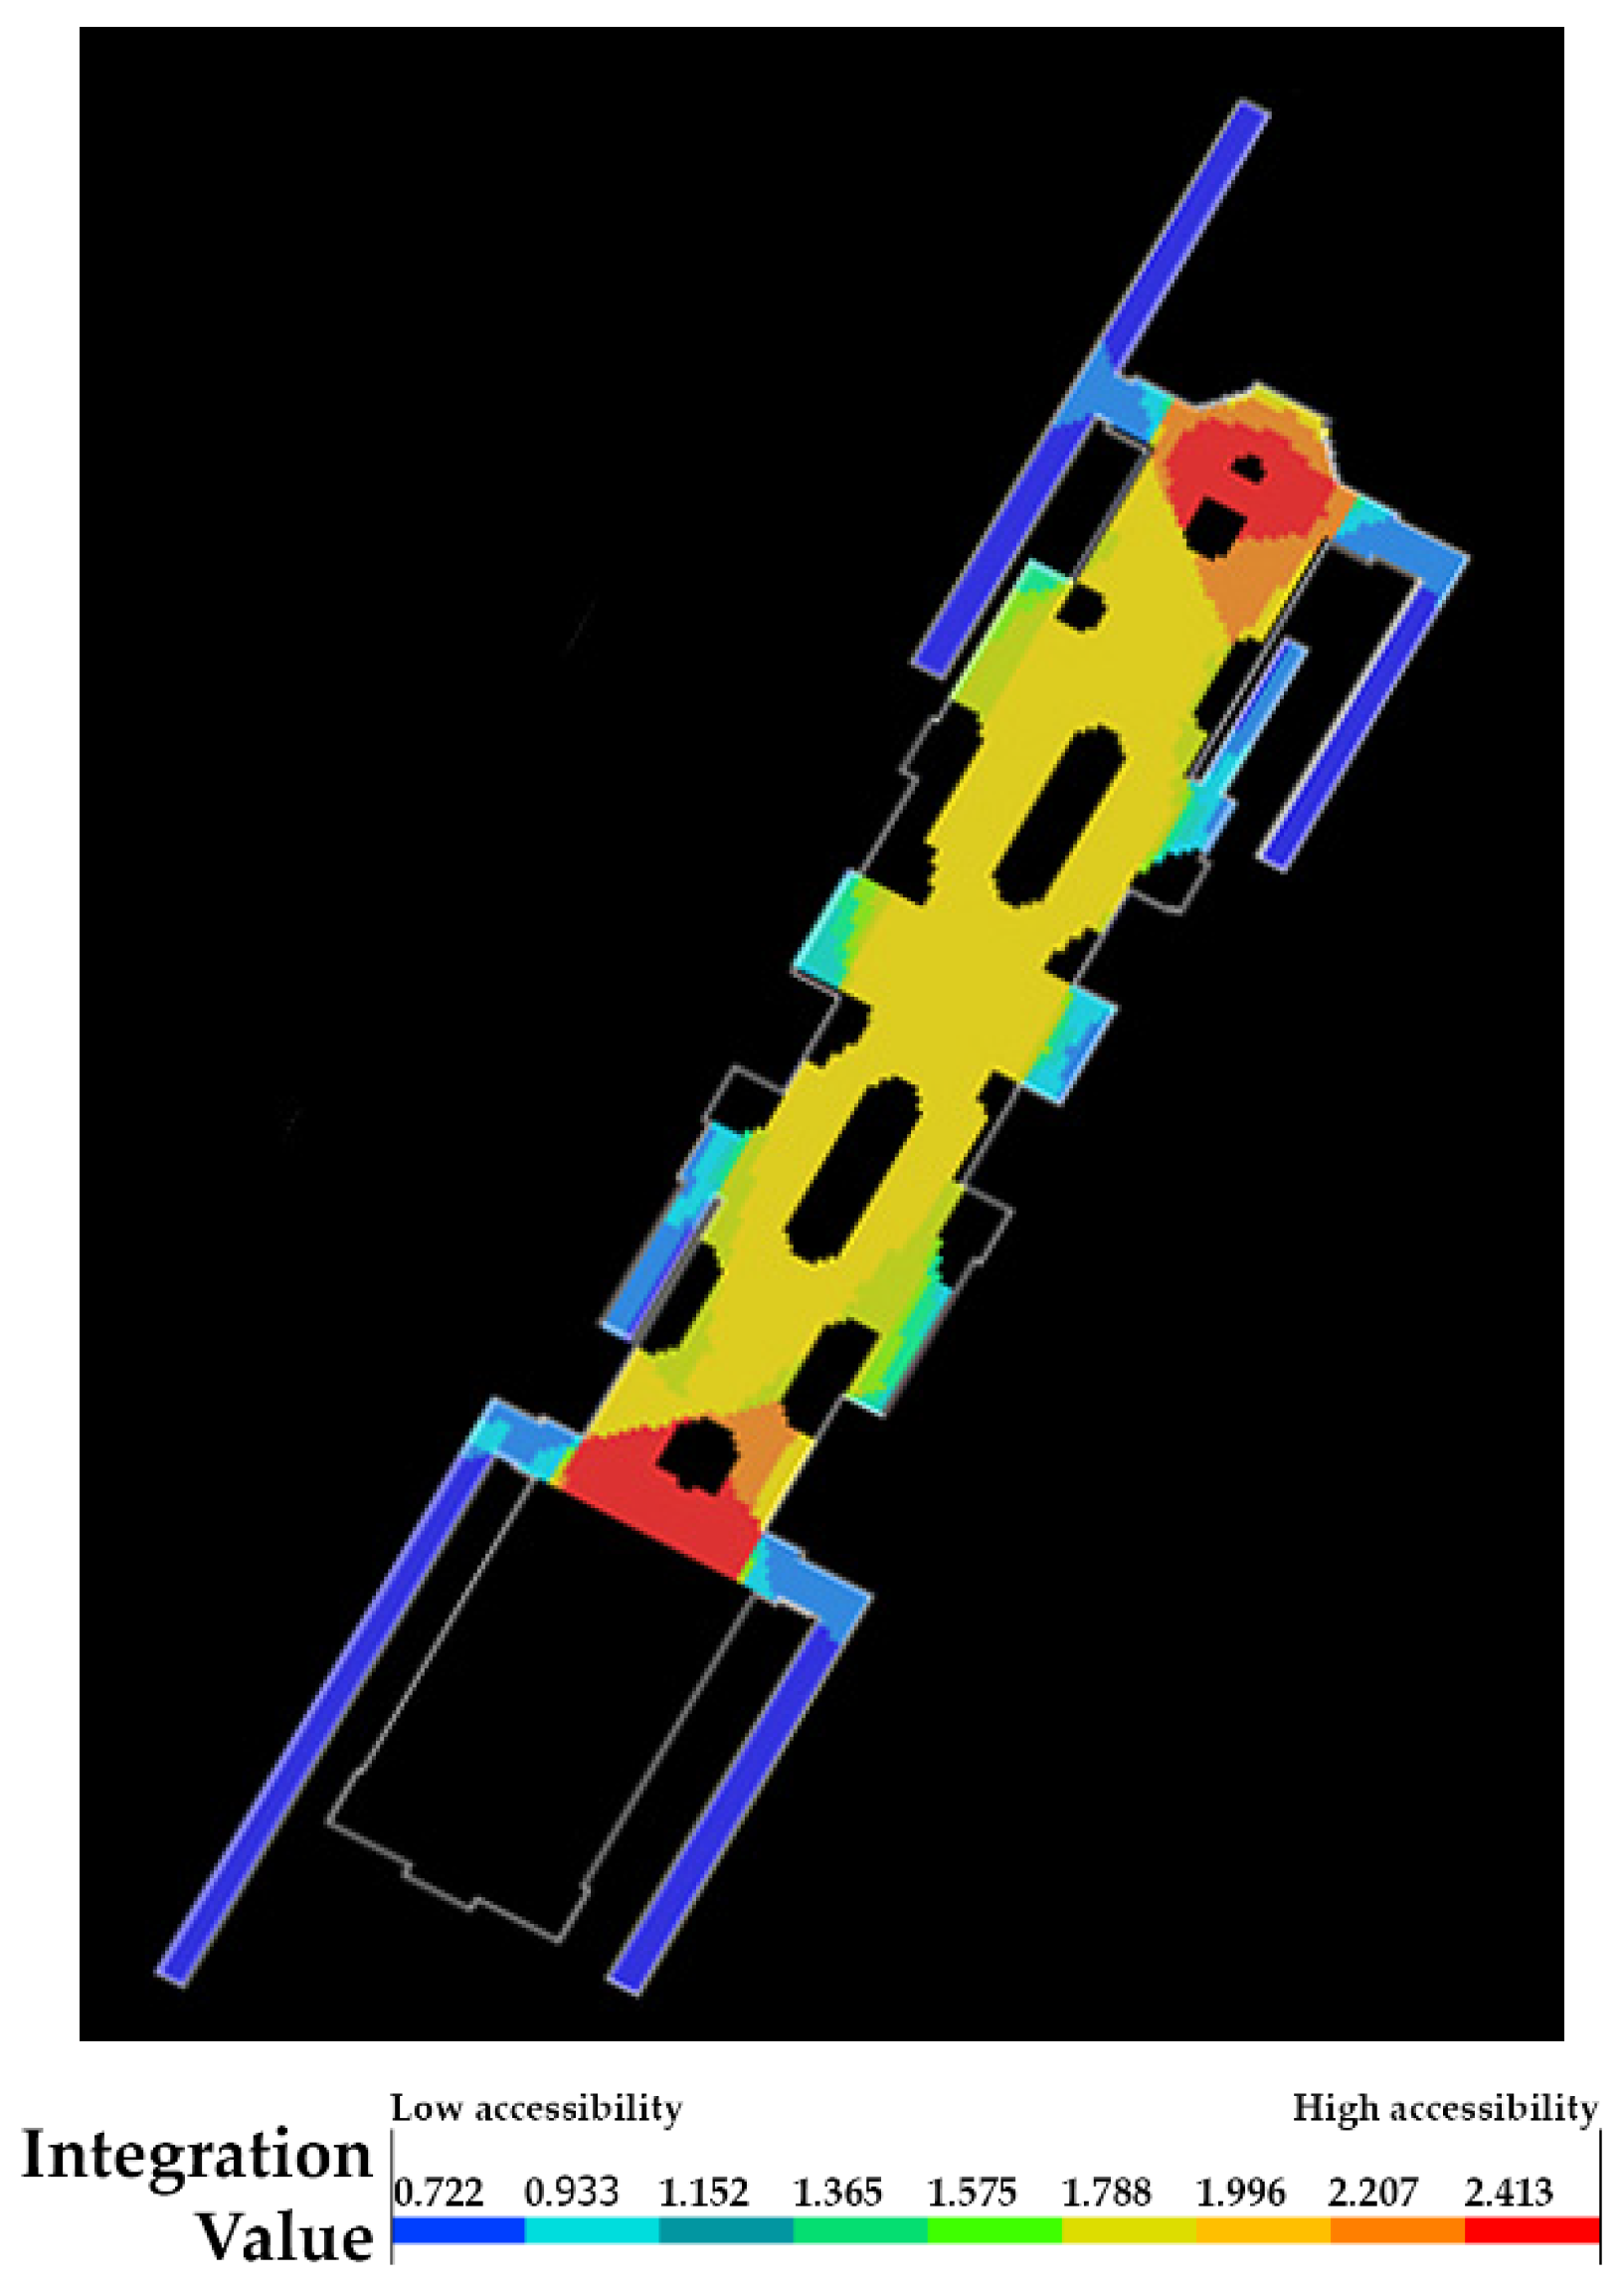
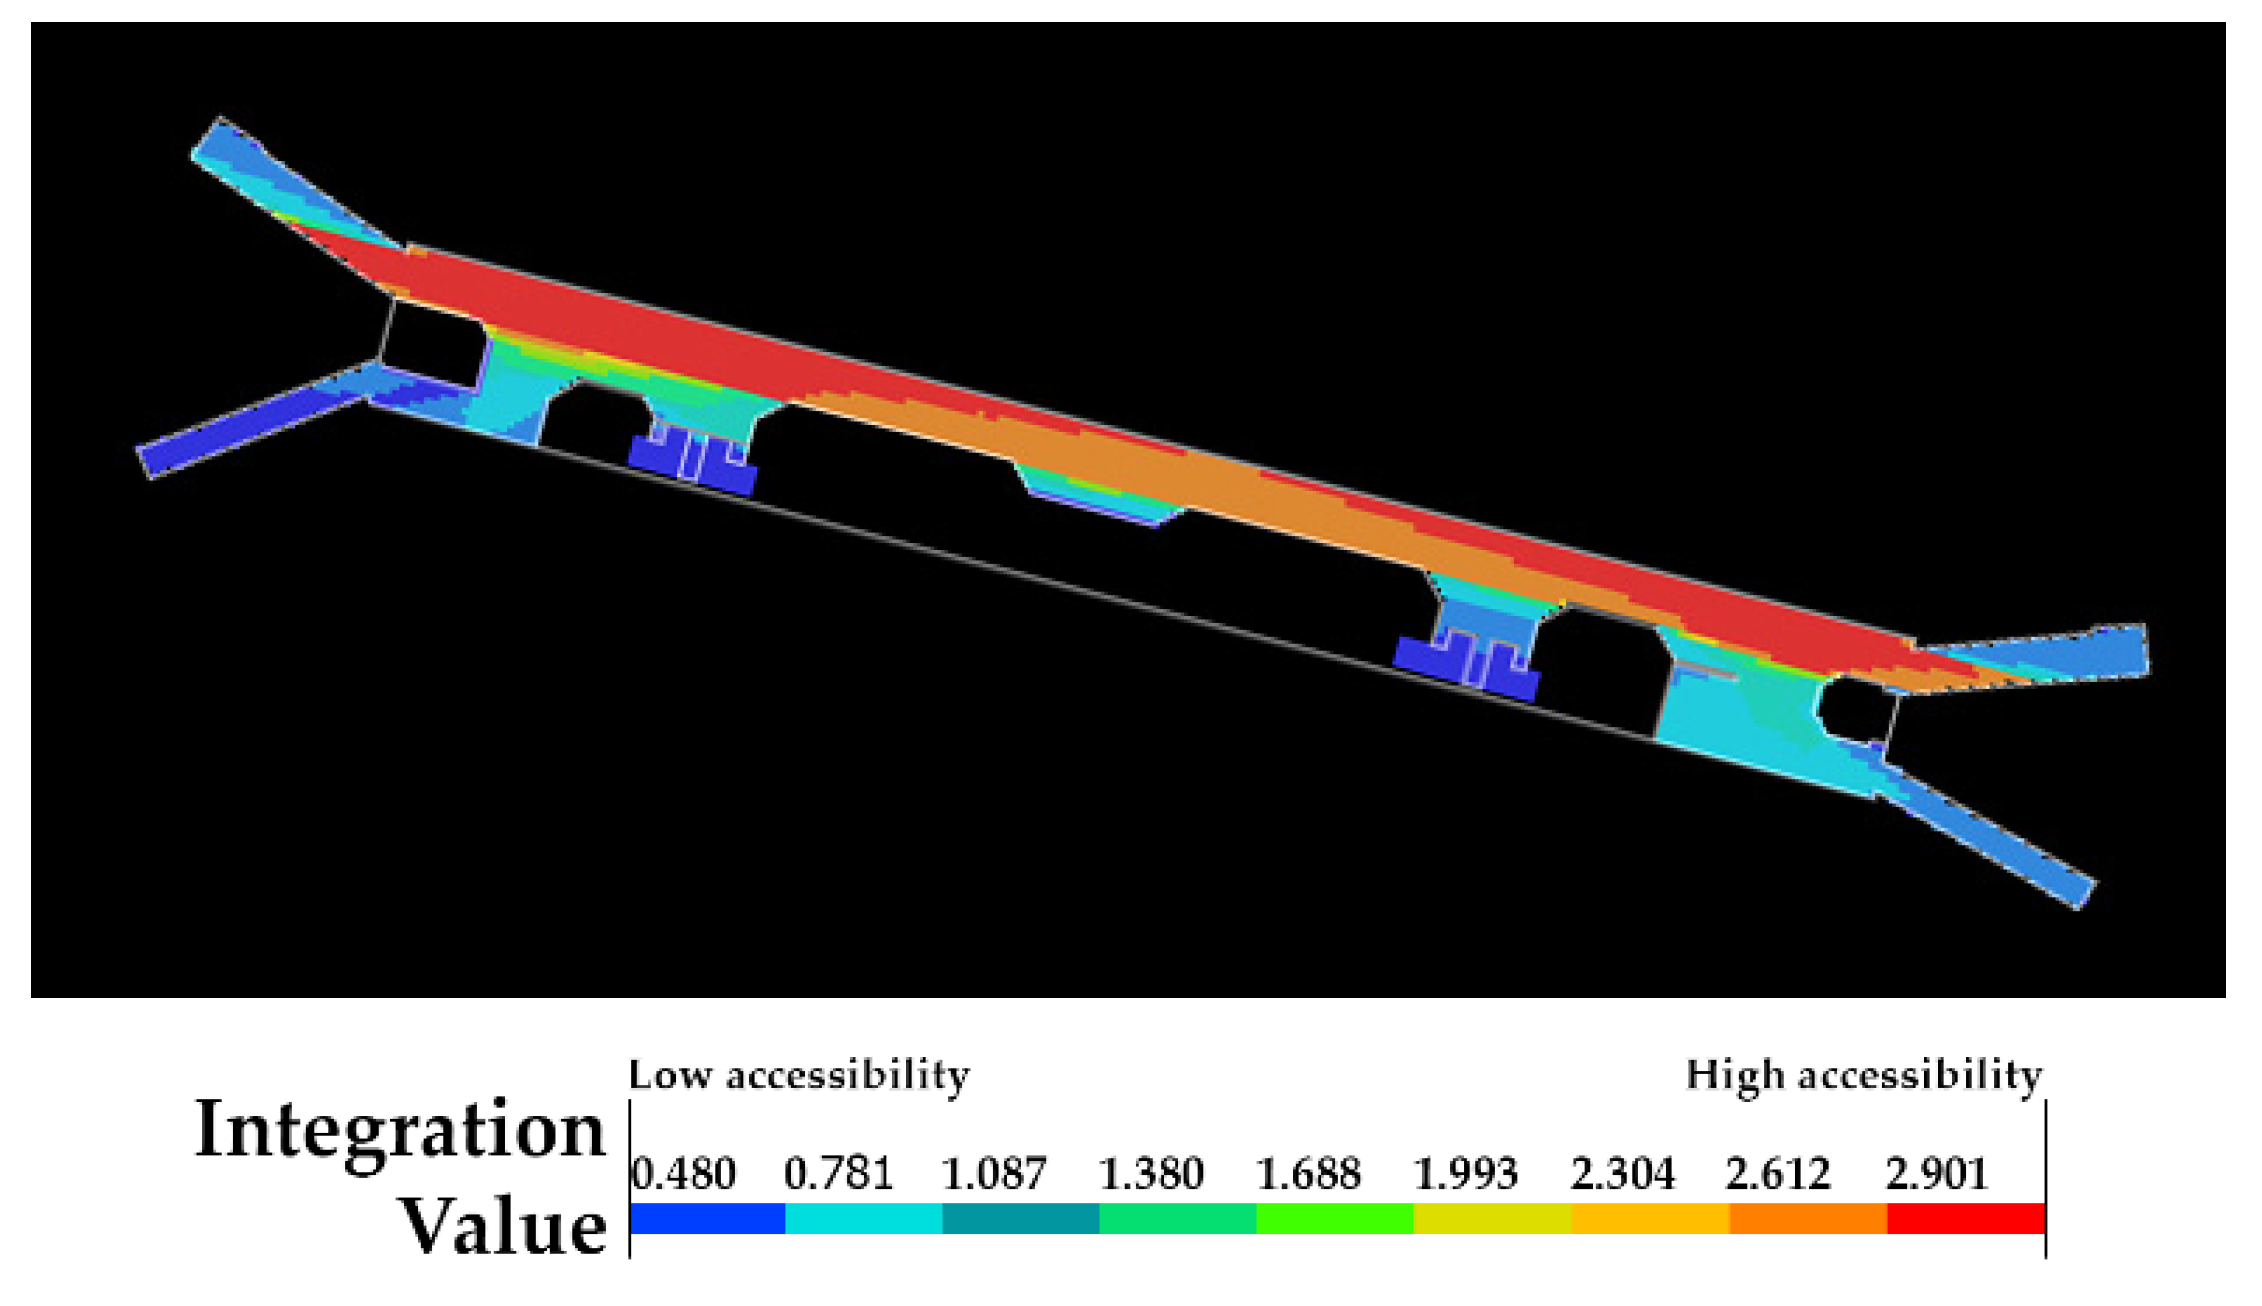
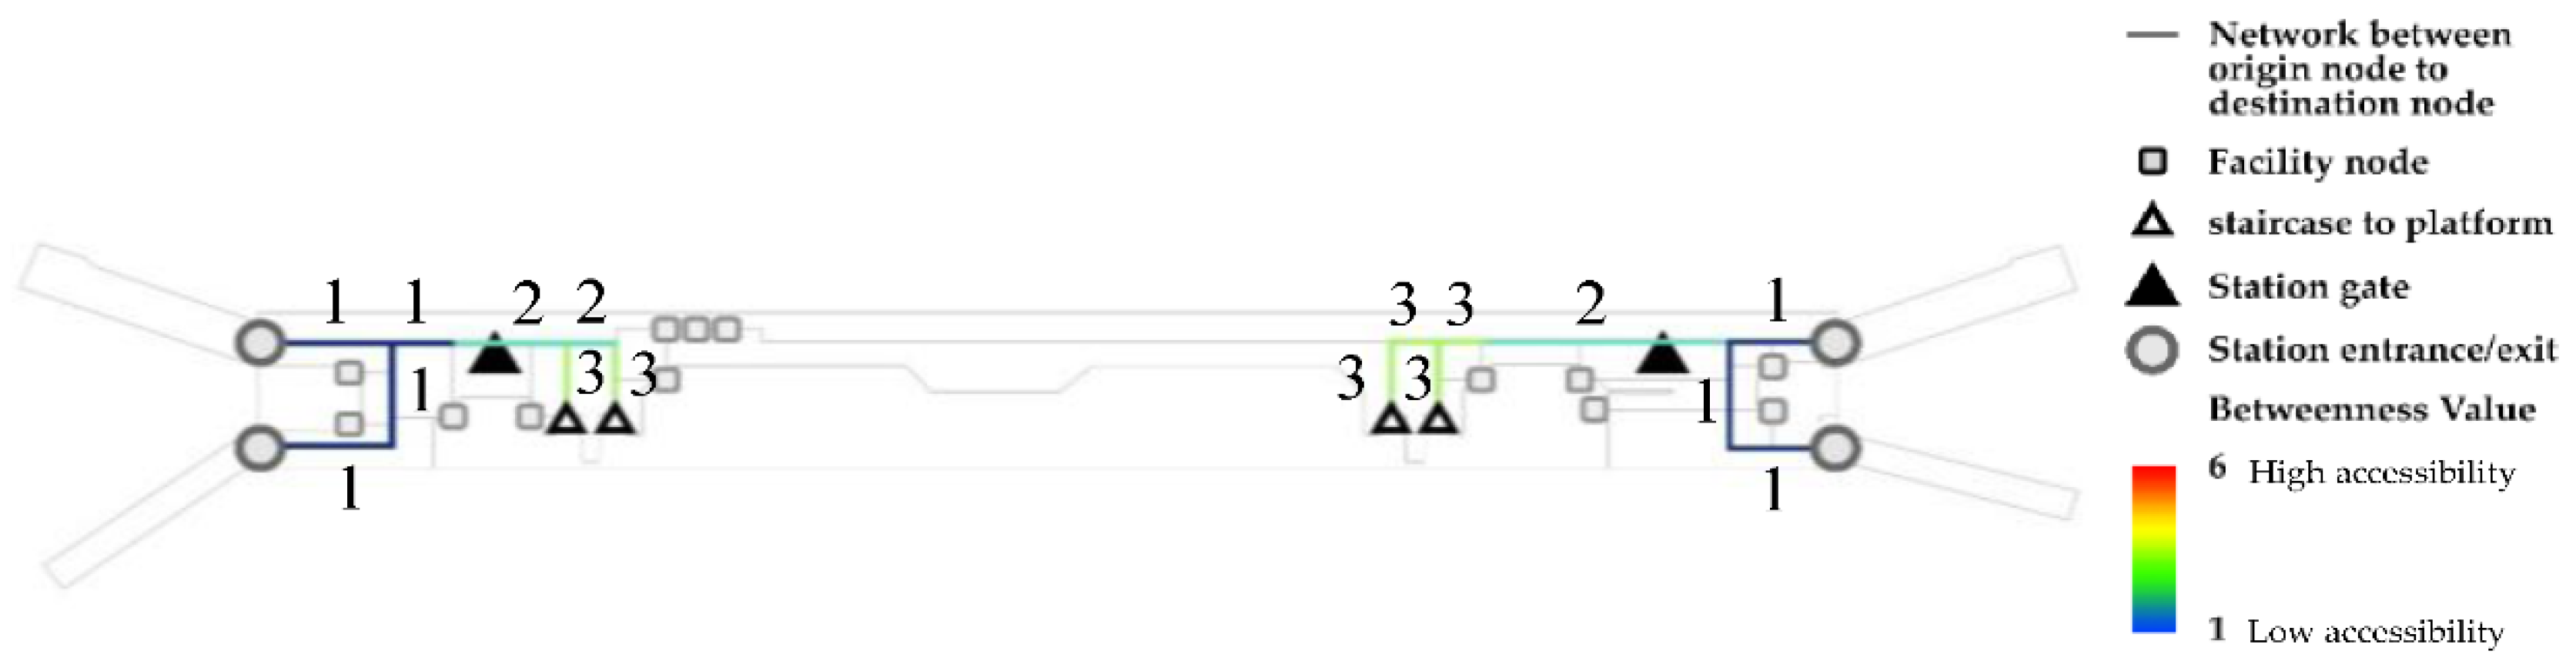
4.2.3. Saphan Taksin Station
4.2.4. Analysis of the Nearest Connection Route in the Station Buildings
5. Discussion
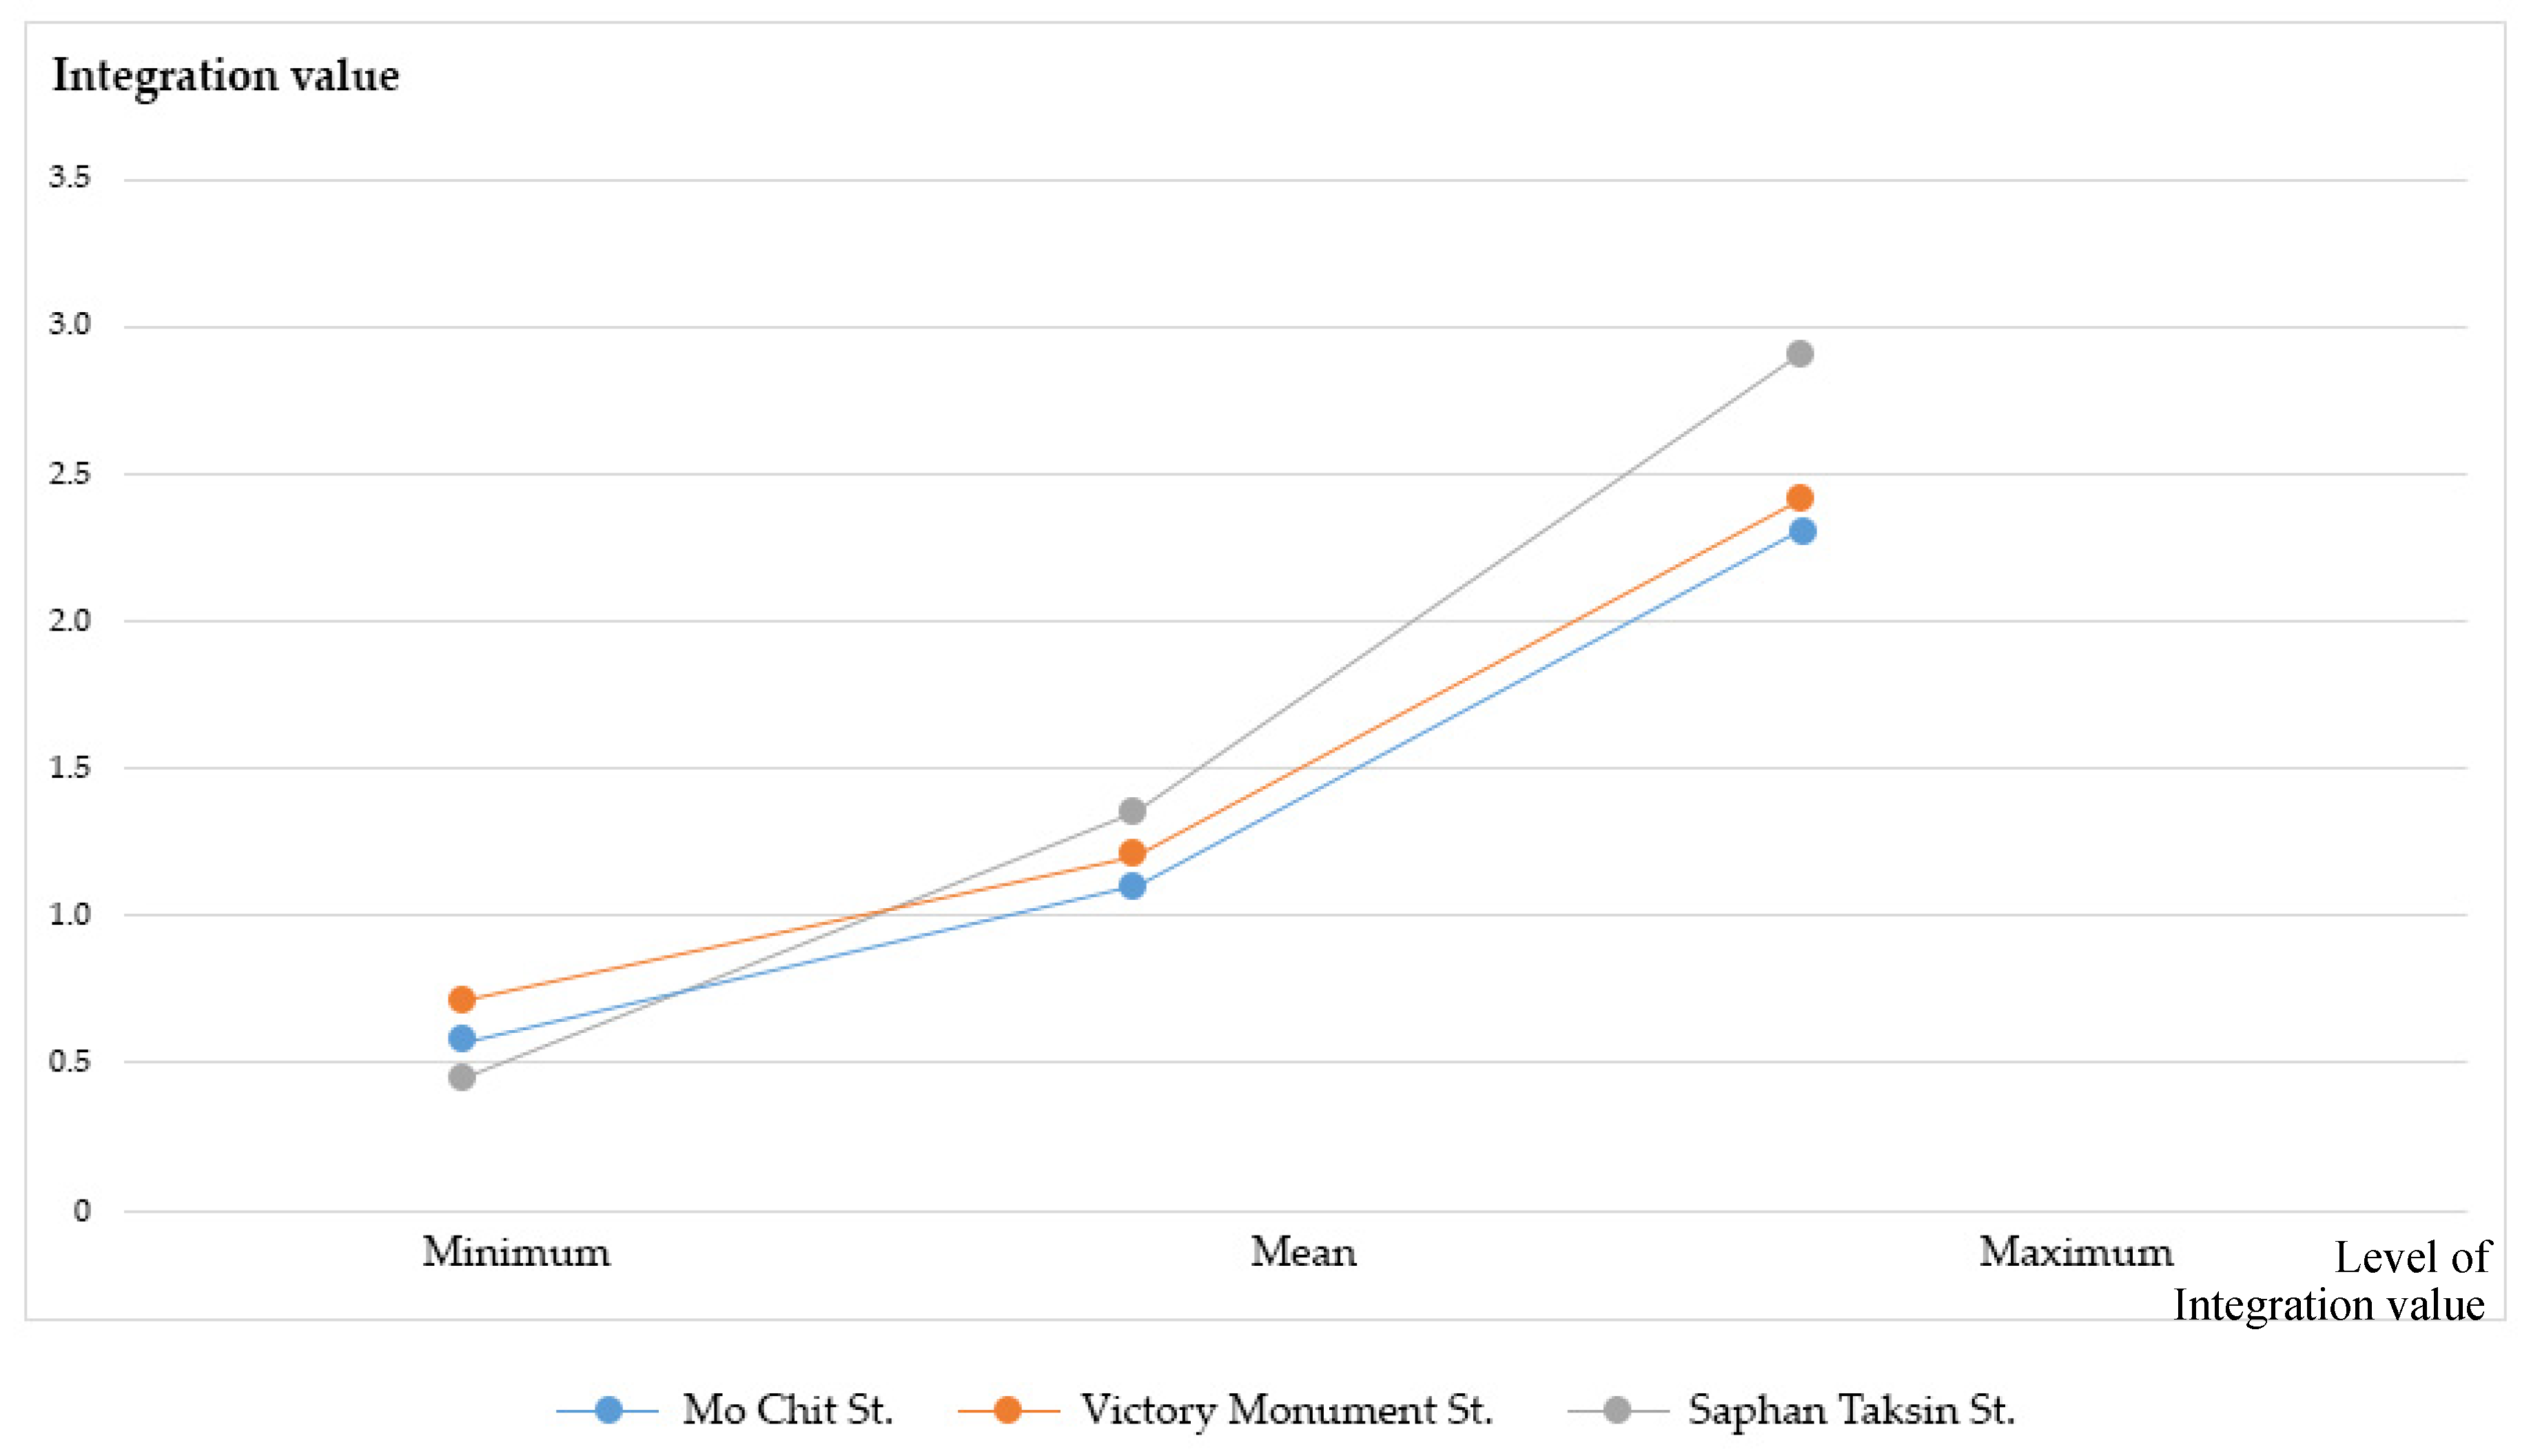
5.1. Comparative Analysis of Connectivity around the Stations
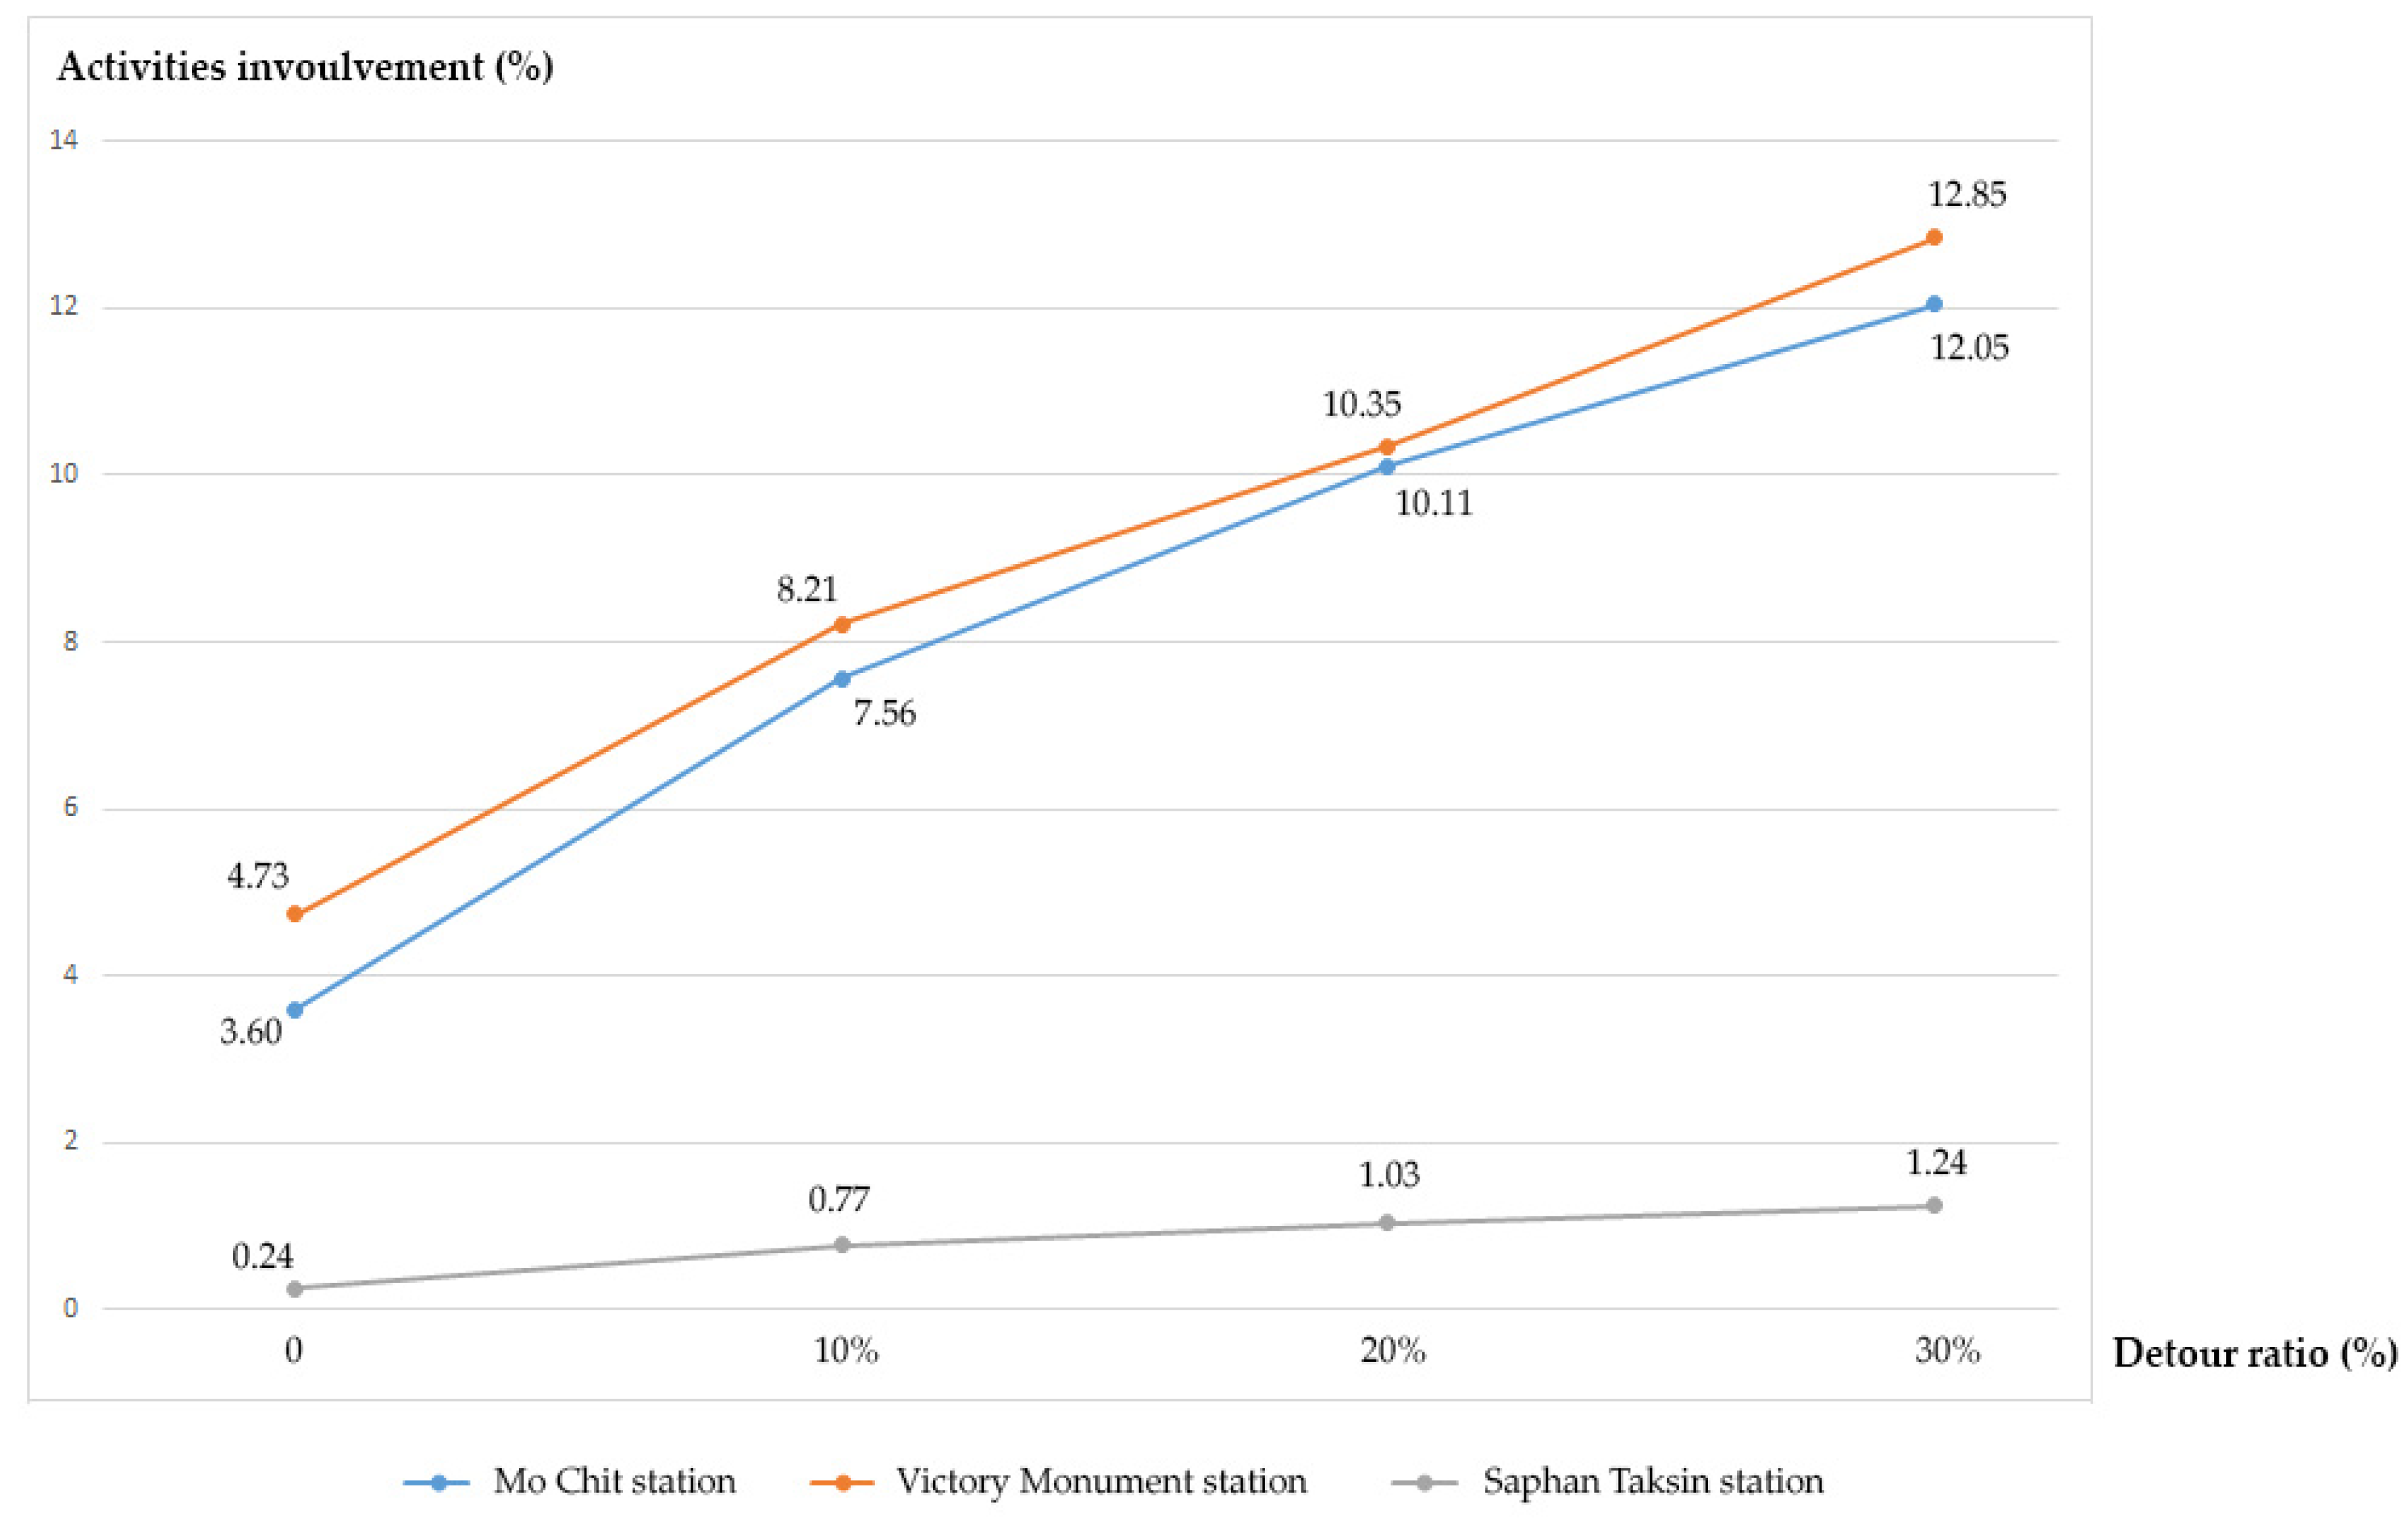
5.2. Comparative Analysis of Accessibility at the Station Buildings and Activities Involvement along Station Building Connection Routes
5.3. Limitations
6. Conclusions
7. Recommendations
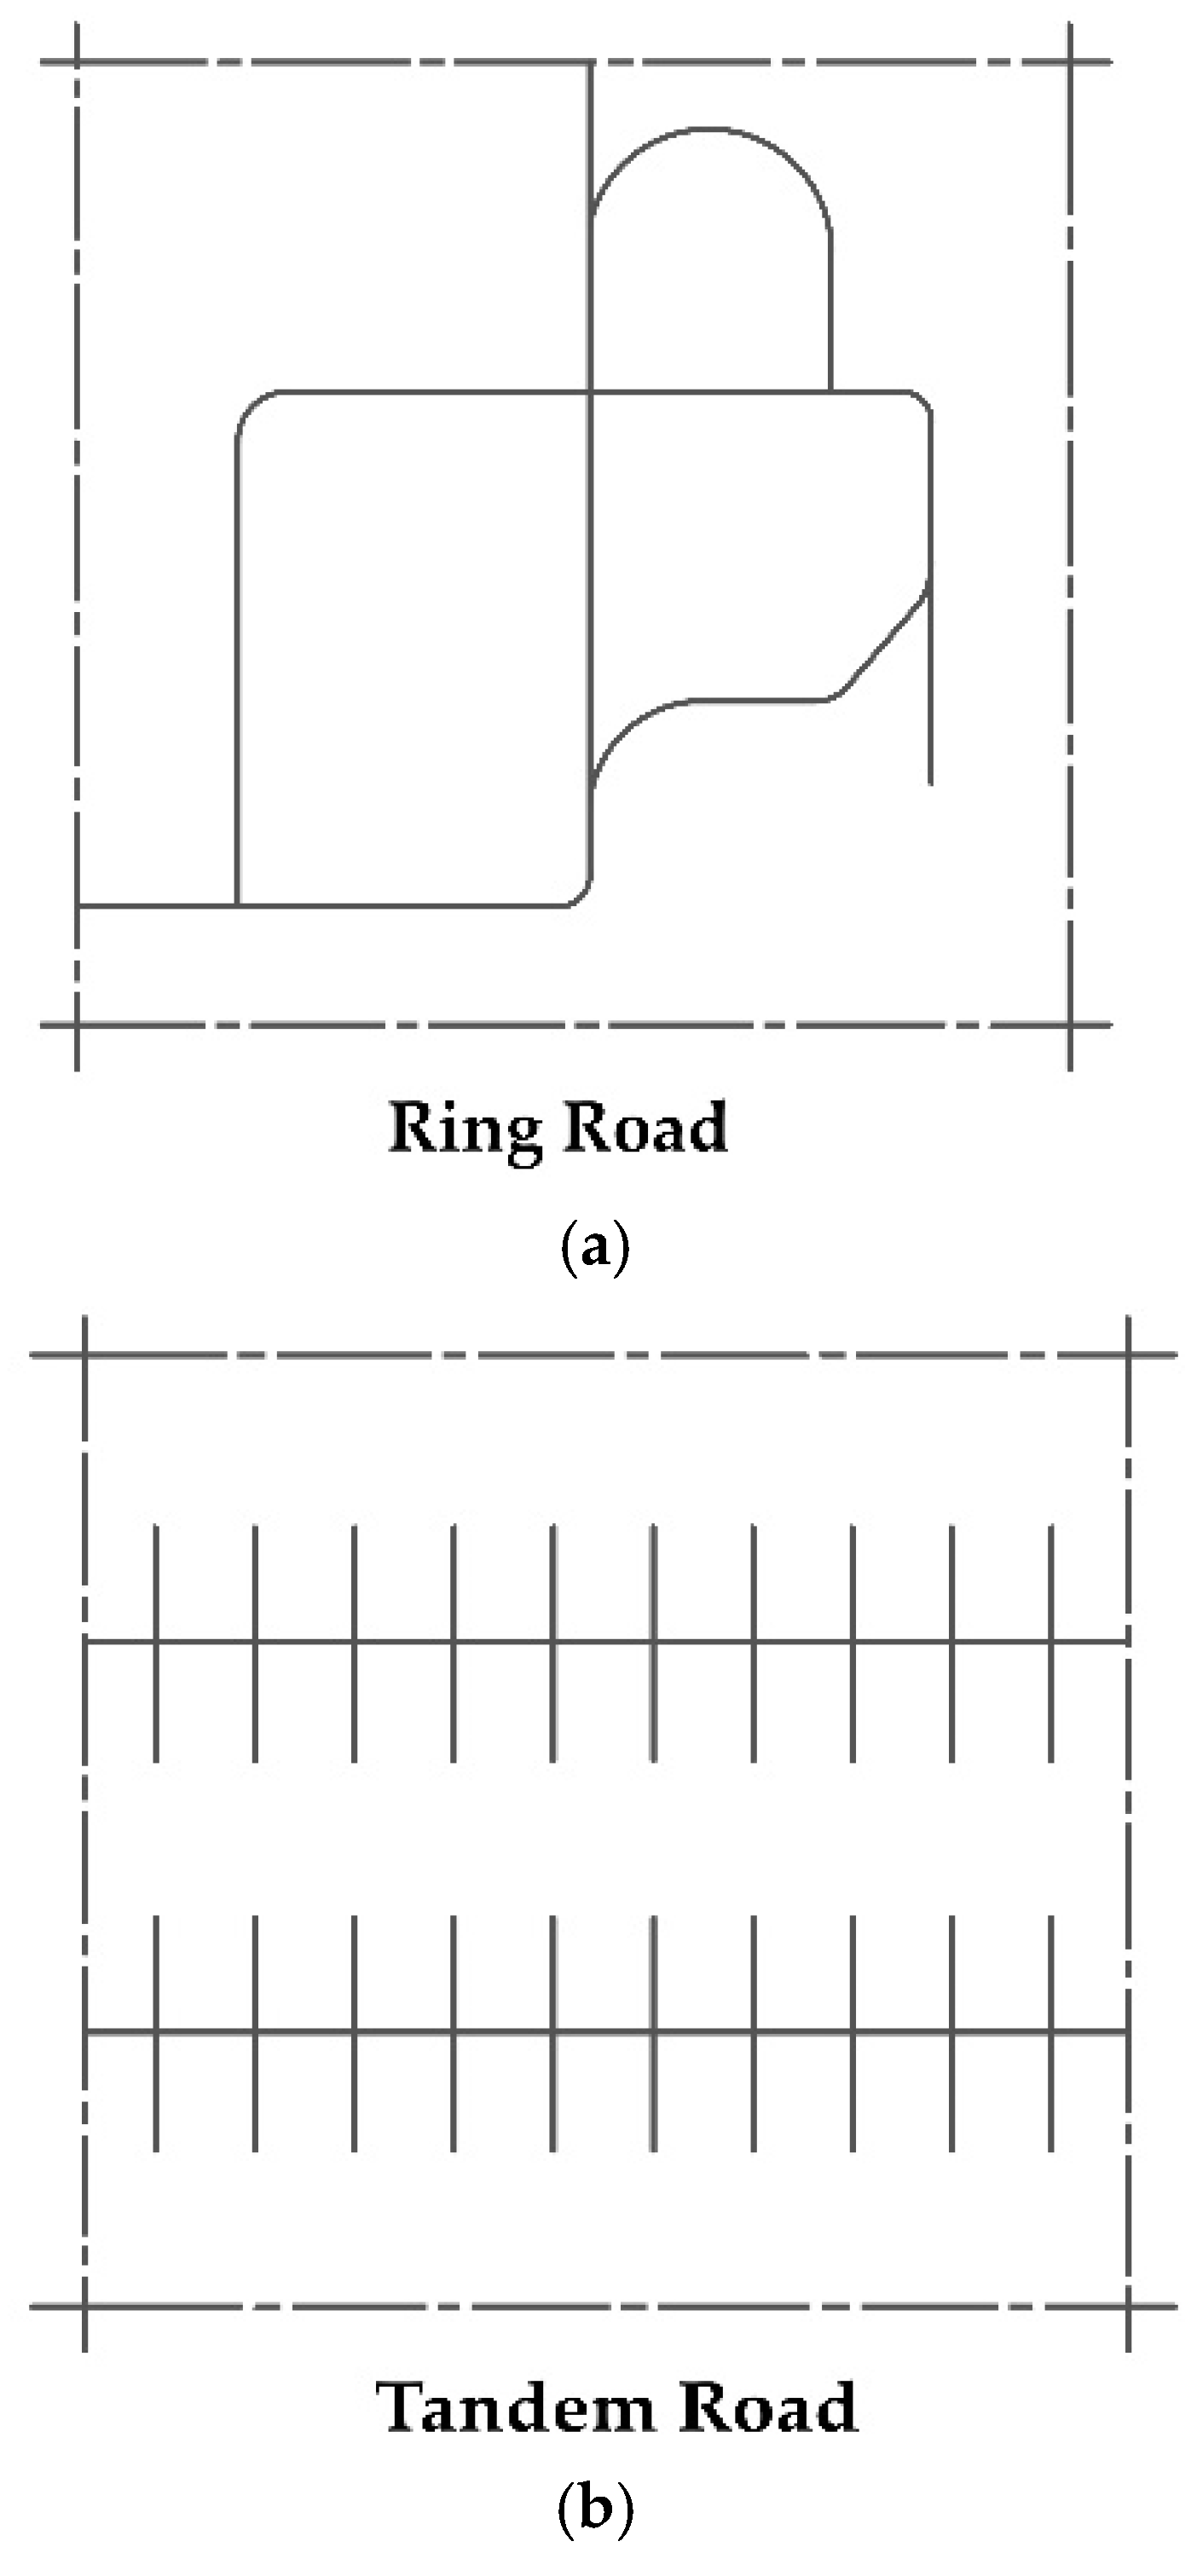
- Improvement of connectivity around the stationFor connectivity around the station, the ring road system has higher efficiency accessibility than the tandem road system which could allow passengers to access the station from a different direction. Planners and designers should design the road system around the station as a ring road system. Regarding three stations in this study, there are many tandem roads around Mo Chit station that make unconnected access from one node to another node. The planner should design the connection of the single dead-end route and change it to be the ring road. It could give more convenient access to the station. For Saphan Taksin station and Victory station, some routes that connect to the stations are also single dead-end routes, Bangkok Metropolitan administration should consider this to reduce the traffic problem, especially traffic jams during rush hour around these three stations.
- Improvement of accessibility in the stationThe results revealed that Saphan Taksin station has the highest accessibility at the long corridor, but in reality, this corridor lacks a facility and is inaccessible to passengers. The design of this station could not reach passengers through this corridor. The station is usually unmanageable for a large number of passengers in the areas around both the station entrances during peak hour, because the activity at the facility nodes are obstructed passengers’ accessibility. Compared with Mo Chit station and Victory Monument station, both stations have fair accessibility, however, the station’s circulation of both stations could spread passengers’ access through the facilities along the corridor. Improvement programs of company agencies should consider the location of the station’s facilities that could spread the passengers’ access to the station by a different direction. For example, the ticketing machines in and out of the station gate should provide at different node (i.e., move the ticketing machines which are located inside the station gate to the long corridor area).
Author Contributions
Conflicts of Interest
References
- Hansen, W.G. How accessibility shapes land use. J. Am. Inst. Plan. 1959, 25, 58–66. [Google Scholar] [CrossRef]
- Litman, T. Evaluating Accessibility for Transport Planning: Measuring People’s Ability to Reach Desired Goods and Activities. In Proceedings of the 87th Transportation Research Board Annual Meeting, Washington, DC, USA, 13–17 January 2008; Vitoria Transport Policy Institute: Victoria, BC, Canada, 2008. [Google Scholar]
- Ross, J. Railway Station: Planning, Design and Management; Architectural Press: Oxford, UK, 2000; pp. 54–55. [Google Scholar]
- Barry, J. Urban Public Transport Today; E&FN SPON: London, UK, 1994; p. 108. [Google Scholar]
- Guo, Z.; Wilson, N. Modeling the effects of transit system transfer on travel behavior: Case of commuter rail and subway in downtown Boston, Massachusetts. Transp. Res. Rec. J. Transp. Res. Board 2007, 2006, 11–20. [Google Scholar] [CrossRef]
- Hernandez, S.; Monzon, A.; de Ona, R. Urban transport interchange: Methodology for evaluating perceived quality. J. Transp. Res. Part A 2016, 84, 31–43. [Google Scholar] [CrossRef]
- The Office of Transport and Traffic Policy and Planning. The Bangkok Traffic Report. 2014. Available online: www.otp.go.th (accessed on 22 July 2018).
- Braun, M. Bangkok Public Transport Accessibility Levels. Master’s Thesis, Eramus School of Economics, Eramus University Rotterdam, Rotterdam, The Netherlands, 2011. [Google Scholar]
- Barte, P. Urban transport in Asia: Problems and prospects for high-density cities. Asia-Pac. Dev. Monit. 2000, 2, 33–66. [Google Scholar]
- Vandenbulcke, G.; Steenberghen, T.; Thomas, T. Mapping accessibility in Belgium: A tool for land-use and transport planning? J. Transp. Geogr. 2009, 17, 39–53. [Google Scholar] [CrossRef]
- Cheng, J.; Bertolini, L.; le Clercq, F. Measuring sustainable accessibility. Transp. Res. Record 2007, 2017, 16–25. [Google Scholar] [CrossRef]
- Chalermpong, S. Rail transit and residential land use in developing countries: Hedonic study of residential property prices in Bangkok, Thailand. Transp. Res. Record 2007, 2038, 111–119. [Google Scholar] [CrossRef]
- Bae, C.H.C.; Jan, M.J.; Park, H. The impact of Seoul’s Subway Line 5 on residential property values. Transp. Policy 2003, 10, 85–94. [Google Scholar] [CrossRef]
- Du, H.; Mulley, C. The short-term land value impacts of urban rail transit: Quantitative evidence from Sunderland, UK. Land Use Police 2007, 24, 223–233. [Google Scholar] [CrossRef]
- Siewwuttanagul, S.; Noichan, R.; Dewancker, B.; Inohae, T.; Mishima, N. Identifying the Arrangement of Activities of Corridor Spaces in Transit Station. Built 2017, 10, 17–26. [Google Scholar]
- Prasertsubpakij, D.; Nitivattananon, V. Evaluation accessibility to Bangkok Metro Systems using multi-dimensional criteria across user groups. IATSS Res. 2012, 36, 56–65. [Google Scholar] [CrossRef]
- Martilla, J.A.; James, J.C. Importance-performance analysis. J. Mark. 1977, 14, 77–79. [Google Scholar] [CrossRef]
- Chou, J.S.; Kinm, C.; Kuo, Y.C.; Ou, N.C. Deploying effective service strategy in the operations stage of high-speed rail. Transp. Res. Part E Logist. Transp. Rev. 2011, 47, 507–519. [Google Scholar] [CrossRef]
- Weinstein, A. Customer satisfaction among transit riders: How customers rank the relative importance of various service attributes. Transp. Res. Rec. J. Transp. Res. Board 2000, 1735, 123–132. [Google Scholar] [CrossRef]
- Hill, B. Designing safer streets: An evidence-based approach. Plan. Lond. 2004, 48, 45–49. [Google Scholar]
- Klarqvist, B. A space syntax glossary. Nord. Arkit. 1993, 2, 11–12. [Google Scholar]
- Mellors, C. Urban Transport Systems. Governments and the Individual Their Secrecy and His Privacy; Young John B: New York, NY, USA, 1978. [Google Scholar]
- Weibull, J.W. An axiomatic approach to the measurement of accessibility. Reg. Sci. Urban Econ. 1976, 6, 357–379. [Google Scholar] [CrossRef]
- Yazdanfar, S.A.; Mousavi, M.; Zargar, H. Analysis of the spatial structure of Tabriz in Barrow with usage of space syntax method. Road Struct. 2008, 67, 58–67. [Google Scholar]
- Geurs, K.T.; van Wee, B. Accessibility evaluation of land-use and transport strategies: Review and research directions. J. Transp. Geogr. 2004, 12, 127–140. [Google Scholar] [CrossRef]
- Curtis, C.; Scheurer, J. Planning for sustainable accessibility: Developing tools to aid discussion and decision-making. Prog. Plan. 2010, 74, 53–106. [Google Scholar] [CrossRef]
- Park, R.S. Improving pedestrian access to transit stations in less walkable environments. In Proceedings of the Fourth International Conference on Walking in the 21st Century, Portland, OR, USA, 1–3 May 2003. [Google Scholar]
- Schlossberg, M.; Brown, N. Comparing transit-oriented development sites by walkability indicators. Transport. Res. Rec. J. Transp. Res. Board 2004, 1887, 34–42. [Google Scholar] [CrossRef]
- Zhang, N.; Dai, J.; Zhang, X.J. Walking affect area of rail transit station based on multinomial logit model. Urban Mass Transit 2012, 15, 46–49. [Google Scholar]
- Galiza, R.; Charles, P. Improving Rail Station Access in Australia; Station Access R1.133; CRC for Rail Innovation: Brisbane, Australia, 2013. [Google Scholar]
- Kwan, M.P.; Janelle, D.G.; Goodchild, M.F. Accessibility in space and time: A theme in spatially integrated social science. J. Geogr. Syst. 2003, 5, 1–3. [Google Scholar] [CrossRef]
- Koenig, J.G. Indicators of urban accessibility: Theory and application. Transportation 1980, 9, 145–172. [Google Scholar] [CrossRef]
- Geertman, S.C.; Ritsema Van Eck, J.R. GIS and models of accessibility potential: An application in planning. Int. J. Geogr. Inf. Syst. 1995, 9, 67–80. [Google Scholar] [CrossRef]
- Páez, A.; Scott, D.M.; Morency, C. Measuring accessibility: Positive and normative implementation of various indicators. J. Transp. Geogr. 2012, 25, 141–153. [Google Scholar] [CrossRef]
- Hickman, R.; Chia-Lin, C.; Andy, C.; Sharad, S. Improving interchanges in China: the experiential phenomenon. J. Transp. Geogr. 2015, 42, 175–186. [Google Scholar] [CrossRef]
- Bangkok Mass Transit System Public Company Limited. Station Info. Available online: https://www.bts.co.th/eng/routemap.html (accessed on 11 August 2018).
- Bangkok Mass Transit System Public Company Limited. Annual Report. 2015/2016. Available online: http://bts.listedcompany.com/misc/ar/20160621-bts-ar201516-en-02.pdf (accessed on 25 August 2018).
- Bangkok Mass Transit System Public Company Limited. Annual Report. 2017/2018. Available online: http://btsgif.listedcompany.com/misc/ar/20180725-btsgif-ar2017_2018-en.pdf (accessed on 16 September 2018).
- Bangkok Expressway and Metro Public Company Limited. Available online: www.bemplc.co.th (accessed on 22 August 2018).
- Supaporn, K. Mass Transit Station Environments and Accessibility Improvements: Lessons Learned from Ban Thab Chang Airport Rail Link Station, Bangkok. Acad. J. Fac. Archit. 2016, 15, 153–172. [Google Scholar]
- Chinorak, K.; Dankittikul, C. Pedestrain Network around Bangkok Transit System Station: A case study of Onnut BTS Station. Veridian 2016, 12, 3042–3053. [Google Scholar]
- Hillier, B.; Hanson, J.; Peponis, J.; Hudson, J. Space syntax. A different urban perspective. Archit. J. 1983, 11, 51–63. [Google Scholar]
- Ching, F. Architecture Form, Space, and Order, 3rd ed.; John Wiley & Sons, Inc.: Hoboken, NJ, USA, 2007. [Google Scholar]
- Yang, Y.J.; Song, X.D. Comparing accessibility measures based on GIS. J. Archit. Civ. Eng. 2005, 21, 27–32. [Google Scholar]
- Jiang, B.; Claramunt, C.; Klarqvist, B. Integration of space syntax into GIS for modelling urban spaces. J. Appl. Earth Obs. Geoinf. 2000, 2, 161–171. [Google Scholar] [CrossRef]
- Sevtsuk, A.; Kalvo, R. Urban Network Analysis Toolbox for Rhinoceros 3D: Help Version 5.10.10.3 R5RS10; Singapore University of Technology & Design in Collaboration with MIT: Singapore, 2015. [Google Scholar]
- Zhu, X.; Liu, S. Analysis of the impact of the MRT system on accessibility in Singapore using an integrated GIS tool. J. Transp. Geogr. 2004, 12, 89–101. [Google Scholar] [CrossRef]
- Boeing, G. OSMna: New Methods for Acquiring, Constructing, Analyzing, and Visualizing Complex Street Networks. Comput. Environ. Urban Syst. 2017, 65, 126–139. [Google Scholar] [CrossRef]
- Rodriguez, D.A.; Joo, J. The relationship between non-motorized mode choice and the local physical environment. Transp. Res. Part D 2004, 9, 151–173. [Google Scholar] [CrossRef]


| Independent Variable | Dependent Variables |
|---|---|
| Visibility | Connectivity |
| Step Depth | |
| Integration-HH |
| Available Facility | |||
|---|---|---|---|
| Station | |||
| Saphan Taksin | Mo Chit | Victory Monument | |
| Bicycle parking | No | Yes | Yes |
| Parking area | No | Yes | No |
| Stair | Yes | Yes | Yes |
| Elevators | No | Yes | Yes |
| Escalator | Yes | Yes | Yes |
| Skywalk | No | No | Yes |
| Time table | No | Yes | Yes |
| Priority way for disabled users | No | Yes | Yes |
| Information for disabled and elderly users | No | No | No |
| Adequate signage for blind | No | Yes | Yes |
| Size of Pedestrian | |||
| Saphan Taksin | Mo Chit | Victory Monument | |
| Sidewalk (width) | Between 1 and 3 m. | Between 1 and 3 m. | Between 1 and 3 m. |
| Connectivity at Transit station | |||
| Saphan Taksin | Mo Chit | Victory Monument | |
| Bus lines | 11 lines | 40 lines | 77 lines |
| Boat | Yes | No | No |
| Train | No | No | No |
| BRT (Bus rapid transit) | No | No | No |
| MRT Subway | No | Yes | No |
| BTS Skytrain | Yes | Yes | Yes |
| SRT (Suvarnabhumi Airport Rail Link) | No | No | No |
| Para-transit | Yes | Yes | Yes |
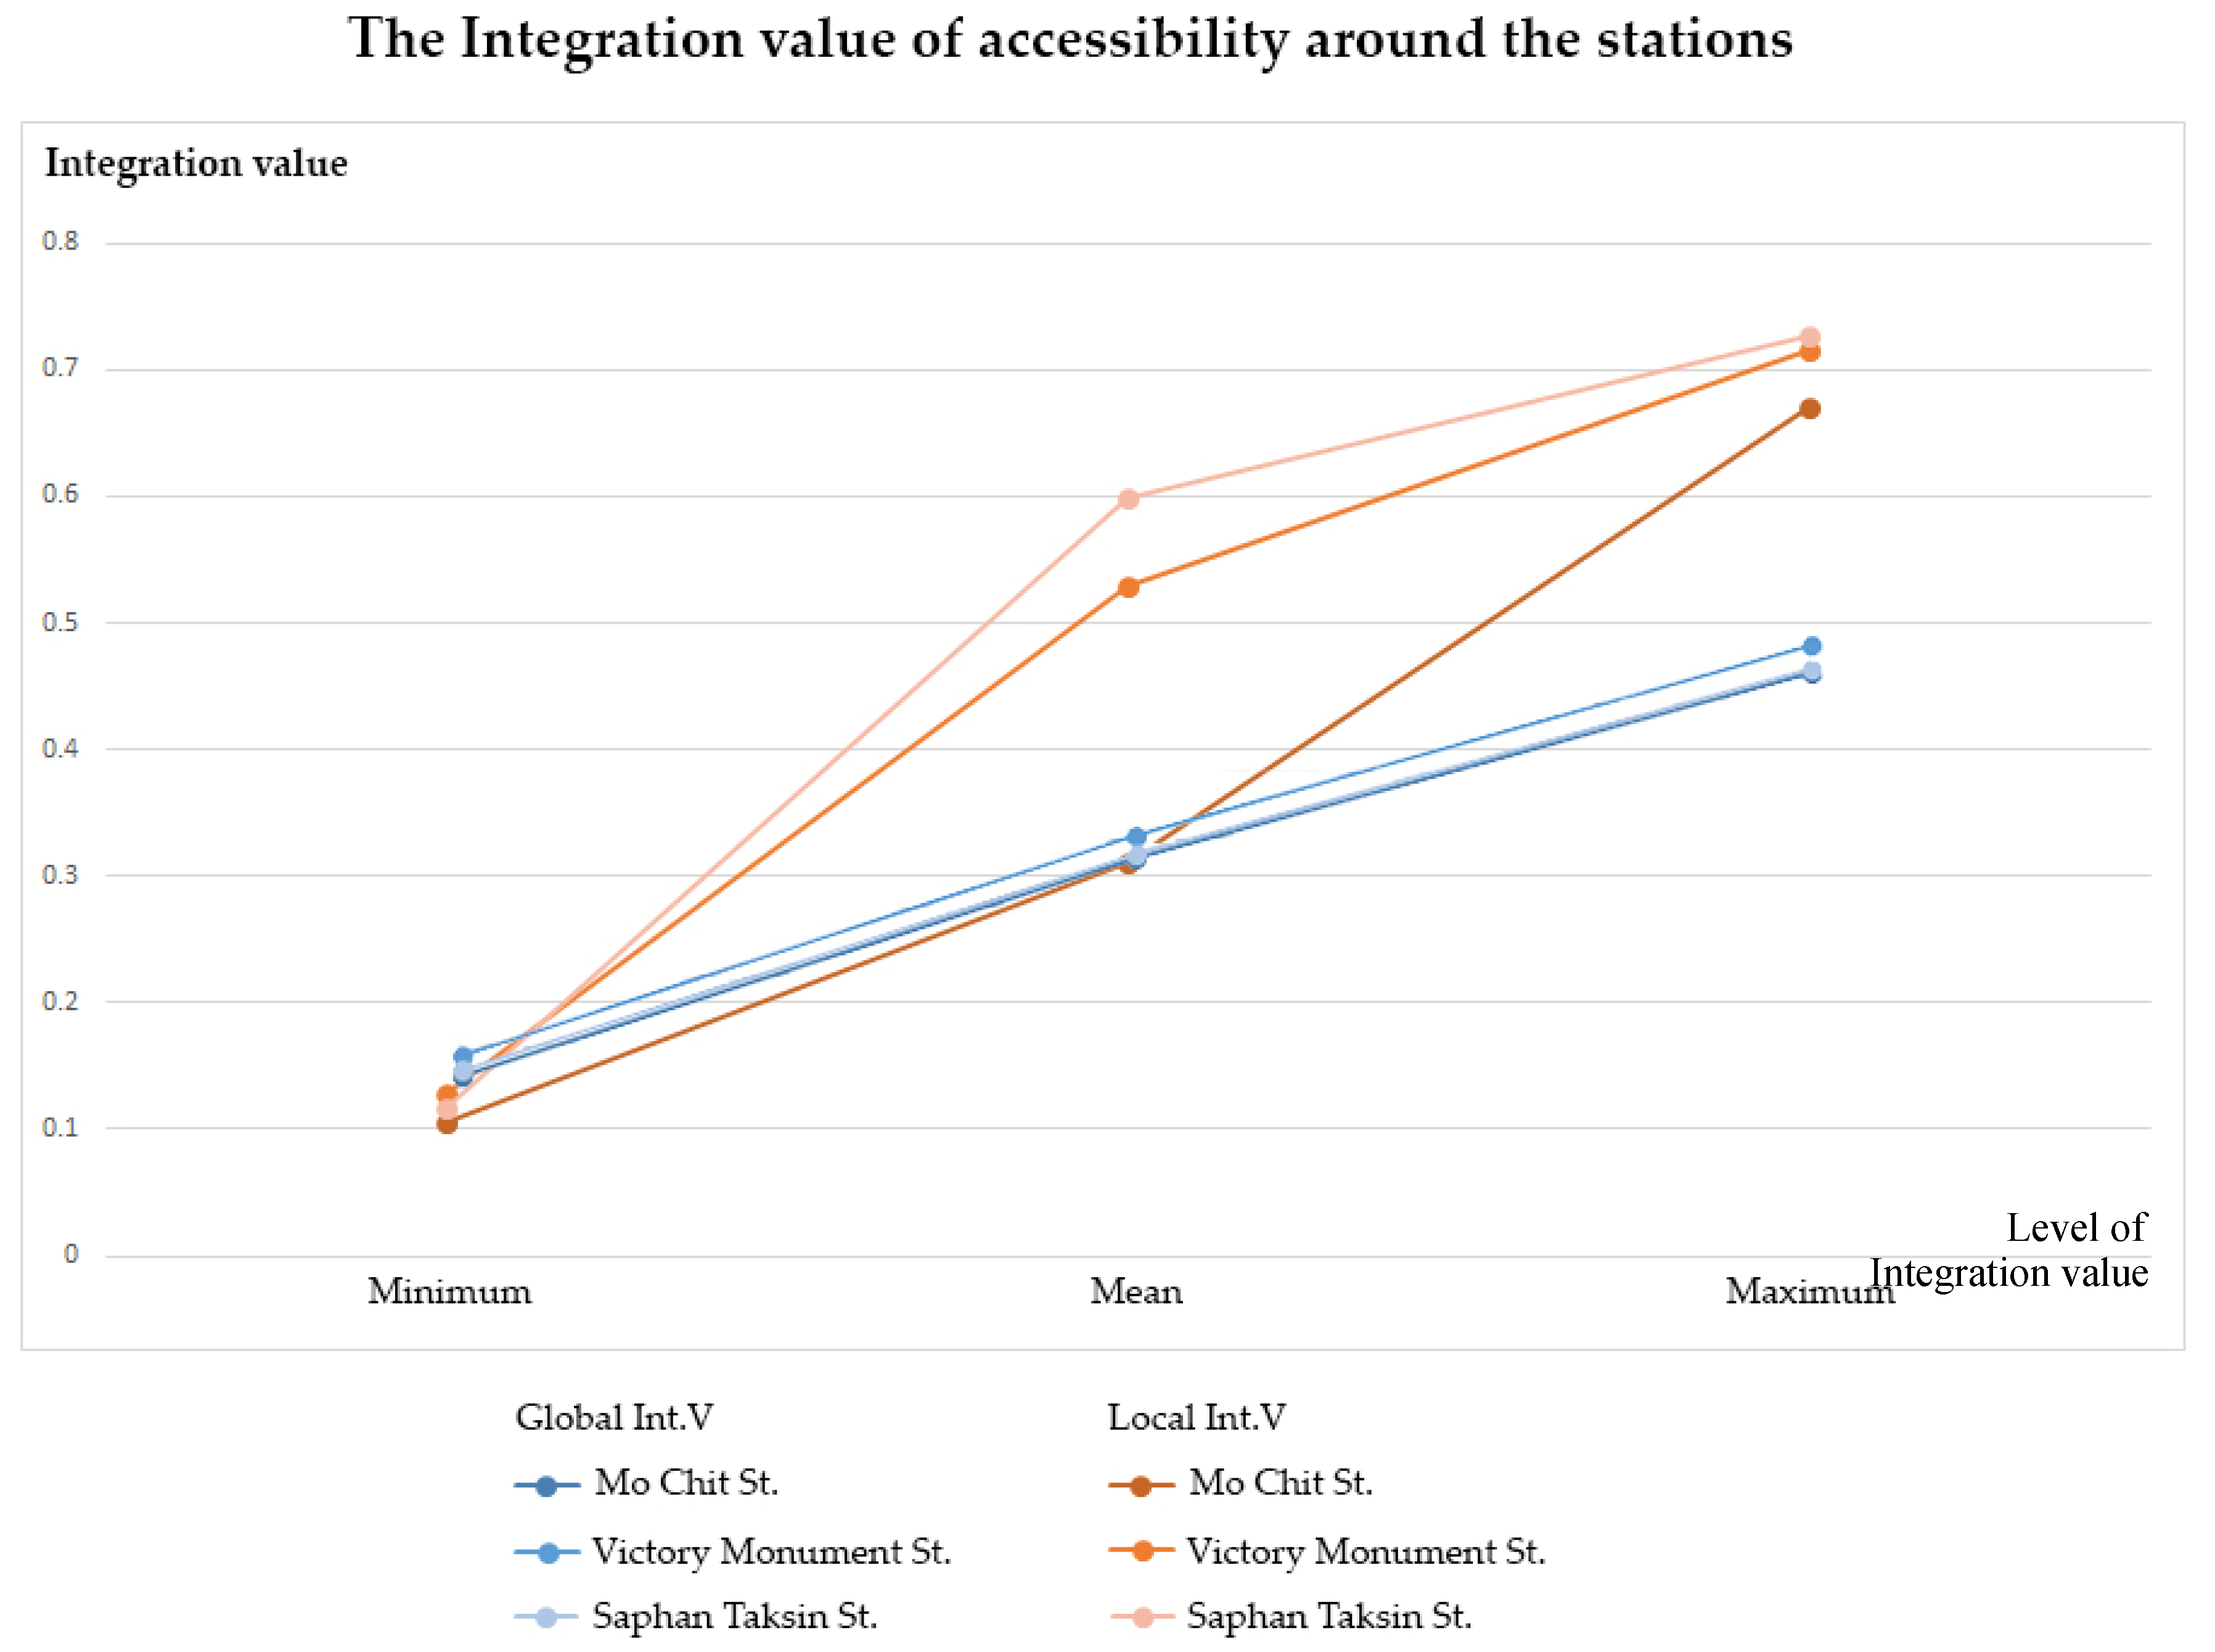
| Stations | Global Int.V | Local Int.V | ||||
|---|---|---|---|---|---|---|
| Minimum | Mean | Maximum | Minimum | Mean | Maximum | |
| Mo Chit | 0.128 | 0.286 | 0.422 | 0.105 | 0.311 | 0.670 |
| Victory Monument | 0.142 | 0.304 | 0.442 | 0.129 | 0.530 | 0.715 |
| Saphan Taksin | 0.133 | 0.289 | 0.426 | 0.117 | 0.598 | 0.726 |
| Stations | Minimum | Mean | Maximum |
|---|---|---|---|
| Mo Chit | 0.591 | 1.104 | 2.318 |
| Victory Monument | 0.722 | 1.212 | 2.413 |
| Saphan Taksin | 0.480 | 1.347 | 2.901 |
© 2018 by the authors. Licensee MDPI, Basel, Switzerland. This article is an open access article distributed under the terms and conditions of the Creative Commons Attribution (CC BY) license (http://creativecommons.org/licenses/by/4.0/).
Share and Cite
Noichan, R.; Dewancker, B. Analysis of Accessibility in an Urban Mass Transit Node: A Case Study in a Bangkok Transit Station. Sustainability 2018, 10, 4819. https://doi.org/10.3390/su10124819
Noichan R, Dewancker B. Analysis of Accessibility in an Urban Mass Transit Node: A Case Study in a Bangkok Transit Station. Sustainability. 2018; 10(12):4819. https://doi.org/10.3390/su10124819
Chicago/Turabian StyleNoichan, Rungpansa, and Bart Dewancker. 2018. "Analysis of Accessibility in an Urban Mass Transit Node: A Case Study in a Bangkok Transit Station" Sustainability 10, no. 12: 4819. https://doi.org/10.3390/su10124819
APA StyleNoichan, R., & Dewancker, B. (2018). Analysis of Accessibility in an Urban Mass Transit Node: A Case Study in a Bangkok Transit Station. Sustainability, 10(12), 4819. https://doi.org/10.3390/su10124819