Article

Value Addition and Productivity Differentials in the Nigerian Cassava System

by
Temitayo A. Adeyemo
* and
Victor O. Okoruwa
Department of Agricultural Economics, University of Ibadan, Ibadan, Nigeria
*
Author to whom correspondence should be addressed.
Sustainability 2018, 10(12), 4770; https://doi.org/10.3390/su10124770
Submission received: 20 September 2018 / Revised: 21 November 2018 / Accepted: 30 November 2018 / Published: 14 December 2018

Abstract

:
There is an increasing need to improve value addition in order to get maximum utility from agricultural systems. Using a retrospective panel data from 482 cassava farmers covering the years 2015–2017, this study examined the effect of value addition on productivity of farmers in the cassava system in Nigeria. We analysed a non-parametric Data Envelopment Analysis to examine productivity across cassava production systems over the three year period. We also examined the impact of value addition on productivity using an endogenous switching regression to account for unobservables that determine the decision to add value and productivity of the farmers. The study found that cost and revenue outlays increased with value addition. Cassava farmers in general operated below the efficiency frontier, with total productivity declining over the 2015–2017 period. However, higher value addition farmers had better efficiency and non-reducing productivity in the periods studied. We found evidence of selection bias in the decision to add value and productivity of the farmers. The conditional and unconditional outcome estimates revealed positive gains in productivity with value addition, confirming the hypothesis that value addition increases farming households’ productivity. We recommend that essential services such as extension services, agricultural training, and ease of enterprise registration that drive agricultural value addition be made available to farmers.

1. Introduction

The practice of subsistence agriculture on marginal lands and low resource utilization is no longer feasible for sustaining farm families [1]. There has therefore arisen the need for the development of farming systems that stems from the need to integrate components and resources of farming families in order to minimize costs and maximize positive outcomes. This development of farming systems is a bid to ensure the sustainability of farmers’ livelihood. Production systems have been shown to develop mainly from different ecologies of production, extent of utilization of product, extent of market access, type of cropping system, as well as extent of diversification of production [2]. Within the cassava production system in Nigeria, distinct production systems have been identified by the type of mixed cropping pattern [3,4]. However, with respect to the analysis of cassava production systems on the basis of the extent of value addition and utilization of cassava biomass, there has been a dearth of information.
The majority of agricultural produce in Nigeria is sold raw and at farm gate, leading to lower returns for the farmers [5]. It is estimated that over 50% of farm produce in the Nigerian agricultural sector is rural based and below commercial value [6]. However, potentials exist for improved returns and income from value addition in the agricultural sector [7], so that creating value has gained prominence in agriculture in recent years. This involves the development of new products and creating remunerative markets for higher value agricultural commodities [8,9]. Value addition is important for raising the livelihood of smallholders in Nigeria [10]. Important concepts and analytical frameworks such as value chains and value webs have developed from the basis of value addition processes within agriculture. Value addition within the cassava system has a great potential because of its multiproduct versatility. The cassava biomass has been shown to be able to develop multimarket, multi-industry, and trade linkages within the Nigerian economy [11]. Hence, the conceptualization of new production systems for a farming household/enterprise from the different means of value addition in the cassava system.
Productivity differences arise within and across production systems in agricultural sectors [12,13]. These differences may be a function of the extent to which farming households decide to utilize the agricultural biomass and integrate with the market. The decision process is, however, determined by access to productive resources, which in turn are determined by other variable factors [14]. The quantity and prices of production inputs and outputs differ according to the extent of value addition that defines the production system adopted by farmers. It is therefore expected that there may be productivity differentials among these production systems. This study hence examines the development of production systems based on the extent of value addition within the cassava system. The aim is to explore productivity differentials, and estimate the impact of value addition within the cassava system in Nigeria.
The benefits of value addition in agriculture have generated a number of literature. In Tanzania, the effect of farmer participation in value addition on food security [15], while [16] studied the welfare effect of wheat value addition on farmers’ welfare using propensity score approach. In Kenya, the welfare impact of banana value addition on the welfare of farmers [17], while [18] explored cassava value addition using gross margin analysis in Nigeria. There is, however, a dearth of literature on productivity differentials as a result of different production systems that develop from value addition in the cassava subsector in Nigeria. This study therefore contributes to literature by first examining total factor productivity differentials across the systems that define value addition in cassava in Nigeria. Subsequently, we model the impact of value addition using an endogenous switching regression model in order to correct for selection bias.
The foregoing raises the following questions: Is there significant difference in the input and output outlay across the value-added cassava production systems in Nigeria? To what extent do productivities differ across the cassava production systems? What is the impact of value addition on the productivity of cassava farmers in Nigeria? This study therefore examines the productivity differentials across the different cassava production systems, with the aim of finding out if value addition and better utilization of cassava leads to overall increased productivity for the farmer. The aim of this paper is to create a scenario to help decision makers in investment in value addition in the cassava system. Although the main decision rests with the farming household itself, extension agents and overseeing ministries can use the results as a benchmark to guide the farmers. Knowledge of potential productivity increases may also be used to access the distance from the frontier and thus guide policy in estimating farm practices and management in terms of their productivities relative to the best practice frontier.

Hypothesis

The hypothesis to be tested is stated as:
Ho: There is no difference in productivity between value adders and non-value adders in the Nigerian cassava system

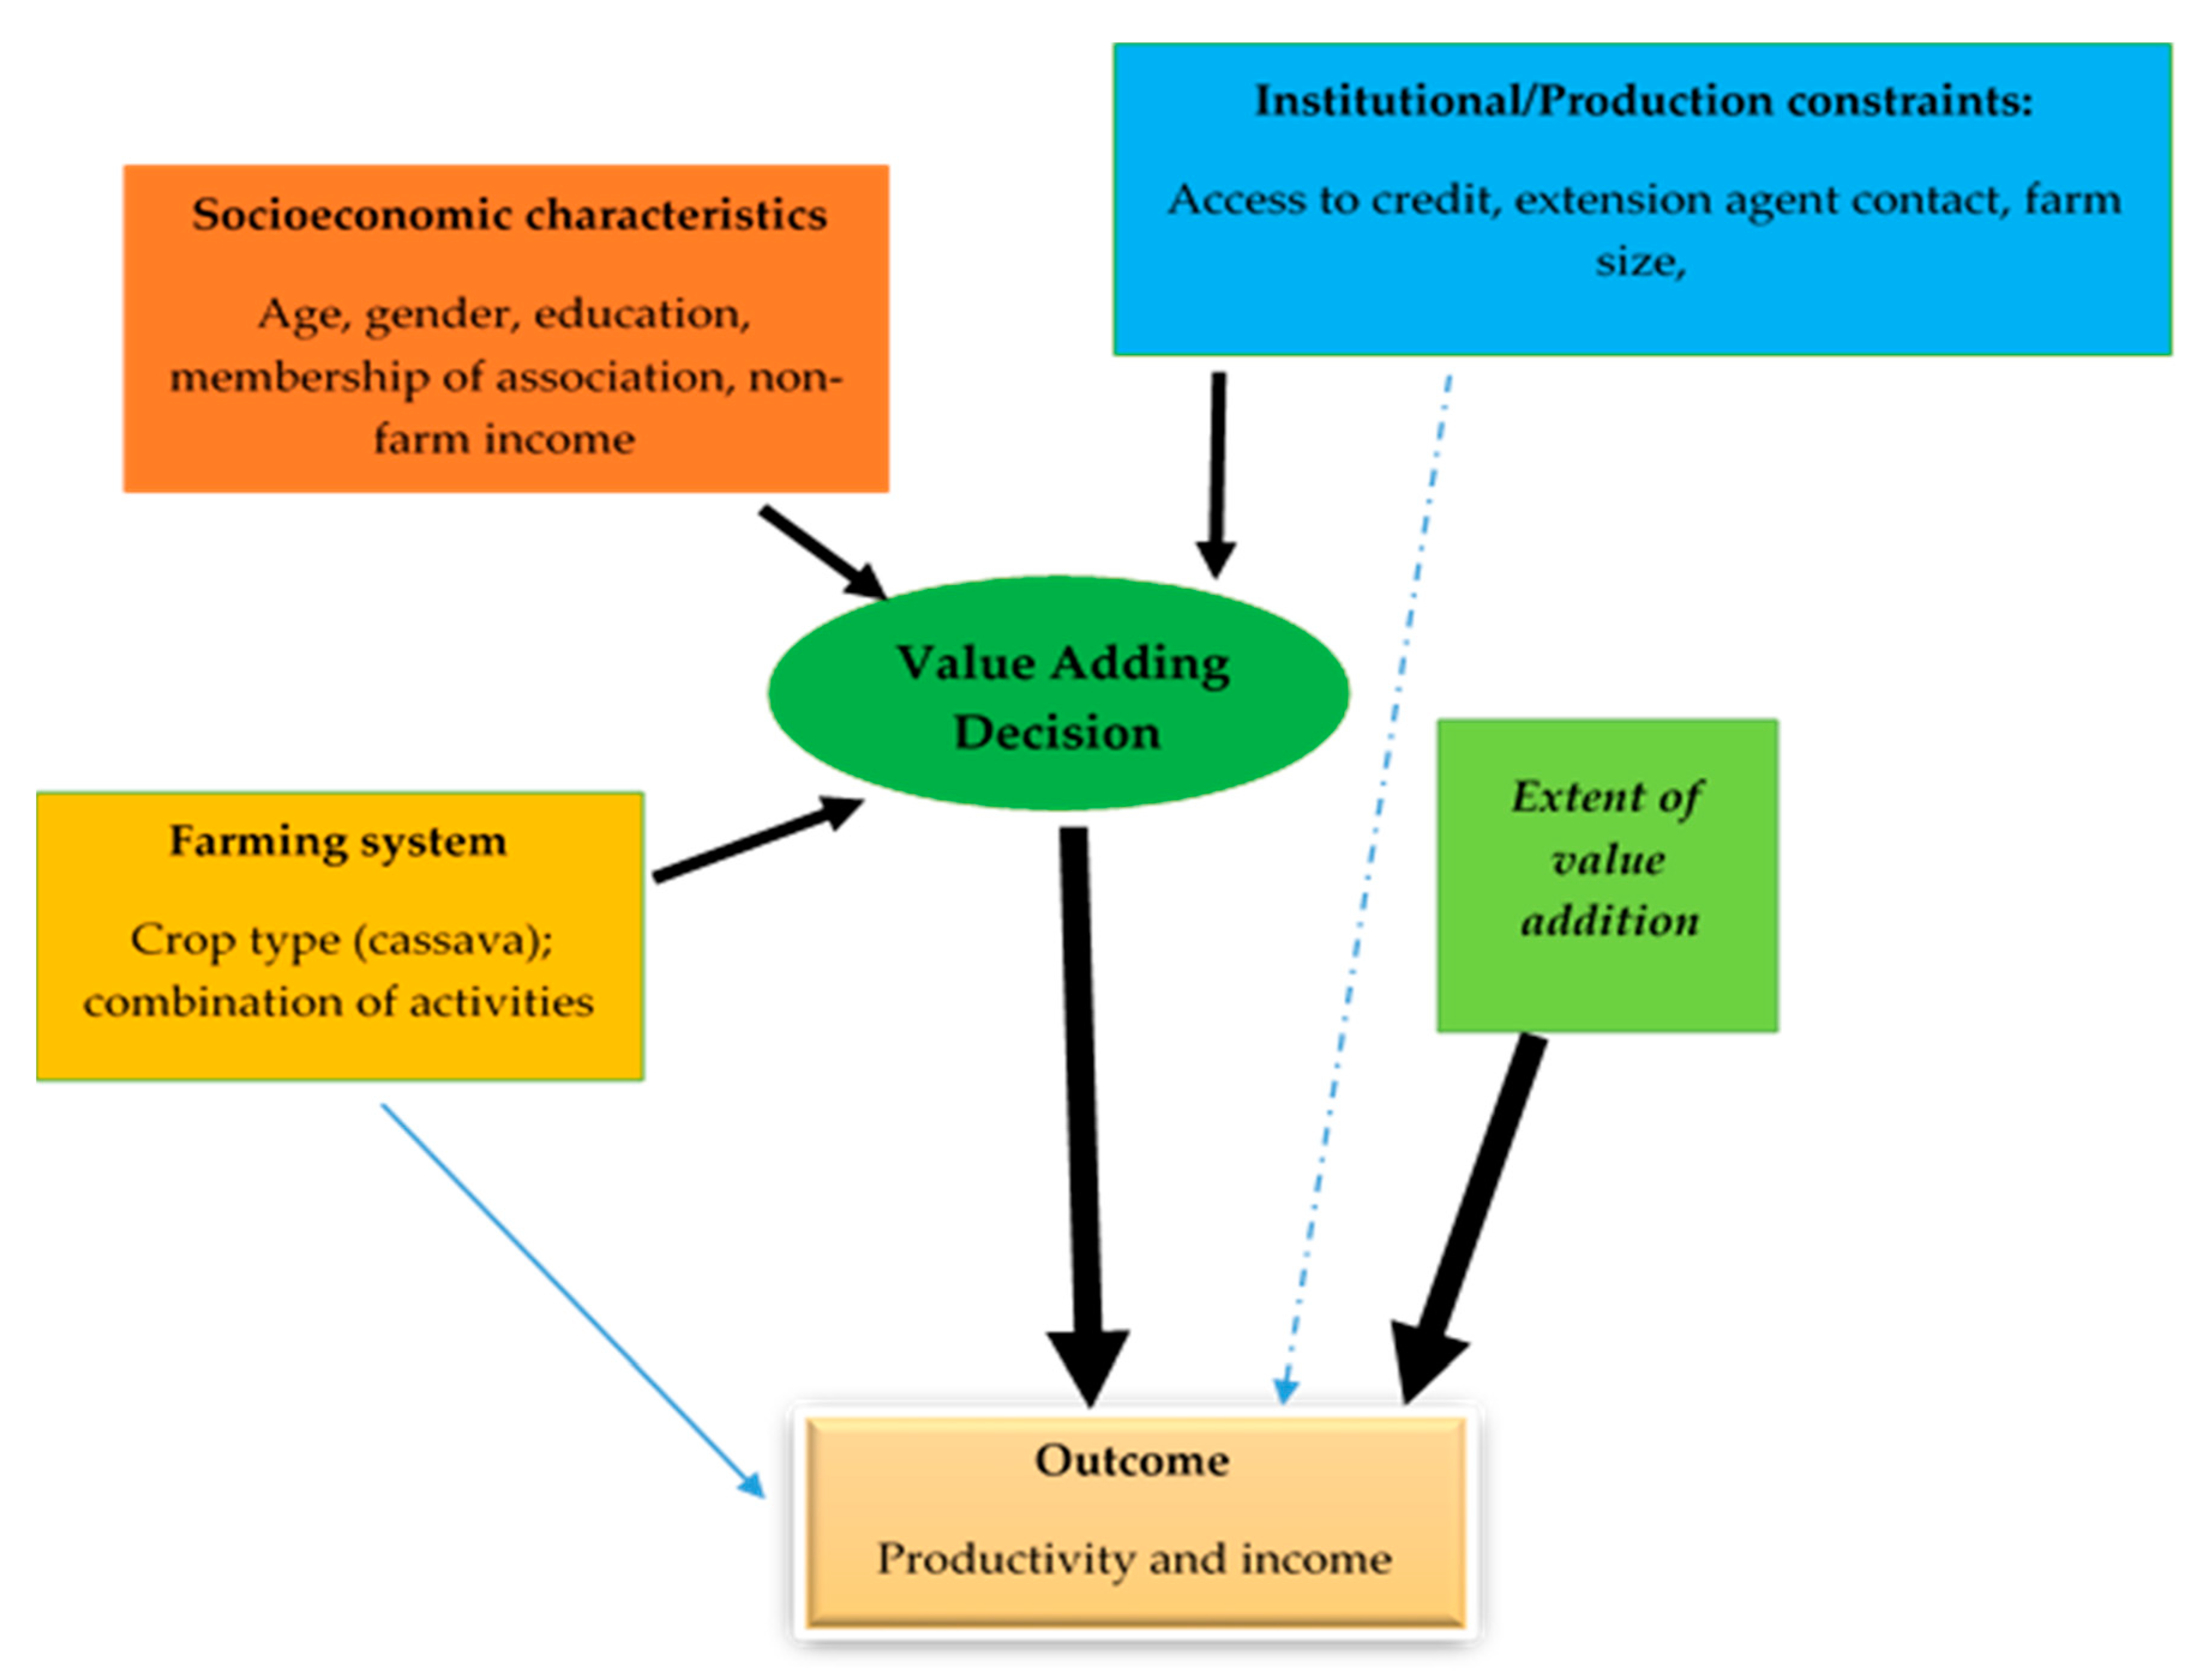
2. Theoretical and Conceptual Framework

2.1. Theoretical Framework

The basis for decision making in agricultural households was modelled by the agricultural household model of [19,20]. In the model, the agricultural household is seen as a production, consumption, and labour entity in a bid to maximize expected utility. According to [21], farming household decisions can be explained in three theoretical models, the peasant profit-maximizing model, utility maximizing theory, and the risk-averse theory. While the profit maximizing theory examines peasant farmers production choices from the point of allocative efficiency of the farming household in the ‘small but efficient’ hypothesis of [22]. The utility maximizing theory explores decision making of the farming household as a family and a business. In effect, it examines how farming households make production and consumption decisions subject to some constraints. The risk-averse theory, on the other hand, encompasses the risk behaviour of the farming households in decision making. The theory is related to the ‘safety first’ model in risk studies.
Although farming household decision could be modelled through any of these three approaches, the theory of profit maximization has been reviewed to give way to the other two theories. The basis of the profit maximization theory rests solely on allocative efficiency, where only the profit outcome is modelled without the input of the farm household decision making process. In reality, this does not work for farming households, hence the need for alternative models where the decision process of the farm family is modelled along with the expected outcome. On this basis, farming households make production decisions, such as value addition, diversification of portfolio, off-farm work, cropping pattern etc. based on either expected utility of consumption/income streams (utility maximization theory) or expected utility in the face of risk as a means of self-preservation (risk-averse theory).
The utility maximization theory was specifically inferred in this study. In the utility maximization household decision-making theory, the farming households are seen as both household and enterprise. Hence, production and consumption (welfare) decisions are subsumed in the model. The theory postulates that households seek to maximize utility subject to a set of constraints. These constraints include income constraints, production constraints, and time constraints. In this paper, we model the household decision to participate in value addition as premised on the need to realize the expected utility of welfare (income from value-added production) subject to these constraints.
The decision of a farm entrepreneur to invest or participate in an economic activity is best described by the Expected Utility Theory [23]. In this theoretical framework, farmers as Decision Making Units (DMU) choose between uncertain prospects by comparing expected utilities from each prospect. The outcomes of these choices will thereafter be seen in improved welfare, income, or productivity. Hence for the present study, the decision to add value within cassava production systems will be realized if and when the expected utility for value adding production is greater than the utility for not adding value in the production systems.
Assume that Ui and Uj are the utility of farmers in the two decision regimes; 1. value adders and 2. non-value adders. The utility is a function of the farmers is given as:
U = f ( X , F , Z )
The linear form of the utility function for farmers in each regime is thus
U i = X i β + F i γ + Z i θ + ε j   and   U j = X j β + F j γ + Z j θ + ε j
where U is the utility maximization function; X is a vector of socioeconomic variables, F denotes farming system characteristics, including crop characteristics; and Z are institutional and production constraints; the error terms are independently identically distributed (iid). The farmer decides to add value if he perceives that the outcome from the expected utility function Ui > Uj, and vice versa. The probability of the farmer’s decision to add value is therefore given by:
P ( U i > U j )
P ( ( X i β i + F i γ i + Z i θ i + ε i ) > X j β j + F j γ j + Z j θ j + ε j ) )
P ( ( X i β i + F i γ i + Z i θ i + ε i ) X j β j + F j γ j + Z j θ j + ε j ) ) > 0
P ( ( X i β i + F i γ i + Z i θ i ) ( X j β j + F j γ j + Z j θ j ) + ( ε i ε j ) > 0
where β, λ, and θ are parameter estimates of independent variables. P is a probability function, which can be estimated from a variety of quantitative choice models. The outcome of the utility function in this study is the productivity of the cassava farmers, which was estimated from the non-parametric Data Envelopment Analysis (DEA).

2.2. The Nexus of Value Addition and Productivity

The conceptual framework in this study examines the relationship between the decision of cassava farmers to add value and the consequent outcome of such a decision (see Figure 1). The decision to add value within their cassava production system is determined by a number of variables. On the one hand, these variables influence the productivity of farmers; however, we are interested in how these variable determine productivity through value addition as an intervening factor. These variables include the socioeconomic characteristics of the farmer; institutional and macroeconomic environment in which the farmer is operating; crop characteristics; and the initial goal of the farming enterprise. The farmers’ socioeconomic characteristics include age, gender, education, and years of experience. These factors may be inherited, or influenced by other external forces, and they dictate the responsibilities of farmers within their productive systems. Institutional and production constraints define the environment within which farmers carry out their productive activities. These include access to credit, extension contact, and macroeconomic policies which serve as catalyst to the enterprise development of the farmers. Farming system/crop characteristics determine to a large extent how much value addition can be carried out. In this study, the versatility of cassava biomass increases its value adding potential. Overall, it is expected that the decision to add value and the extent of value addition will lead to positive outcomes (such as income and productivity).

3. Materials and Method

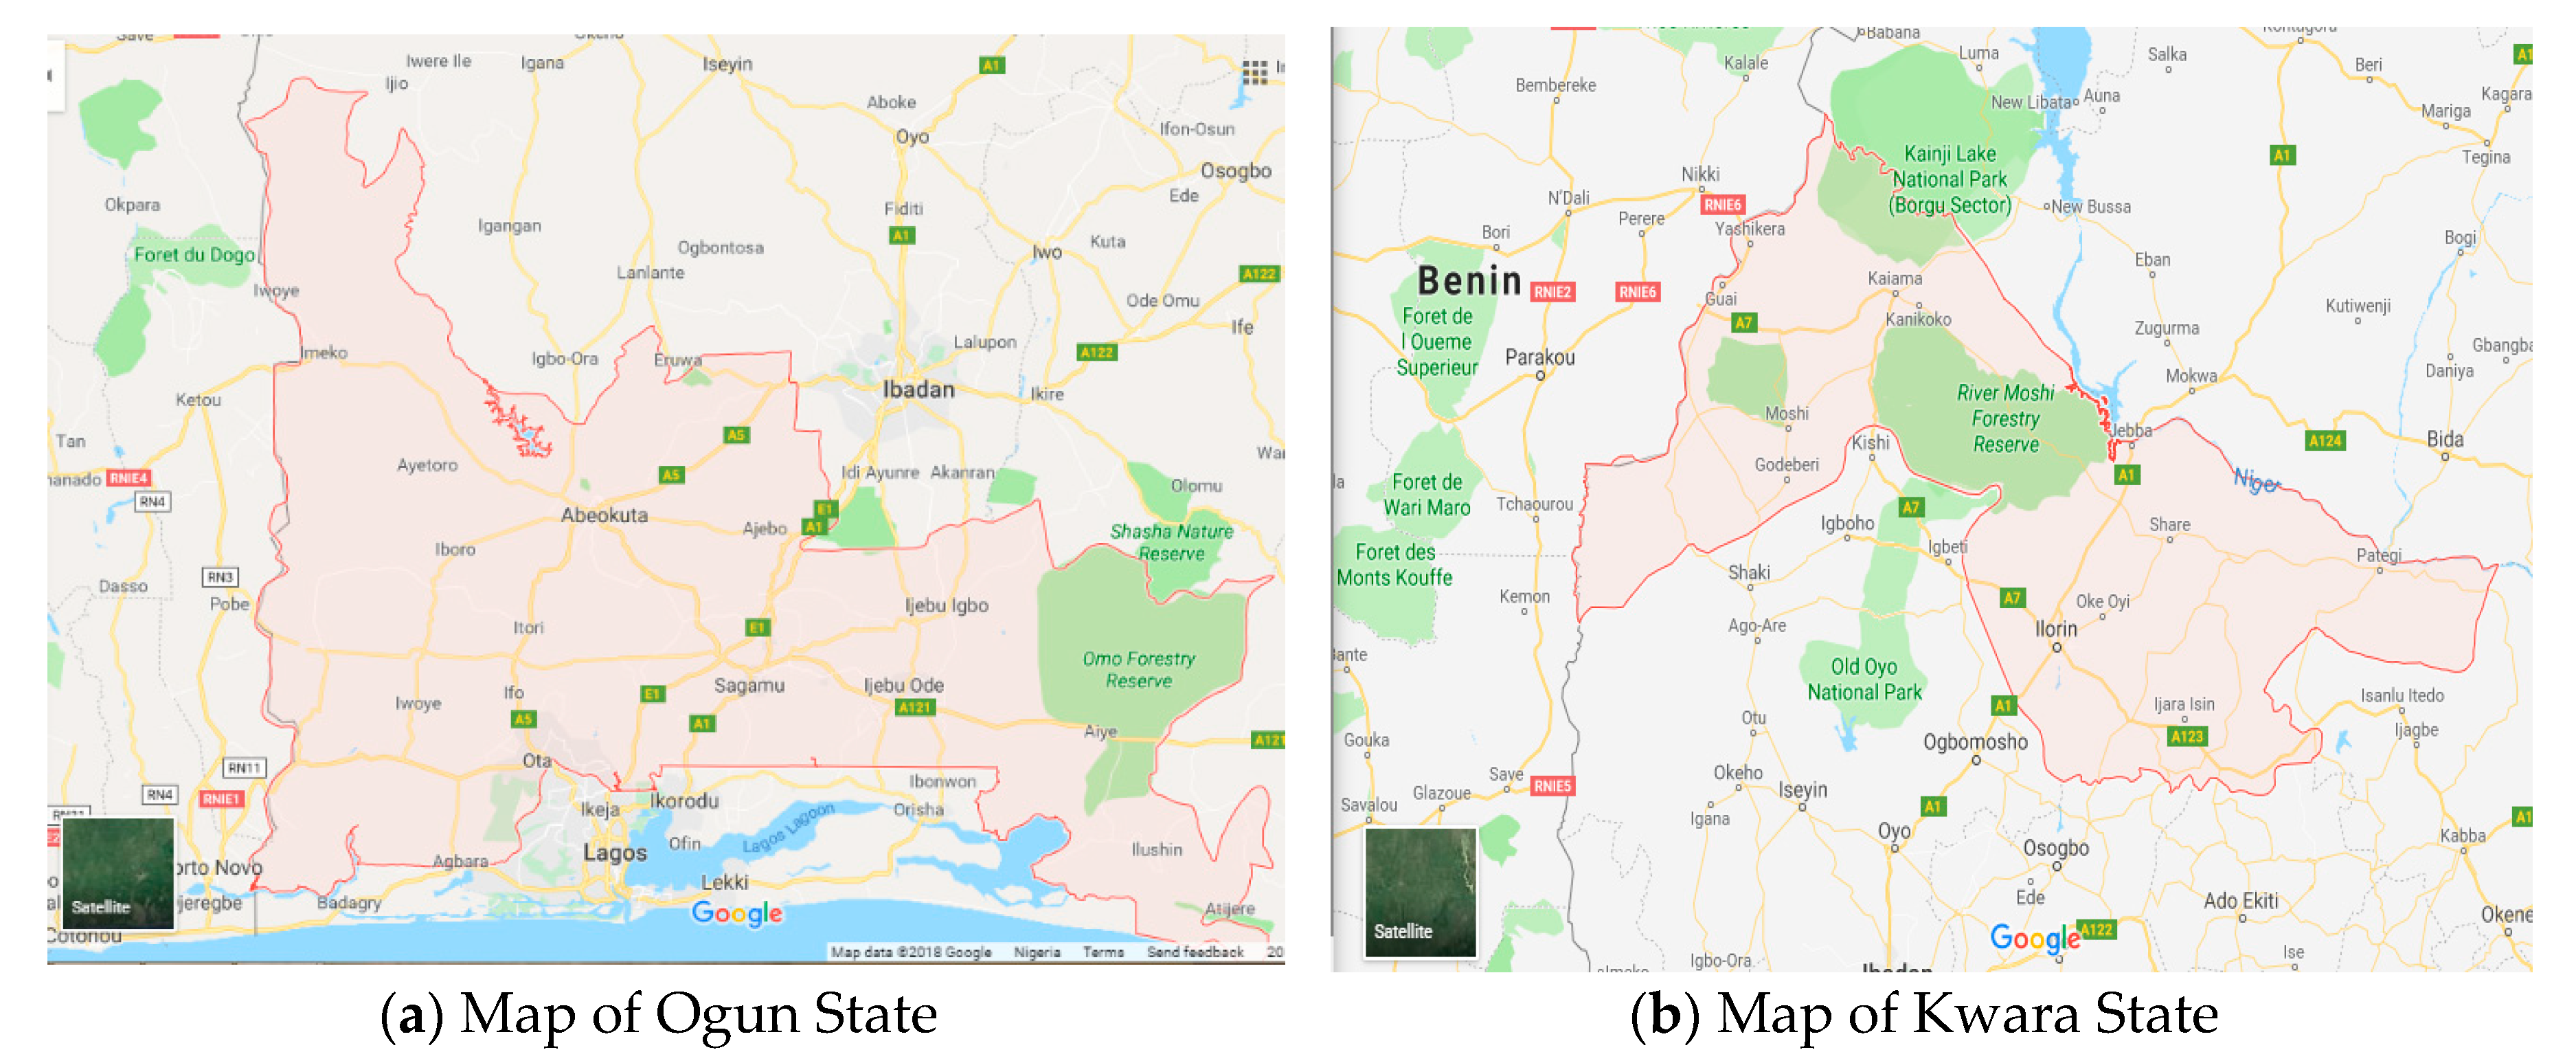
3.1. Study Area and Sampling Procedure

The study area is Nigeria. Cassava is produced in almost all the states in Nigeria, although the main producing zones are the forest sand guinea savannah zones [24,25]. The guinea savannah belt consists of Kogi, Kwara, Benue, Taraba, Kaduna states while the rain forest zone includes Delta, Edo, Ebonyi, Anambra, Oyo, Ogun, among others. We, however, selected Ogun and Kwara states to represent the forest and guinea savannah zones in this study (see Figure 2 for the maps of the study states).
Following this, a three-stage stratified random sampling was employed to select the respondents. First, four local government areas (LGAs) corresponding to Agricultural Development Zones (ADZs) were randomly selected from each state. These LGAs are known for substantial cassava production, processing, and marketing activities. In the second stage, enumeration areas were selected from each LGA proportionate to the number of EA’s in each LGA. The last stage was a random selection of cassava farmers from each enumeration area. Farmers were classified into four groups of sole producer (SP); producer/processor (PP); producer/marketer (PM); and producer/processor/marketer (PPM). As a result, the basis of analysis is the cassava farmer at different levels of value addition. Overall, a sample of 500 farming households was interviewed, but 482 (96.4%) questionnaires were useful for the analysis after data cleaning. The distribution of the respondents across the production systems were 192 (39.8%), 199 (41.29%), 42 (8.71%), and 49 (10.17%) for SP, PP, PM, and PPM respectively.

3.2. Description of Productivity Variables

We collected information using structured questionnaires on socioeconomic characteristics of the farmers such as age, marital status, gender, household size, education, and type of productive activities. Information on input and output outlay across the systems were also collected. In order to estimate the productivity changes across the systems, the information on production was collected over a period of three years (2015, 2016, and 2017). Thus, we have a retrospective panel production data, which proves useful in the absence of resources to gather information over the three year period [26,27]. The use of panel data, in this case, is important in order to capture the dynamics of productivity changes across the farmer group, and hence generate more accurate inferences [28].
Since each productive system had different types of input and output requirements, it became necessary to find a way to get a common value for the outputs in order to ensure accurate comparison across the farming systems. We used the monetary values of the output realized from the productive activities of the cassava actors. This was important in order to bring the output to the same level. The input outlay was also measured in monetary terms and discussed subsequently.
Labour cost was the cost incurred for hired labour across all the production system plus the opportunity cost of unpaid family labour, valued as the cost of hired labour. Apart from the similar labour characteristics for on-farm cassava production, additional labour costs are incurred for value addition. The variable for seed was assumed to be the raw material for production across the systems. It therefore include the price of stem cuttings for SP only, cassava tubers for the processing systems, and marketable biomass (raw tubers or finished products) for those involved in marketing.
Value addition involved mainly processing; thus we included the variable ’power’, which includes every kind of source of generation of power on the farmers’ resource base. Hence, we included the cost of electricity, fuel for machines, and wood and other traditional fuels for processing. Marketing functions also included the use of power, especially electricity and fuel for generating sets that would power storage functions. A minimum estimate of household electricity consumption was used for SP who were not involved in value addition. The fourth input used is transportation. We assumed that transportation cuts across all systems. SP farmers incur costs for their productive activities (such as transportation to and from farms). Also, the costs of transportation includes the costs incurred in obtaining and delivering raw materials and finished good for the value addition groups.

3.3. Data Analysis

i. Total Factor Productivity (TFP) across Cassava Production Systems in Nigeria
The TFP index measures productivity by comparing the observed outputs in periods 1 and 2 with the maximum level of outputs that can be produced using the inputs x1 and x2 under a reference technology. Specifically, the study made use of the Malmquist TFP index [29], which uses a radial distance of the observed outputs and inputs in the three periods with respect to a reference technology (the year 2015). The distance measure could either be input orientated or output orientated. Input distance orientation seeks to minimize the quantity of inputs used to obtain the desired output, while the output orientation seeks to maximize output levels given a vector of inputs. The results of the input and output orientation are synonymous, however, this study made use of the input orientated Malmquist TFP index.
Input Orientated Malmquist TFP Index
The input orientated index examines how levels of inputs, x1 and x2, that can be used to produce the observed levels of outputs, y1 and y2, relative to the reference technology. Using 2015 as the reference technology, the index for each of the other two years (2016 and 2017) with respect to the reference year is given as:
m i 1 ( y 1 , x 1 , y 2 , x 2 ) = d i 1 ( y 2 , x 2 ) d i 1 ( y 1 , x 1 )
Assume that there is technical efficiency in both periods, i.e., d i 1 ( y 1 x 1 ) = 1 , then
m i 1 ( y 1 , x 1 , y 2 , x 2 ) = d i 1 ( y 2 , x 2 )
This can be similarly done if the reference technology is period 2. Therefore, the input orientated Malmquist index is:
m i ( y 1 , x 1 , y 2 , x 2 ) = { m i 1 ( y 1 , x 1 , y 2 , x 2 ) · m i 2 ( y 1 , x 1 , y 2 , x 2 ) } 0.5
The above is a measure of productivity growth when technical efficiency is assumed in the two periods. However, if there is technical inefficiency, which is the most probable case, the observed productivity change can be given as follows:
m i ( y 1 , x 1 , y 2 , x 2 ) = d i 2 ( y 2 , x 2 ) d i 1 ( y 1 , x 1 ) [ d i 1 ( y 2 , x 2 ) d i 2 ( y 2 , x 2 ) × d i 1 ( y 1 , x 1 ) d i 2 ( y 1 , x 1 ) ] 0.5
Equation (4) comprises two ratios: The ratio outside the bracket is the measure of Efficiency change, while the ratio in the brackets is that of the technical change.
It is important to note that the Malmquist TFP index was composed of the following:
  • Input distance measure
  • Constant returns to scale
Estimation of four productivity measures of technical change, price change, scale efficiency change, and total factor productivity change.
Estimation of productivity can be done either by a parametric or non-parametric approach. The parametric measure, which includes the Stochastic Frontier Analysis, involves fitting an appropriate functional form for the estimation. However, the non-parametric estimation does not require fitting a functional form. The most popular non-parametric measure is the Data Envelopment Analysis (DEA) which was used in this study.
Data envelopment analysis (DEA) has been assessed as a tool for the determinants of efficiency measures even with multi-outputs and multi-inputs scenarios. DEA is able to produce efficiency measures for each observational unit. It is also able to provide measures of productivity changes across time periods. The strengths of the non-parametric measure of DEA include the ability to estimate models without having to specify a functional form, estimate models with insufficient degrees of freedom, overcome extreme variability within the data, as well as determine productivity estimates from purely quantity data. However, it is easily affected by outliers and there is no statistical inference to be made to determine the significance of the results [30,31]. This study therefore used the DEA-Malmquist productivity measure to assess the productivity of cassava production systems over the 2015–2017 period in Nigeria. We estimated the DEA productivity measure for each production system in order to explore system-specific measures. We also estimated the productivity for the pooled data.
Since this study compared input and output outlays across different production systems, the possibilities of obtaining zero values increases. The systems had differing physical input and output outlay, which would have led to missing data when they were combined for the productivity comparison. Upholding the assumption of positivity and non-zero input/output outlay [32,33] would have meant a reduction in sample size if observations with zero values were deleted. The use of appropriate data preparation and modification of the DEA model could, however, help solve this problem. In order to successfully compare productivity across the systems, we followed the proposition of [34] in preparing the data for the DEA analysis in ensuring measurable values across groups and maintaining the positivity assumption. Therefore, the monetary values of all inputs and output outlay in the production processes were used. Specifically, the assumption of positivity was upheld across all the observations by using minimum transactional values which would have no effect on the overall efficiency outlay.
We estimated the DEA productivity measure for each of the production system, as well as for the pooled data. The DEA Malmquist measure gave the following estimates
(i)
Efficiency change;
(ii)
Technical change;
(iii)
Pure technical efficiency change(corresponding to the VRS efficiency measure);
(iv)
Scale efficiency change; and
(v)
Total Factor productivity change.
The efficiency change being estimated is equivalent to the ratio of the Farell technical efficiency in period 2 to the Farell technical efficiency in period 1 [35]. This efficiency change is based on the assumption of a Constant Returns to Scale (CRS) technology of production. The technical change is the geometric mean of the shift in technology between two periods. A value greater than 1 implies a technical progress from period 1 to 2. Pure technical efficiency change is measured from the variable returns to scale technology. Scale efficiency change measures the change in productivity from a change in the scale of production and their movement towards the technologically optimum scale between two time periods. It is a measure of losses as a result of sub-optimal production size. A value greater than 1 means that the farm is nearer the optimum scale of technology in the period under consideration as opposed to the reference period.
ii. Estimating the Impact of Value Addition on Productivity of Cassava Households
Past studies that examined productivity differentials have estimated differences in productivity by specifying production functions and comparing efficiency measures for each of the different choice regimes [36]. However, households’ decision to participate in any extra investment such as value addition is an endogenous one [37,38]. This is because the decision to participate in value addition is necessarily voluntary, hence the decision to add value and the consequent level of productivity may be affected by inherent factors such as skills, experience, and innovation, which may, therefore, lead to the problem of selectivity bias. Therefore, if, for example, the cassava farmers have obtained additional skills or invested in more capital to increase their production, then their productivity is likely to increase whether or not they are involved in value addition. Hence, we cannot infer that value addition alone has led to an increase in his productivity. One of the best ways to deal with this problem is fitting a simultaneous equation model. Estimating a pooled econometric regression of both decision regimes assumes that similar explanatory variables have the same impact on the two groups, and the average effect of a value adding decision is for the whole sample [39]. This may, however, not be feasible. Moreover, an Ordinary Least Square (OLS) estimation will give consistent estimates only if the error terms are independent; if not, the estimates will be biased and it becomes important to use models that deal with the endogeneity in the data [40]. This is the basis for the use of an endogenous switching regression model. Endogenous switching regression models helps to model the counterfactual impact of choice regimes when the issue of selectivity bias arises. This is especially important with the non-random assignment of respondents in observational studies to the different choice regimes [41].
In this study, we attempted to model the expected outcomes of value addition on the productivity of cassava farmers in Nigeria. Productivity, as defined earlier, is the total revenue from the productive activities (either value adding or non-value adding) within the cassava system. First, we determine the two counterfactual regimes in our study as 0 for non-value adders and 1 for value adders. For simplicity, we merge the farmers who add value at any capacity as ‘value adders’ and those who do not as ‘non-value adders’. For our sample, the non-value adders are the farmers in the sole producer (SP) production system. They are assumed not to add value in terms of processing or marketing to their cassava system. The value adders are those in the other three production systems (PP, PM, and PPM). The model follows that of [42,43,44,45].
Let di denote the latent variable that determines the value adding decision of farmers, with 1 = households in regime 1 (value adders) and 0 = households in regime 2 (non-value adders). We used the following index function to describe di as:
d i * = ω Z i + μ i ;
d i = 1   i f   d i * > 0
d i = 0   i f   d i * 0
The respondents have two possible outcomes dependent on the choice regime they belong, so that:
y 1 i = β 1 X 1 I + v 1 i       i f   d i = 1
y 2 i = β 2 i X 2 i + v 2 i       i f   d i = 0
The yji are the outcome variables of the continuous equations; Zi, X1, and X2 are vectors of weakly exogenous characteristics; β1, β2, and ω are vectors of parameters to be estimated. We also assume that the three error terms are trivariate normal, with mean zero and a covariance matrix [39].
[ σ μ 2 . . σ 21 σ 1 2 . σ 31 . σ 2 2 ]
where σ μ is the variance of error in the selection equation; while σ 1 2   and   σ 2 2 are variances of error in the outcome (continuous) equation. Also, σ 21   and   σ 31 are the covariances of µi and ν1i, and µi and ν2i, respectively. The covariance between ν1i and ν1i is not defined since in the counterfactual, we cannot observe both y1i and y2i at the same time.
The model above is an endogenous switching regression, in which the error term of the selection equation is correlated with the error terms in the outcome equation. The model could be estimated using a two-step approach or a maximum likelihood approach [42,44,46]. However, following [43], the model can be efficiently estimated with a single step Full Information Maximum Likelihood (FIML) estimation procedure. This study therefore used the user-written ‘movestay’ command on stata 14 to estimate the FIML following studies of [37,44]. The FIML simultaneously estimates the selection and outcome equation in one step, in order to yield consistent estimates of the standard errors. The FIML model proposed by [43] and used for this study is presented as follows:
l n L i = i = 1 { I i w i [ ln ( F ( η 1 i ) + ln ( f ( ν 1 i σ 1 ) σ 1 ) + ( 1 I i ) w i [ ln ( 1 F ( η 2 i ) ) + ln ( f ( ν 2 i σ 2 / σ 2 ) ) ] ] }
where   η j i = ω Z I + ρ j ν j i   / σ j 1 ρ j 2 ,    f o r   j = 1 , 2
With rho( ρ ) being the correlation coefficient between the two error terms; such that ρ 1 = σ 21 2 σ μ σ 1 and ρ 2 = σ 31 2 σ μ σ 2 are the correlation coefficients between ν1 and µ, and ν2 and µ, respectively.
The signs and significance of rho ( ρ ) have economic interpretations. When rho is significant, then there is evidence of endogenous switching which would then result in selection bias. Also, when ρ 1 and ρ 2 have alternate signs, the decision for each regime is based on comparative advantage [45], while it indicates hierarchical sorting if they have the same signs [37,38]. Once the parameters have been estimated, both conditional and unconditional potential outcomes can be determined. The Unconditional estimates are:
E ( y 1 | x i ) = X 1 i β 1 i
E ( y 0 | x i ) = X 0 i   β 0 i
Hence, the population Average treatment effect;
( ATE ) = E ( y 1 i y 0 i | X i )
The conditional parameter estimates are:
  • Potential outcome of farmers who are value adders and self-select into value adder groups
    E ( y 1 i | x i , d = 1 ) = X 1 i β 1 i + σ 1 ρ 1 f ( ω Z i ) / F ( ω Z i )
  • Potential outcomes of non- value adders who self-self into non-value adder groups.
    E ( y 2 i | x i , d = 0 ) = X 2 i β 1 σ 2 ρ 2 f ( ω Z i ) / ( 1 F ( ω Z i ) )
  • Potential outcomes of value adders if they were non-value adders
    E ( y 1 i | x i , d = 0 ) = X 1 i β 1 σ 1 ρ 1 f ( ω Z i ) / ( 1 F ( ω Z i ) )
Potential outcomes of non-value adders had they been value adders
E ( y 2 i | x i , d = 1 ) = X 2 i β 1 + σ 2 ρ 2 f ( ω Z i ) / F ( ω Z i )
The conditional outcomes are particularly important in this study. We are able to derive the Average Treatment Effect on the Treated (ATT) which is the impact of value addition on the outcome of value adders. The ATT is the difference in the potential outcome of value adders who self- select into value adder groups and the outcome of value adders had they been non-value adders.
ATT = E ( y 1 i y 2 i       | d = 1 ) = X i ( β 1 β 2 ) + ( σ 1 μ σ 2 μ ) ω 1
A similar model, but not used in this study, is the ‘etregress’ function in Stata for the estimation of a FIML of the Endogenous Switching Regression Model (ESRM). The ‘etgress’ models a linear regression model for the outcome variable and then a constrained normal distribution function in order to correct for the bias that arises from the deviation from the conditional independence assumption in the causal effect estimation procedure [47].

4. Results and Discussion

4.1. Summary Characteristics of Farmers across Cassava Production Systems

In this section, we present the results of the socioeconomic and production characteristics across the different production systems of cassava in the country. Table 1 shows that overall, there are more males (73.39%) than females (26.61%) in the cassava system. However, while SP were mostly male (91%), value addition systems (PP, PM, and PPM) had more female members among them. The overall average age of owners of enterprise was 47 years, with the oldest (about 53 years) and the youngest (about 46 years) in the PM and PP systems, respectively. Household size significantly differed across the system; averaging 7 members; except for PM households with 10 members.
There was no significant difference across the systems in terms of years of education which averaged 7 years. There were however significant differences in the number of years of experience with a mean of 17 years across the farmers. Farmers in the SP system had the highest number of years of experience at 21 years, while the PP farmers had the least at 17 years. This may be indicative of the preponderance of younger generation farmers in value addition system.
Significant differences were seen with land area holding across the systems. The average land area was 2.4 ha across the systems; however PM production system had significantly higher land area (4.43 ha), and the PP system had the least (1.85 ha). There was a general low proportion of farmers with agricultural training (24%), although up to 31% of owners in the PP systems received agricultural training and not more than 12% of the PM received agricultural training. Access to credit was generally low across the systems, however PPM system farmers had higher access to credit (about 40%) than the other groups. Registration of agricultural enterprise was extremely low across the systems (1.7%), however registration was highest (4.4%) among PPM farmers, while none of the PP farmers had registered their enterprise.
Furthermore, there was a low level of contact with extension agents (26.9%) across the production systems. However, farmers who added values at any of the levels had higher contact with extension agents, with about 37% of the PPM having extension contact. This may signify some form of endogeneity with respect to revenue generation from the systems. Although there was no significant difference in terms of membership of social group, only about 39% of the farmers had social group characteristics. Social group characteristics was however highest among the PPM (55%) and lowest among the SP (36%) farmers.

4.2. Summary Statistics of Costs and Returns across Cassava Production Systems in Nigeria

The summary of variables used to measure productivity is presented in Table 2. The pooled summary showed an increase in output revenue among the cassava farmers. However, it was noted that while labour costs reduced over the years, costs of other variable inputs (seed, power, and transport) increased. The reduction in labour cost may be as a result of increasing use of improved technologies of production across the systems. The increase in seed costs may be the result of increase production expansion and/or utilization of cassava as a result of increased awareness of its usefulness. The increase in power costs is not unconnected on the one hand to an increase in electricity tariffs and petroleum products in the course of the three periods. Transportation costs generally increased in Nigeria when prices of petrol rises; which has been the case in Nigeria in the past years since 2015.
The result in Table 2 also shows that the highest cost outlay came from the PM, followed by the PPM production system. However, the PM also had the highest revenue outlay, also followed by the PPM system. This shows the importance of access to market in agricultural systems. Access to market ensures that the farmers get remunerative prices for their produce. Although value additions in terms of transportation, storage, and communications may increase costs when compared to the other systems, the revenue is also highly significant enough. This reinforces the claims that value additions in terms of processing and marketing are important in raising the productivity of farming systems [10,18]. These significant differences in output and costs outlay already shows that there are differences in the production dynamics across the systems. This further forms an empirical basis for examining productivity differentials across the systems.

4.3. Productivity Measures across Cassava Production Systems

The Malmquist total factor productivity measure was estimated from the linear programming Data Envelopment Analysis, with the assumption of constant returns to scale and input orientation. First, we present efficiency as a measure of the productivity of the cassava farmers. Then we present the result of productivity changes across the systems for the periods under review.
The result of the mean technical efficiencies across the systems and for the pooled data is presented in Table 3. The result presents the mean technical efficiencies for the three time periods (2015, 2016, and 2017) for constant returns to scale and variable returns to scale. The results shows mean technical efficiencies of 73.3%, 71.8%, and 71.6% for the period 2015, 2016, and 2017, respectively. This shows that when compared to the reference group (a cassava farmer on the frontier), the sampled farmers have a 27.7%, 28.1%, and 28.4% chance of being on the best option frontier, that is, of increasing their output with the existing inputs for the respective years. The results also imply there was a decline in efficiency from the reference period (2015) to the other periods (2016, 2017). This follows the general decline in value added for agriculture in Nigeria which has had a growth rate of less than 1% over the years, with cassava production significantly less than the estimated potential for the country [6].
With respect to the different systems however, we see a decline in technical efficiency from 2015–2016 across the SP, PP, and PM systems. There was, however, an observed increase in mean technical efficiency between 2016 and 2017. For the PPM system, however, we found a steady increase in technical efficiency of 89.4%, 89.5%, and 91.1% for each of the three years respectively. This indicates that increased value addition through processing and marketing has the tendency to increase revenue and overall productivity of actors.

4.4. Productivity Growth across Cassava Production Systems

In addition to providing the technical efficiencies across the time periods, the Malmquist DEA also gave measures of changes in some productivity indices across the systems over the years. The results displayed in Table 4 gives the measures of technical change, scale efficiency change, perfect technical change, and total factor productivity change. When observed across the four production systems, we found that in 2016, only technical change increased across all the systems. This suggests that there was an improvement in technology use between 2015 and 2016 within cassava production systems in Nigeria. However, there was a general decline in scale efficiency across the system, implying that there was little in terms of scaling up among the cassava farmers between 2015 and 2016. Perfect technical efficiency measure using a Variable Returns to Scale (VRS) technology frontier improved only with SP and PPM production systems, while efficiency change improved only with PPM. Total factor productivity increased across all the systems, except for the PM system. The highest productivity change was found in the PPM system.
In 2017, we observed an improvement in technical efficiency across the four systems, and the extent of improvement was highest among the PPM system. Also, scale efficiency change was positive for all production system and highest among the PPM. Perfect technical efficiency improved in all the production systems except for the SP. Total factor productivity was however found to have declined between 2015 and 2017. A plausible reason for this may be the decline in agricultural production generally as a result of conflicts and other risks within these periods in Nigeria. Moreover, inflation rose to an all-time high of 16% in 2017 as compared to the previous periods under study. This led to a general increase in costs of production while reducing the purchasing power of consumers.
From the pooled results, we observed a positive growth in total factor productivity between 2015 and 2016. However, when compared to 2015, there was a decline in total factor productivity in 2017 by 0.024. There was, however, positive scale efficiency growth among all the farmers. All the components of total factor productive also showed a decline. Therefore, we can assert that there is a decline in total factor productivity in Nigeria within the cassava system.
The above results show that there exist differences in productivity levels across the systems of cassava production. However, no causal inference can yet be made with regards to the impact of value addition within the systems. The differences shown also indicate evidence of selectivity bias in the sample. Value addition and better productivity could be the result of some intrinsic characteristics of the farmer that enhances the decision to invest in value added activities and get better returns than their counterparts.
As a result of this, we resort to the use of an endogenous switching model to estimate causal effect of value addition in the cassava system. This is expected to provide the exact extent of productivity differential with value addition without bias.

4.5. Productivity Impact of Value Addition across Cassava Production Systems

The descriptive analysis and productivity measures have shown that there are differences in productivity outcomes for the different systems (value addition/non-value addition) in the cassava system. However, to estimate a proper impact of value addition on productivity, an impact assessment needed to be carried out. As a result of assumed inherent endogeneity in the model, we used the endogenous switching regression procedure of [42] to model the outcome of value addition in cassava system on the output of cassava farmers in the study area. In the switching regression model, the variables that are contained in the covariates Xi for the outcome variable may overlap with that of the selection model, Zi. There must, however, be some variables that identify Zi separately from Xi [42,45]. These variables are said to determine the outcome equation only through the selection model [44]. The productivity equation is jointly estimated with the selection equation that determines value addition among the farmers.
The result of the FIML estimates is given in Table 5. First, given the significant LR test shown in the table, we are able to reject the null hypothesis of no correlation between the unobservables that determine the treatment and the outcome. Hence, a justification for the use of an endogenous switching regression model. Using an OLS regression to model the impact in this case would, therefore, have given biased estimates, and thus the need for a switching regression. The coefficient of rho for the two regimes have alternate and significant signs, implying that self-selection occurred in the value addition decision for the farmers [43]. While it is positive and significant for farmers that are value adders, it was negative and significant for the non-value adders. This suggests that the decision to add value is based on comparative advantage. This is consistent with studies of [37,45], where comparative advantage was found as the basis for adopting technology and nonfarm activities respectively.
The significance of the coefficient of rho for value adders imply that there may be unobservables that tend to lead to higher productivity rather than just adding value to cassava. Furthermore, the difference between ln sigma1 and ln sigma2 is positive suggesting that there is positive gain from value addition among farmers in the cassava system.
In the second column, we have the estimates of the joint Probit model in the joint estimation. The coefficient of gender of the farmer shows that the probability of value addition reduces for being male. This may be indicative of the socio-cultural attachment of women to agricultural value addition in general and within the cassava system in particular [48,49]. An increase in the land area available to the farmer was found to increase value addition in cassava. Land area is most times proportional to higher production in many rural systems, thus there is ample harvest that needs to be sold immediately or processed. Value addition leads to an increase in life span (processing) and better sales (marketing services) and thus may be a better option than waiting on farm-gate sales [50,51].
Farmer’s level of education was found to reduce the probability of adding value within the cassava system. This may be surprising in the light of empirical evidence on the importance of education in adopting innovation. However, [52] showed that the impact of education on agriculture may not be a direct effect on the farm family. In fact, he was able to show that with increased education and more formal skills, individuals tend to explore work option in the non-farm sector. There is alsoevidence of an inverse relationship between formal education and farmers’ adoption of innovative processes [53]. The coefficient of agricultural training however showed that agricultural training increased the probability of farmers being involved in value addition. Although the descriptive shows that a smaller proportion of the farmers have agricultural training, we find that training is important in changing production perspective of the agricultural households towards a better frontier than was previously operated on [54,55]. Access to agricultural extension was found to equally be significant in increasing the likelihood of farmers to add value to their cassava products. Farmers that have access to adequate extension services have been found to be exposed to innovation that changed their perception and increased their knowledge in value addition [56,57].
Our results found that years of experience reduced the probability of adding value among the cassava farmers. This may be connected with the fact that ideas and practices that have been set in production practices over the years become harder to change with proficiency in the field and especially as the farmer grows older. Also, value addition may be considered risky and labour intensive, for which older and experienced farmers have been reported to shy away from such [58,59]. This, however, contrasts with the study of [60], where more experience farmers adopted improved technology. Married farmers were also more likely to add value than single farmers in the sample. This suggests the need for additional income for bigger household size for married individuals.
Registration status of farmers’ enterprise was positively linked to value addition. While registration per se does not affect productivity, it affords the farmers access to certain market-based innovation and interventions such as insurance, credit, and subsidies that would be given only to farmers who can be tracked by their registration status [61], which could have been made possible with proper registration, the impact of which may be lower productivity.
The higher the level of utilisation of cassava within a farmer’s cassava field also led to a higher probability of adding value for income generation. For example, [62] showed the utilization pathway for agricultural waste leads to increased value addition and reduction in environmental pollution.
The revenue/productivity equation is presented in the third column of Table 5. The estimates are presented separately for the value adders and non-value adders. The results show that the estimated log of output for value adders increased significantly for being a male farmer and with access to extension for the value adding farmers. The estimates of the gender of the farmer is consistent with agricultural productivity literature which shows that male-headed farming households had better productivity than their female counterparts [63,64]. This finding is synonymous with several gender related literature in productivity, where women’s lack of access to productive resources meant that they had significantly lower productivities than men [65]. Access to extension was also found to improve productivity of value adders in the study. This follows productivity literature where extension services led to the dissemination of information that may be productivity-increasing for the farmers [66].
Larger land area was however found to have an inverse relationship with productivity, following the literature on agricultural productivity. For example, [67,68] found an inverse relationship between land size and productivity, which was posited as a result of diseconomies of scale for the smallholder farmers. However, [69] found a positive relationship between farm size and productivity, most likely the result of fertilizer use. Contrary to most literature, in [70,71] agricultural training was however found to negatively impact on the productivity of value adders. This may be that additional agricultural training leads to diminishing marginal returns on productivity since the farmers were already added value Years of experience also led to a loss of productivity of the value adders. This is also consistent with studies that show that older and more experience farmers are less able to exert energy and take risky decisions, with negative consequences for their productivity [59]. This is, however, different from the studies of [72], who found that years of experience improved human capital and led to increased agricultural productivity in Senegal.
Our results also reveal that social capital is important in improving the productivity of the value adders in the cassava system in Nigeria. This follows consistently with literature that examine the effect of social capital on productivity and welfare. The importance of social capital in our case is especially observed with the value adders. Hence, social capital while promoting group cohesion may help to improve adoption of innovation [73], lower transactional costs and returns higher prices [74,75], and serve as a risk management tool [76].
For the non-value adders, we found that older farmers had significantly lower productivity. Thus, apart from gaining experience as the farmer gets older, age in itself leads to loss of vigor and reduction in managerial and labour capacity of the farmer. The coefficient of land area was also negative and significant, supporting evidence of the inverse relationship between land area and agricultural productivity. Female-headed households in the non-value addition groups also had significantly lower productivity than their male counterparts. The coefficients of non-farm activities also showed an inverse relationship to productivity for non-value adders. This is supported by [77], where non-farm activities led to a loss of labour from smallholding farms and hence a reduction in productive capacity.
Moreover, the coefficient of access to extension was negative and significant in determining the productivity of the farmers. In their study, [66] found that the impact of extension on productivity came through farmers adopting the improved technology brought by extension. Hence, the negative effect of extension on productivity of the non-value adders may be suggestive of the decision not to add value in spite of possible contact with extension. However, as shown in the descriptive statistics, inadequate access to extension services may also result in low access to production information and hence low productivity [78].

4.6. Estimated Impact of Value Addition on Productivity of Cassava Farmers

We present the unconditional and conditional outcomes (Log of value of output/ha) of value addition to the cassava farmers in this section. The results are presented in Table 6. The difference between the unconditional outcomes for value adders and non-value adders gives the population Average Treatment Effect (ATE). On the other hand, the differences in the conditional outcomes give the Average Treatment Effect on a Treated (ATT) population within the study.
The potential productivity measures for cassava farmers who are value adders and non-value adders, given the covariates (Xi), are 5.048 and 4.395 respectively. Therefore, the ATE of value addition in the cassava system in Nigeria is estimated at 0.653; that is, value addition within the cassava system returns an extra productivity value of 0.653 (14.85% increase) to the farmers.
In order to determine the impact of value addition on the productivity of farmers who are already value adders, the conditional outcome for the value adders (Ey1i/d = 1) was compared to what they would have had if they were not value adders (Ey0i/d = 1). The difference in the outcomes is the gain (or loss) for value addition. The mean log of productivity/ha for value adders is 5.392, while the outcome if they were not value adders would be 5.128. The Average Treatment Effect on the treated population of value adders (ATT) is, therefore, 0.263. This implies a positive gain of about 5% in productivity for value addition. Hence, value addition within the cassava system has the ability to enhance farmers revenue be increasing the sources and values of their production system. It is known that value addition places a premium on agricultural products, thus the extra gain from the value addition process increases overall productivity of the farmers.

5. Conclusions and Policy Recommendations

Despite the knowledge that value addition and increased biomass utilization has been shown to increase revenue base of farmers, there has been a dearth of information on the productivity differences across production systems that define these value additions. Using farm-level data from cassava farmers at different levels of value addition and cassava utilization, this study examined the productivity differentials across four identified cassava production system. The study also estimated the impact of value addition on farmers’ output while solving for potential selectivity bias. Estimates of average differences in productivity and technical efficiency are not sufficient to account for the impact of the decision to add value to cassava, since they do not effectively account for other farmer characteristics that may come to play. We, therefore, modelled the impact as a selection process where an expected increase in productivity drives farmers’ decision to add value, using an endogenous switching regression model. The endogenous switching regression model was able to correct for selection bias and model the impact of value addition on value adders and non-value adders in the study.
The study found that mean technical efficiencies were below the frontier for all the systems. This implies that cassava farmers still need to improve conversion of input to output more efficiently in order to be on the best practice frontier. However, technical efficiency was highest for the PPM system, which combined processing and marketing as value added activities in the cassava system. Decomposing the productivity increases, we found that while technical change was the reason for improved efficiency in 2016, scaling up was the factor that increased productivity in 2017. Therefore, we conclude that value addition in cassava production systems lead to an increase in technology use at the first and then to a scaling up effect in subsequent periods. These leads to an increase in productivity.
Estimating the effect of value addition on productivity with respect to aggregated value adding farmers versus non-value adders using the ESRM returned significant positive gains for value addition.
Our results have policy implications with respect to the decision to add value and the level of productivity of cassava farmers in Nigeria. The findings suggest that the decision to add value is dependent on the extent to which farmers have access to innovation information through extension and agricultural trainings. Hence, a renewed call for strengthening extension education and training within the Nigerian farming systems. There is a particular need to provide an avenue for farmers and research to exchange information and ideas through farmer field school, on-plot trainings, or relevant information transfer using appropriate media.
Moreover, formal registration of farmers was found to be significant in the decision to add value, hence the need to make the registration process of small and medium enterprises simple and affordable. Smallholders are largely excluded from mergers and investment opportunities since their registration status are unknown too investors. Therefore, making registration and the attendant benefits available to the farmers will enable them gain opportunities to investment. Also, the need to improve the capacity of social networks among the farmers is important. Our findings imply that social networks can help improve productivity, probably through the pathways that enable value addition. We recommend policy options that complement the efforts of these social networks, such as group training and affordable credits.

Author Contributions

Conceptualization, T.A.A. and V.O.O.; Data curation, T.A.A.; Formal analysis, T.A.A.; Methodology, T.A.A.; Project administration, V.O.O.; Supervision, V.O.O.; Visualization, T.A.A.; Writing—original draft, T.A.A.; Writing—review & editing, V.O.O.

Acknowledgments

The study is part of the Young Postdoctoral Programme of the BiomassWeb project jointly coordinated by Forum for Agricultural Research in Africa (FARA), Ghana and the Centre for Development Research (ZEF), Germany, and the University of Ibadan, Nigeria. We acknowledge the financial support from the German Federal Ministry of Education and Research (BMBF) supported with funds from the German Federal Ministry for Economic Cooperation and Development (BMZ).We also acknowledge support of all project partners.

Funding

This project was carried out under the BiomassWeb project GlobE, and was funded by the German Federal Ministry of Education and Research (BMBF) through the collaborative project “Improving food security in Africa through increased system productivity of biomass-based value webs”. This project is part of the GlobE—Research for the Global Food Supply programme, Grant No (031A258H).

Conflicts of Interest

The authors declare no conflict of interest.

References and Note

  1. Fan, S.; Brzeska, J.; Keyzer, M.; Halsema, A. From Subsistence to Profit: Transforming Smallholder Farms; International Food Policy Research Institute (IFPRI): Washington, DC, USA, July 2013. [Google Scholar]
  2. Martin, G.; Martin-Clouaire, R.; Duru, M. Farming system design to feed the changing world. A review. Agron. Sustain. Dev. 2013, 33, 131–149. [Google Scholar] [CrossRef]
  3. Obayelu, A.E.; Afolami, C.A.; Agbonlahor, M.U. Relative profitability of cassava-based mixed cropping systems among various production scale operators in Ogun and Oyo States Southwest Nigeria. Afr. Dev. Rev. 2013, 25, 513–525. [Google Scholar] [CrossRef]
  4. Aminu, F.O.; Okeowo, T.A. economic analysis of cassava mixed farming enterprises in Epe Local Government Area, Lagos State, Nigeria. Appl. Trop. Agric. 2016, 21, 122–130. [Google Scholar]
  5. Abu, B.M.; Issahaku, H.; Nkegbe, P.K. Farm-gate versus market centre sales: A multi-crop approach. Agric. Food Econ. 2016, 4, 21. [Google Scholar] [CrossRef]
  6. Food and Agricultural Organisation (FAO). Nigeria at a Glance. Available online: http://www.fao.org/nigeria/fao-in-nigeria/nigeria-at-a-glance/en/ (accessed on 5 September 2018).
  7. Mmasa, J.J. Value addition practices to agricultural commodities in Tanzania. Tanzan. Country Level Knowl. Netw. Policy Brief 2013, 20, 1–15. [Google Scholar]
  8. Ubalua, A.O. Cassava Wastes: Treatment options and value addition alternatives. Afr. J. Biotechnol. 2007, 6, 2065–2073. [Google Scholar] [CrossRef]
  9. Brees, M.; Parcell, J.; Giddens, N. Capturing vs. Creating Value. MU Agricultural Guide, University of Missouri Cooperative Extension 2010. Available online: http://extension.missouri.edu/p/G641 (accessed on 31 August 2018).
  10. Lu, R.; Dudensing, R. What do we mean by value-added agriculture? Choices 2015, 30, 1–8. [Google Scholar]
  11. Virchow, D.; Beuchelt, T.; Denich, M.; Loos, T.K.; Hoppe, M.; Kuhn, A. The value web approach. Rural Focus 2014, 21, 16–18. [Google Scholar]
  12. Aw, B.Y.; Chen, X.; Roberts, M.J. Firm-level evidence on productivity differentials and turnover in Taiwanese manufacturing. J. Dev. Econ. 2001, 66, 51–86. [Google Scholar] [CrossRef]
  13. Ghebru, H.; Holden, S.T. Technical efficiency and productivity differential effects of land right certification: A quasi-experimental evidence. Q. J. Int. Agric. 2015, 54, 1–31. [Google Scholar]
  14. Besharat, A.; Amirahmadi, M. The study of factors affecting productivity in the agriculture sector of Iran. Afr. J. Agric. Res. 2011, 6, 4340–4348. [Google Scholar]
  15. Kissoly, L.; Faße, A.; Grote, U. Small scale framers’ integration in agricultural value chains: The role for food security in rural Tanzania. In Proceedings of the Conference on International Research on Food Security, Natural Resources Management and Rural Development, Tropentag 2015, Berlin, Germany, 16–18 September 2015. [Google Scholar]
  16. Warsanga, W.B.; Evans, E.A. Welfare impact of wheat farmers’ participation in the value chain in Tanzania. Mod. Econ. 2018, 9, 853. [Google Scholar] [CrossRef]
  17. Obaga, B.R.; Mwaura, F.O. Impact of farmers’ participation in banana value addition in household welfare in Kisii Central Sub-County. Int. Acad. J. Soc. Sci. Educ. 2018, 2, 25–46. [Google Scholar]
  18. Kehinde, A.L.; Aboaba, K.O. Analysis of value addition in the processing of cassava tubers to “garri” among cottage level processors in southwestern Nigeria. In Proceedings of the International Conference of the African Association of Agricultural Economists, Addis Ababa, Ethiopia, 23–26 September 2016. [Google Scholar]
  19. Singh, I.; Squire, L.; Strauss, J. (Eds.) Agricultural Household Models: Extensions and Applications; Johns Hopkins University Press: Baltimore, MD, USA, 1986. [Google Scholar]
  20. Sadoulet, E.; de Janvry, A. Quantitative Development Policy Analysis; The Johns Hopkins University Press: Baltimore, MD, USA; London, UK, 1995. [Google Scholar]
  21. Mendola, M. Farm Household Production Theories: A Review of “Institutional” and “Behavioral” Responses. Asian Dev. Rev. 2007, 24, 49–68. [Google Scholar] [CrossRef]
  22. Schultz, T.W. Transforming Traditional Agriculture; University of Chicago Press: Chicago, IL, USA, 1964. [Google Scholar]
  23. Meyer, J. Expected utility as a paradigm for decision making in agriculture. In A Comprehensive Assessment of the Role of Risk in US Agriculture; Springer: Boston, MA, USA, 2002; pp. 3–19. [Google Scholar]
  24. Olomola, A.S. Competitive Commercial Agriculture in Africa Study (CCAA). World Bank Site Resource. Available online: siteresources.worldbank.org (accessed on 1 September 2018).
  25. National Bureau of Statistics (NBS). Cassava production in Nigeria, 1970–2010. NBS Stat. Bull. Federal Republic of Nigeria 2010.
  26. Jenkins, S.P.; Siedler, T. Using Household Panel Data to Understand the Intergenerational Transmission of Poverty; Discussion Paper 694; German Institute for Economic Research (DIW): Berlin, Germany, 2007. [Google Scholar]
  27. Assaad, R.A.; Krafft, C.; Yassin, S. Comparing Retrospective and Panel Data Collection Methods to Assess Labor Market Dynamics; Discussion Paper No 11052; Institute of Labour Economics (IZA): Bonn, Germany, 2017. [Google Scholar]
  28. Hsiao, C. Panel data analysis—Advantages and challenges. Test 2007, 16, 1–22. [Google Scholar] [CrossRef]
  29. Coelli, T.; Prasada Rao, D.S.; O’Donnell, C.; Battese, G. An Introduction to Efficiency and Productivity Analysis, 2nd ed.; Springer Science and Business Media: New York, NY, USA, 2005; ISBN 0387242651. [Google Scholar]
  30. Stolp, C. Strengths and weaknesses of data envelopment analysis: An urban and regional perspective. Comput. Environ. Urban Syst. 1990, 14, 103–116. [Google Scholar] [CrossRef]
  31. Hossain, M.K.; Kamil, A.A.; Baten, M.A.; Mustafa, A. Stochastic frontier approach and data envelopment analysis to total factor productivity and efficiency measurement of Bangladeshi rice. PLoS ONE 2012, 7, e46081. [Google Scholar] [CrossRef] [PubMed]
  32. Portela, M.C.A.S.; Thanassoulis, E. Zero weights and non-zero slacks: Different solutions to the same problem. Ann. Oper. Res. 2006, 145, 129–147. [Google Scholar] [CrossRef]
  33. Mazvimavi, K.; Ndlovu, P.V.; An, H.; Murendo, C. Productivity and efficiency analysis of maize under conservation agriculture in Zimbabwe. In Proceedings of the International Conference for Agricultural Economists Triennial Conference, Foz do Iguaçu, Brazil, 18–24 August 2012. [Google Scholar]
  34. Sarkis, J. Preparing your data for DEA. In Modeling Data Irregularities and Structural Complexities in Data Envelopment Analysis; Joe, Z., Wade, C., Eds.; Springer: Boston, MA, USA, 2007; pp. 305–320. ISBN 978-0-387-71607-7. [Google Scholar]
  35. Coelli, T.J.; Rao, D.S. Total Factor Productivity growth in agriculture: A Malmquist index analysis of 93 countries, 1980–2000. Agric. Econ. 2005, 32, 115–134. [Google Scholar] [CrossRef]
  36. Sipiläinen, T.; Kuosmanen, T.; Kumbhakar, S.C. Measuring productivity differentials–An application to milk production in Nordic countries. In Proceedings of the 12th Congress of the European Association of Agricultural Economics–EAAE, Ghent, Belgium, 26–29 August 2008. [Google Scholar]
  37. Awotide, B.A.; Abdoulaye, T.; Alene, A.; Manyong, V.M. Impact of access to credit on agricultural productivity: Evidence from smallholder cassava farmers in Nigeria. In Proceedings of the International Conference of Agricultural Economists (ICAE), Milan, Italy, 9–14 August 2015. [Google Scholar]
  38. Seng, K. The Effects of nonfarm activities on farm households’ food consumption in rural Cambodia. Dev. Stud. Res. 2015, 2, 77–89. [Google Scholar] [CrossRef] [Green Version]
  39. Negash, M.; Swinnen, J.F. Biofuels and food security: Micro-evidence from Ethiopia. Energy Policy 2013, 61, 963–976. [Google Scholar] [CrossRef] [Green Version]
  40. Hasebe, T. Copula base maximum likelihood estimation of sample selection model. Stata J. 2013, 13, 547–573. [Google Scholar] [CrossRef]
  41. Alene, A.D.; Manyong, V.M. The effects of education on agricultural productivity under traditional and improved technology in northern Nigeria: An endogenous switching regression analysis. Empir. Econ. 2007, 32, 141–159. [Google Scholar] [CrossRef]
  42. Maddala, G.S. Disequilibrium, self-selection, and switching models. Handb. Econ. 1986, 3, 1633–1688. [Google Scholar]
  43. Lokshin, M.; Sajaia, Z. Maximum likelihood estimation of endogenous switching regression models. Stata J. 2004, 4, 282–289. [Google Scholar] [CrossRef]
  44. Long, W.; Appleton, S.; Song, L. Job Contact and Wages of Rural-Urban Migrants in China; Discussion Paper 7577; Institute for the Study of Labour (IZA): Bonn, Germany, 2013. [Google Scholar]
  45. Abdulai, A.; Huffman, W. The adoption and impact of soil and water conservation technology: An endogenous switching regression application. Land Econ. 2014, 90, 26–43. [Google Scholar] [CrossRef]
  46. Lee, L.F. Some approaches to the correction of selectivity bias. Rev. Econ. Stud. 1982, 49, 355–372. [Google Scholar] [CrossRef]
  47. StataCorp. Stata: Release 13. Statistical Software, StataCorp LP: College Station, TX, USA, 2013.
  48. Wright, W.; Annes, A. Farm women and the empowerment potential in value-added agriculture. Rural Sociol. 2016, 81, 545–571. [Google Scholar] [CrossRef]
  49. Masamha, B.; Thebe, V.; Uzokwe, V. Mappping cassava food value chains in Tanzania’s smallholder farming sector: The implications of intra-household gender dynamics. J. Rural Stud. 2018, 58, 82–92. [Google Scholar] [CrossRef]
  50. Born, H.; Bachmann, J. Adding Value to Farm Products: An Overview; National Center for Appropriate Technology: Butte, MT, USA, 2006. [Google Scholar]
  51. Evans, E. Value Added Agriculture: Is It Right for Me. Obtenido de EDIS Document FE638, Florida Cooperative Extension Service, Institute of Food and Agricultural Sciences, University of Florida, Gainesville. 2012. Available online: http://edis.ifas.ufl.edu/pdffiles/FE/FE63800.Pdf (accessed on 18 September 2018).
  52. Huffman, W. Human Capital: Education and Agriculture. Iowa State University Economic Staff Paper Series 312. 1999. Available online: http://lib.dr.iastate.edu/econ_las_staffpaper/312 (accessed on 5 September 2018).
  53. Uematsu, H.; Mishra, A.K. Can education be a barrier to technology adoption? Presented at the Agricultural & Applied Economics Association 2010, AAEA CAES & WAEA Joint Annual Meeting, Denver, CO, USA, 25–27 July 2010. [Google Scholar]
  54. Davis, K.; Nkonya, E.; Kato, E.; Mekonnen, D.A.; Odendo, M.; Miiro, R.; Nkuba, J. Impact of farmer field schools on agricultural productivity and poverty in East Africa. World Dev. 2012, 40, 402–413. [Google Scholar] [CrossRef]
  55. Kijima, Y.; Ito, Y.; Otsuka, K. Assessing the impact of training on lowland rice productivity in an African setting: Evidence from Uganda. World Dev. 2012, 40, 1610–1618. [Google Scholar] [CrossRef]
  56. Roy, R.; Shivamurthy, M.; Radhakrishna, R. Impact of value addition training on participants of farmers training institutes. World Appl. Sci. J. 2013, 22, 1401–1411. [Google Scholar] [CrossRef]
  57. Ntshangase, N.L.; Muroyiwa, B.; Sibanda, M. Farmers’ perceptions and factors influencing the adoption of no-till conservation agriculture by small-scale farmers in Zashuke, KwaZulu-Natal Province. Sustainability 2018, 10, 555. [Google Scholar] [CrossRef]
  58. Brem, R.M.; Obare, G.A.; Owuor, G. Is value addition in honey a panacea for poverty reduction in the asal in Africa? Empirical evidence from Baringo District, Kenya. In Proceedings of the Joint 3rd African Association of Agricultural Economists (AAAE) and 48th Agricultural Economists Association of South Africa (AEASA) Conference, Cape Town, South Africa, 19–23 September 2010. [Google Scholar]
  59. Danso-Abbeam, G.; Antwi Bosiako, J.; Ehiakpor, D.; Mabe, F.; Aye, G. Adoption of improved maize variety among farm households in the northern region of Ghana. Cogent Econ. Finance 2017, 5, 1416896. [Google Scholar] [CrossRef]
  60. Islam, K.Z.; Sumelius, J.; Bäckman, S. Do differences in technical efficiency explain the adoption rate of HYV rice? Evidence from Bangladesh. Agric. Econ. Rev. 2012, 13, 93–104. [Google Scholar]
  61. Tripp, R.; Gisselquist, D. A Fresh Look at Agricultural Input Regulation; Natural Resource Perspectives; Overseas Development Institute (ODI): London, UK, March 1996. [Google Scholar]
  62. Wang, B.; Dong, F.; Chen, M.; Zhu, J.; Tan, J.; Fu, X.; Chen, S. Advances in recycling and utilization of agricultural wastes in China: Based on environmental risk, crucial pathways, influencing factors, policy mechanism. Procedia Environ. Sci. 2016, 31, 12–17. [Google Scholar] [CrossRef]
  63. Oseni, G.; Corral, P.; Goldstein, M.; Winters, P. Explaining gender differentials in agricultural production in Nigeria. In African Region Gender Practice Policy Brief; The World Bank: Washington, DC, USA, 2013. [Google Scholar]
  64. Kilic, T.; Palacios-Lopez, A.; Goldstein, M. Caught in a productivity trap: A distributional perspective on gender differences in Malawian agriculture. World Dev. 2015, 70, 416–463. [Google Scholar] [CrossRef]
  65. Njobe, B. Women and Agriculture: The Untapped Opportunity in the Wave of Transformation; Background Paper; African Development Bank: Abidjan, Cote d’Ivoire, 2015. [Google Scholar]
  66. Emmanuel, D.; Owusu-Sekyere, E.; Owusu, V.; Jordaan, H. Impact of agricultural extension service on adoption of chemical fertilizer: Implications for rice productivity and development in Ghana. NJAS-Wagening. J. Life Sci. 2016, 79, 41–49. [Google Scholar] [CrossRef]
  67. Chand, R.; Prasanna, P.L.; Singh, A. Farm size and productivity: Understanding the strengths of smallholders and improving their livelihoods. Econ. Political Wkly. 2011, 25, 5–11. [Google Scholar]
  68. Ladvenicova, J.; Miklovicova, S. The relationship between farm size and productivity in Slovakia. Visegrad J. Bioecon. Sustain. Devel. 2015, 4, 46–50. [Google Scholar] [CrossRef]
  69. Singh, R.K.P.; Kumar, A.; Singh, K.M.; Chandra, N.; Bharati, R.C.; Kumar, U.; Kumar, P. Farm size and productivity relationship in smallholder farms: Some empirical evidences from Bihar, India. J. Community Mobilization Sustain. Dev. 2018, 13, 61–67. [Google Scholar]
  70. Ahmad, M.; Jadoon, M.A.; Ahmad, I.; Khan, H. Impact of trainings imparted to enhance agricultural production in district Mansehra. Sarhad J. Agric. 2007, 23, 1211. [Google Scholar]
  71. Ulimwengu, J.; Badiane, O. Vocational training and agricultural productivity: Evidence from rice production in Vietnam. J. Agric. Educ. Ext. 2010, 16, 399–411. [Google Scholar] [CrossRef]
  72. Ndour, C.T. Effects of human capital on agricultural productivity in Senegal. World Sci. News 2017, 64, 34–43. [Google Scholar]
  73. Liverpool-Tasie, L.S.; Kuku, O.; Ajibola, A. Review of Literature on Agricultural Productivity, Social Capital and Food Security in Nigeria; NSSP Working Paper 21; International Food Policy Research Institute (IFPRI): Washington, DC, USA, 2011; Available online: http://ebrary.ifpri.org/cdm/ref/collection/p15738coll2/id/126846 (accessed on 7 September 2018).
  74. Mawejje, J.; Terje Holden, S. Does social network capital buy higher agricultural prices? A case of coffee in Masaka district, Uganda. Int. J. Soc. Econ. 2014, 41, 573–585. [Google Scholar] [CrossRef]
  75. Jacques, D.C.; Marinho, E.; d’Andrimont, R.; Waldner, F.; Radoux, J.; Gaspart, F.; Defourny, P. Social capital and transaction costs in millet markets. Heliyon 2018, 4, e00505. [Google Scholar] [CrossRef] [PubMed]
  76. Wossen, T.; Berger, T.; Di Falco, S. Social capital, risk preference and adoption of improved farm land management practices in Ethiopia. Agric. Econ. 2015, 46, 81–97. [Google Scholar] [CrossRef]
  77. Amare, M.; Shiferaw, B. Nonfarm employment, agricultural intensification, and productivity change: Empirical findings from Uganda. Agric. Econ. 2017, 48, 59–72. [Google Scholar] [CrossRef]
  78. Baloch, M.A.; Thapa, G.B. The effect of agricultural extension services: Date farmers’ case in Balochistan, Pakistan. J. Saudi Soc. Agric. Sci. 2016, 17, 282–289. [Google Scholar] [CrossRef]
Figure 1. The Nexus of Value Addition and Productivity; Author’s conceptualization.
Sustainability 10 04770 g001
Figure 2. Maps of study states; (a) Ogun state and (b) Kwara state; Retrieved from Google Maps, 2018.
Sustainability 10 04770 g002
Table 1. Summary Statistics of Farmer Characteristics across Cassava Production Systems.
VariablesSP (n = 192)PP (n = 199)PM (n = 42)PPM (n = 49)POOLED (n = 482)Chi Test
Gender of farmer (%) 77 ***
Male91.1554.7792.8662.5073.39
Female8.8545.23 7.1437.5026.62
Age of farmer (mean years)48.82 (15.38)45.98 (11.95)52.93 (14.50)46.57 (10.02)47.78 (20.14)9.35 ***
Household size(mean)7.08 (4.23)6.41 (2.84)9.62 (6.55)8.00 (3.91)7.11 (4.06)15.12 ***
Years of education of farmer (mean)7.28 (4.75)6.59 (5.08)5.60 (4.91)7.47 (5.63)6.87 (5.01)5.57
Years of experience (mean)21.38 (14.19)17.50 11.58)20.14 (12.63)19.92 (10.19)19.52 (12.74)8.53 **
Land area used (ha; mean)2.34 (4.07)1.85 (2.26)4.59 (8.48)3.33 (5.28)2.43 (4.27)8.89 ***
Received agricultural training (%)20.8331.1611.9024.4924.699.70 ***
Use Credit (%)23.4424.6223.8142.8625.938.20 **
Registration of agricultural enterprise (%)1.560.004.766.121.6611.82 ***
Access to extension services (%)22.4029.6523.8136.7326.975.39
Membership of Social group (%)36.4639.7038.1055.1039.835.73
Note: Standard deviation in parentheses; Source: computed from field survey data, 2018; ** and *** are significance at 5% and 1% respectively.
Table 2. Revenue and Costs Outlays used for Productivity measures across Cassava Production Systems in Three Periods.
Variable Items201720162015
SPPPPMPPMPOOLEDSPPPPMPPMPOOLEDSPPPPMPPMPOOLED
Revenue (N)332,414.9570,144.25,496,025794,252984,329297,573.1645,213.94,135,661767,969.1823,360.7282,737.1707,896.92,915,499546,430.5657,614.7
Labour costs (N)122,726.6191,574.4195,997.6171,051162,448.586,704.04906,722.2150,317.3131,846.9435,391.580,584.64895,209128,694.6138,913.3427,034.8
Seed cost (N)19,156.25206,835.5227,514.3178,809.6131,028.115,020.83182,789.7214,835.7142,353.8114,642.314,597.66179,402.8191,175115,807.9108,315
Power (N)9186.458 30,148.398566.66739,218.3720,839.897594.53120,658.628463.09527,274.7115,064.586927.86520,866.336264.28625,481.6314,510.89
Transportation (N)17,056.2731,052.7652,10044,675.5128,696.2710,778.1420,873.6248,476.1931,434.6920,331.029366.27617,705.5342,988.124,053.0617,232
SP—Sole Producer; PP—Producer Processors; PM—Producer Marketer; PPM—Producer Processor Marketer. Source: computed from field survey data, 2018.
Table 3. Mean Technical Efficiencies across Cassava Production Systems in Nigeria.
Period/Technical EfficiencyCRSVRS
SPPPPMPPMPOOLEDSPPPPMPPMPOOLED
20150.8360.8250.7700.8940.7320.8650.8810.8400.9370.806
20160.8330.8080.7370.8950.7180.8590.8680.8330.9430.803
20170.8390.8120.7610.9110.7160.8810.8740.8420.9480.796
Source: Computation from the DEA results output.
Table 4. Productivity Growth across Cassava Production Systems in Nigeria.
System/Growth Indices20162017
SPPPPMPPMPooledSPPPPMPPMPooled
Efficiency change0.9970.9780.9601.0040.9821.0071.0061.0301.0200.997
Technical change1.0051.0271.0371.0191.0200.9780.9740.9500.9330.980
Pure technical efficiency change1.0060.9860.9821.0090.9960.9941.0061.0141.0070.992
Scale efficiency change0.9910.9920.9770.9950.9861.0131.0001.0161.0131.005
Total factor productivity change1.0021.0050.9951.0231.002 0.9850.9800.9790.9520.976
Source: Computed from DEA analysis of field survey data, 2018. Note; Year 2015 is the reference year.
Table 5. Full Information Maximum Likelihood (FIML) Estimates of Impact of Value Addition of Productivity of Cassava Farmers.
Selection ModelProductivity Equation
Value Adders/Non Value AddersValue AddersNon Value Adders
Constant0.552 ***
(0.181)
5.322 ***
(0.137)
4.592 ***
(0.189)
Gender of farmer (base = female)−1.019 ***
(0.094)
0.347 ***
(0.076)
0.471 ***
(0.117)
Age of farmer0.005
(0.003)
0.005
(0.003)
−0.008 ***
(0.003)
Land area0.021 ***
(0.010)
−0.058 ***
(0.007)
−0.079 ***
(0.008)
Years of education−0.028 ***
(0.008)
0.000
(0.006)
0.008
(0.007)
Agricultural training0.187 **
(0.094)
−0.197 ***
(0.074)
−0.007
(0.082)
Non-farm activities0.075
(0.073)
0.032
(0.059)
−0.106 *
(0.063)
Access to extension0.278 ***
(0.092)
0.142 **
(0.073)
−0.163 **
(0.078)
Years of experience−0.008 ***
(0.003)
−0.010 ***
(0.003)
0.004
(0.003)
Access to credit0.014
(0.083)
−0.101
(0.064)
0.045
(0.071)
Membership of social group0.098
(0.072)
0.248 ***
(0.058)
0.010
(0.063)
Marital status (base = single)0.172 **
(0.082)
Registration status of enterprise (base = no)1.113 ***
(0.205)
Level of utilization (base = Low)
Medium0.399 ***
(0.072)
Full0.329 ***
(0.075)
Ln Sigma1−0.168 ***
(0.042)
Ln Sigma2−0.188 ***
(0.057)
Rho10.615 ***
(0.082)
Rho2−0.895 ***
(0.034)
LR test of independence24.99 ***
Note: Standard errors in parentheses; *, ** and *** are significance at 10%, 5% and 1% respectively.
Table 6. Estimated Impacts of Value Addition on Productivity.
Meant-Test
Unconditional
E ( y 1 i | X i ) 5.048(0.010)
E ( y 0 i | X i ) 4.395 (0.010)
ATE0.653 (0.014)46.92 ***
Conditional
E ( y 1 i | d = 1 ) 5.392 (0.011)
E ( y 0 i | d = 1 ) 5.128 (0.013)
ATT0.263 (0.010)14.91 ***
Note: Standard Errors in parentheses; *** is significance 1%.

