Article

Effects of Different Grazing Systems on Aboveground Biomass and Plant Species Dominance in Typical Chinese and Mongolian Steppes

1
Resources and Environment Economy College, Inner Mongolia University of Finance and Economics, No.185, North Two Ring Road, Hohhot 010070, China
2
Planning and Geographic Information System Laboratory, Inner Mongolia University of Finance and Economics, No.185, North Two Ring Road, Hohhot 010070, China
3
Department of Resources and Environment, Baotou Teachers’ College, Baotou 014030, China
4
Department of Environmental Symbiotic College of Agriculture, Rakuno Gakuen University, 582, Bunkyodai-Midorimachi, Ebetsu, Hokkaido 069-8501, Japan
5
College of Geographical Sciences, Inner Mongolia Normal University, No. 81, Zhao Wuda Road, Hohhot 010022, China
6
Department of Geography, School of Arts and Sciences, National University of Mongolia, University street 1, Ulaanbaatar 14200, Mongolia
*
Authors to whom correspondence should be addressed.
Sustainability 2018, 10(12), 4753; https://doi.org/10.3390/su10124753
Submission received: 9 November 2018 / Revised: 5 December 2018 / Accepted: 8 December 2018 / Published: 13 December 2018
(This article belongs to the Special Issue Rural Sustainable Environmental Management)

Abstract

:
This study investigated the effects of different grazing systems on plant communities, and examined the causes of Mongolian grassland desertification. The typical steppes near the Chinese-Mongolian border were studied using quadrat sampling and remote sensing methods. Aboveground biomass in the steppe areas differed significantly among the three grazing systems (p < 0.05): Biomass in the grazing-prohibited areas (455.9 g) was greater than that in the rotational-grazing areas (268.4 g) and the continuous grazing areas (122.2 g). Aboveground biomass was well correlated with the Soil Adjusted Vegetation Index (SAVI; y = 5600x2 + 260x + 110; R2 = 0.67; p < 0.05). The relative mean deviation between the aboveground biomass was calculated using this regression and the measured biomass was 29.1%. The Soil Adjusted Vegetation Index (SAVI) values for nomadic-grazing areas were greater than those for continuous-grazing areas in 1989, 2005, 2011, and 2016, and were significantly greater in 2011 and 2016. The SAVI values for the continuous-grazing areas were slightly, but not significantly greater, than those for the nomadic-grazing areas in 1993. Plant species that dominated in moderately degraded areas were most dominant in nomadic-grazing areas, followed by continuous-grazing areas and grazing-prohibited areas. Plant species that dominated in lightly and heavily degraded areas were most dominant in continuous-grazing areas, followed by nomadic-grazing areas and grazing-prohibited areas. Generally, continuous grazing caused more serious grassland degradation than did nomadic grazing, and nomadic-grazing areas tolerated more intense grazing than did continuous-grazing areas.

1. Introduction

The Mongolian Plateau, which has an area of approximately 2.6 million km2 [1], is located in the mid-latitudes of the Northern hemisphere. This plateau is divided between Mongolia and the Inner Mongolia Autonomous Region (China).
Most of the Mongolian grasslands are grazed, and the effects of this intensive grazing on the grasslands plant community have become a focal point of local ecological research [2,3]. The combination of grazing and climate change has dramatically increased the degradation of the Mongolian grasslands [4,5]. Indeed, the implementation of China’s Pasture Household Contract Responsibility System policy has further accelerated degradation [6]. Landscape fragmentation and frequent natural disasters, such as droughts and sand storms, have resulted in the rapid reduction of aboveground grassland biomass and the degeneration of community plant succession [7,8]. These effects have been studied from the perspectives of climatology, hydrology, and ecology [9,10].
Due to the large area, transected by an international border, subject to communication barriers, and harsh weather, many researchers have carried out controlled experiments in a small, fixed area to analyze the effects of different grazing systems on vegetation environments in the Mongolian grassland [11,12,13]. Up until now, very few researchers have carried out comparative studies of cross-border regions in the Mongolian grassland. In particular, multi-scale studies (quadrat-belt-transect-regional) and quantitative studies integrating remote sensing and field survey have only rarely been reported [2].
Here, we aimed to compare the aboveground biomass and the dominant vegetation among typical steppe areas subjected to different grazing systems. We observed vegetation dynamics in rectangular zones, set in three lines perpendicular to the border and in seven lines parallel to the border (approximately 1400 km2), from 1989 to 2016. Herein, we discuss the causes of Mongolian grassland degradation; our results will help to provide a framework for the sustainable development of the Mongolian grassland ecosystem.

2. Materials and Methods
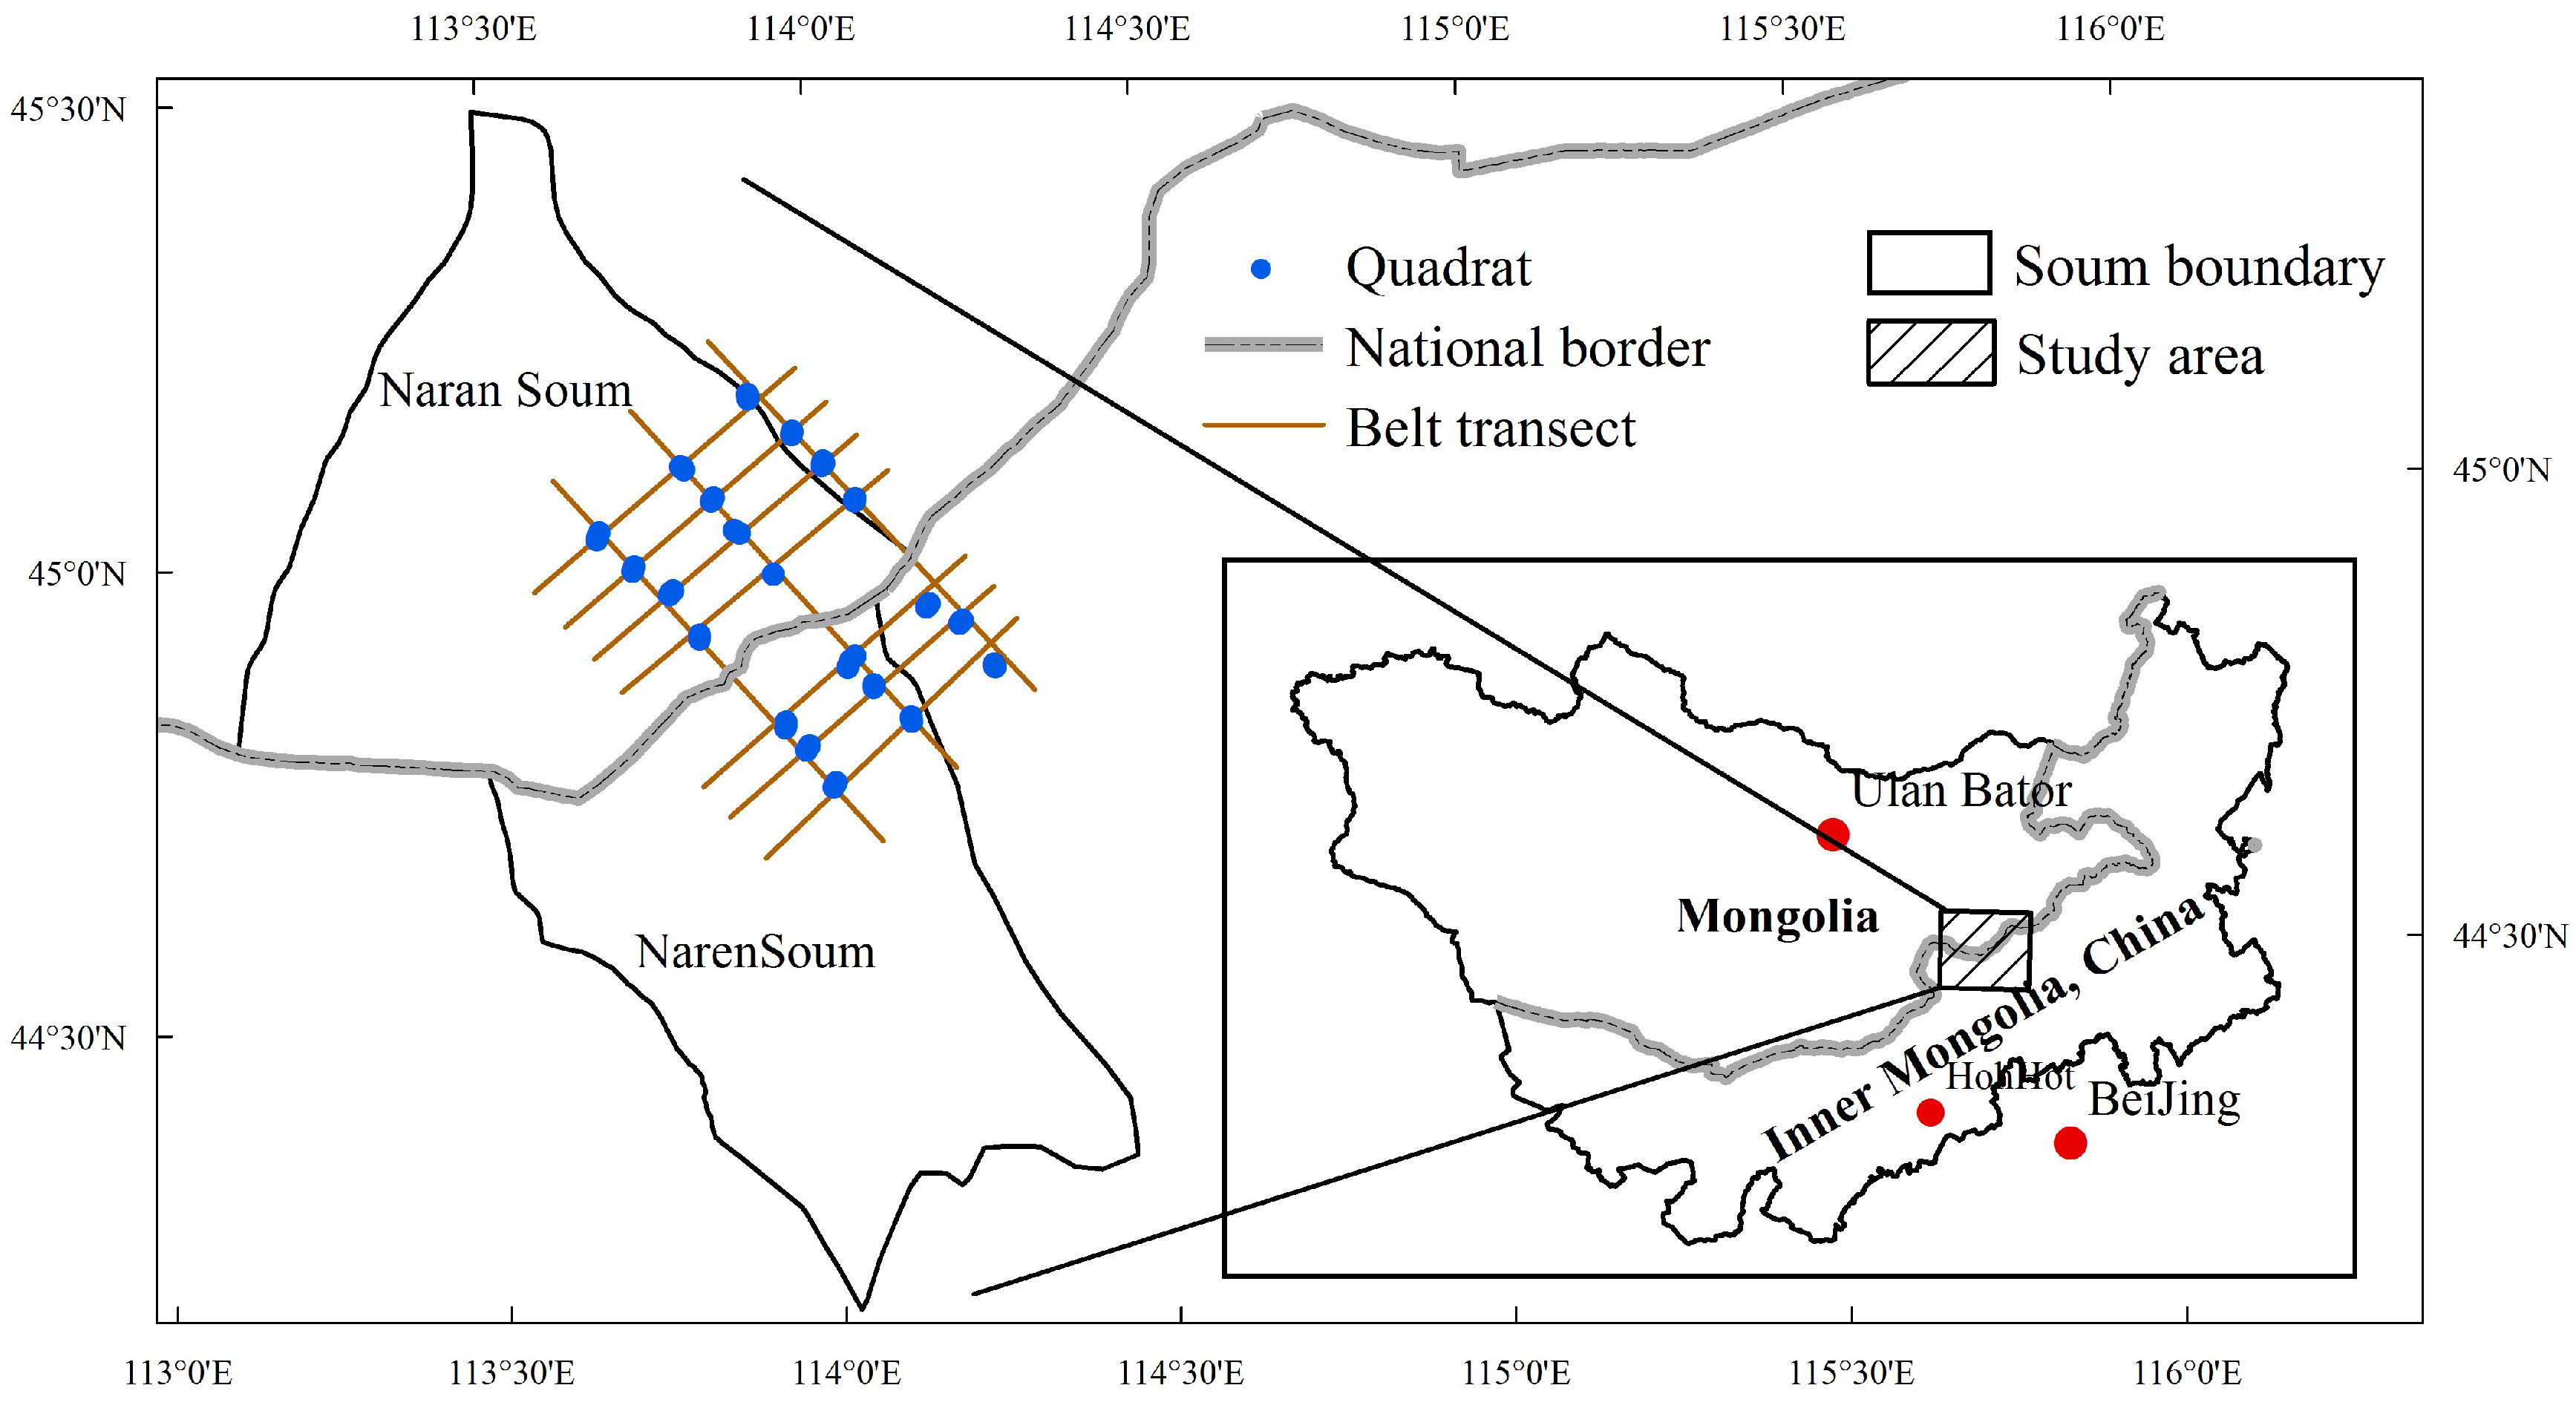
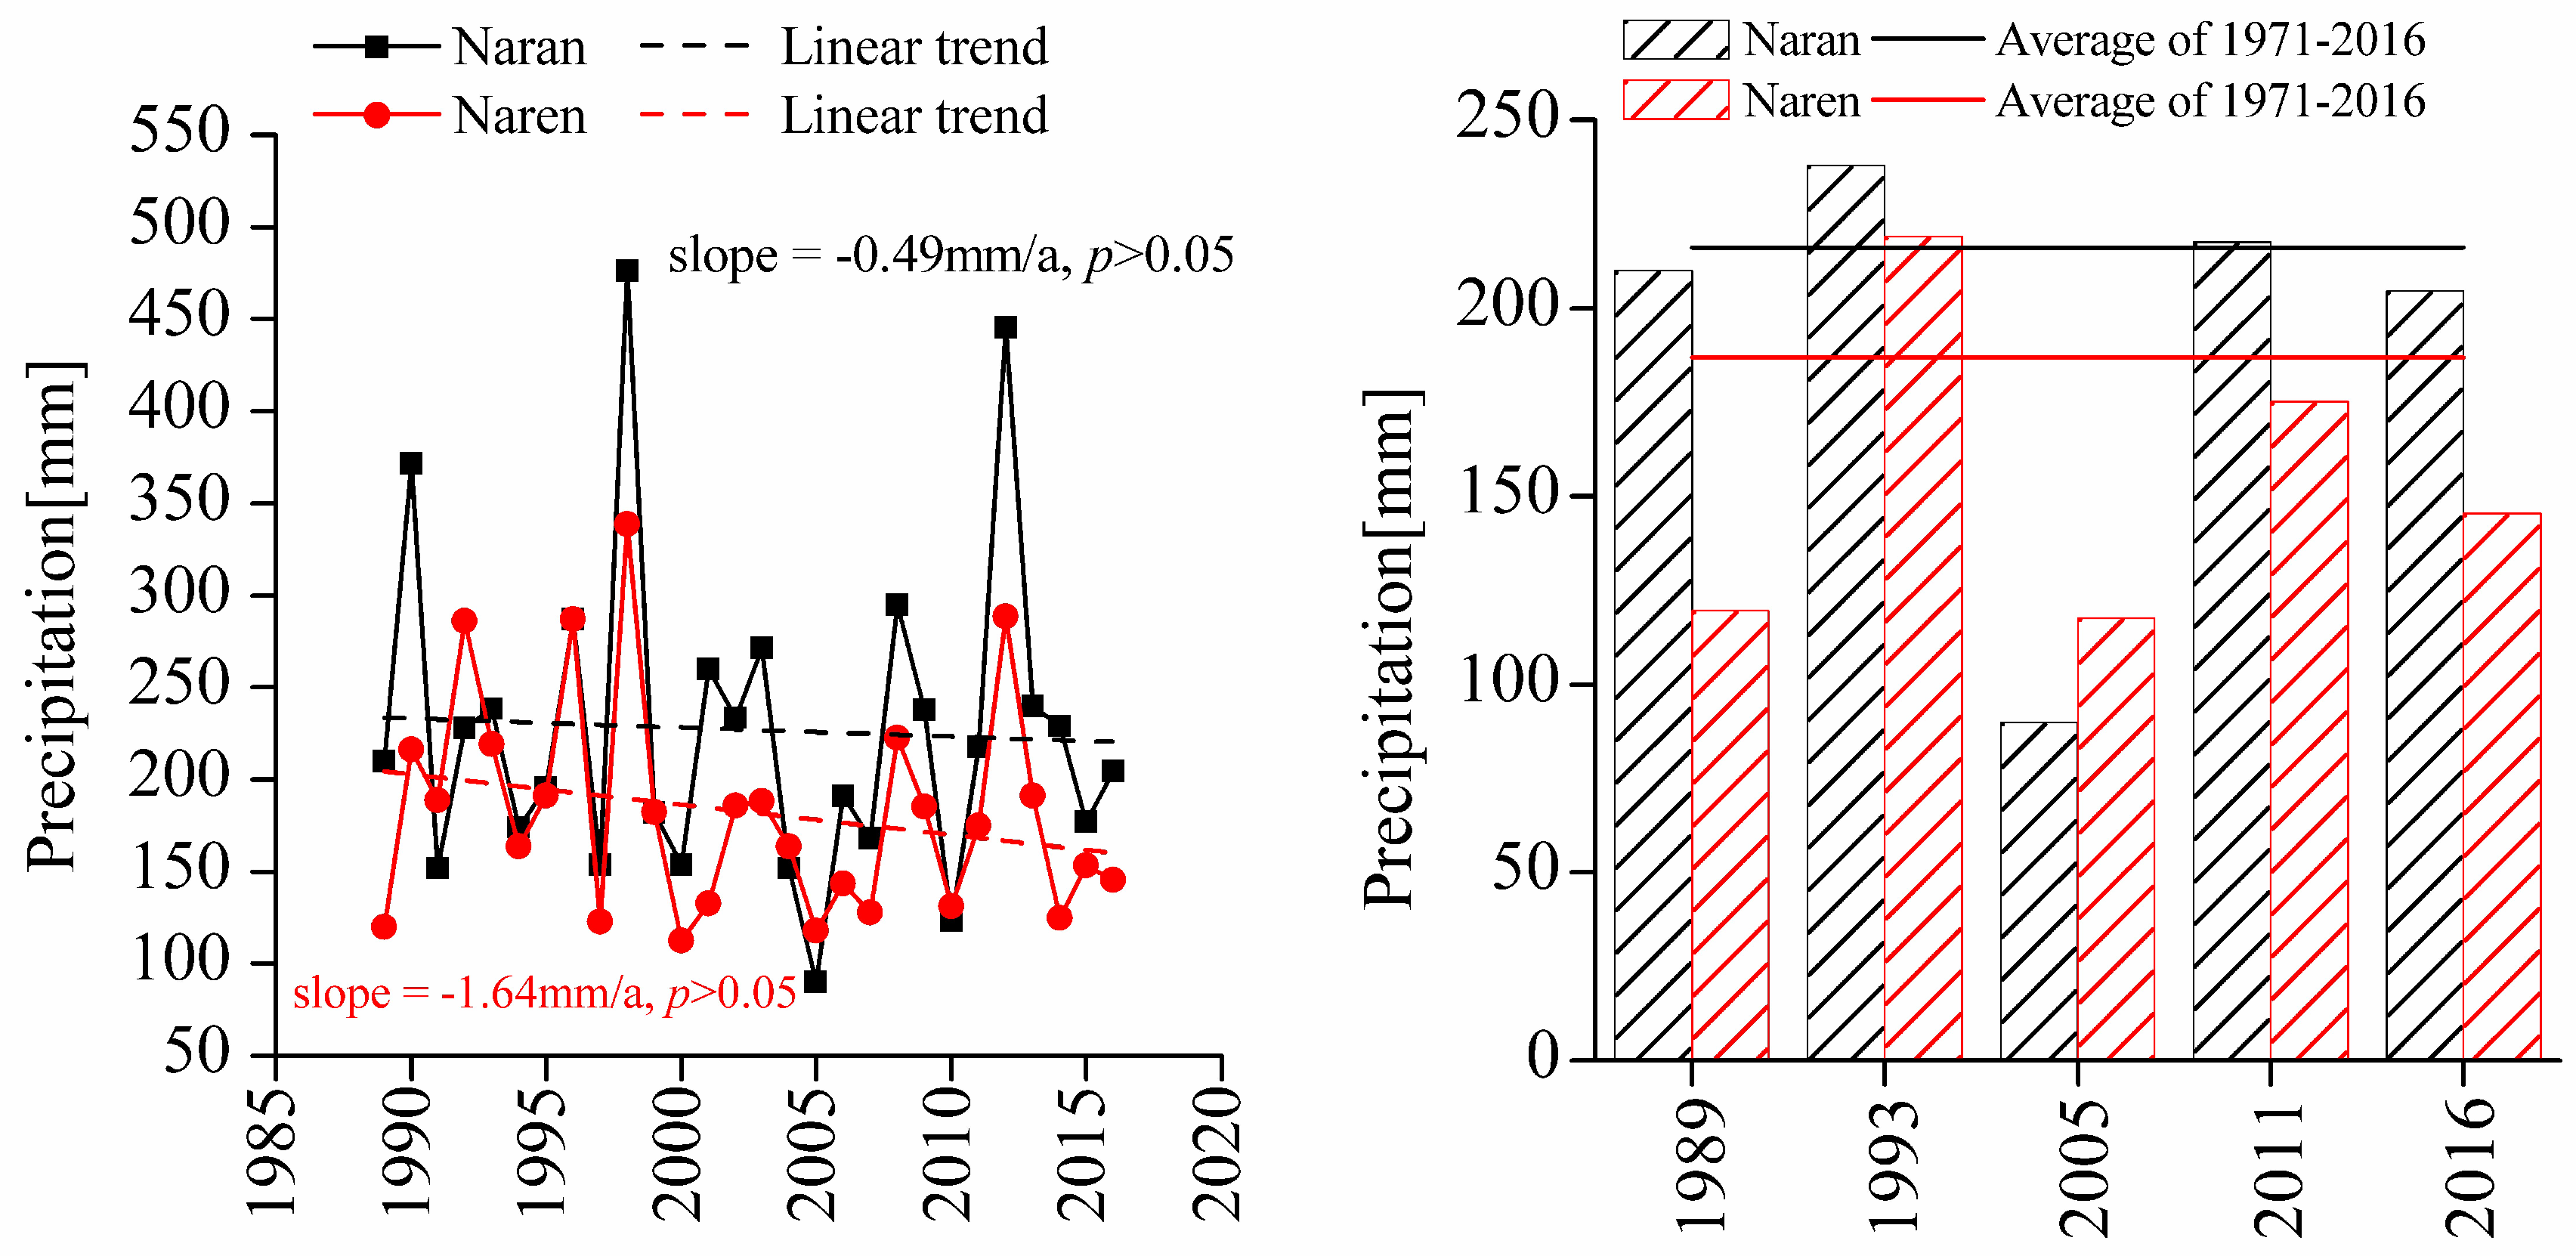
2.1. Study Area

Most of the Mongolian Plateau is arid or semi-arid; as these areas receive little rain, the ecological environment is extremely fragile [14]. Our study area is located in a flat area of the cross-border region, between Naran Soum, Sukhbaatar Province, Mongolia, and Naren Soum, Abag Banner, Xilin Gol League, Inner Mongolia, China (Figure 1). The soil is Calcic Chernozems (IUSS Working Group WRB 2006) with obvious chestnut humus and calcium carbonate deposits [15]. The depth of the humus layer is 5–10 cm [11]. Annual mean precipitation is about 220.6 ± 65.2 mm [15]. More than 60% of the annual precipitation falls from July to September; this is the peak period for forage growth. The average temperature of the coldest month (January) is -21 °C, while that of the hottest month (July) is 20 °C. The annual mean evaporation is 1505 ± 45.4 mm ([1]; Table 1). The constructive (edificatory) species in the study area were Stipa grandis and Leymus chinensis, while the dominant plant species included Carex duriuscula, Stipa krylovii, Artemisia frigida, Chenopodium acuminatum, Cleistogenes squarrosa, and Allium polyrhizum. The climate, soil, terrain, vegetation type, production method (mainly grazing), and stocking rate between Naran Soum and Naren Soum were similar.

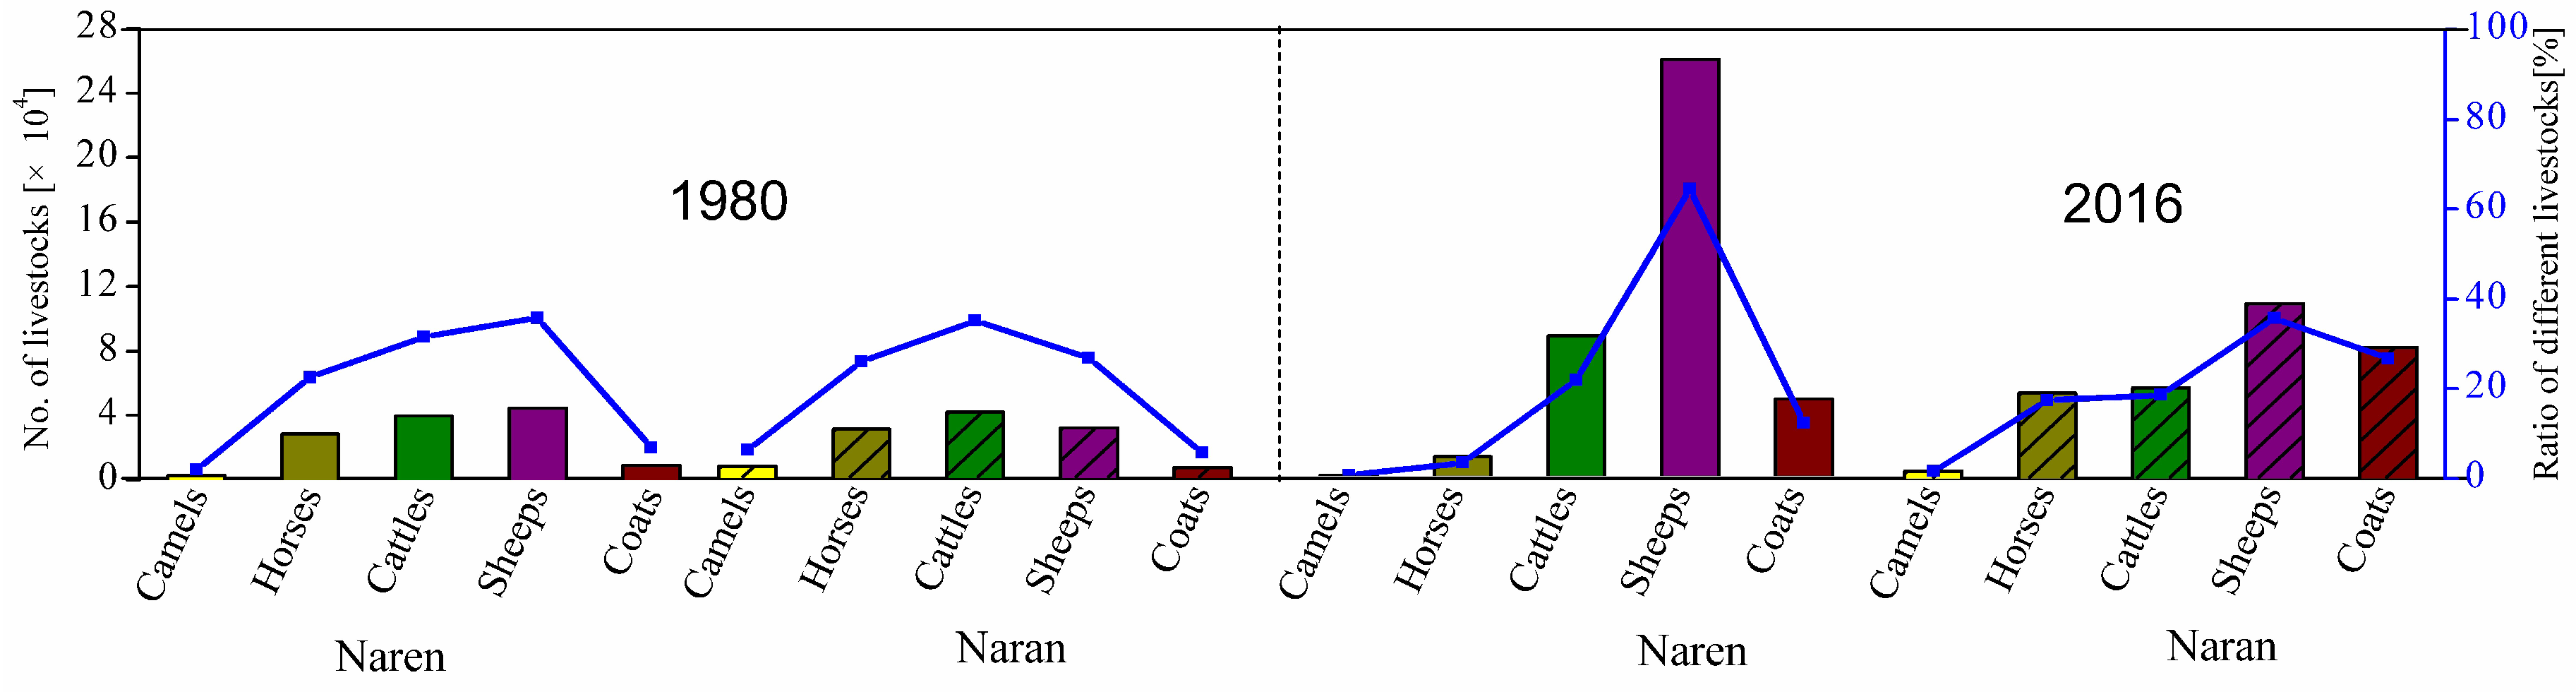
2.2. Evolution of Grazing Systems in Mongolia and Inner Mongolia

For historical reasons, Mongolia and Inner Mongolia (China) were divided in early 19th century [6]. Subsequently, the two countries adopted different grazing systems for grassland management: Mongolia retained primarily nomadic grazing, while in Inner Mongolia, nomadic grazing was replaced with continuous grazing [7]. This continuous grazing system has become particularly prevalent after the Grassland Contracting System Policy was implemented in 1990; this policy requires herders to use fences to surround their own pastures and to implement continuous grazing ([16]; Table 2). In Inner Mongolia, the Grassland Contracting System Policy adapts the pasture contracting system to local conditions. Contracted pasture areas are delineated based on the village as a unit, and contracted pasture areas are divided among households based on the size of the population, the number of livestock, pasture grade, and grazing habits. After discussion and approval by the village committee, collective pastures are typically leased to herder households for 50 years [16]. In Mongolia, nomadic grazing (i.e., two, three, or four-season rotational grazing) is carried out by the herders according to the specifics of the pasture and seasonal changes [17].

2.3. Sampling and Measurement

2.3.1. Field Sampling and Data Collection

Field sampling was performed from late July to mid-August 2016 in two cross-border, neighboring soums (one on each side of the China-Mongolia border), with identical, natural, and typical steppe conditions. Using belt transect and quadrat methods, and ensuring random uniform distribution of the quadrats, Google Earth and GPS were used to set up three sample belts perpendicular to the border (belt length: 40 km; passing through Mongolia and Inner Mongolia), and seven sample belts parallel to the border (belt length: 20 km; four in Mongolia and three in Inner Mongolia). In Mongolia, the sample belt nearest to the border was located within a sealed management area, 5 km from the border. Grazing is prohibited in this area. Sampling points were set up in triplicate, at 150 m intervals, at the intersections of the perpendicular and parallel sample belts. Our study site consisted of 61 quadrats, each with an area of 1 m × 1 m. In each quadrat, we measured several indices of grassland health: quadrat aboveground biomass, mean height, plant density, coverage, and species abundance. Quadrat aboveground biomass was measured by cutting plants at the ground surface, and measuring the fresh weight on-site using an electronic balance with a precision of 0.01 g. Mean height was determined by measuring the heights of all of the plant species three times with a measuring tape, and then taking the average value. Plant density represented the number of individual plants in the quadrat, counted manually. Coverage was defined as the proportion of the quadrat area that was occupied by the vertically projected area of aboveground organs of the plants in the quadrat. Three observers made independent visual measurements and these measurements were averaged. Species abundance was calculated based on the number of distinct plant species in the quadrat.

2.3.2. Remote Sensing Data Processing

Remote sensing TM and ETM data for the study area were obtained for five cloudless days during the study period: 3 August 1989, 15 September 1993, 14 July 2005, 31 July 2011, and 13 August 2016 (rows/samples: 126/29; http://earthexplorer.usgs.gov). The spatial resolution was 30 m, and the bands used were primarily the red band (0.66 μm) and the near infrared band (0.84 μm). The dynamic variations in vegetation at the sampling points were obtained after geometric correction, atmospheric correction, radiometric calibration, Soil Adjusted Vegetation Index (SAVI) calculation, extraction by mask, and statistical analysis.
To ensure that the SAVI values used were representative, for each of the 61 pixels representing a sampling site, we calculated the SAVIs of the eight pixels surrounding each site. We then used the mean SAVI of these nine pixels as the SAVI for the sampling site.

2.4. Analysis Methods

2.4.1. Calculation of Dominance of Major Species

In grassland studies, “important value” is always used to indicate species dominance [18]. Important value is calculated as
Important   value ( % ) =   Relative   coverage   +   Releative   density   +   Relative   frequency   +   Relative   height 4 ,
where
Relative   coverage = Coverage   of   a   certain   species Sum   of   all   coverages   of   all   species × 100 ,
Relative   density = Number   of   individuals   for   a   certain   species Number   of   individuals   for   all   species × 100 ,
Relative   frequency = Frequency   of   a   certain   species Sum   of   all   frequencies   for   all   species × 100 ,
Relative   height = Average   height   of   a   certain   species Sum   of   average   heights   of   all   species × 100 ,

2.4.2. Calculation of SAVI

SAVI, which minimizes the impact of soil reflectance on vegetation coverage, was calculated as:
SAVI = ( N I R     R ) ( 1   +   L ) ( N I R   +   R   +   L ) ,
where NIR and R were the near infrared (0.84 μm) and red (0.66 μm) bands, respectively, of the Landsat TM remote sensing images. It has been suggested that soil reflectance is more efficiently eliminated when L is 0.5 [19].

2.4.3. Correlation between Aboveground Biomass and SAVI

We randomly selected 45 of the 61 sample plots in the study area, and measured the aboveground biomass in these plots. Of the 45 selected plots, 20 were in Mongolia, 20 were in Inner Mongolia, and 5 samples were in the grazing prohibited areas of the cross-border region. We then determined the optimal regression, modeling the relationship between the measured aboveground biomass and the corresponding SAVI value.
To evaluate the accuracy of the model, the relative mean deviations between the measured and simulated aboveground biomass values for the remaining 16 sample plots were calculated as:
Relative   mean   deviation = i = 1 n | B g B m | i = 1 n B g × 100 % ,
where B g was the measured aboveground biomass, B m was the model-simulated aboveground biomass, and n was the total number of quadrats.

2.5. Statistical Analysis

Excel 2013 (©Microsoft Corporation, Washington, USA) was used to tabulate plant community, meteorological, and livestock data. ENVI 5.0 (©Harris, Boulder, USA) and ArcGIS 10.0 (©ESRI, RedLands, USA) were used to process the remote sensing data and to calculate SAVI. We performed randomization significance tests [20] for SAVI and quadrat data in Inner Mongolia (China), Mongolia, and the cross-border grazing prohibited area, as well as the meteorological and livestock data for China and Mongolia in R (https://www.r-project.org/). We considered p < 0.05 as statistically significant.

3. Results

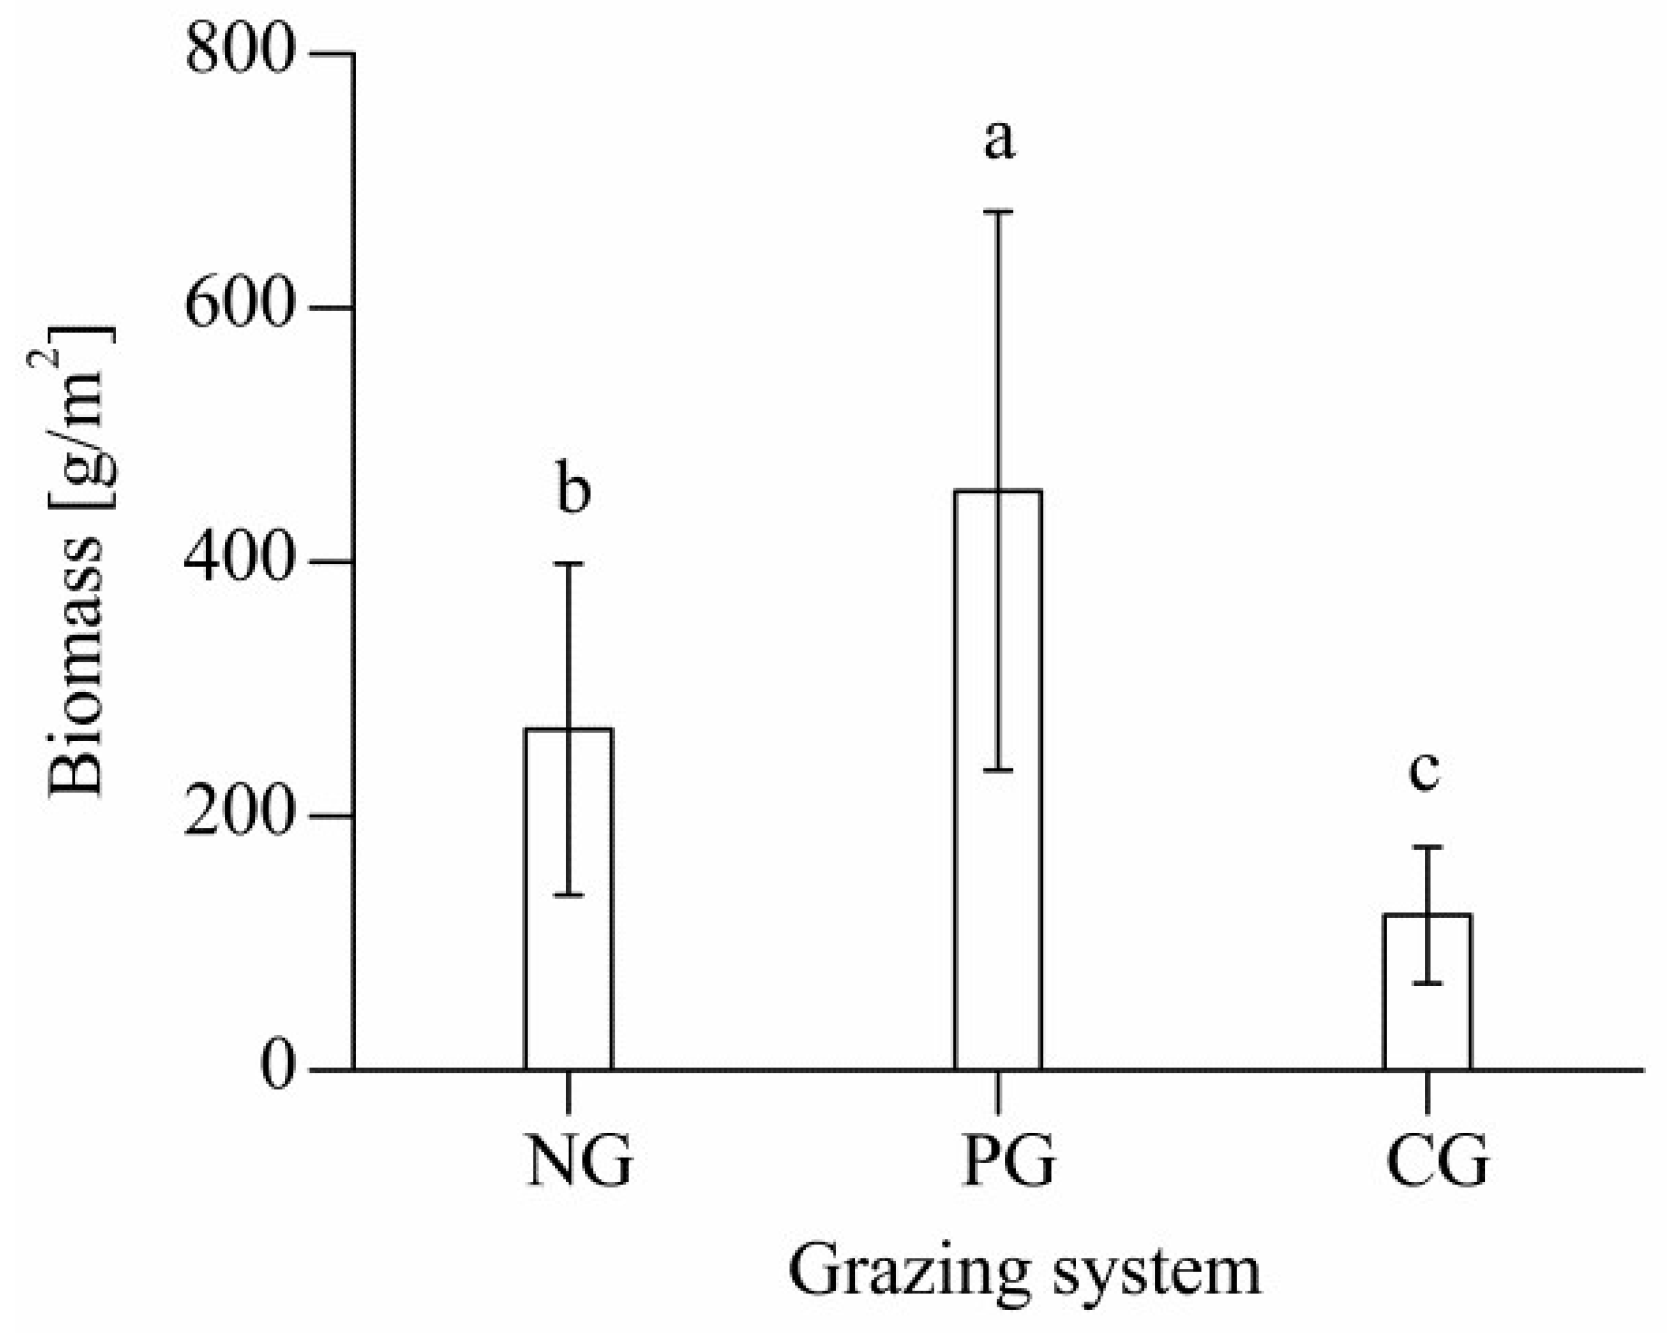
3.1. Aboveground Biomass of Different Grazing Sites

The mean aboveground plant biomass in plots where grazing was prohibited (455.9 ± 219 g) was significantly greater than the mean aboveground plant biomass in plots subjected to nomadic grazing (268.4 ± 130 g; p < 0.05); the mean aboveground plant biomass in each of these types of plots was significantly greater than the mean aboveground plant biomass in plots subjected to continuous grazing (122.2 ± 54 g; p < 0.05; Figure 2).

3.2. Dominant Plant Species at Different Grazing Sites

Dominance can indicate the relative importance of plant species within a community, as well as the most suitable habitat for a given plant [18].
Here, we analyzed species with a community dominance greater than 3%. C. duriuscula, L. chinensis, S. krylovii, C. acuminatum, C. squarrosa, A. frigida, A. polyrhizum, Salsola collina, S. grandis, and Allium tenuissimum dominated the grassland communities, irrespective of grazing systems; these plants comprised 72.46% of the entire plant community (Table 3).
The 10 species with dominance greater than 3% across the entire study site were affected by different degree of degradation (Table 4). With refer to the previous study [21,22,23], these 10 species can be grouped as either dominant under no degradation (two species), dominant under light degradation (one species), dominant under medium degradation (four species), and dominant under high degradation (three species).

3.2.1. Dominant Species in Non-Degraded Areas

Two species, L. chinensis and S. grandis, were dominant in non-degraded areas, comprising 28.71% of the plants in the grazing-prohibited areas, 14.42% of the plants in the nomadic-grazing areas, and 11.24% of the plants in the continuous-grazing areas. The dominance of these species did not vary significantly among grazing systems (p > 0.05). S. grandis was significantly more dominant in non-grazing areas than in nomadic and continuous-grazing areas (p < 0.05); there was no significant difference in S. grandis dominance between nomadic- and continuous-grazing areas (p > 0.05).

3.2.2. Dominant Species in Lightly Degraded Areas

One species, S. krylovii, was dominant in lightly degraded areas, comprising 14.13% of the plants in the continuous-grazing areas, 3.46% of the plants in the nomadic-grazing areas, and 2.46% of the plants in the grazing-prohibited areas. S. krylovii was significantly more dominant in areas with continuous grazing than in those with nomadic-grazing or where grazing was prohibited (p < 0.05); there was no significant difference in S. krylovii dominance between nomadic-grazing areas and areas where grazing was prohibited (p > 0.05).

3.2.3. Dominant Species in Moderately Degraded Areas

Four species, C. duriuscula, A. frigida, A. polyrhizum, and A. tenuissimum, were dominant in moderately degraded areas, comprising 36.28% of the plants in the nomadic-grazing areas, 27.46% of the plants in the continuous-grazing areas, and 24.88% of the plants in the grazing-prohibited areas. C. duriuscula was significantly more dominant in the nomadic-grazing areas than in the grazing-prohibited or continuous-grazing areas (p < 0.05); there was no significant difference in C. duriuscula dominance between grazing-prohibited and continuous-grazing areas (p > 0.05). There were no significant differences in the dominance of either A. frigida or A. polyrhizum among the three grazing systems (p > 0.05). A. tenuissimum was significantly more dominant in continuous-grazing areas than in nomadic-grazing areas (p < 0.05), but there were no significant differences in A. tenuissimum dominance between continuous-grazing and grazing-prohibited areas, or between grazing-prohibited and nomadic-grazing areas (p > 0.05).

3.2.4. Dominant Species in Heavily Degraded Areas

Three species, C. squarrosa, C. acuminatum, and S. collina, were dominant in heavily degraded areas, comprising 22.83% of the plants in the continuous-grazing areas, 16.01% of the plants in the nomadic-grazing areas, and 12.59% of the plants in the grazing-prohibited areas. C. squarrosa was significantly more dominant in the continuous-grazing areas than in the nomadic-grazing or grazing-prohibited areas (p < 0.05); there was no significant difference in C. squarrosa abundance between nomadic-grazing and grazing-prohibited areas (p > 0.05). There were no significant differences in the dominance of either C. acuminatum or S. collina among the three systems (p > 0.05).

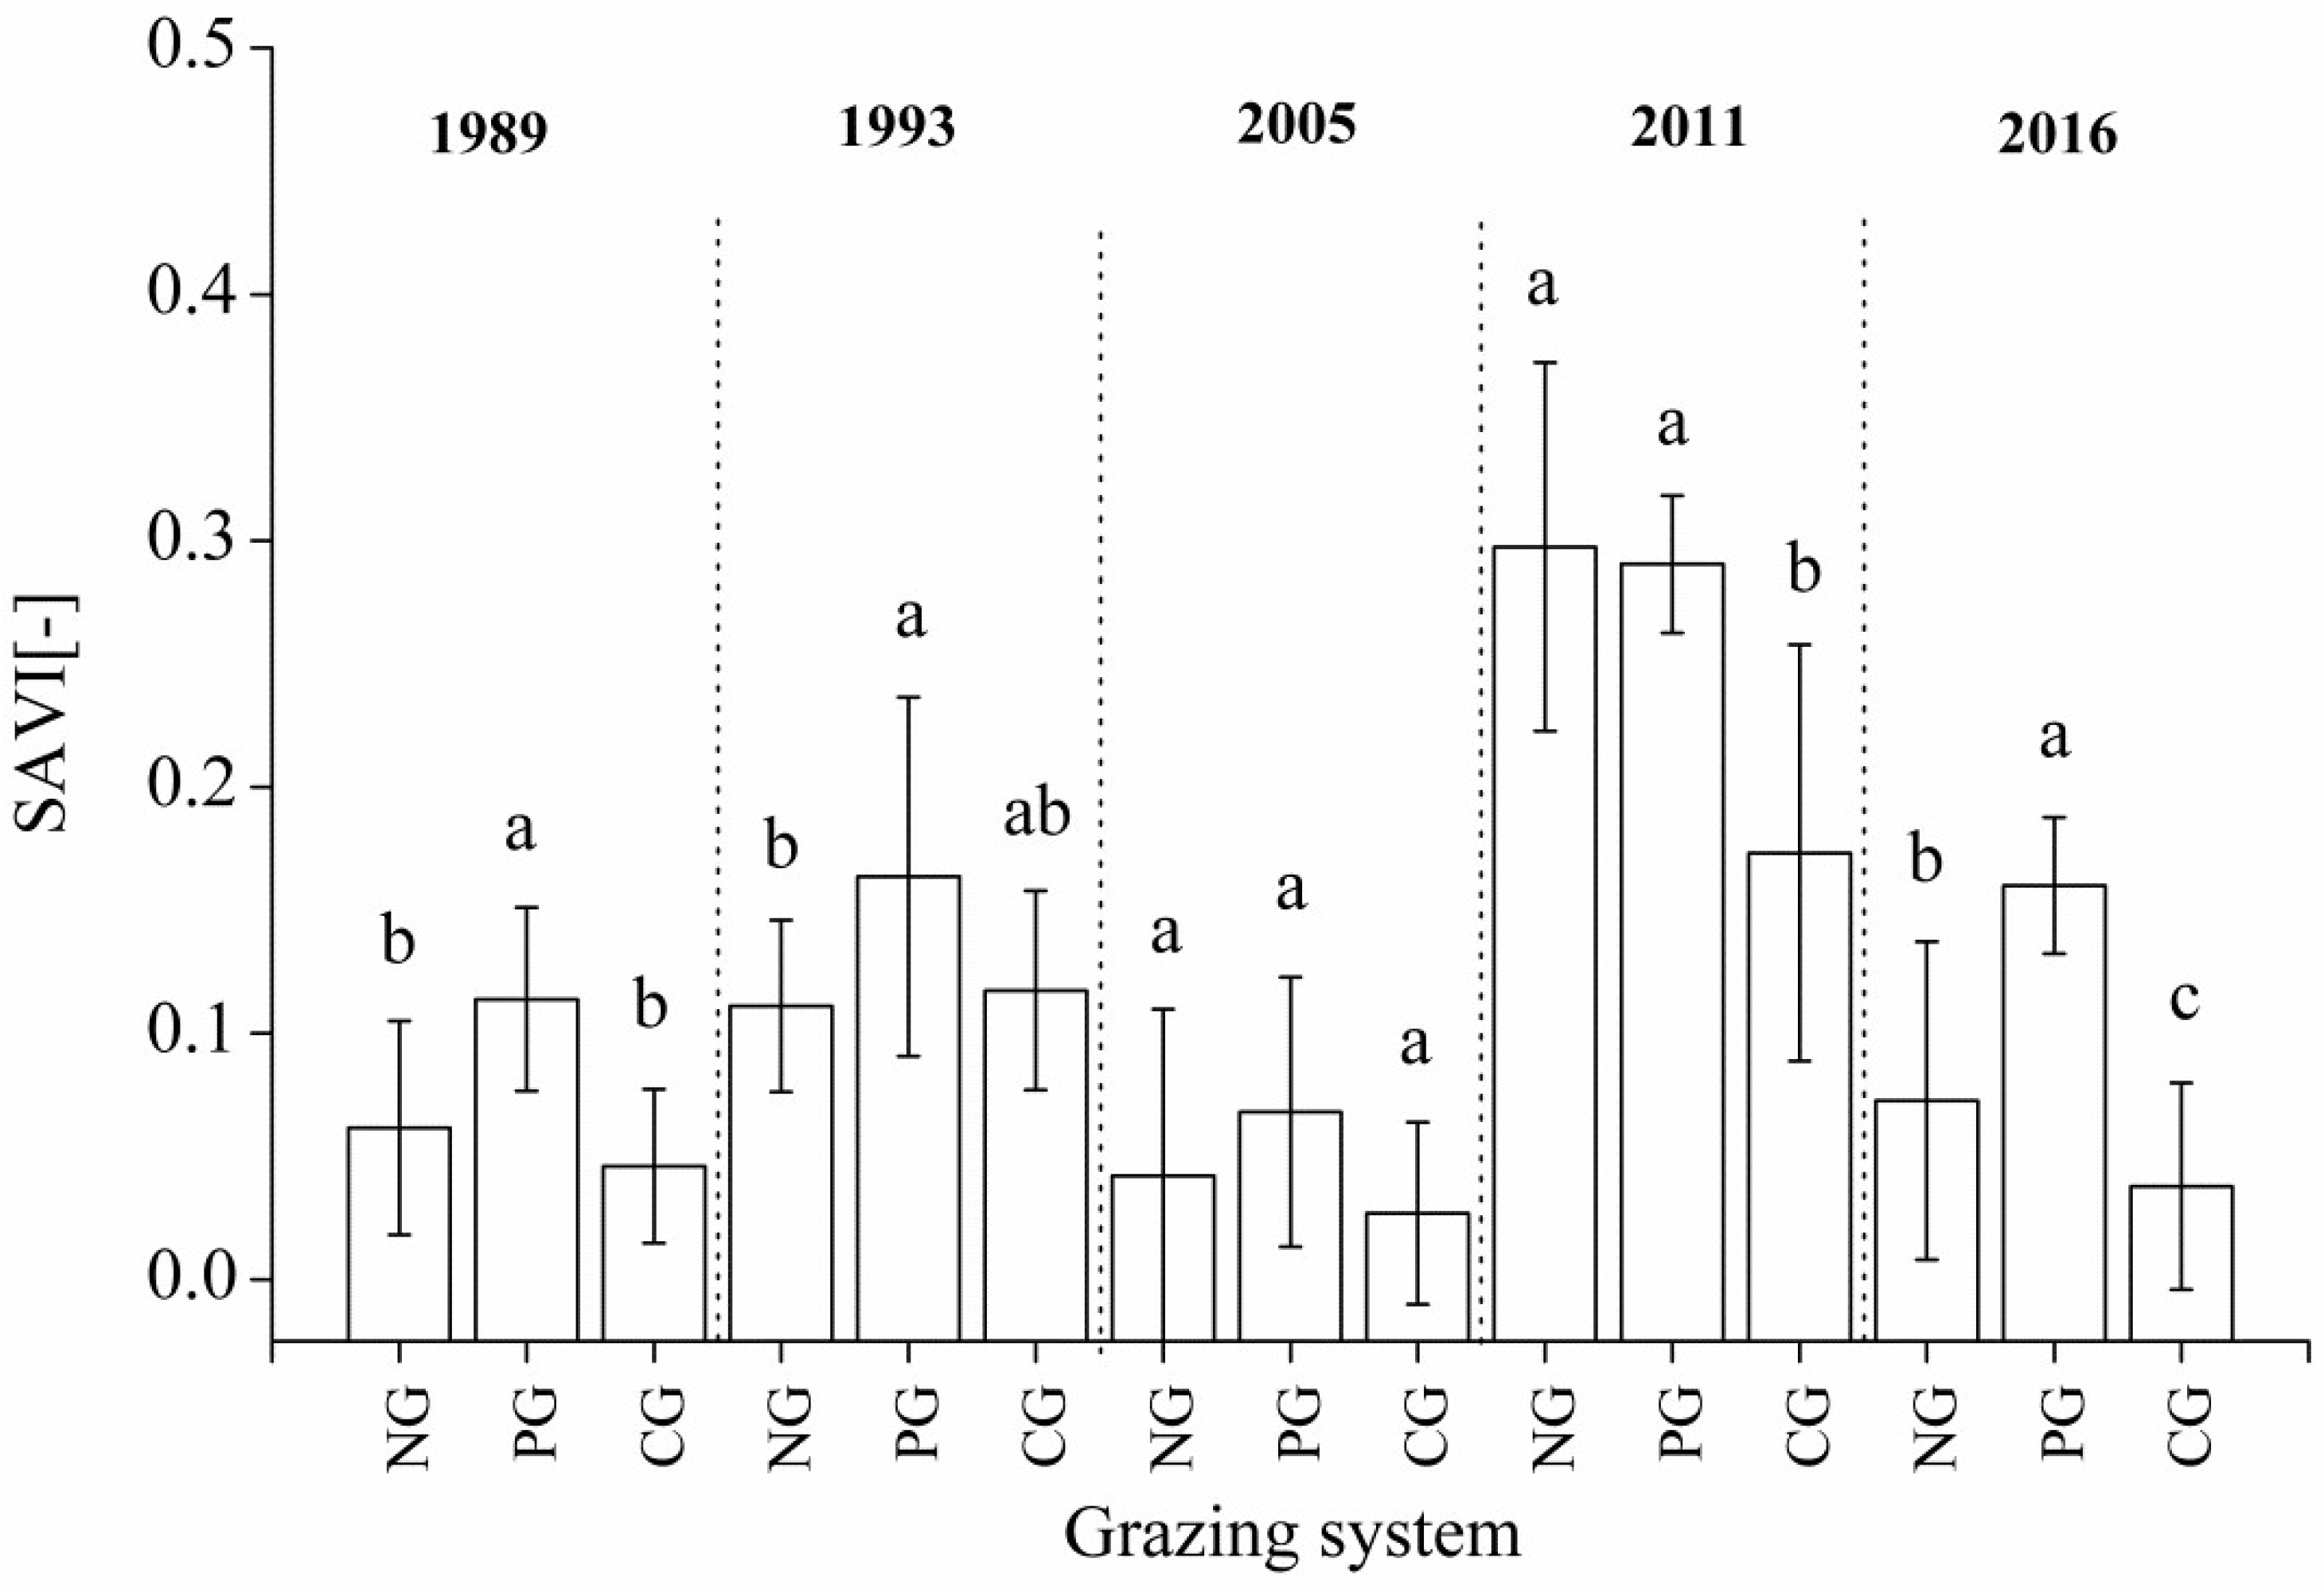
3.3. Changes in SAVI under Different Grazing Systems

SAVI values for continuous and nomadic-grazing areas did not change significantly among 1989, 1993, and 2005 (p > 0.05; Figure 3). However, the SAVI values for the nomadic-grazing areas were significantly greater than those for the continuous-grazing areas in 2011 and 2016 (p < 0.05; Figure 3). SAVI values for the grazing-prohibited areas were significantly greater than those for the nomadic-grazing areas in 1989, 1993, and 2016 (p < 0.05; Figure 3); the SAVI values for these areas were not significantly different in 2005 and 2011 (p > 0.05). The SAVI values for the grazing-prohibited areas were significantly greater than those for the continuous-grazing in areas in 1989, 2005, 2011, and 2016 (p < 0.05; Figure 3). There was no significant difference in SAVI values between these two areas in 1993 (p > 0.05).

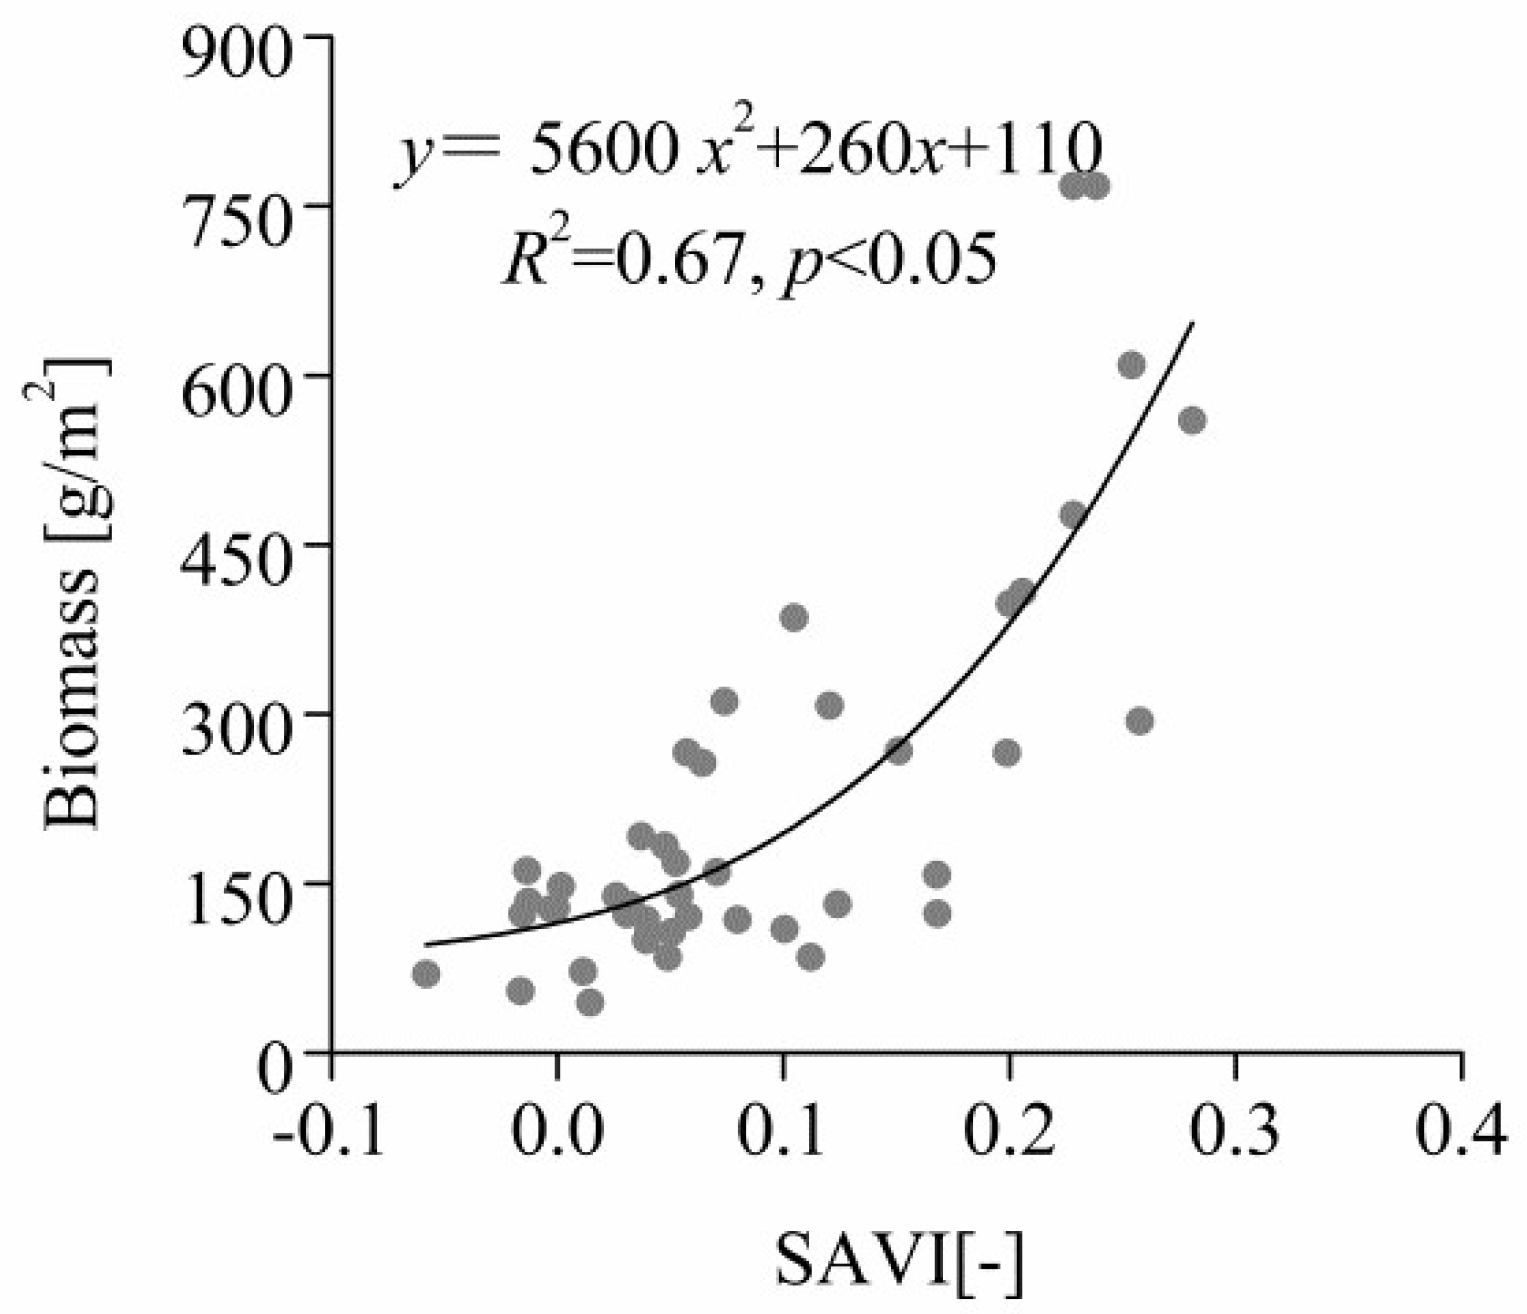
3.4. Correlation between Total Aboveground Biomass and SAVI in Quadrats

Aboveground biomass was well correlated with SAVI (Figure 4); the regression between these variables was y = 5600x2 + 260x + 110 (R2 = 0.67; p < 0.05). The relative mean deviation between the model-simulated aboveground biomass and the measured aboveground biomass was 29.1%.

4. Discussion

4.1. Effects of Different Grazing Systems on Total Aboveground Biomass in Plant Communities

Herbivores are ‘ecosystem engineers’ on grasslands, and their feeding behaviors directly affect aboveground plant biomass and plant community biodiversity [18,24].
Here, aboveground biomass levels in the grazing-prohibited areas were significantly greater than levels in nomadic or continuous-grazing areas (Figure 2), consistent with several previous studies [25]. It is likely that feeding, trampling, and other behaviors of grazing livestock lead to decreases in plant leaf area, reducing photosynthetic capacity, and change forage structures, thereby affecting the aboveground biomasses of plant communities [26]. However, some studies have shown that, after grazing prohibitions eliminate livestock interference, dominant plant species monopolize resources; indeed, the fierce competition among species and individuals may suppress or inhibit less competitive species, which may cause overall aboveground biomass to decrease [27,28,29].
It was likely that aboveground biomass was greater in the nomadic-grazing areas than in the continuous-grazing areas because nomadic grazing is based on how sensitive forage is to grazing at different developmental stages [30]. This artificial control allows grasslands to be maintained above the lowest physiological growth threshold for sustaining function and health. During the regrowth phase, vegetation gradually returns to healthy, pre-grazing levels, and raises the upper limit for physiological growth [31]. This ultimately increases both forage yield and grazing capacity per unit area [32,33].

4.2. Effects of Different Grazing Systems on the Community Dominance of Major Species

Climate change and long-term feeding behaviors have altered the dominant species in typical steppe areas [34,35]. Our results suggested that, as S. grandis + L. chinensis grassland communities are degraded, these plants are replaced by C. duriuscula, A. frigida, and C. squarrosa; as the grassland community degrades further, C. duriuscula, C. squarrosa, A. polyrhizum, C. acuminatum, and S. collina become dominant. Perennial Gramineae species, such as L. chinensis and S. grandis, which originally dominated, were gradually replaced by perennial weeds (such as A. frigida, A. polyrhizum, and A. tenuissimum) and annuals (such as C. acuminatum and S. collina). The community structure becomes simpler, and native species are gradually replaced by xerophytes and halophytes [21,22].
S. krylovii, which dominated in lightly degraded areas, was most dominant in continuous-grazing areas, followed by nomadic-grazing and grazing-prohibited areas. As grasslands are degraded, S. krylovii replaces S. grandis. Continuous grazing in Inner Mongolia has led to the separation of larger pastures into many small pastures, reducing accessibility. This decreases the numbers of horses and camels that primarily feed on Stipa species (Figure 5).
In Mongolian nomadic grazing areas, the numbers of horses and camels remained stable over the study period. In addition, in contrast to continuous grazing, livestock move freely under the nomadic grazing system, and different types of livestock use different pastures in different seasons. This allows Stipa plants to be consumed before maturation, when their nutritional value is optimal.

4.3. Effects of Different Grazing Systems on Community SAVI Changes

Across all of the time points, the SAVI values for the continuous-grazing areas were lower than those of the nomadic grazing areas (Figure 3). This suggested that grassland degradation under continuous grazing was greater than that under nomadic grazing. Nomadic grazing rotates pasture use by season (i.e., at spring, summer, autumn, and winter camps). While no fences are used, the principles of this grazing method are similar to those of rotational grazing.
Several studies have suggested that rotational grazing increases forage yield and grassland utilization rate [36,37]. This is particularly relevant for the selection of a suitable grazing system for a given geographical area, in order to prevent grassland degradation [38,39]. However, Bailey et al. (2010) proposed that in arid and semi-arid shrub lands, timely adjustments to grazing animal numbers, in conjunction with practices to improve grazing distribution at regional and landscape scales, were more likely to effectively maintain or improve rangeland health than fencing and nomadic grazing [40,41]. In contrast, Angell et al. (2001) showed that, when grassland conditions were poor, rotational grazing promoted the recovery of grassland vegetation, although this effect was less pronounced when the grassland condition was good [42].
Precipitation strongly affected the evolution of the plant communities on the Mongolian Plateau [15]. The annual precipitation in both soums decreased significantly between 1989 and 2016 (Figure 6) (p > 0.05). This decrease in precipitation might explain much of the observed degradation of the plant communities across the study area. Indeed, annual precipitation decreased more sharply in Naren Soum than in Naran Soum, consistent with the greater degree of degradation observed in Naren Soum.
In 2011, annual precipitation in Naran Soum (217.56 mm) was greater than average (216.80 mm; average precipitation 1971–2016), and the SAVI values for nomadic grazing areas were higher than those for grazing-prohibited areas. These results were consistent with previous studies, which showed that appropriate levels of grazing resulted in maximal plant and functional diversity, and thus might lead to overall increases in plant species abundance and biomass [11,43].

4.4. Correlation between Total Aboveground Biomass and SAVI in Quadrats

Vegetation biomass estimation based on remote sensing is important for remote sensing applications [44]. Several studies have shown strong correlations between biomass and vegetation indices [45]. In particular, typical steppe vegetation indices, calculated based on the TM red and near-infrared bands, are strongly correlated with aboveground biomass [46,47].
At present, several vegetation indices are used to estimate aboveground biomass, including NDVI, RVI, DVI, EVI, GNDVI, and SAVI [48]. As SAVI is very sensitive to soil background changes [19], this index is suitable for monitoring grasslands with relatively sparse vegetation, such as the Mongolian Plateau [48,49].
Here, we constructed a regression model based the relationship between aboveground biomass and SAVI. The values predicted by this regression model were generally similar to the actual measured values: The relative mean deviation between the model-simulated aboveground biomass and the measured biomass was 29.1%. Thus, the use of a regression formula to predict the typical steppe biomass was feasible and effective.

5. Conclusions

Under continuous grazing, the dominant plants were those that dominated in lightly and heavily degraded areas; under nomadic grazing, the dominant plants were those that dominated in moderately degraded areas; and without grazing, the dominant plants were those that dominated in undegraded areas. Aboveground biomass was greatest in the grazing-prohibited areas, followed by the nomadic-grazing areas and the continuous-grazing areas. There was a strong positive correlation between aboveground biomass and SAVI. There were no significant differences in SAVI between nomadic and continuous grazing at three time points before 2011, but there were significant differences in SAVI between the two types of grazing at two time points after 2011. This indicated that grasslands were more seriously degraded by continuous grazing than by nomadic grazing. In summary, in areas with consistent ecological characteristics and grazing intensities, nomadic grazing has a less significant impact than continuous grazing.

Author Contributions

Conceptualization, J.X. and B.H.; field investigation and data collection, Y.N., S.B., and P.M.; writing—original draft preparation, Y.N.; writing—review and editing, F.Q.; software, Y.N.

Funding

This research was funded by the National Natural Science Foundation of China [The Comparative Study of Change Mechanism of Steppe Community under the Way of Nomadic and Set-stocking in a Typical Steppe Pastoral Area-with the corresponding Gacha Haote on both sides of China and Mongolia border for an example] grant number [41561009], [Study on the Response mechanism of vegetation communities to different grazing systems in typical steppe region of China and Mongolia] grant number [GJHZ201705], [Study on the difference of vegetation communities in the meadow steppe and the causes of economic management in the intersection area of China and Mongolia] grant number [NJZY17158] and the National Natural Science Foundation of China [Soil Micro-structure Characteristics of Typical Steppe in Inner Mongolia and Its Relationship with Water Movement under Different Grazing Intensity of China] grant number [41561050].

Conflicts of Interest

The authors declare no conflict of interest.

References

  1. Qin, F.Y.; Jia, G.S.; Yang, J.; Na, Y.T.; Hou, M.T.; Narenmandula. Spatiotemporal variability of precipitation during 1961–2014 across the Mongolian Plateau. J. Mt. Sci. 2018, 15, 992–1005. [Google Scholar] [CrossRef]
  2. Na, Y.T.; Bao, S.; Hashimoto, K.; Mccarthy, C.; Hoshino, B. The Effects of Grazing Systems on Plant Communities in Steppe Lands—A Case Study from Mongolia’s Pastoralists and Inner Mongolian Settlement Areas. Land 2018, 7, 10. [Google Scholar] [CrossRef]
  3. Fang, J.; Bai, Y.; Wu, J. Towards a better understanding of landscape patterns and ecosystem processes of the Mongolian Plateau. Landsc. Ecol. 2015, 30, 1573–1578. [Google Scholar] [CrossRef]
  4. Jun, L.W.; Ali, S.H.; Zhang, Q. Property rights and grassland degradation: A study of the Xilingol pasture, Inner Mongolia, China. J. Environ. Manag. 2007, 85, 461–470. [Google Scholar] [CrossRef] [PubMed]
  5. Batoyun, T.; Shinoda, M.; Cheng, Y.; Purevdorj, Y. Effects of grazing and precipitation variability on vegetation dynamics in a Mongolian dry steppe. J. Plant Ecol. 2016, 9, 508–519. [Google Scholar] [CrossRef] [Green Version]
  6. Li, W.; Huntsinger, L. China’s Grassland Contract Policy and its Impacts on Herder Ability to Benefit in Inner Mongolia: Tragic Feedbacks. Ecol. Soc. 2011, 16, 1–13. [Google Scholar] [CrossRef]
  7. Zhang, M.D.A.; Borjigin, E.; Zhang, H. Mongolian nomadic culture and ecological culture: On the ecological reconstruction in the agro-pastoral mosaic zone in Northern China. Ecol. Econ. 2007, 62, 19–26. [Google Scholar] [CrossRef]
  8. Na, Y.; Wulan, T.; Qin, F. Dynamic monitoring of Horqin sandy land desertification based on 3S techniques—A case study in Horqin Left Wing Banner. J. Arid Land Resour. Environ. 2010, 24, 50–54. (In Chinese) [Google Scholar]
  9. Kang, S.; Lee, G.; Togtokh, C.; Jang, K. Characterizing regional precipitation-driven lake area change in Mongolia. J. Arid Land 2015, 7, 146–158. [Google Scholar] [CrossRef]
  10. Jiang, L.G.; Yao, Z.J.; Huang, H.Q. Climate variability and change on the Mongolian Plateau: Historical variation and future predictions. Clim. Res. 2016, 67, 1–14. [Google Scholar] [CrossRef]
  11. Schönbach, P.; Wan, H.; Gierus, M.; Bai, Y.; Müller, K.; Lin, L.; Susenbeth, A.; Taube, F. Grassland responses to grazing: Effects of grazing intensity and management system in an Inner Mongolian steppe ecosystem. Plant Soil 2011, 340, 103–115. [Google Scholar] [CrossRef]
  12. Qi, X.; Quan, S.; Yu, J.; Mei, S. Studies on matter dynamics and plant compensatory growth under differrent grazing systems on meadow steppe. Grassl. China 2004, 26, 26–31. (In Chinese) [Google Scholar]
  13. Han, G.; Wei, Z. Experiment on rotational grazing system in stipa breviflora desert steppe. J. Inn. Mong. Inst. Agric. Anim. Husb. 2001, 22, 60–67. (In Chinese) [Google Scholar]
  14. John, R.; Chen, J.; Kim, Y.; Ou-Yang, Z.T.; Xiao, J.; Park, H.; Shao, C.; Zhang, Y.; Amarjargal, A.; Batkhshig, O. Differentiating anthropogenic modification and precipitation-driven change on vegetation productivity on the Mongolian Plateau. Landsc. Ecol. 2016, 31, 547–566. [Google Scholar] [CrossRef]
  15. Wang, Z.; Zhang, Q.; Xin, X.; Ding, Y.; Hou, X.; Sarula; Li, X.; Chen, H.; Yin, Y.; Hu, J. Response of the annual biomass production of a typical steppe plant community to precipitation fluctuations. Rangel. J. 2014, 36, 527–534. [Google Scholar] [CrossRef] [Green Version]
  16. Hai, S. Study on the Relationship between Human and Land in Inner Mongolia Pasture, 1st ed.; Inner Mongolian Education Press: Hohhot, China, 2013; pp. 131–143. [Google Scholar]
  17. Fujita, N.; Amartuvshin, N.; Yamada, Y.; Matsui, K.; Sakai, S.; Yamamura, N. Positive and negative effects of livestock grazing on plant diversity of Mongolian nomadic pasturelands along a slope with soil moisture gradient. Grassl. Sci. 2009, 55, 126–134. [Google Scholar] [CrossRef]
  18. Zhang, J.T. Sampling Methods and Community Characterization; Sciences Publisher: Beijing, China, 2011; pp. 20–35. [Google Scholar]
  19. Huete, A.R. A soil-adjusted vegetation index (SAVI). Remote Sens. Environ. 1988, 25, 295–309. [Google Scholar] [CrossRef]
  20. Gotelli, N.J.; Ulrich, W.; Maestre, F.T. Randomization tests for quantifying species importance to ecosystem function. Methods Ecol. Evol. 2011, 2, 634–642. [Google Scholar] [CrossRef] [Green Version]
  21. Liu, Z.L.; Wang, W.; Hao, D.Y.; Liang, C.Z. Probes on the Degeneration and Recovery Succession Mechanisms of Inner Mongolia Steppe. J. Arid Land Resour. Environ. 2002, 16, 84–91. (In Chinese) [Google Scholar]
  22. Wang, W.; Liu, Z.L.; Hao, D.Y.; Liang, C.Z. Research on the restoring succession of the degenerated grassland in Inner Mongolia—I. Basic characteristics and driving force for restoration of the degenerated grassland. Acta Phytoecol. Sin. 1996, 20, 449–459. (In Chinese) [Google Scholar]
  23. Wang, R.Z. Photosynthetic pathways, life forms, and reproductive types for forage species along the desertification gradient on hunshandake desert, north china. Photosynthetica 2002, 40, 321–329. [Google Scholar] [CrossRef]
  24. Milchunas, D.G.; Lauenroth, W.K.; Chapman, P.L.; Kazempour, M.K. Effects of grazing, topography, and precipitation on the structure of a semiarid grassland. Vegetatio 1989, 80, 11–23. [Google Scholar] [CrossRef]
  25. Li, S.X.; Wang, Q.J.; Jing, Z.C.; Wang, W.Y. The effects of protective enclosure on vegetation diversity, and productivity of degraded alpine Kobresia meadow (Qinghai-Tibetan Plateau). Pol. J. Ecol. 2009, 57, 495–502. [Google Scholar]
  26. Milchunas, D.G.; Lauenroth, W.K. Quantitative Effects of Grazing on Vegetation and Soils Over a Global Range of Environments. Ecol. Monogr. 1993, 63, 328–366. [Google Scholar] [CrossRef]
  27. Metera, E.; Sakowski, T.; Słoniewski, K.; Romanowicz, B. Grazing as a tool to maintain biodiversity of grassland—A review. Anim. Sci. Pap. Rep. 2010, 28, 315–334. [Google Scholar]
  28. Li, X.U.; Gao, Q.; Wang, Y. Species richness within a six-year slope exclosure in a temperate grassland and its relationship with aboveground biomass. Ecol. Environ. Sci. 2014, 23, 398–405. (In Chinese) [Google Scholar]
  29. Casasus, I.; Bernues, A.; Sanz, A.; Villalba, D.; Riedel, J.L.; Revilla, R. Vegetation dynamics in Mediterranean forest pastures as affected by beef cattle grazing. Agr. Ecosyst. Environ. 2007, 121, 365–370. [Google Scholar] [CrossRef]
  30. Oesterheld, M.; Mcnaughton, S.J. Interactive Effect of Flooding and Grazing on the Growth of Serengeti Grasses. Oecologia 1991, 88, 153–156. [Google Scholar] [CrossRef]
  31. Bai, Y.; Li, D.; Xu, Z.; Wei, Z. Growth and reproduction of Stipa krylovii population on a grazing gradient. Acta Ecol. Sin. 1999, 19, 479–484. (In Chinese) [Google Scholar]
  32. Martin, S.C. Responses of semidesert grasses to seasonal rest. J. Range Manag. 1973, 26, 165–170. [Google Scholar] [CrossRef]
  33. Holechek, J.L.; Hilton, G.; Francisco, M.; Dee, G. Grazing studies: What we’ve learned. Rangelands 1999, 21, 12–16. [Google Scholar]
  34. Li, C.L.; Hao, X.Y.; Zhao, M.L.; Han, G.D.; Willms, W.D. Influence of historic sheep grazing on vegetation and soil properties of a Desert Steppe in Inner Mongolia. Agr. Ecosyst. Environ. 2008, 128, 109–116. [Google Scholar] [CrossRef]
  35. Bai, Y.; Wu, J.; Clark, C.M.; Pan, Q.; Zhang, L.; Chen, S.; Wang, Q.; Han, X. Grazing alters ecosystem functioning and C:N:P stoichiometry of grasslands along a regional precipitation gradient. J. Appl. Ecol. 2012, 49, 1204–1215. [Google Scholar] [CrossRef] [Green Version]
  36. Taylor, C.A.J.; Brooks, T.D.; Garza, N.E. Effects of short duration and high-intensity, low-frequency grazing systems on forage production and composition. J. Range Manag. 1993, 46, 118–121. [Google Scholar] [CrossRef]
  37. Hyder, D.N.; Sawyer, W.A. Rotation-Deferred Grazing as Compared to Season-Long Grazing on Sagebrush-Bunchgrass Ranges in Oregon. J. Range Manag. 1951, 4, 30–34. [Google Scholar] [CrossRef]
  38. Carter, J.; Catlin, J.C.; Hurwitz, N.; Jones, A.L.; Ratner, J. Upland Water and Deferred Rotation Effects on Cattle Use in Riparian and Upland Areas. Rangelands 2017, 39, 112–118. [Google Scholar] [CrossRef]
  39. Schönbach, P.; Wan, H.; Schiborra, A.; Gierus, M.; Bai, Y.; Müller, K.; Glindemann, T.; Wang, C.; Susenbeth, A.; Taube, F. Short-term management and stocking rate effects of grazing sheep on herbage quality and productivity of Inner Mongolia steppe. Crop Pasture Sci. 2009, 60, 963–974. [Google Scholar] [CrossRef]
  40. Bailey, D.W.; Thomas, M.G.; Walker, J.W.; Witmore, B.K.; Tolleson, D. Effect of Previous Experience on Grazing Patterns and Diet Selection of Brangus Cows in the Chihuahuan Desert. Rangel. Ecol. Manag. 2010, 63, 223–232. [Google Scholar] [CrossRef]
  41. Peterson, D.; Brownlee, M.; Kelley, T. Stocking Density Affects Diet Selection. Rangelands 2013, 35, 62–66. [Google Scholar] [CrossRef]
  42. Angell, D.L.; Mcclaran, M.P. Long-term influences of livestock management and a non-native grass on grass dynamics in the Desert Grassland. J. Arid Environ. 2001, 49, 507–520. [Google Scholar] [CrossRef]
  43. Ren, H.Y.; Zheng, S.X.; Bai, Y.F. Effects of grazing on foliage biomass allocation of grassland communities in Xilin River Basin, Inner Mongolia. Chin. J. Plant Ecol. 2009, 33, 1065–1074. (In Chinese) [Google Scholar]
  44. Kogan, F.; Stark, R.; Gitelson, A.; Jargalsaikhan, L.; Dugrajav, C.; Tsooj, S. Derivation of pasture biomass in Mongolia from AVHRR-based vegetation health indices. Int. J. Remote Sens. 2004, 25, 2889–2896. [Google Scholar] [CrossRef]
  45. Flynn, E.S.; Dougherty, C.T.; Wendroth, O. Assessment of Pasture Biomass with the Normalized Difference Vegetation Index from Active Ground-Based Sensors. Agron. J. 2008, 100, 114–121. [Google Scholar] [CrossRef]
  46. Todd, S.W.; Hoffer, R.M.; Milchunas, D.G. Biomass estimation on grazed and ungrazed rangelands using spectral indices. Int. J. Remote Sens. 1998, 19, 427–438. [Google Scholar] [CrossRef]
  47. Li, S.Y.; Li, X.B.; Ying, G.; Fu, N. Vegetation indexes-biomass models for typical semi-arid steppe: A case study for Xilinhot in Northern China. Chin. J. Plant Ecol. 2007, 31, 23–31. (In Chinese) [Google Scholar]
  48. Ren, H.R.; Zhou, G.S. Determination of green aboveground biomass in desert steppe using litter-soil-adjusted vegetation index. Eur. Eur. J. Remote Sens. 2014, 47, 611–625. [Google Scholar] [CrossRef] [Green Version]
  49. Zhang, Y.; Yin, X.J.; Wang, W.Q.; Wang, C.J.; Lu, W.H.; Sun, S.Z.; Gao, J. Estimation of grassland aboveground biomass using Landsat 8 OLI satellite image in the northern hillside of Tianshan Mountain. Remote Sens. Technol. Appl. 2017, 32, 1012–1021. (In Chinese) [Google Scholar]
Figure 1. Study area and design of the field sampling experiment.
Sustainability 10 04753 g001
Figure 2. Mean aboveground biomass for sites with different grazing systems. Different letters above bars indicate significant differences (p < 0.05). NG, nomadic grazing; PG, grazing prohibited; and CG, continuous grazing.
Sustainability 10 04753 g002
Figure 3. Changes in SAVI values among sites with different grazing systems over time. NG, nomadic grazing; PG, grazing prohibited; and CG, continuous grazing. Different lowercase letters above bars indicate significant differences (p < 0.05).
Sustainability 10 04753 g003
Figure 4. Scatter plot showing the correlation between total aboveground biomass and SAVI.
Sustainability 10 04753 g004
Figure 5. Changes in the number of grazing animals in 1980 and 2016 (converted to sheep). Data were obtained from the government offices of Naran Soum and Naren Soum. According to China’s national sheep unit conversion standard, 1 camel = 7 sheep, 1 horse = 6 sheep, 1 cow = 5 sheep, and 1 goat = 1 sheep.
Sustainability 10 04753 g005
Figure 6. Left: Inter-annual variability of annual precipitation in the Naran and Naren Soums during 1989–2016; Right: Annual precipitation in the Naran and Naren Soums for the five different periods with multi-year average line (1971–2016).
Sustainability 10 04753 g006
Table 1. Details of the ecological parameters of the study area.
Ecological FactorsNaran SoumNaren Soum
Annual mean temperature (°C)1.41a1.03a
Annual accumulated precipitation (mm)216.80a187.07b
Altitude (m)1356.21a1346.39a
Average annual evaporation (mm)1505.14a1498.52a
Average stocking rate (sheep unit/km2)42a50a
Soil typeChestnut soilChestnut soil
Soil volume water content7.5%a6.9%b
Note: Different lower-case letters appended to values within a row indicate a significant difference (p < 0.05). The Xilin Gol League Meteorological Bureau and The National Agency for Meteorology and Environment Monitoring of Mongolia provided meteorological data. Stocking rate: the total number of livestock animals in a given quadrat/total area of pasture. Livestock data and pasture area were obtained from historical statistical data, in situ survey, and local residents. According to China’s national sheep unit conversion standard, 1 camel = 7 sheep; 1 horse = 6 sheep; 1 cow = 5 sheep; and 1 goat = 1 sheep. Soil humidity (soil volume water content) was measured with portable TDR6500 analyzer (©Hydrosense, Made in Australia) at a depth of 20 cm.
Table 2. Evolution of grazing systems in Mongolia and Inner Mongolia, China.
CountryMongoliaInner Mongolia
Time Period 1958–19901990–Today1978–19901990–Today
Livestock OwnershipCommonPrivatePrivatePrivate
Pasture OwnershipCommonCommonCommonPrivate
Grazing MethodNomadicNomadicNomadicContinuous
Table 3. Plant species with an average dominance of more than 3% in the study area.
SpeciesDominance (%)OrderLDLife formFamily
Carex duriuscula16.1 ± 10.561MDPerennial weedsCyperaceae
Leymus chinensis10.99 ± 9.942NDPerennial grassGramineae
Stipa krylovii8.11 ± 9.403LDPerennial grassGramineae
Chenopodium acuminatum7.36 ± 6.414HDAnnual grassChenopodiaceae
Cleistogenes squarrosa6.62 ± 5.635HDPerennial grassGramineae
Artemisia frigida6.32 ± 5.306MDPerennial weedsCompositae
Allium polyrhizum5.47 ± 6.267MDPerennial weedsLiliaceae
Salsola collina4.66 ± 4.038HDAnnual grassChenopodiaceae
Stipa grandis3.66 ± 8.349NDPerennial grassGramineae
Allium tenuissimum3.16 ± 2.9010MDPerennial weedsLiliaceae
72.46%
Note: LD, different levels of grassland degradation; ND, non-degraded; LD, lightly degraded; MD, moderately degraded; and HD, heavily degraded.
Table 4. Dominance of major species under different grazing systems.
LDSpeciesNG (%)DLD (%)FG (%)DLD (%)CG (%)DLD (%)
NDLeymus chinensis11.15 ± 13.23a 15.91 ± 6.44a 9.56 ± 5.91a
Stipa grandis3.27 ± 6.93b14.4212.8 ± 13.68a28.711.68 ± 6.53b11.24
LDStipa krylovii3.46 ± 5.08b3.462.84 ± 5.07b2.8414.13 ± 10.23a14.13
MDCarex duriuscula22.27 ± 10.24a 10.67 ± 10.66b 11.37 ± 7.45b
Artemisia frigida6.68 ± 6.34a 5.61 ± 5.37a 6.15 ± 4.2a
Allium polyrhizum5.34 ± 7.99a 5.01 ± 3.84a 5.71 ± 4.81a
Allium tenuissimum1.99 ± 2.33b36.283.59 ± 2.5ab24.884.23 ± 3.15a27.46
HDChenopodium acuminatum6.34 ± 5.65a 6.58 ± 7.77a 8.57 ± 6.8a
Cleistogenes squarrosa5.52 ± 4.18b 3.57 ± 2.5b 8.51 ± 6.85a
Salsola collina4.15 ± 3.71a16.012.44 ± 3.1a12.595.75 ± 4.32a22.83
Note: Different lower-case letters appended to values within a row indicate a significant difference (p < 0.05). NG, nomadic grazing; PG, grazing prohibited; CG, continuous grazing; LD, different levels of grassland degradation; ND, non-degraded; LD, lightly degraded; MD, moderately degraded; HD, heavily degraded; and DLD, Dominance of different levels grassland degradation.

