Article

Characteristics and Influencing Factors of Spatial Differentiation of Urban Black and Odorous Waters in China

1
Key Laboratory of Hubei Province, Analysis and Simulation of Geographic Process, Central China Normal University, No.152 Luoyu Road, Wuhan 430079, China
2
The College of Urban and Environmental Sciences, Central China Normal University, No.152 Luoyu Road, Wuhan 430079, China
*
Author to whom correspondence should be addressed.
These authors contributed equally to this work.
Sustainability 2018, 10(12), 4747; https://doi.org/10.3390/su10124747
Submission received: 14 November 2018 / Revised: 7 December 2018 / Accepted: 10 December 2018 / Published: 12 December 2018
(This article belongs to the Special Issue Spatial Analysis of Urbanization towards Urban Sustainability)

Abstract

:
The pollution problem caused by urban black and odorous waters has received much attention from the Chinese government. Our research aims at systematically identifying the characteristics and the influential factors of spatial differentiation of urban black and odorous waters across China. The research, based on the data of 2100 black and odorous waters in China, was conducted with the spatial analysis tool of ArcGIS. We found that the amount of Chinese urban black and odorous waters varied in spatial distribution, which was an agglomerated type with significant agglomeration. The kernel density was characterized by independent single kernel centers with ribbon-like and sporadic distributions of subcenters. The cold and hot spots showed a gradient distribution pattern of cold in the southwest and hot in the central east. These spatial distribution characteristics could be attributed to the following core factors, total wastewater discharge, length of urban drainage pipelines, municipal solid waste collection, daily urban sewage treatment capacity, and investment in urban pollution treatment of wastewater. The findings reveal the current geospatial distribution of black and odorous waters pollution and provide reference for the Chinese government to treat the pollution from several key points. Lastly, it is suggested that the Chinese government should establish joint control, joint prevention, and joint treatment mechanisms in the black and odorous waters areas and improve the safety standards of the whole water environment, so as to promote the treatment and elimination of urban black and odorous waters.

1. Introduction

The developing areas of China are facing serious environmental problems such as water pollution, air pollution, land pollution, and solid waste pollution [1]. During the four decades of reform and opening up, rapid economic growth has occurred in China, with an average annual growth rate of 8%, which makes it Asia’s largest economy and the world’s second largest economy; however, economic growth is happening at the cost of serious pollution and ecological degradation [2,3]. Among the 423 major rivers in China, most of them show a seasonal or perennial phenomenon of black water with odor, and surface and ground waters are widely polluted by industrial and urban wastewater [4,5]. According to statistics, approximately 190 million Chinese have suffered from illness due to water pollution, and 60,000 of them die each year [6]. One of the causes for these illnesses is the existence of urban black and odorous waters. During the process of economic and social development, water bodies with an unpleasant color or smell that emerge within urban built-up areas are collectively referred to as urban black and odorous waters. Currently, these black and odorous waters are regarded as a prominent problem regarding the water environment and urban pollution because they do not only destroy ecosystems such as rivers, lakes, and ponds but also greatly harm resident productivity, life, and health [7,8]. In 2014, the Chinese Premier Li Keqiang publicly announced the “War on Pollution”. In 2015, the central government of China issued the Action Plan for the Prevention and Control of Water Pollution, which explicitly stated that the black and odorous waters in built-up areas of the prefecture and higher-level cities should be controlled below 10% by 2020, and urban black and odorous waters be eliminated overall by 2030 [9]. In May 2018, the National Conference of Ecological Environment Protection in China proposed to generally eliminate urban black and odorous waters, and return the people “a scene of clear water and green banks with fish swimming at the shallow bottom”, as an important target of repairing the ecological environment. Therefore, a systematic study of the problem of urban black and odorous waters in China is of great practical significance.
The problem of urban black and odorous waters is essentially a typical problem of water pollution. Water pollution not only harms human health but also more directly threatens and damages the water environment and aquatic life. Concerning the special research on black and odorous waters, the earliest study started from the treatment of “The Great Stink” in the Thames, United Kingdom, in 1858 [10]. Subsequent studies on black and odorous waters have gradually involved the definition of macro and micro connotations and concepts [11,12], the causes for black color and odor [13,14], and the resultant changes in ambient air quality [15,16]. Studies have shown that the discharge of urban wastewater into Mediterranean streams has seriously changed the composition and function of river communities, whereas microplastics in water have become a new source of surface water pollution in China’s inland [17,18]. Additionally, industrial wastewater, agricultural activities, and urban runoff pollution are the main sources for water quality change in the Qiantang River [19]. Some researchers have noted that water pollution has had a serious negative effect on human health in China and has emerged as the main source of morbidity and mortality in this country; common pollutants in industrial wastewater show the most pronounced intensity of impact [20]. Water pollution caused by the use of pesticides can have a more direct adverse effect on human health through drinking water [21]. Other researchers have found that the urban environmental pollution information transparency index, urban multidimensional water consumption, and energy production play a role in facilitating water pollution [22,23]. A more interesting study quantitatively analyzed the distribution of water pollution in the urban areas of Tokyo based on the perception level of odor by human olfaction [24]. Besides, some researchers also study the monitoring, identification, and evaluation index systems and methods [25,26,27]; and the treatment techniques and practical exploration [28,29,30]. Most of these studies adopt the experimental methods and data of applied mathematics and botany. Other studies take Chinese villages for example and use observations and interviews to explain the influences of water pollution on the transformations of Chinese rural clans and Chinese society [31].
Based on the above studies, most research regarding the problems of urban water pollution has focused on the impacts of water pollution on human society and natural environment, whereas the research on the problem of urban black and odorous waters has also focused on the harm, impacts, and treatment measures. Given the fluidity of rivers and the spatial proximity mechanism of economic development, a need exists to study the spatial distribution laws of urban black and odorous waters and their influencing factors in China to answer the following questions. Are there significant spatial agglomeration and proximity laws? What factors are related to the distribution of urban black and odorous waters in China? Can the treatment of urban black and odorous waters be implemented in China through joint treatment at the regional level, with treatment measures learned from the same type of cities? This study was conducted to contribute in the following aspects, (1) to explore the spatial distribution pattern of urban black and odorous waters and their laws in China, (2) to detect important factors that influence the formation of the spatial characteristics of urban black and odorous waters in China, and (3) to discuss the driving scheme for the management and elimination of urban black and odorous waters in China. The results of this study provide a scientific reference for the Chinese government to understand and treat urban black and odorous waters and the overall water environment in this country.
The article is organized as follows. The first section discusses the significance of studying Chinese urban black and odorous waters and explains the target of our research. The second section introduces the data source, indicator selection, and study methods. The third section analyzes the characteristics and influential factors of the spatial distribution of Chinese urban black and odorous waters. The fourth section, based on the previous section, discusses the practical meaning of these findings and reflects on the limitations of our research. The last section is the conclusion.

2. Study Methods and Data Sources

2.1. Data Sources and Indicator Selection

The data used in this study mainly included data on urban black and odorous waters in China, data on socioeconomic development, and data on basic geographic information. Data details are as follows.

2.1.1. Data on Urban Black and Odorous Waters in China

This dataset was derived from the website of National Urban Black and Odorous Water Body Remediation Information Distribution jointly designed by the Ministry of Ecology and Environment and the Ministry of Housing and Urban-Rural Development of China (http://www.hcstzz.com). The data of black and odorous waters mainly included the water name, water type (river, lake, or pond), administrative division, river/lake/pond name, unit name, black-odorous level (mild or severe), and positioning. The total number of urban black and odorous waters identified in China was 2100 as of 31 December 2017. According to the black-odorous level, 711 were severe black and odorous waters, whereas 1389 were mild waters (black-odorous level was graded by the Ministry of Ecology and Environment according to the characteristic indicator values of black and odorous waters, such as their transparency, dissolved oxygen, redox potential, and ammonium nitrogen). With regard to the location of these waters, there were 1793 in rivers, 103 in lakes, and 204 in ponds. On the official website (http://www.hcstzz.com), the data of Chinese urban black and odorous waters were stored in the formats of texts and tables. Through scientific analysis, the data together with the vector data of the Chinese map were stored in the format of ArcGIS vector data; as were the data on Chinese social and economic developments.

2.1.2. Data on Social and Economic Development

This dataset was derived from the China Statistical Yearbook 2017 and the 2017 Statistical Yearbooks of different provinces in China (except for Hong Kong, Macau, and Taiwan due to limited data availability). The data mainly included indicators such as urban population density, per capita gross domestic product (GDP), per capita water resources, total wastewater discharge, and daily urban sewage treatment capacity.

2.1.3. Data of Basic Geographic Information of Chinese Map

This dataset was derived from the Standard Map Service Website of the State Bureau of Surveying, Mapping and Geographic Information of China (http://bzdt.nasg.gov.cn). Data of basic geographic information of Chinese map is kept in the format of ArcGIS vector data. The obtained data of basic geographic information of Chinese map were geospatially matched with the data of urban black and odorous waters. First, detailed geographic coordinate information of urban black and odorous waters was acquired according to their positioning information in Google Maps. Second, the accurate coordinate information of black and odorous waters was imported into ArcGIS 10.2 for registration and coordinate projection conversion with the calibrated map of China. This procedure established a spatial attribute database for urban black and odorous waters in China, including all the information of urban black and odorous waters and the data of indicators for the influencing factors. Finally, the geospatial distribution map of urban black and odorous waters in China was obtained by spatial visualization. Figure 1 shows the geospatial distribution map of urban black and odorous waters in China.
As for the selection of geodetection factors, most existing studies on water pollution, water environment, and water resources have used per capita GDP, population, total water consumption, and sewage treatment rate as indicators of the influencing factors [1,32,33]. Herein, we fully considered the actual situation of urban development in China and the accessibility and scientificity of the data, and we selected nine representative indicators as factors influencing the spatial distribution characteristics of the urban black and odorous waters in China in Table 1. Effort was made to depict the influence relationship between the selected factors and the spatial distribution pattern of the black and odorous waters.

2.2. Study Methods

2.2.1. Nearest Neighbor Index

Generally, point elements show three types of distribution in the space: random, agglomerated, and uniform. In this study, the nearest neighbor index was used to determine the distribution type of urban black and odorous waters in China. The results reflected the mutual proximity of point elements in geospacer [34]. The index value was calculated as follows
R = r 1 ¯ r E ¯
where R is the nearest neighbor index of black and odorous waters, r 1 ¯ is the average actual nearest distance of black and odorous water points, r E ¯ = 1 2 D = 1 2 n / A is the theoretical nearest distance of black and odorous water points, A is the area of administrative region in China, n is the number of black and odorous water points, and D is the point density. R = 1 indicates that the points of black and odorous waters generally show a random distribution, whereas R > 1 indicates a uniform distribution and R < 1 indicates an agglomerated distribution.

2.2.2. Kernel Density Estimation

Kernel density estimation assumes that, within a defined study area, the geographic events of any point set can occur at any locations in space, but the probability of occurrence at different locations is inconsistent. The probability of occurrence of events is higher in an area with dense points, whereas it is lower in an area with sparse points [35]. In this study, the spatial distribution density of the black and odorous water points was analyzed by kernel density estimation [36] as follows
f ^ ( x ) = 1 n h d i = 1 n K ( x x i h )
where f ^ ( x ) is the kernel density function of black and odorous waters, x i is the black and odorous water point set to be estimated, h is the threshold (bandwidth) for the search radius distance, n is the number of black and odorous water points in the range of threshold, and d is the dimension f ^ of the number of black and odorous water points.

2.2.3. Spatial Correlation Analysis

Spatial autocorrelation analysis is an analytical method that measures whether the value of a certain attribute in a point element has a correlation with that of the neighbor point element in geospace [37]. Here, we selected Moran’s I and the Getis-Ord Gi* to analyze the spatial autocorrelation of black and odorous waters, namely, to explore the structural model of spatial correlation in black and odorous waters and to analyze differences in the distribution of spatial cold and hot spots [38,39]. Moran’s I is a measure of spatial correlation model, which is obtained using Equation (3):
I = i = 1 n i = 1 n W i j ( X i X ¯ ) / S 2 i = 1 n i = 1 n W i j
where X i , X j are the number of black and odorous waters in the geographic units of areas i and j , and W i j is the spatial weight matrix. If i and j are neighbors, W i j = 1; if i and j are not neighbors, W i j = 0. When the statistical value of Moran’s I is distributed in the range (−1, 1), a significantly positive value of Moran’s I (>0) indicates that the areas with a higher or lower distribution frequency of black and odorous waters are geospatially significantly agglomerated; a significantly negative Moran’s I value (<0) indicates that the distribution areas of black and odorous waters exhibit significant spatial differences in geospace; and a Moran’s I value close to zero indicates that the distribution areas of black and odorous waters are not correlated in the geospatial space [40].
The Getis-Ord Gi* is a measure of local spatial autocorrelation characteristics. After normalization of G i * ( d ) , the calculation is done as follows
Z ( G i * ) = G i * E ( G i * ) / V a r ( G i * )
where E ( G i * ) and V a r ( G i * ) are the mathematical expectations of ( G i * ) and its coefficient of variation, respectively. Positive and significant Z ( G i * ) indicates that many black and odorous waters surround the geographic unit at location i , which belongs to a hot spot with spatial agglomeration of high values; conversely, negative and significant Z ( G i * ) indicates a small number of black and odorous waters surrounds the geographic unit at location i , which belongs to the cold spot with spatial agglomeration of low values [41].

2.2.4. Geodetector Method

The geodetector method was established by Wang et al. [42,43,44] and has been used extensively, mainly in factor detection, risk detection, interactive detection, and ecological detection [45]. The present study was conducted using the factor detection module. The model used to detect factors that influence the spatial distribution characteristics of urban black and odorous waters in China is given below.
P D , L = 1 1 n σ L 2 i = 1 m n D , i σ L D , i 2
where P D , L is the detection force of influencing factor D on the spatial structure of black and odorous waters, m is the number of black and odorous waters in the primary area (the whole Chinese administrative region), n is the number of black and odorous waters in the secondary area (the areas of the east, the center, the west, the south, and the north of Chinese administrative region), n D , i is the variance of influence on the spatial structure of black and odorous waters in the primary area, and σ D , i 2 is the variance of influence on the spatial structure of black and odorous waters in the secondary area. P D , L [ 0 , 1 ] , a higher value of P D , L , indicates a stronger influence of factor L on the spatial structure of the black and odorous waters. In the calculated results, a higher q value means a higher level of influence by the factor on the spatial characteristics, whereas a lower q value suggests a lower level of influence by the factor on the spatial characteristics. Additionally, a higher p-value indicates a smaller explanatory power of the factor in influencing the spatial characteristics, whereas a lower p-value indicates a higher explanatory power of the factor in influencing the spatial characteristics. Normally, q representing a value of 0.3 or even higher indicates that the factor has a relatively large influencing power. Such a criteria is supported by some relevant studies [46].

3. Results

3.1. Spatial Differentiation Characteristics

3.1.1. Regional Distribution Characteristics

Regarding the provincial distribution, urban black and odorous waters were mainly concentrated in Guangdong, Anhui, Hunan, Shandong, Jiangsu, Hubei, and Henan provinces within range of the 31 provincial study areas identified. The total number of black and odorous waters in these top seven provinces reached 1220, that is, 58.1% of the national total. The number of black and odorous waters was less than 100 in each of the remaining 24 provinces. The smallest number of black and odorous waters was found in Xinjiang (two only), whereas no black and odorous waters were present in Tibet.
Across the seven major regions, the spatial distribution of urban black and odorous waters was characterized by a decreasing trend from East and Central China to North, Southwest, and Northwest China. In East China, the distribution of black and odorous waters was concentrated, and their number was the largest (469, 22.33%). The second largest number was found in Central China (34, 316.33%). The number of black and odorous waters in South China ranked the third largest (197, 9.38%). The smallest number of black and odorous waters appeared in Northwest China (50, 2.38% only).
With respect to the distribution in major urban agglomerations, we divided China’s major urban agglomerations into a national level (middle reach of Yangtze River, Beijing-Tianjin-Hebei, Yangtze River Delta, Chengdu-Chongqing, and Pearl River Delta), a regional level (north slope of Tianshan Mountain, Beibu Gulf, west coast of the Taiwan Strait, Shandong Peninsula, Harbin-Changchun, Zhongyuan, Central-southern Liaoning, and Guanzhong), and a local level (Lanzhou-Xining, central Yunnan, central Shanxi, central Sichuan, along the Yellow River in Ningxia, and Hohhot-Baotou-Erdos-Yulin). The urban black and odorous waters in China were mostly distributed in national urban agglomerations (922, 43.9%). In particular, the highest number of black and odorous waters was found in the Yangtze River Delta (316, 15.05%) among all the different types of urban agglomerations. The total number of black and odorous waters in local urban agglomerations ranked the lowest (115, 5.48% only). Figure 2 shows the distribution of the amount of Chinese black and odorous waters respectively in provinces, the seven main regions and major urban agglomerations.

3.1.2. Spatial Type Characteristics

Different types of black and odorous waters were subjected to calculations by using the nearest neighbor analysis tool in ArcGIS 10.2, and the results of the nearest neighbor index values were summarized in Table 2. The index values of all six types of black and odorous waters were far less than 1; the lowest value was 0.1416 for total waters, whereas the highest value was only 0.5057 for lakes. The average expected distances of all different types of waters were higher than the average observed distances. The Z scores were all negative and passed the confidence test, indicating an agglomerated distribution of urban black and odorous water in China, with significant agglomeration characteristics in space.

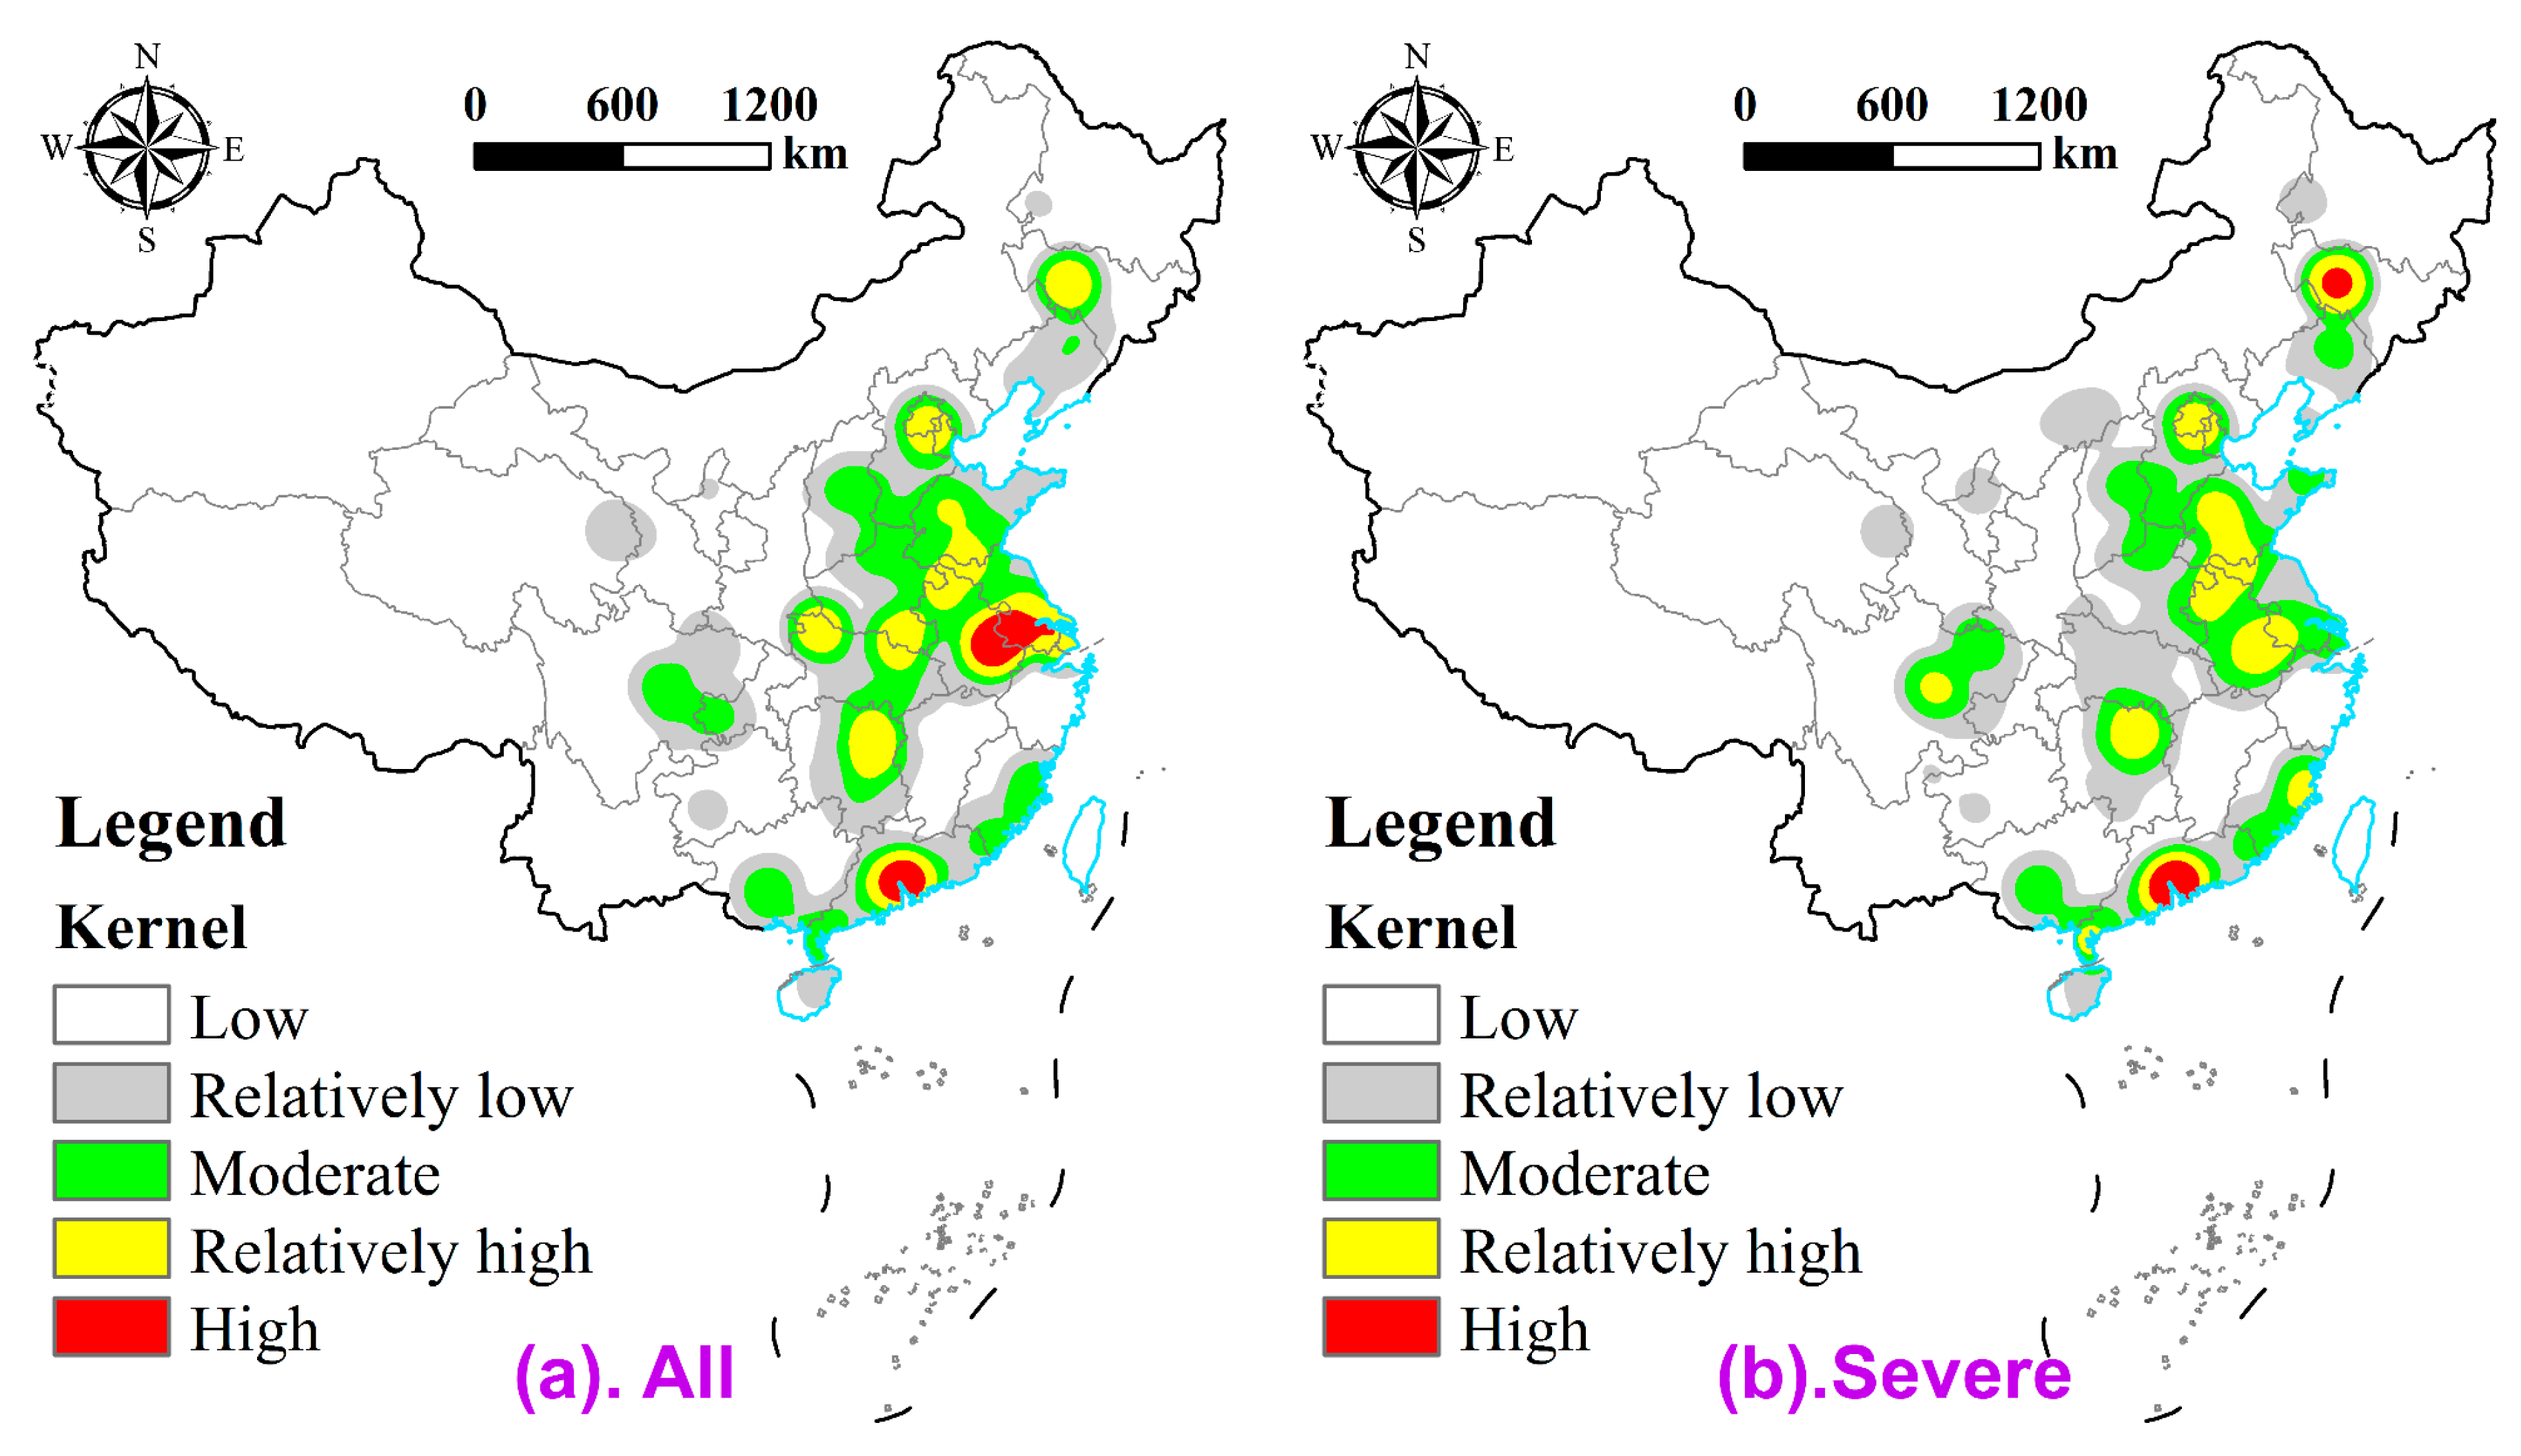
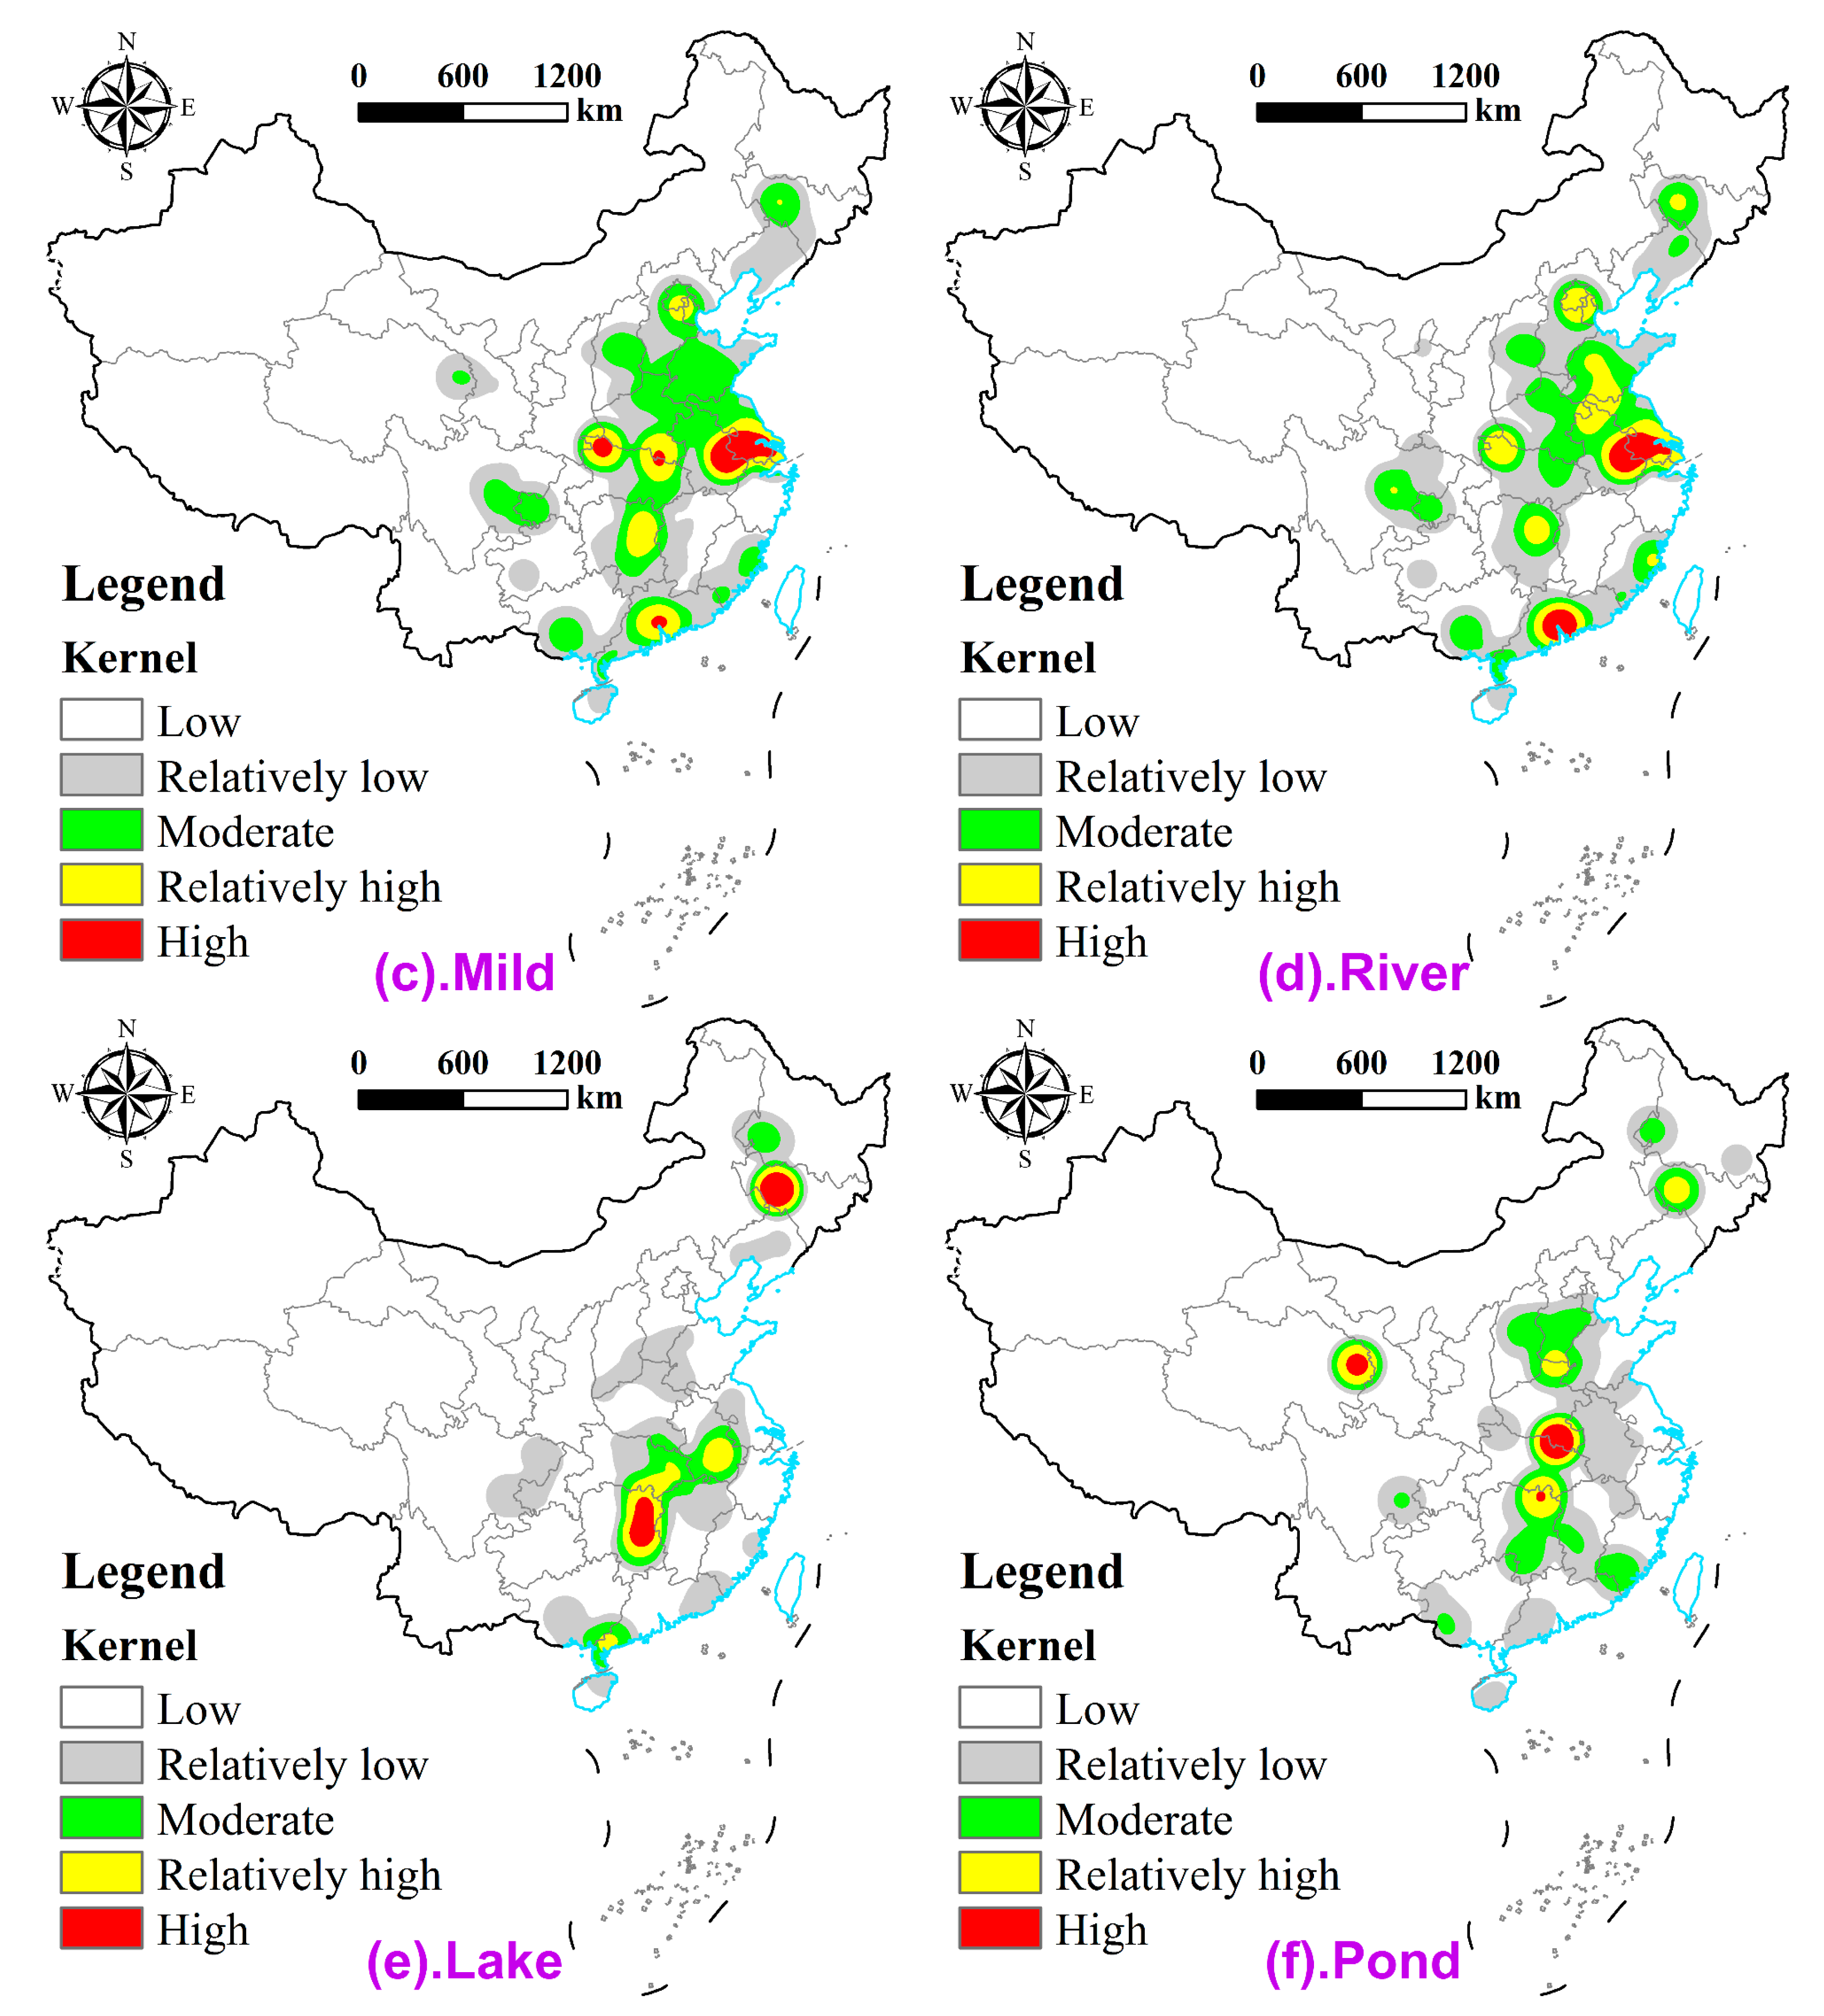
3.1.3. Spatial Density Characteristics

Overall characteristics. The distribution map of kernel density in Figure 3 illustrates that the spatial pattern of urban black and odorous waters in China was characterized by two independent single-kernel centers with ribbon-like and sporadic distribution of subcenters. The two single-kernel centers were, respectively, at the junction of Anhui and southern Jiangsu in the lower reach of Yangtze River and the central and southern areas of Guangdong. The kernel density of single-kernel centers ranged between 206.39 and 333.10 waters/104 km2. The subcenters extensions were distributed outwardly around the single-kernel center. A ribbon-like distribution of subcenters was observed in eastern Hunan, northwestern Hubei, southern Henan, southwestern Shandong, western Jilin, and most of Beijing, whereas a sporadic distribution was present in central-southern Guangxi and eastern Sichuan. The density values of the subcenters ranged from 66.62 to 121.48 waters/104 km2. Low kernel density values were observed in eastern Qinghai and most areas of Liaoning, around 22.21 waters/104 km2.
Characteristics of the pattern for the different types. The kernel density showed inconsistent distribution characteristics among the different types of black and odorous waters. Concerning the black-odorous level, severe black and odorous waters formed two polar kernel centers, mainly in the cities of Guangzhou and Changchun, with a kernel density of 23.5 to 48.16 waters/104 km2. By contrast, the black and odorous waters with lower density values were characterized by a significant sporadic distribution. The spatial distribution pattern of mild black and odorous waters presented four polar kernel centers, but their overall coverage was small, mainly in the major urban areas of Guangzhou, Xinyang, Shiyan, Wuhu, and Nanjing. Regarding the location of black and odorous waters, the high-density areas of those in rivers were mainly distributed in the Pearl River and the lower reaches of the Dong River in Guangdong, as well as the Anhui and Nanjing sections of Yangtze River, with the kernel density of 193.78 to 316.76 waters/104 km2. The kernel density of those waters in the lakes mainly radiated in central and northeast China, and high-density values were observed for Dongting Lake, Xiang River, and Liao River, with a kernel density of 23.21 to −40.53 waters/104 km2. The waters in ponds were characterized by a scattered distribution outward from a three-kernel single center comprising the cities of Xining (Qinghai), Yueyang (Hunan), and Xinyang (Anhui). The kernel density and coverage of black and odorous waters in lakes and ponds were relatively low. Generally, areas of high-value density frequency included the major urban areas, the lower reaches of the Yangtze River, and important lakes within the areas showing relatively mature economic and social development in the central-east, whereas the density frequency was low in areas with low development intensity in most areas of the southwest and north. This provides a spatial reference for accurate identification and remediation of black and odorous waters.

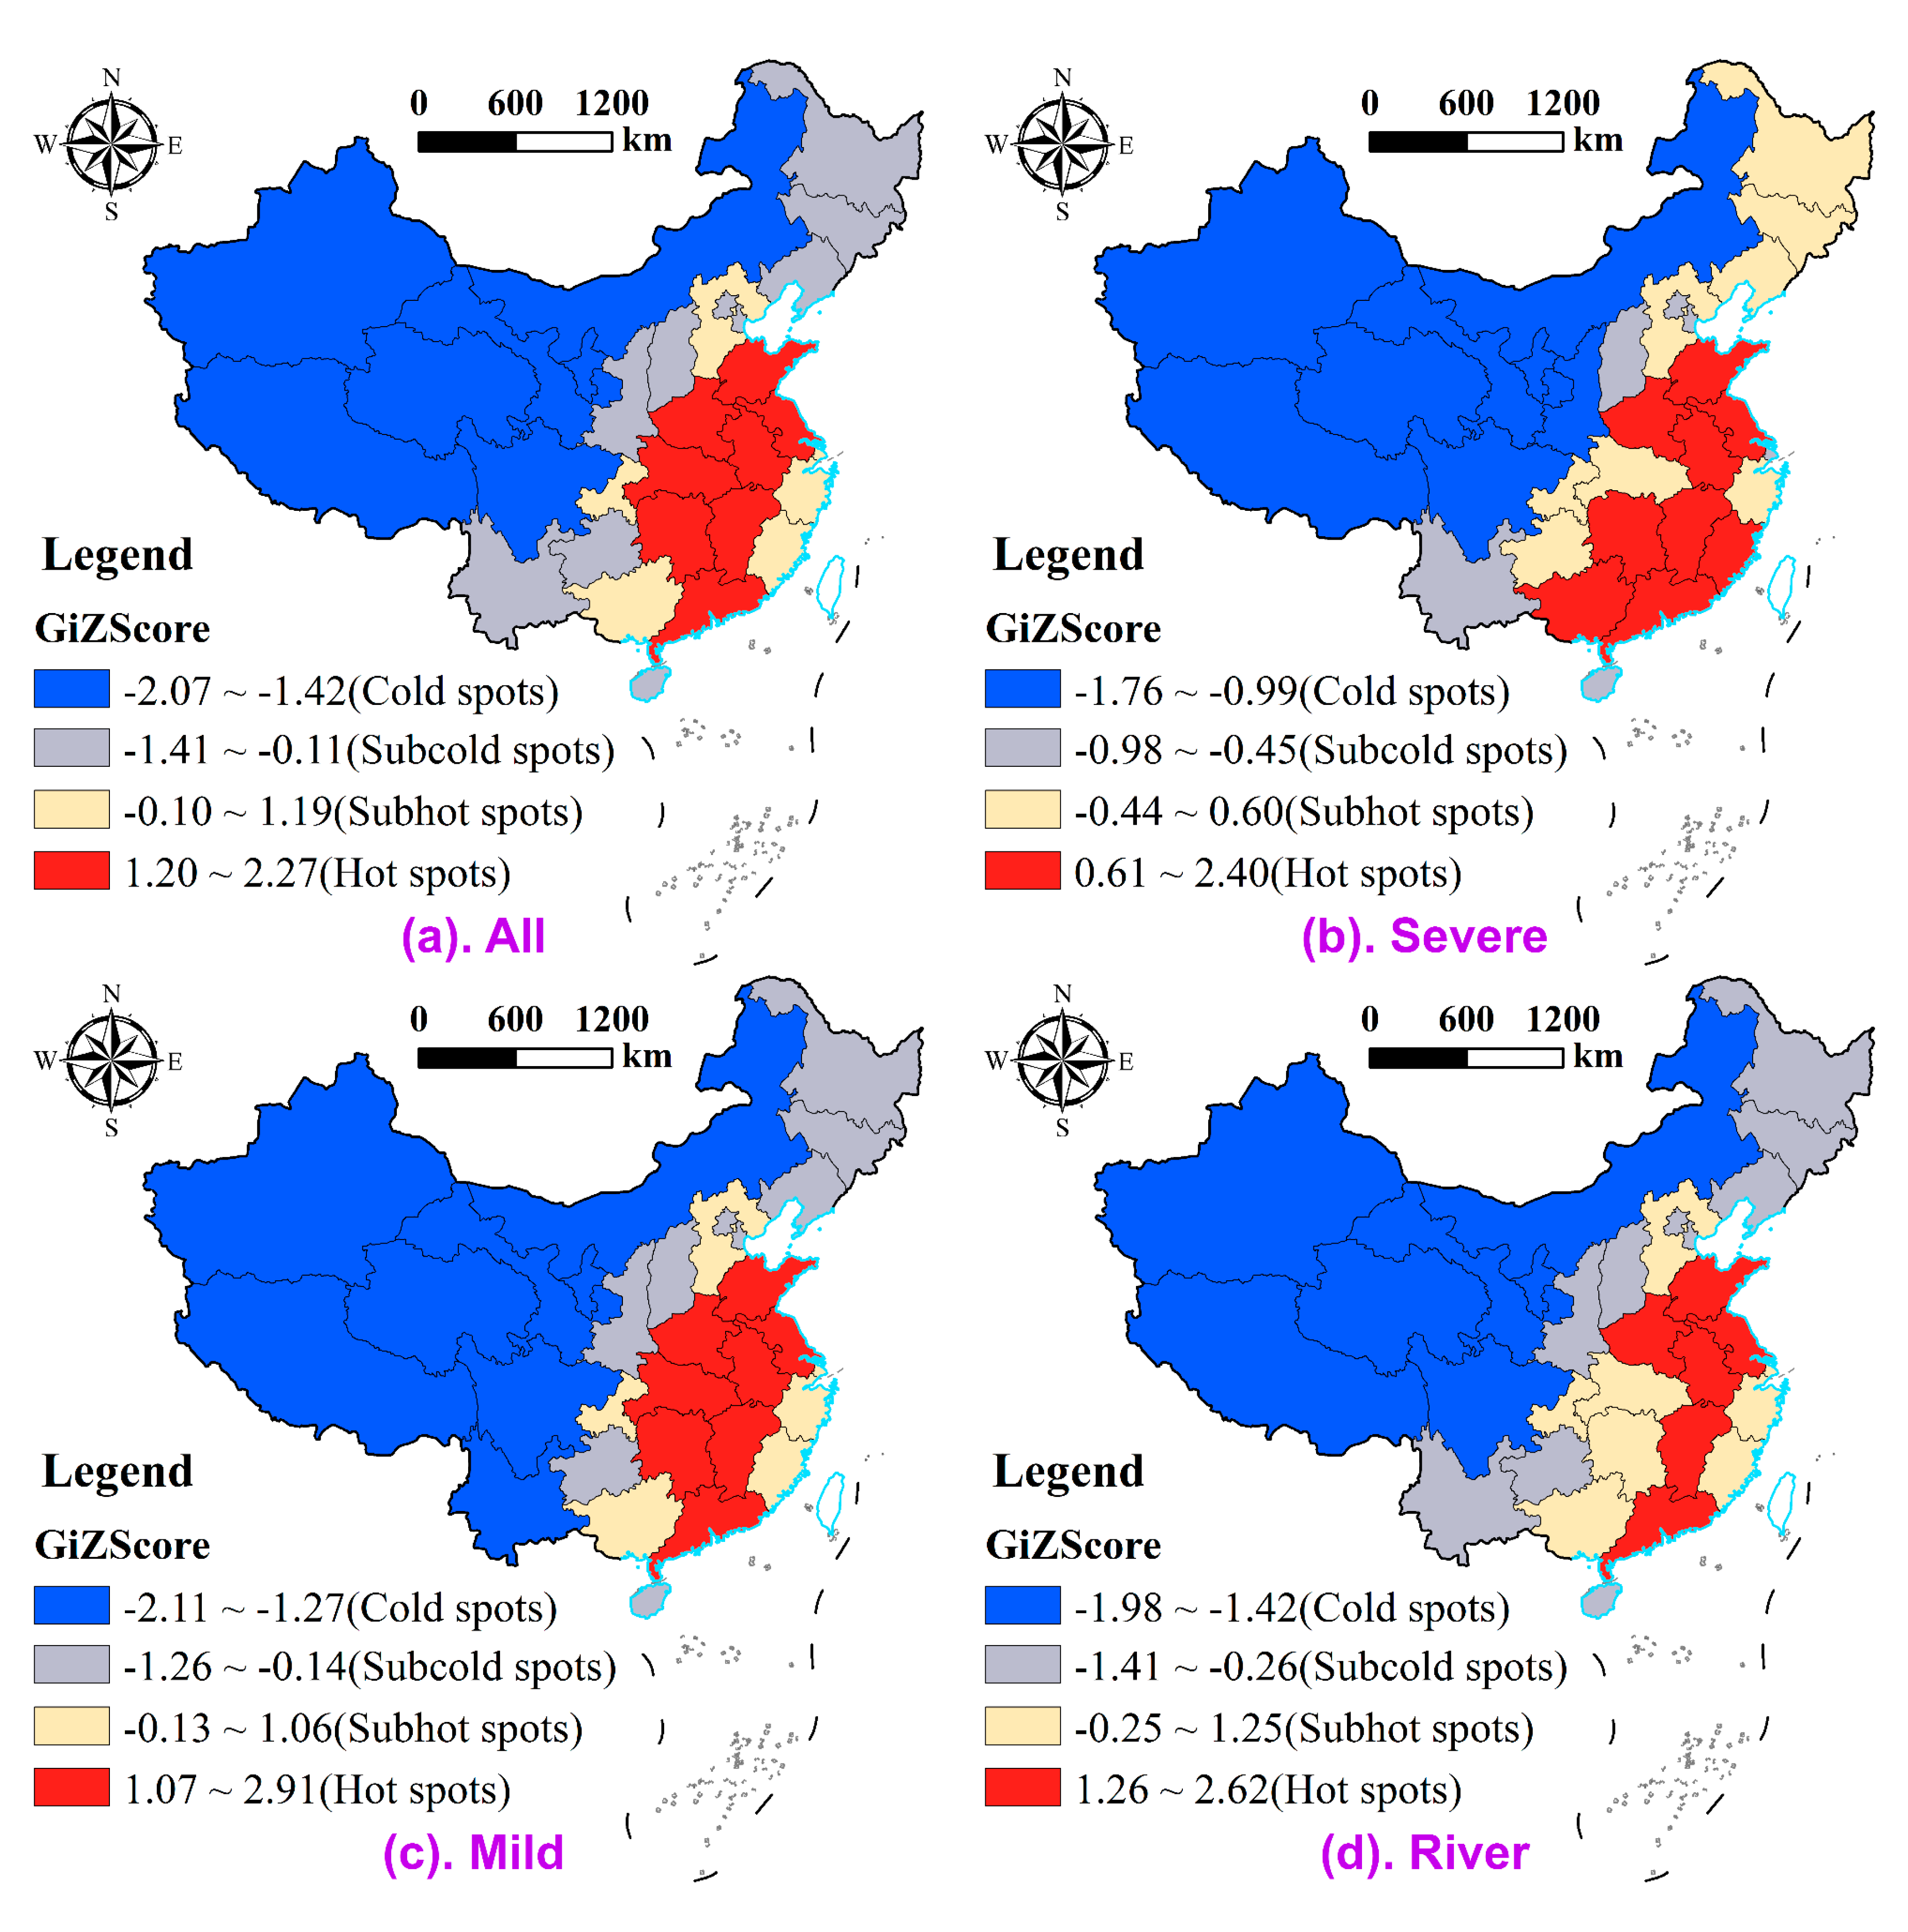
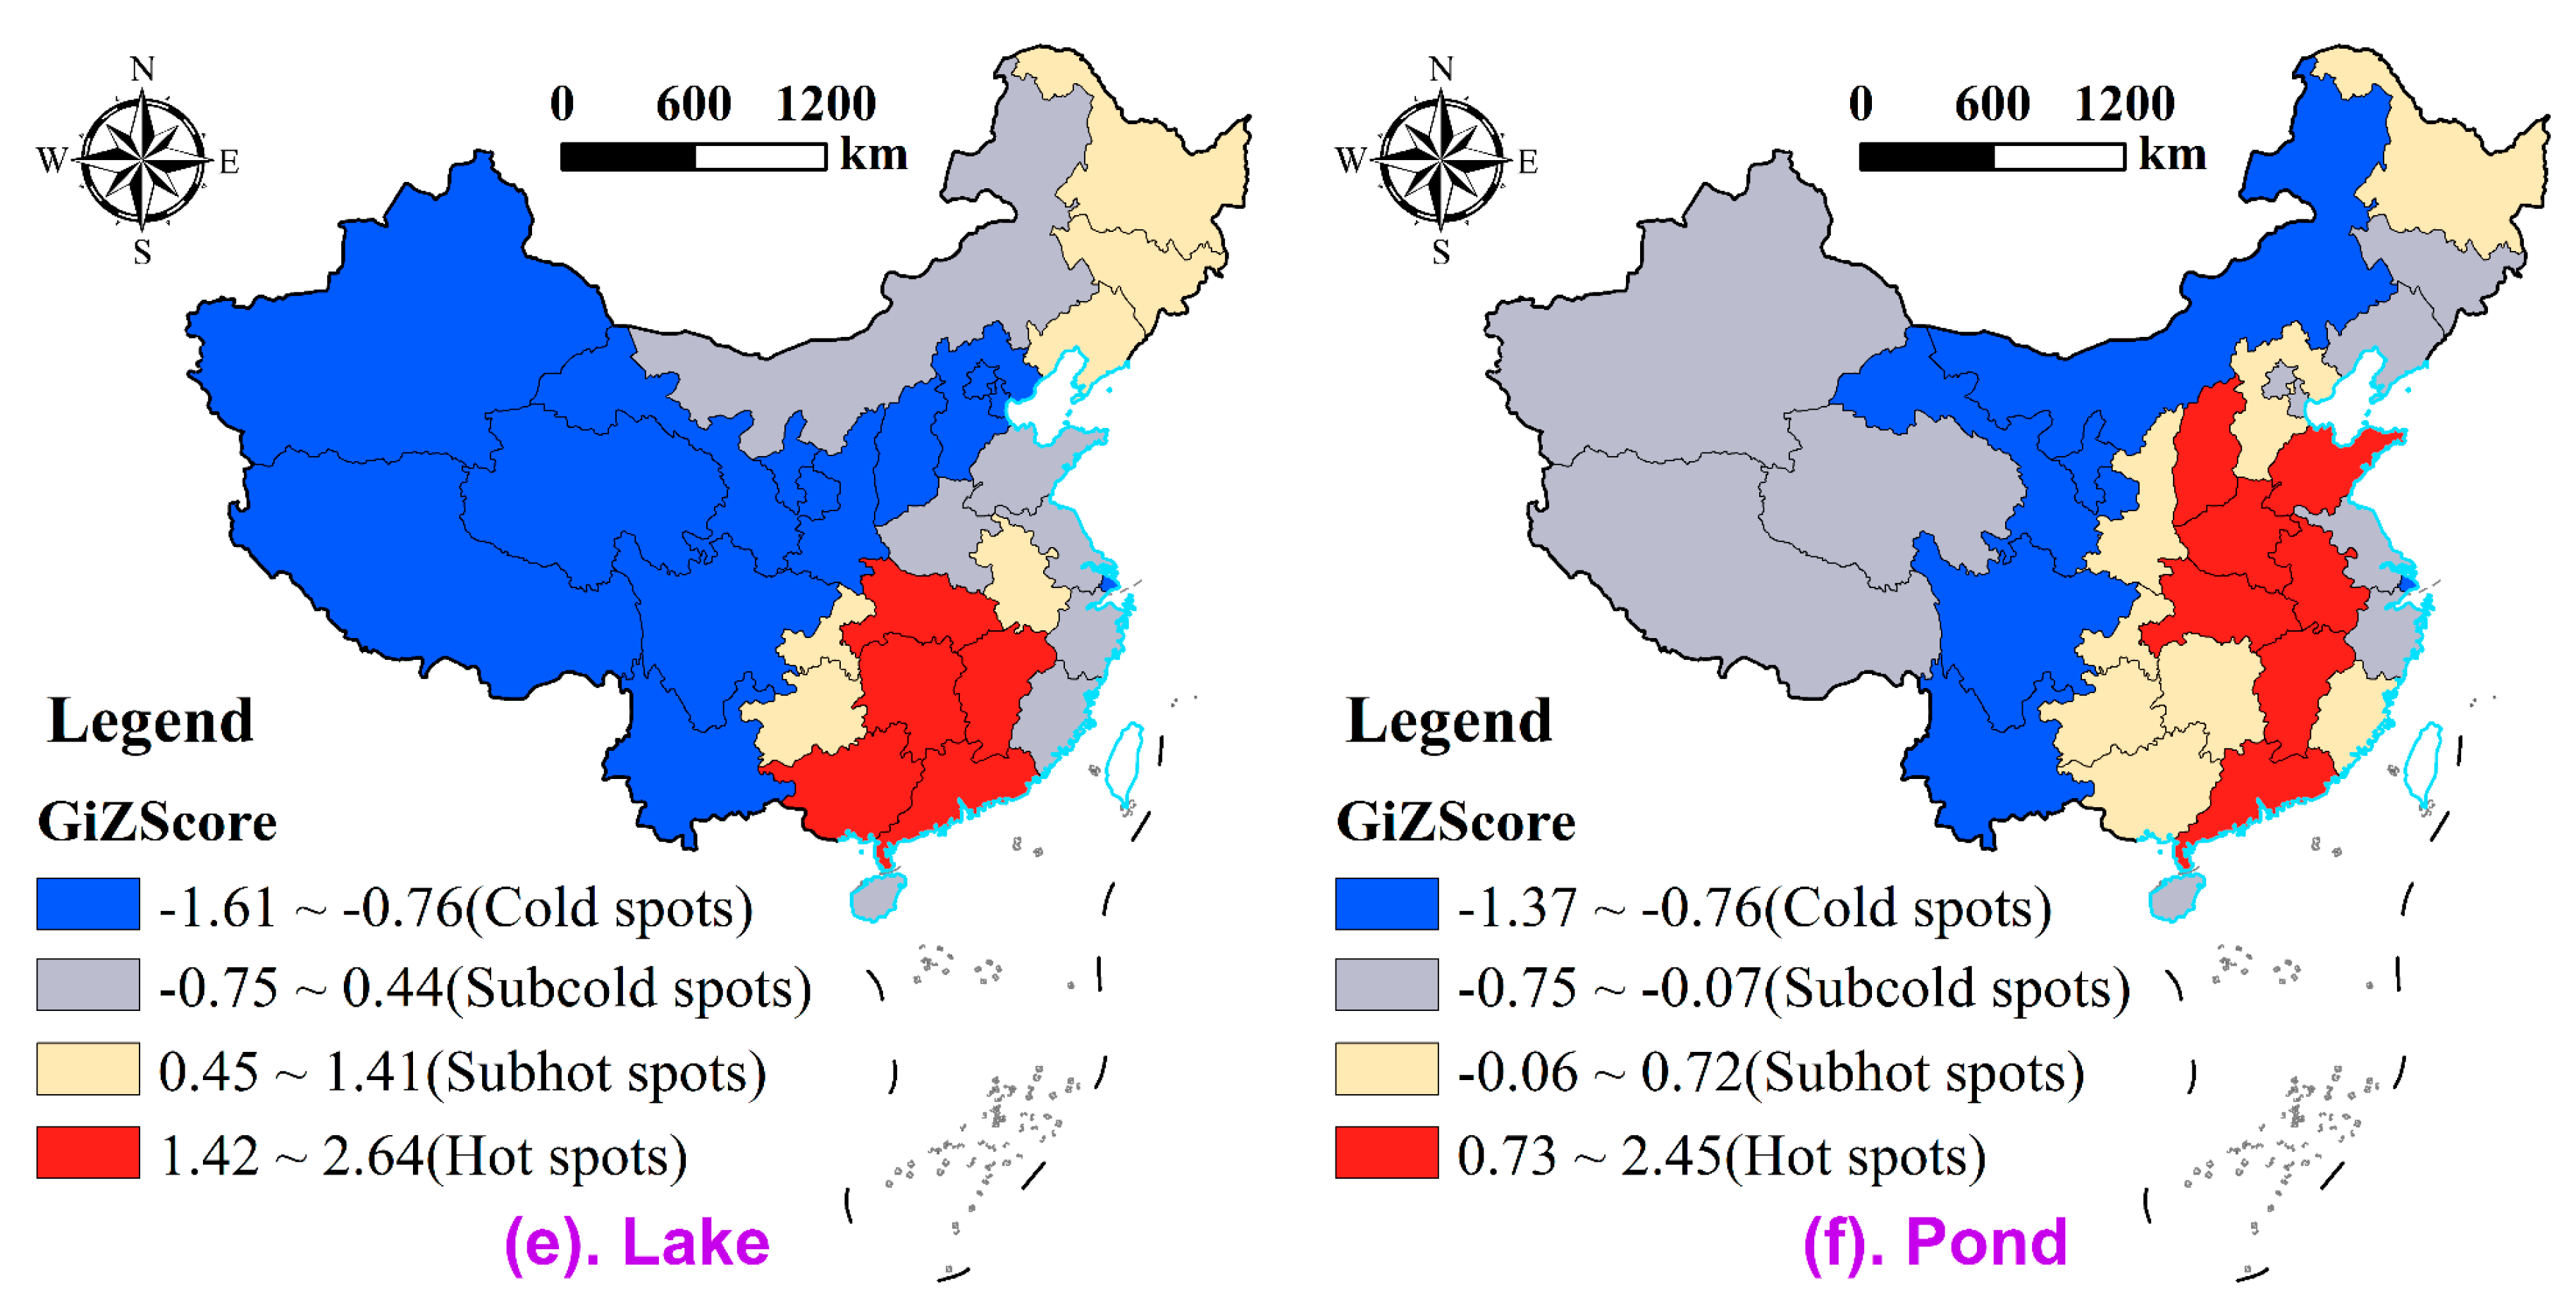
3.1.4. Spatial Correlation Characteristics

According to the calculation results of Moran’s I for the spatial distribution of different types of black and odorous waters, all types of waters had positive index values in the range of 0.0074 to 0.3431. Except for the severe and pond types that exhibited low significance, all the other types of waters passed the significance test at the 5% level, and their spatial pattern showed positive spatial correlation and agglomeration. The Moran’s I value of the total waters was 0.2407, with a Z value of 2.5402. The largest index value was 0.3431 for the mild type, with a Z value of 0.0005. The index value of waters in the rivers was 0.2035, which was higher than that of waters in lakes, 0.1384. In space, these waters were spatially positively correlated and agglomerated.
Combined with the hot spot maps in Figure 4, we found relatively special cold and hot spots for the black and odorous waters in the ponds. As for the remaining types, the special distribution of cold and hot spots was characterized by prominent cold spots in the northwest and southwest, and concentrated hot spots in the central region and central-south, with a staggered distribution of subcold and subhot spots. The cities involved in hot spots had large population density and a developed economy, whereas the distribution of cold spots was in line with the strategic requirements of China’s main functional areas for ecological functional areas.
With regard to the total black and odorous waters, the hot spots were mainly distributed in provinces in the central-east, such as Guangdong, Jiangxi, Anhui, and Shandong, which made up 25.81% of the national total. The proportion of subhot spots was 19.35%, mainly distributed around hot spots. The cold spots were mainly present in Inner Mongolia, Xinjiang, and Tibet, accounting for 22.58% of the national total. The subcold spots mainly covered the provinces on the east side of the “Hu Line” (also known as the Heihe-Tengchong or Aihui-Tengchong Line), accounting for 32.26% of the national total. Concerning the black-odorous level, the hot spots of severely affected waters were mainly concentrated in the provinces of the central-south and the east, involving nine cities and accounting for 29.03% of the national total; the proportion of subcold spots ranked the lowest, only 16.13%. The overall distribution of mildly affected waters was similar to that of total waters. From the perspectives of location of black and odorous waters, considerable differences existed in the cold and hot spots of waters between the different locations. The hot spots showed stable spatial characteristics of shifting from the southeast to the south and then to the central region in rivers, lakes, and ponds, whereas the cold spots shifted from the north to southwest and then to the central region. Generally, the cold and hot spots for the different types of black and odorous waters exhibited significant regional differentiation (i.e., cold in the southwest and hot in the central-east).

3.2. Factors Influencing Spatial Characteristics

The contribution of factors that influenced the spatial structure of the urban black and odorous waters in China showed spatial differences. From the perspectives of the three major regions, the core influencing factors that dominated the spatial characteristics of waters in the east were the lengths of the urban drainage pipelines (0.8556), total wastewater discharge (0.6516), municipal solid waste collection (0.6226), daily urban sewage treatment capacity (0.6177), and investment in urban pollution treatment of wastewater (0.3806). The core influencing factors that dominated the spatial characteristics of waters in the central region were daily urban sewage treatment capacity (0.5379), length of urban drainage pipelines (0.4675), investment in urban pollution treatment of wastewater (0.4459), total wastewater discharge (0.4155), municipal solid waste collection (0.3974), per capita water consumption (0.3677), and per capita water resources (0.3276). The core influencing factors that dominated the spatial characteristics of waters in the west were length of urban drainage pipelines (0.9073), total wastewater discharge (0.8886), municipal solid waste collection (0.8850), and daily urban sewage treatment capacity (0.8849). The above results illustrated that the total contribution of influencing factors to the spatial characteristics of black and odorous waters ranked in the order central > east > west. When south and north China were compared, the contribution of the influencing factors was equivalent. The spatial characteristics of black and odorous waters in the south were influenced by municipal solid waste collection (0.5104), daily urban sewage treatment capacity (0.4770), length of urban drainage pipelines (0.4655), and total wastewater discharge (0.4324). The spatial characteristics of black and odorous waters in the north were influenced by total wastewater discharge (0.5127), length of urban drainage pipelines (0.5121), investment in industrial pollution treatment of wastewater (0.3510), and daily urban sewage treatment capacity (0.3484).
On a national scale, the q values of the detection factors were relatively low. However, the factors showed different ability to influence the spatial distribution characteristics of urban black and odorous water in China and highlighted some significant factors influencing the spatial characteristics. These factors were length of urban drainage pipelines (0.4189), municipal solid waste collection (0.3683), and total wastewater discharge (0.3402). Across the whole of China, the factors exhibited a comparable ability to influence the spatial distribution pattern of black and odorous waters, whereas no significant and decisive factors influencing the spatial structure were highlighted. The influence and contribution of the influencing factors were markedly larger in a small range than in the whole country. This finding is largely due to the combined effects of coupling forces, such as spatial smoothing or weakening, on the contribution of influencing factors during the matching and coupling process when the factors were converted from a small-scale space to a large-scale space [47]. Table 3 shows the results of influencing factors in different regions.

4. Discussion

4.1. Spatial Characteristics Promote Top-Level System Design for the Treatment of Black and Odorous Waters

Unlike other studies using panel data to analyze the problem of water pollution [48], Our research explicitly reveals the geospatial distribution of the black and odorous waters pollution in 2100 Chinese cities. On a macro level, the value of the research lies in that it provides information of the present situation of Chinese black and odorous waters, and a top-level system design for scientific treatment, for the reference of the Chinese government. The Chinese government should establish a spatial treatment system for urban black and odorous waters and build up river, lake, and pond length systems; section length systems; crossing-section assessments; and ecological compensation mechanisms based on the black and odorous waters at different locations. Moreover, type-specific treatment institutions can be constructed at different levels and in different regions according to the whether the black and odorous waters are severe or mild and the types of black and odorous waters present. Furthermore, a regional joint-control, joint-prevention, and joint-treatment mechanism can be formed in the provinces and cities with spatial hot spots of black and odorous waters.

4.2. Influencing Factors Are an Important Point of Breakthrough in Treating Black and Odorous Waters

Our research deals with the core factors which contribute to the current situation of Chinese urban black and odorous waters. More importantly, the research helps the Chinese government to decide the causes of the existence of urban black and odorous waters. Thus, we can propose accurate solutions to the problem based on the influencing factors. The influence indicators obtained in the present study can be then incorporated into the content and scheme of the sustainable water environment system indicators to develop more complete safety system for water systems [49,50]. Based on the core influencing factors, the government can establish a water pollution trading plan and develop a series of water environmental quality standards [51], forming a penalty system with differential levy for different types of polluters who have violated the standards [52]. On a micro level, the Chinese government can upgrade the practical treatment of black and odorous waters by controlling the wastewater, managing the source, restoring ecological environment, etc. Design of an environmental pollution information disclosure system is recommended, along with the development of a pollution information disclosure platform with public participation and with the testing of treatment effects on black and odorous waters by third-party evaluation agencies or expert opinions [53]. The treatment results should be distributed to the public in a timely way to reduce the frequency of occurrence of pollution. Also, the local governments in China should communicate and collaborate with each other, and China should learn from other nations and organizations and use international experience and technology to treat water pollution [54].

4.3. Limitations of the Study

Some limitations exist in our study. For example, the generation of black and odorous waters is an uncertain dynamic process. Due to the huge workload of data processing and the difficulty in data collection, the data used in this study covers the period before the end of 2017. In future studies, the multistage data obtained can be compared to explore the evolutionary laws of the spatial pattern of urban black and odorous waters and their influencing factors along the time series. The research can be enriched if the content of each pollutant in urban black and odorous waters is acquired. Meanwhile, it needs to be considered that the factors influencing the spatial distribution of Chinese urban black and odorous waters are increased and complicated by overindustrialization, global warming, and other related issues [54]. The above three points are the focus of our future research.

5. Conclusions

This study detected the geospatial distribution characteristics of urban black and odorous waters and their influencing factors in China by using different methods such as ArcGIS spatial analysis and geodetector. The following main conclusions were drawn.
(1)
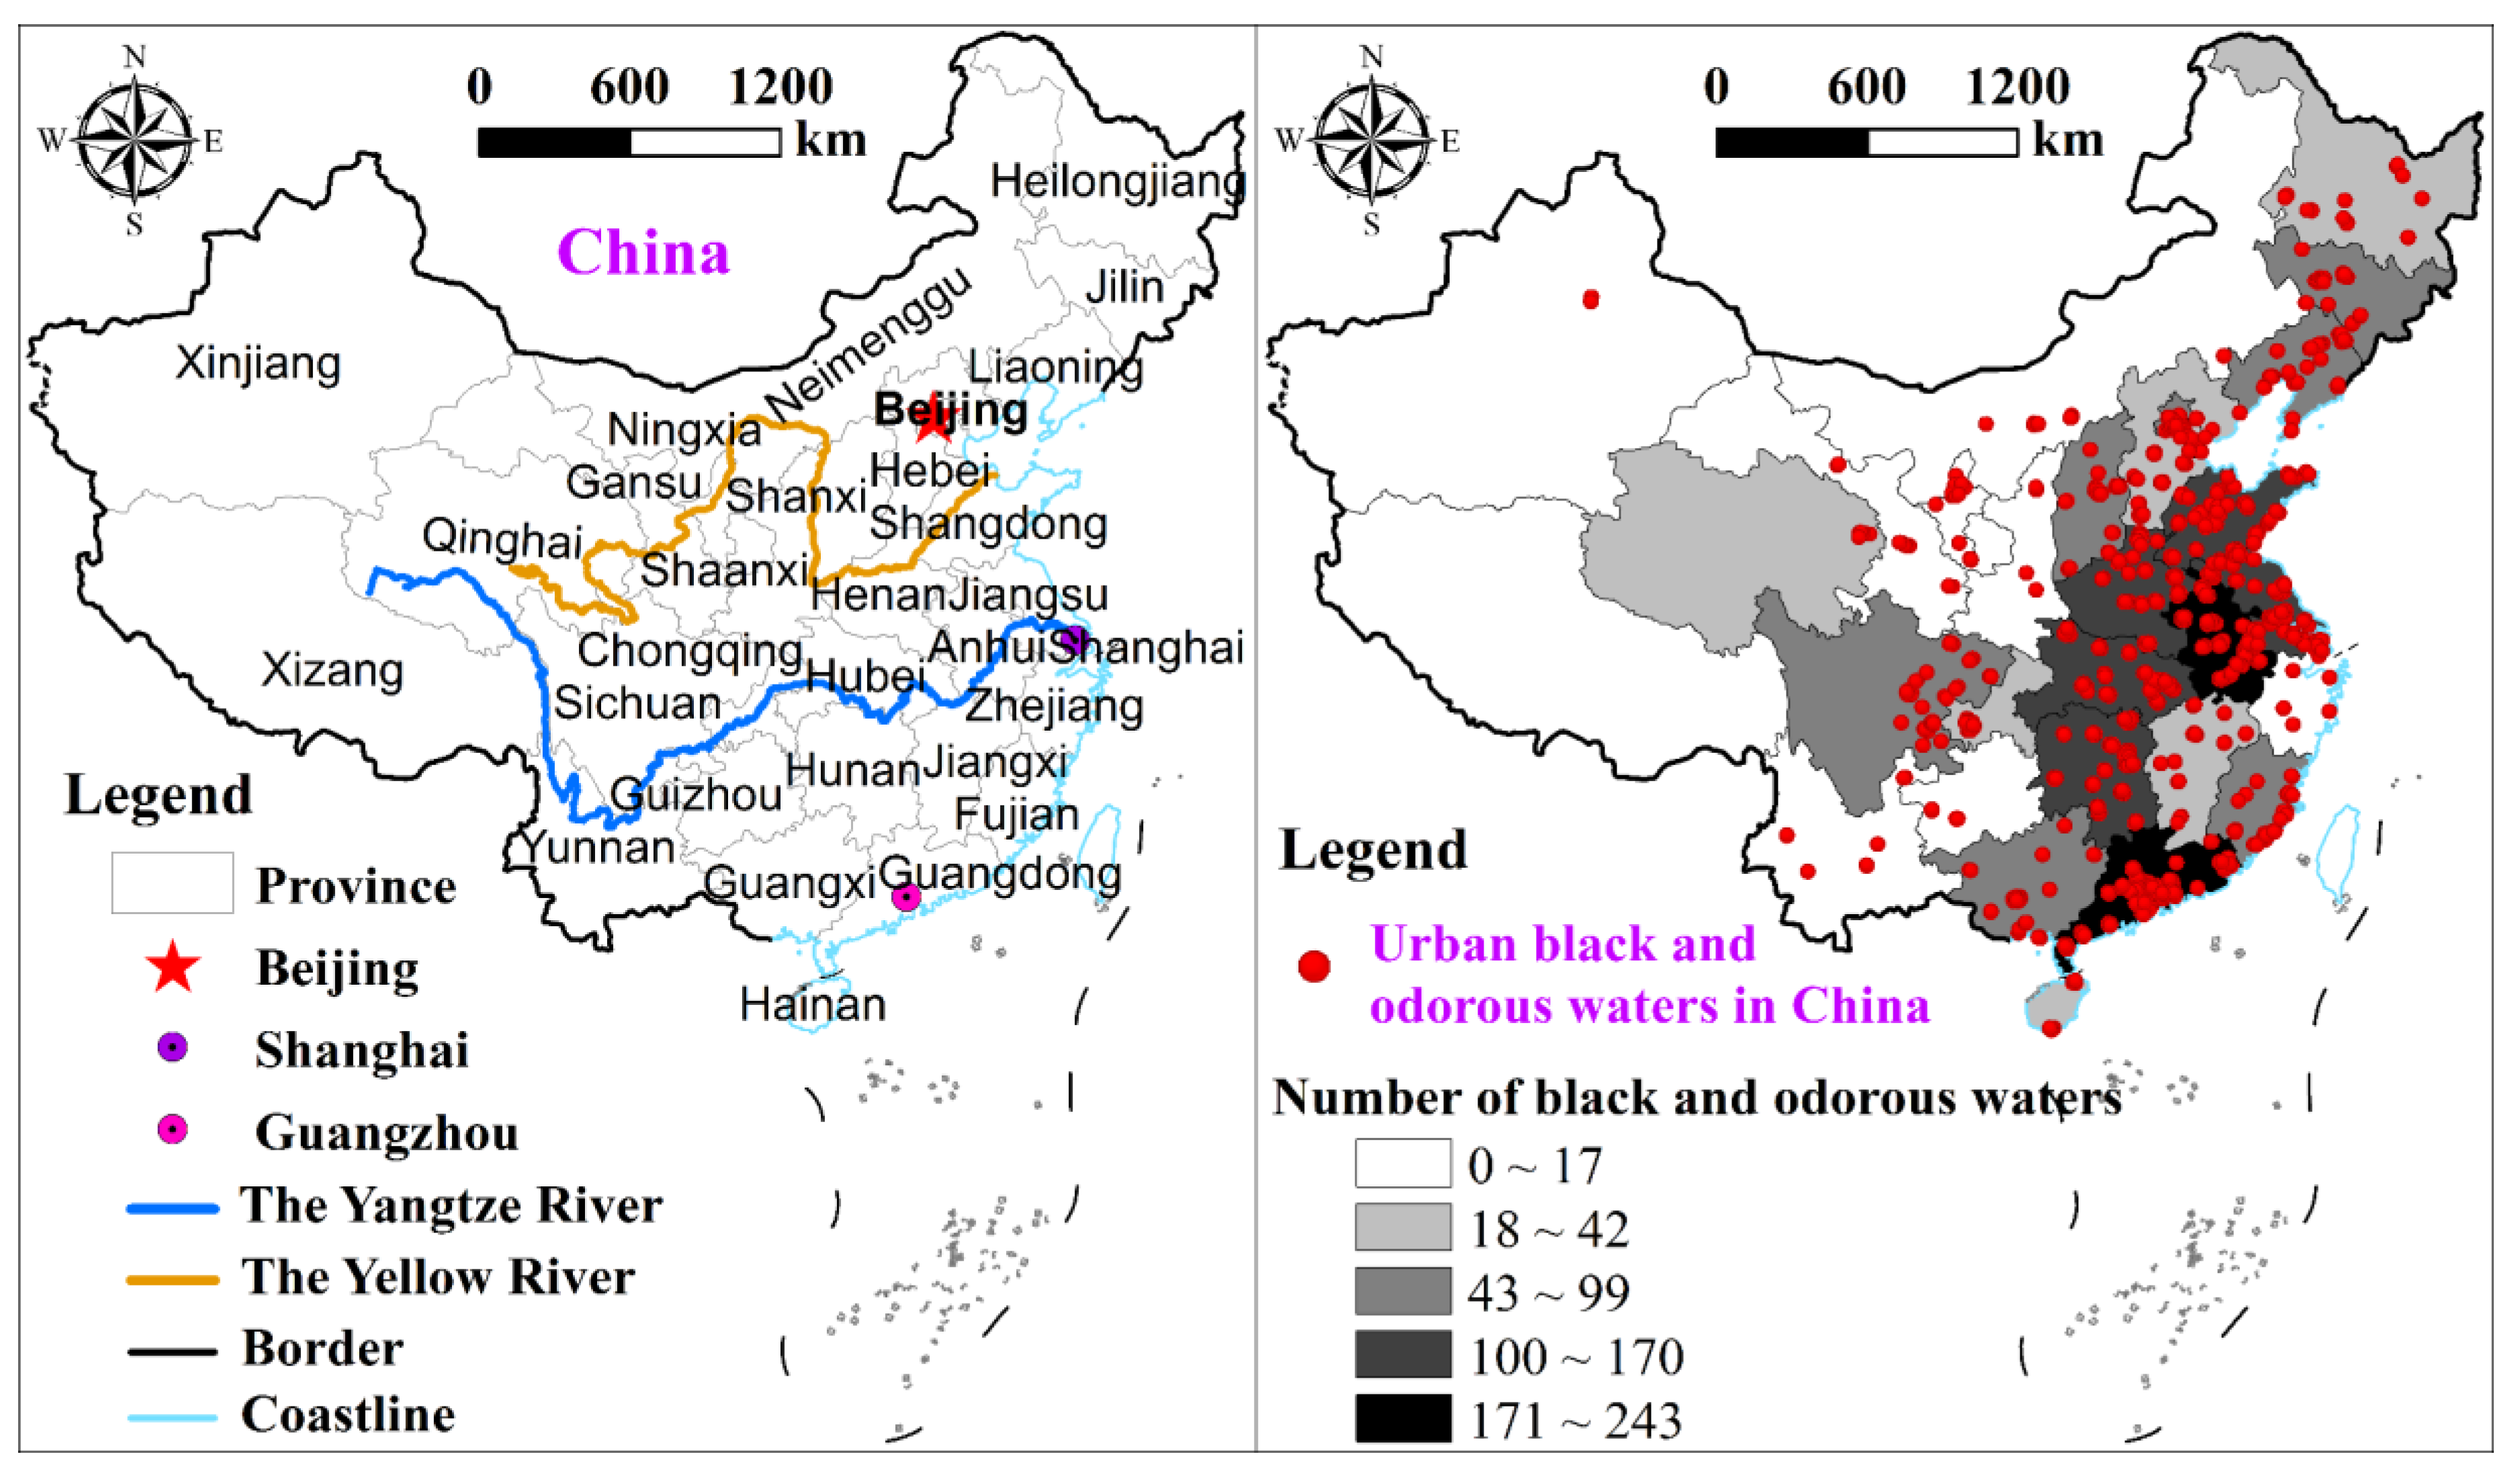
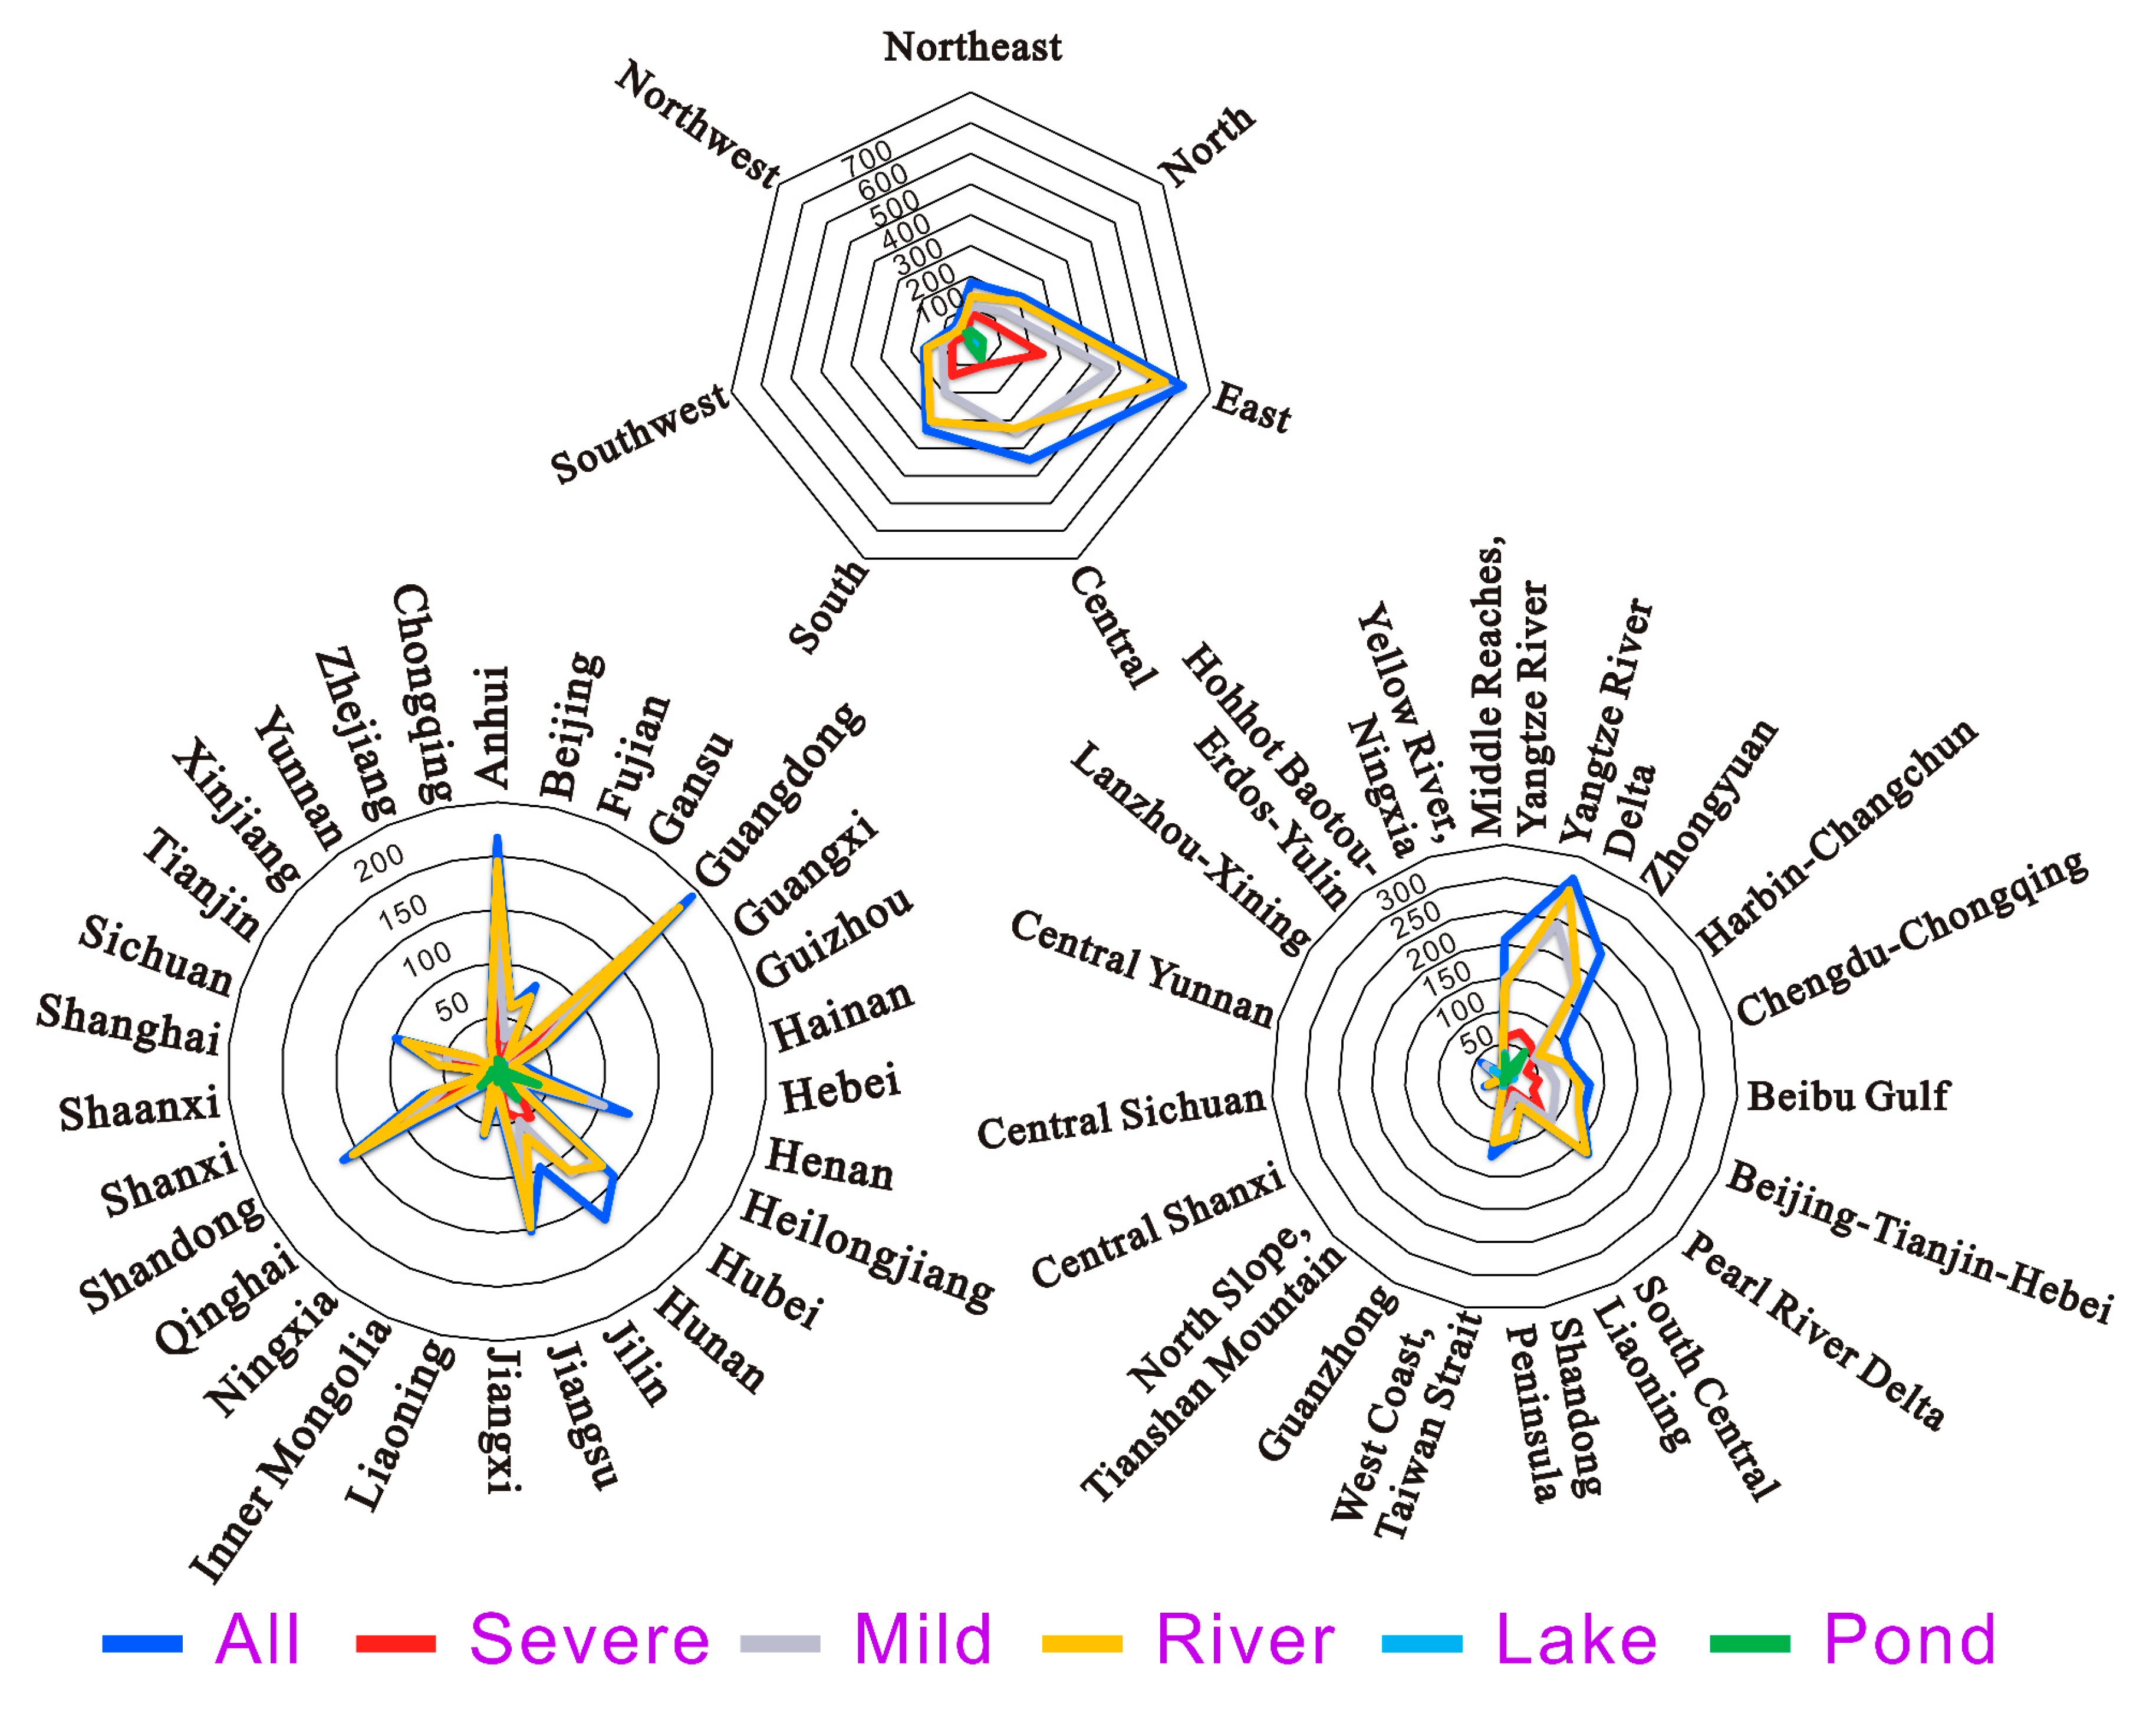
Urban black and odorous waters varied in amount and agglomerated in type. The number of urban black and odorous waters showed differences across the various local areas, regions, and urban agglomerations of China. Their spatial distribution was an agglomerated type, with significant agglomeration.
(2)
Urban black and odorous waters showed significant kernel density and spatially-related features. Concerning the spatial distribution of urban black and odorous waters in China, the kernel density showed two independent single-kernel centers, with ribbon-like and sporadic distribution of subcenters. Different types of black and odorous waters had significantly different kernel density centers and kernel density values. The spatial correlation characteristics showed particularity. Except for severely affected waters and those in ponds lacking spatial correlation, all the remaining types of waters were spatially positively correlated. The cold and hot spots showed a gradient distribution pattern of cold in southwest and hot in central-east, with relatively high stability and continuity and considerable polarization between the east and west.
(3)
The contribution of the factors to the characteristics of urban black and odorous waters varies according to the division of areas. On a national scale, the geodetection of spatial distribution characteristics revealed a few core influencing factors, which had relatively weak contributions. After different divisions of the study areas, the detection results highlighted the spatial differences in the contribution of influencing factors to the spatial distribution characteristics and the matching of important core influencing factors.
(4)
The spatial distribution characteristics of urban black and odorous waters has prominent contributing factors. The important core factors influencing the spatial distribution characteristics of black and odorous waters in China were total wastewater discharge, length of urban drainage pipelines, municipal solid waste collection, daily sewage treatment capacity, and investment in industrial pollution treatment of wastewater. The detection factors influence the formation and development of urban black and odorous waters, while providing a path for the protection and treatment of urban black and odorous waters in China.
(5)
The research results can be used to help the Chinese government to introduce and implement measures to treat the pollution of black and odorous waters. First of all, each city should establish the information database of urban black and odorous waters and make sure that the mayor is the first responsible person for the treatment. In addition, a one-year special campaign will be carried out in the areas of high kernel density and hot spots in urban black and odorous waters and gradually promoted to the whole country. Besides, the core influencing factors of urban black and odorous waters are checked and optimized or eliminated. What is more, the government will regularly announce the treatment of urban black and odorous waters to the public. Finally, researchers are encouraged to carry out more scientific research on urban black and odorous waters.

Author Contributions

G.C. and C.Z. conducted the primary experiments, cartography, and wrote the paper; L.T. and L.J. helped the data analysis; G.C. helped the language correction; and J.L. provided the original idea for this paper.

Funding

This research was funded by the National Natural Science Foundation of China (No. 41871176), the Young Scientist Fund of Social Science Foundation of China (No. 18CJY048), the Young Scientist Fund of National Natural Science Foundation of China (No. 41801177), the Self-determined Research Funds of CCNU From the Colleges’ Basic Research And Operation of MOE (CCNU16JCZX09, CCNU18ZDPY09 and CCNU18XJ028), and the Fundamental Research Funds for the Central Universities (Innovation Funded Project) (2018CXZZ002).

Conflicts of Interest

The authors declare no conflicts of interest.

References

  1. Wu, G.; Miao, Z.; Shao, S.; Jiang, K.S.; Geng, Y.; Li, D.J.; Liu, H.M. Evaluating the construction efficiencies of urban wastewater transportation and treatment capacity: Evidence from 70 megacities in China. Resour. Conserv. Recycl. 2018, 128, 373–381. [Google Scholar] [CrossRef]
  2. Hu, Q.; Li, X.L.; Li, A.J.; Qi, W.K.; Li, X.J.; Yang, X.J. Total emission control policy in China. Environ. Dev. 2018, 25, 126–129. [Google Scholar] [CrossRef]
  3. Cai, E.X.; Jing, Y.; Liu, Y.L.; Yin, C.H.; Gao, Y.; Wei, J.Q. Spatial-temporal patterns and driving forces of Ecological-Living-Production land in Hubei province, central China. Sustainability 2018, 10, 66. [Google Scholar] [CrossRef]
  4. Song, C.; Liu, X.L.; Song, Y.H.; Liu, R.X.; Gao, H.J.; Lu, H.; Peng, J.F. Key blackening and stinking pollutants in Dongsha River of Beijing: Spatial distribution and source identification. J. Environ. Manag. 2017, 200, 335–346. [Google Scholar] [CrossRef] [PubMed]
  5. Hu, Y.N.; Cheng, H.F. Water pollution during China’s industrial transition. Environ. Dev. 2013, 8, 57–73. [Google Scholar] [CrossRef]
  6. Jiang, Y. China’s water security: Current status, emerging challenges and future prospects. Environ. Sci. Policy 2015, 54, 106–125. [Google Scholar] [CrossRef]
  7. Shen, Q.; Zhu, L.; Cao, H.Y. Remote sensing monitoring and screening for urban black and odorous water body: A review. Chin. J. Appl. Ecol. 2017, 8, 3433–3439. [Google Scholar]
  8. Ministry of Housing and Urban-Rural Development of the People’s Republic of China. Notice on Printing and Distributing the Guidelines for the Remediation of Urban Black and Odorous Waters. Available online: http://www.mohurd.gov.cn/wjfb/201509/t20150911_224828.html (accessed on 10 September 2018).
  9. The State Council. Action Plan for Prevention and Control of Water Pollution. 2015. Available online: http://www.gov.cn/zhengce/content/2015-04/16/content_9613.htm (accessed on 15 September 2018).
  10. Anonymous. London sewage and the river thames. Br. Med. J. 1928, 1, 676–677. [Google Scholar]
  11. Lazaro, T.R. Urban Hydrog; Science Publishers: Ann Arbor, MI, USA, 1979. [Google Scholar]
  12. Liu, C.; Shen, Q.S.; Zhou, Q.L.; Fan, C.X.; Shao, S.G. Precontrol of algae-induced black blooms through sediment dredging at appropriate depth in a typical eutrophic shallow lake. Ecol. Eng. 2015, 77, 139–145. [Google Scholar] [CrossRef]
  13. Hishida, Y.; Ashitani, K.; Fujiwara, K. Occurrence of musty odor in the Yodo River. Water Sci. Technol. 1988, 20, 193–196. [Google Scholar] [CrossRef]
  14. Chen, J.; Xie, P.; Ma, Z.M.; Niu, Y.; Tao, M.; Deng, X.W.; Wang, Q. A systematic study on spatial and seasonal patterns of eight taste and odor compounds with relation to various biotic and abiotic parameters in Gonghu Bay of Lake Taihu, China. Sci. Total Environ. 2010, 409, 314–325. [Google Scholar] [CrossRef] [PubMed] [Green Version]
  15. Gao, J.H.; Jia, J.J.; Kettner, A.J.; Xing, F.; Wang, Y.P.; Xu, X.N.; Yang, Y.; Zou, X.Q.; Gao, S.; Qi, S.H.; et al. Changes in water and sediment exchange between the Changjiang River and Poyang Lake under natural and anthropogenic conditions, China. Sci. Total Environ. 2014, 481, 542–553. [Google Scholar] [CrossRef] [PubMed]
  16. Sheng, Y.Q.; Qu, Y.X.; Ding, C.F.; Sun, Q.Y.; Mortimer, R.J.G. A combined application of different engineering and biological techniques to remediate a heavily polluted river. Ecol. Eng. 2013, 57, 1–7. [Google Scholar] [CrossRef] [Green Version]
  17. Sánchez-Morales, M.; Sabater, F.; Muñoz, I. Effects of urban wastewater on hyporheic habitat and invertebrates in Mediterranean streams. Sci. Total Environ. 2018, 642, 937–945. [Google Scholar] [CrossRef] [PubMed]
  18. Wang, W.F.; Ndungu, A.W.; Li, Z.; Wang, J. Microplastics pollution in inland freshwaters of China: A case study in urban surface waters of Wuhan, China. Sci. Total Environ. 2017, 575, 1369–1374. [Google Scholar] [CrossRef] [PubMed]
  19. Huang, F.; Wang, X.Q.; Lou, L.P.; Zhou, Z.Q.; Wu, J.P. Spatial variation and source apportionment of water pollution in Qiantang River (China) using statistical techniques. Water Res. 2010, 44, 1562–1572. [Google Scholar] [CrossRef] [PubMed]
  20. Wang, Q.; Yang, Z.M. Industrial water pollution, water environment treatment, and health risks in China. Environ. Pollut. 2016, 218, 358–365. [Google Scholar] [CrossRef] [PubMed]
  21. Lai, W.Y. Pesticide use and health outcomes: Evidence from agricultural water pollution in China. J. Environ. Econ. Manag. 2017, 86, 93–120. [Google Scholar] [CrossRef]
  22. Tian, X.L.; Guo, Q.G.; Han, C.; Ahmad, N.J. Different extent of environmental information disclosure across chinese cities: Contributing factors and correlation with local pollution. Glob. Environ. Chang. 2016, 39, 244–257. [Google Scholar] [CrossRef]
  23. Kumar, P.; Saroj, D.P. Water-energy-pollution nexus for growing cities. Urban Clim. 2014, 10, 846–853. [Google Scholar] [CrossRef]
  24. Sado-Inamura, Y.; Fukushi, K. Considering water quality of urban rivers from the perspectives of unpleasant odor. Sustainability 2018, 10, 650. [Google Scholar] [CrossRef]
  25. Smith, V.H.; Jonathan, S.D.; Frank, D.J. Managing taste and odor problems in a eutrophic drinking water reservoir. J. Lake Reserv. Manag. 2002, 18, 319–323. [Google Scholar] [CrossRef]
  26. Sugiura, N.; Utsumi, M.; Wei, B. Assessment for the complicated occurrence of nuisance odours from phytoplankton and environmental factors in a eutrophic lake. Lakes Reserv. Res. Manag. 2004, 9, 195–201. [Google Scholar] [CrossRef]
  27. Dzialowski, A.R.; Smith, V.H.; Huggins, D.G. Development of predictive models for geosmin-related taste and odor in Kansas, USA, drinking water reservoirs. Water Res. 2009, 43, 2829–2840. [Google Scholar] [CrossRef] [PubMed]
  28. Panahi, Y.; Mellatyar, H.; Farshbaf, M.; Sabet, Z.B.; Fattahi, T.; Akbarzadehe, A. Biotechnological applications of nanomaterials for air pollution and water/wastewater treatment. Mater. Today Proc. 2018, 5, 15550–15558. [Google Scholar] [CrossRef]
  29. Zhang, X.H.; Xiang, N.; Wang, W.L.; Liao, W.J.; Yang, X.D.; Shui, W.; Wu, J.; Deng, S.H. An emergy evaluation of the sewage sludge treatment system with earthworm compositing technology in Chengdu, China. Ecol. Eng. 2018, 110, 8–17. [Google Scholar] [CrossRef]
  30. Sandoval-Herazo, L.C.; Alvarado-Lassman, A.; Marín-Muñiz, J.L.; Méndez-Contreras, J.M.; Zamora-Castro, S.A. Effects of the use of ornamental plants and different substrates in the removal of wastewater pollutants through microcosms of constructed wetlands. Sustainability 2018, 10, 1594. [Google Scholar] [CrossRef]
  31. Huang, Q.D.; Xu, J.J.; Wei, Y.P. Clan in transition: Societal changes of villages in China from the perspective of water pollution. Sustainability 2018, 10, 150. [Google Scholar] [CrossRef]
  32. Wang, T.; Shi, F.; Zhang, Q.; Qian, X.P.; Hashimoto, S.J. Exploring material stock efficiency of municipal water and sewage infrastructures in China. J. Clean. Prod. 2018, 181, 498–507. [Google Scholar] [CrossRef]
  33. Udimal, T.B.; Jincai, Z.; Ayamba, E.C.; Owusu, S.M. China’s water situation; the supply of water and the pattern of its usage. Int. J. Sustain. Built Environ. 2017, 6, 491–500. [Google Scholar] [CrossRef]
  34. Yang, R.; Xu, Q.; Long, H.L. Spatial distribution characteristics and optimized reconstruction analysis of China’s rural settlements during the process of rapid urbanization. J. Rural Stud. 2016, 47, 413–424. [Google Scholar] [CrossRef] [Green Version]
  35. Cai, X.C.; Wu, Z.F.; Cheng, J. Using kernel density estimation to assess the spatial pattern of road density and its impact on landscape fragmentation. Int. J. Geogr. Inf. Sci. 2013, 27, 222–230. [Google Scholar] [CrossRef] [Green Version]
  36. Bailey, T.; Gatrell, A. Interactive Spatial Data Analysis; Longman Harlow: Essex, UK, 1995. [Google Scholar]
  37. Sridharan, S.; Tunstall, H.; Lawder, R. An exploratory spatial data analysis approach to understanding the relationship between deprivation and mortality in Scotland. Soc. Sci. Med. 2007, 65, 1942–1952. [Google Scholar] [CrossRef] [PubMed]
  38. Cliff, A.D.; Ord, J.K. Spatial and temporal analysis: Autocorrelation in space and time. In Quantitative Geography: A British View; Pion: London, UK, 1981; pp. 127–144. [Google Scholar]
  39. Anselin, L. Local indicators of spatial association-LISA. Geogr. Anal. 1995, 27, 93–115. [Google Scholar] [CrossRef]
  40. Xu, X.; Zhao, Y.; Zhang, X.L.; Xia, S.Y. Identifying the impacts of social, economic, and environmental factors on population aging in the Yangtze River Delta using the geographical detector technique. Sustainability 2018, 10, 1528. [Google Scholar] [CrossRef]
  41. Getis, A.; Ord, J.K. Local spatial statistics: An overview. In Spatial Analysis: Modelling in a GIS Environment; Longley, P., Batty, M., Eds.; Geo Information International: Cambridge, UK, 1996; pp. 261–271. [Google Scholar]
  42. Wang, J.F.; Li, X.H.; George, C.; Liao, Y.-L.; Zhang, T.; Gu, X.; Zheng, X.-Y. Geographical detectors-based health risk assessment and its application in the neural tube defects study of the Heshun region, China. Int. J. Geogr. Inf. Sci. 2010, 24, 107–127. [Google Scholar] [CrossRef]
  43. Wang, J.F.; Hu, Y. Environmental health risk detection with GeogDetector. Environ. Model. Softw. 2012, 33, 114–115. [Google Scholar] [CrossRef]
  44. Wang, J.F.; Zhang, T.L.; Fu, B.J. A measure of spatial stratified heterogeneity. Ecol. Indic. 2016, 67, 250–256. [Google Scholar] [CrossRef] [Green Version]
  45. Hu, Y.; Wang, J.F.; Li, X.H.; Ren, D.; Zhu, J. Geographical Detector-based risk assessment of the Under-five mortality in the 2008 Wenchuan earthquake, China. PLoS ONE 2011, 6, e21427. [Google Scholar] [CrossRef]
  46. Ye, Y.; Qi, Q.; Jiang, L.; Zhang, A. Impact factors of grain output from farms in Heilongjiang reclamation area based on geographical detector. Geogr. Res. 2018, 37, 171–182. (In Chinese) [Google Scholar]
  47. Song, T.; Cheng, Y.; Liu, W.D.; Liu, H. The spatial disparity and impact mechanism of geo-economy in the border areas of China. Acta Geogr. Sin. 2017, 72, 1731–1745. (In Chinese) [Google Scholar]
  48. Liu, Q.Q.; Wang, S.J.; Zhang, W.Z.; Li, J.M. Income distribution and environmental quality in China: A spatial econometric perspective. J. Clean. Prod. 2018, 205, 14–26. [Google Scholar] [CrossRef]
  49. Lu, S.B.; Gao, X.R.; Li, W.; Jiang, S.L.; Huang, L. A study on the spatial and temporal variability of the urban residential water consumption and its influencing factors in the major cities of China. Habitat Int. 2018, 78, 29–40. [Google Scholar] [CrossRef]
  50. Yu, H.B.; Song, Y.H.; Chang, X.; Gao, H.J.; Peng, J.F. A Scheme for a sustainable urban water environmental system during the urbanization process in China. Engineering 2018, 4, 190–193. [Google Scholar] [CrossRef]
  51. Zhang, Y.L.; Wu, Y.Y.; Yu, H.; Dong, Z.F.; Zhang, B. Trade-offs in designing water pollution trading policy with multiple objectives: A case study in the Tai Lake Basin, China. Environ. Sci. Policy 2013, 33, 295–307. [Google Scholar] [CrossRef]
  52. Haque, N. Exploratory analysis of fines for water pollution in Bangladesh. Water Resour. Ind. 2017, 18, 1–8. [Google Scholar] [CrossRef]
  53. Tang, Y.H.; Miao, X.; Zang, H.Y.; Gao, Y.H. Information disclosure on Hazards from industrial water pollution incidents: Latent resistance and countermeasures in China. Sustainability 2018, 10, 1475. [Google Scholar] [CrossRef]
  54. Intergovernmental Panel on Climate Change. The Intergovernmental Panel on Climate Change Special Report: Global Warming of 1.5 °C. 2018. Available online: https://www.ipcc.ch/sr15/chapter/summary-for-policy-makers/?tdsourcetag=s_pcqq_aiomsg (accessed on 1 December 2018).
Figure 1. Geospatial distribution map of urban black and odorous waters in China.
Sustainability 10 04747 g001
Figure 2. Statistical graph showing the distribution of urban black and odorous waters in China.
Sustainability 10 04747 g002
Figure 3. Kernel density maps of urban black and odorous waters in China.
Sustainability 10 04747 g003aSustainability 10 04747 g003b
Figure 4. Cold and hot spots for urban black and odorous waters in China.
Sustainability 10 04747 g004aSustainability 10 04747 g004b
Table 1. The detection indicator system for influencing factors.
Detection FactorDetection IndicatorUnitFactor Interpretation
X1Urban population densityPersons/square kilometerThe population living in a unit area of the city
X2Per capita gross domestic product (GDP)Chinese YuanThe ratio of the total GDP achieved during the accounting period to the resident population within the same range
X3Per capita water resourcesCubic meters/personThe total amount of surface and ground water formed by precipitation that each person possesses on average during the accounting period in a region.
X4Per capita water consumptionCubic meters/personThe average daily gross water consumption by all types of water users, including water loss from transportation
X5Total wastewater discharge10,000 tonsThe total amount of water discharged by industry, tertiary industry, and residents’ life
X6Municipal solid waste collection10,000 tonsThe amount of municipal solid wastes collected and transported to the treatment plants (sites) and the final disposal sites during the accounting period
X7Length of urban drainage pipelines1000 mThe sum of the lengths of all drainage pipelines (header, trunk, and branch) and the inlet and outlet of connection wells
X8Daily urban sewage treatment capacity10,000 square metersThe designed volume capacity of sewage treatment plants (or sewage treatment devices) for sewage treatment every day and night
X9Investment in industrial pollution treatment of wastewater10,000 Chinese YuanThe investment implemented during the accounting period for the treatment of wastewater produced by industrial pollution
Table 2. The nearest neighbor index of urban black and odorous waters in China.
Type R r 1 ¯   ( km ) r E ¯   ( km ) Z Score
Total0.14165.440635.6159−75.2148
Severe0.14427.074449.0548−43.6546
Mild0.17137.503943.8034−59.0421
In rivers0.16456.343438.5477−67.6384
In lakes0.405740.7569100.4487−11.5377
In ponds0.246321.553987.4984−20.5932
Table 3. Detection results of factors influencing the spatial characteristics of urban black and odorous waters in China.
FactorNationwideEastCentralWestSouthNorth
qpqpqpqpqpqp
X10.02970.66250.08160.76370.14310.67380.05780.81500.23410.35130.10180.5081
X20.03460.72050.22870.43040.19070.61320.16260.58910.11350.69170.04000.8459
X30.03550.31940.08970.78730.32760.32720.07130.47090.08280.31720.08910.5576
X40.11770.18310.18300.75370.36770.29350.07750.76170.04580.77680.14870.3667
X50.34020.46700.65160.31290.41550.39460.88860.02720.43240.56980.51270.1521
X60.36830.35980.62260.35600.39740.39880.88500.02970.51040.40740.23480.7167
X70.41890.07340.85560.00570.46750.17770.90730.01620.46550.26050.51210.2651
X80.26900.35320.61770.16900.53790.49350.88490.02970.47700.23500.34840.2036
X90.29520.21970.38060.39270.44590.63940.28540.43540.14400.76580.35100.5920

