1. Introduction
Urban rail transit has become an indispensable option for daily travel in China, especially for commuters in metropolises such as Beijing and Shanghai [
1,
2]. In 2015, passenger traffic on the Beijing Subway was 3.32 billion boarding, and the average daily passenger volume reached 9.11 million boarding [
3]. With millions of people choosing rail transit as their primary travel mode, congestion occurs during peak hours. The Beijing Subway was designed with a low-fare policy in 2007 to attract car commuters and offer commuters a convenient and comfortable means of transportation. However, in a sample survey during 2012, managers of the Beijing Subway found that commuters accounted for only about 60% of peak trips [
4], which partly led to an increased fare policy in 2014 to reduce noncommuters in rush hour. Thus, an awareness of passenger classifications during peak hours, especially commuters, is needed for managers to make informed decisions [
5,
6].
In the traditional definition, commuter refers to a person who regularly travels from one place to another, typically for work. With rapid developments in Beijing, commuters today include not only office workers, but also students, as well as people with specific and fixed needs, such as morning exercisers, morning shoppers, and parents or grandparents escorting children to and from school [
4]. Meanwhile, as a result of occupation diversity, the travel time of some commuters may have changed from 08:00 through 18:00 to earlier in the morning or late at night, or from workdays to weekends [
1,
7]. Thus, in this paper, the term subway inelastic users (SIUs) is proposed to replace commuters, in order to highlight workers and include more travelers, such as commuters.
SIUs include two main types of users, regular SIUs and special SIUs. Regular SIUs refers to subway users who travel regularly by metro, and whose travel demands remain stable regardless of rush hour congestion or price changes. Special SIUs refers to subway users with inelastic demands who travel at random, such as job interviewers, tourists, or patients on their way to the hospital. Special SIUs are not involved in this paper because: (1) there are far fewer special SIUs than regular SIUs and they contribute little to congestion of the subway system [
3,
4]; (2) special SIUs with temporary demands that do not last for a long time are hard to detect only by smart cards [
6]; and (3) some special SIUs might become regular SIUs in the long term when temporary demands change into lasting demands [
8]. In addition, because of the amount of work and high labor costs and the number of subjects per sample, data collected from manual surveys were not readily available [
9]. Hence, a data mining algorithm is proposed to recognize regular SIUs and discuss their proportion among all passengers in this paper only based on smart card data.
Classification methods of public transport (PT) passengers have been discussed in several research papers. Cluster analysis has become the most popular method in the context of user identification studies with different indicators. For example, transit riders’ historical travel patterns are detected by the density-based spatial clustering of applications with noise (DBSCAN) algorithm based on the identified trip chains [
6,
10]. Using one-month transit smart card data, spatiotemporal regularity of individual commuters, including residence, workplace, and departure time, are measured, and PT commuters are identified by leveraging spatial clustering and multicriteria decision analysis approaches [
11]. User-specific areas aligned with different activity locations are used to classify PT passengers, while clusters are characterized by a distinct sequence structure [
12,
13]. While these works highlight the potential of a clustering algorithm, approaches are limited with clustering variables that might ignore or be seriously affected by some abnormal data [
14,
15]. Meanwhile, it takes a great amount of work to reduce noise and extract indicators before processing [
16].
Besides clustering methods, fusion methodologies have been developed to enhance the understanding of travelers’ behavior by combining smart card data with other information, such as Global Positioning System (GPS) data, socioeconomic data, job–housing locations, or individual travel graphs [
16,
17,
18,
19,
20,
21]. Several processing frameworks for data matching and association have been proposed to define commuting trips and extract commuter characteristics [
2,
7,
22]. However, the limitations of these approaches are obvious: (1) the process might not fit all formats of multisource data, and (2) the method is not as efficient as clustering methods, because additional information needs to be collected [
23].
On the other hand, variability and loyalty of PT passengers are detected to reveal factors that affects their commuter patterns and choices [
18,
19,
24,
25,
26,
27]. Disparity in locations of occupations and residences in cities leads to a large amount of commuting, and the geographic relationship between occupation and residence is the core factor that influences the choice of commuting mode [
1,
2,
10,
11,
28]. Locations of jobs and housing partly determine commuting trip mode, and the level of service (LOS) of the subway system contributes significantly in terms of customer satisfaction and route selection [
9,
13,
25,
27]. Moreover, personal characteristics and preferences are also related to the mode and choice of commuting travel, such as age, household income, and occupation level [
14,
25,
29]. Additionally, fare policy has a significant impact on the user’s degree of satisfaction, but not the passenger flow volume [
30,
31,
32]. Ridership statistics and performance indicators mentioned in these studies offer helpful information to determine the principles of SIUs used in this paper.
Automatic fare collection (AFC) has provided transit agencies with huge amounts of operational data, which are widely recognized as having the potential to serve functions beyond the designated purpose of revenue management [
9,
16,
23]. Based on AFC data mining, understanding SIUs and their behaviors with less labor costs is possible, and efforts can be made to enhance the LOS of the subway system to maintain the major users. For subway agencies, the data mining results can be helpful in marketing, encouraging non-SIUs to shift their travel times to less busy hours, and implementing special fare policies for peak travel. Furthermore, defining regular SIUs is useful to provide basic and important data in a subway planning program.
In line with understanding SIUs’ travel patterns, the contribution of this work is twofold. From a methodological perspective, we provide a novel and simple framework for classifying regular subway inelastic trips (SITs) based on three principles, which measure the regularity of SITs spatially and temporally. From an empirical perspective, we analyze and expose the nature of SITs in the Beijing Subway system. The data mining framework is used to understand SIT and non-SIT characteristics from a typical week in 2016 and a similar period in 2017.
The remainder of this paper is organized as follows.
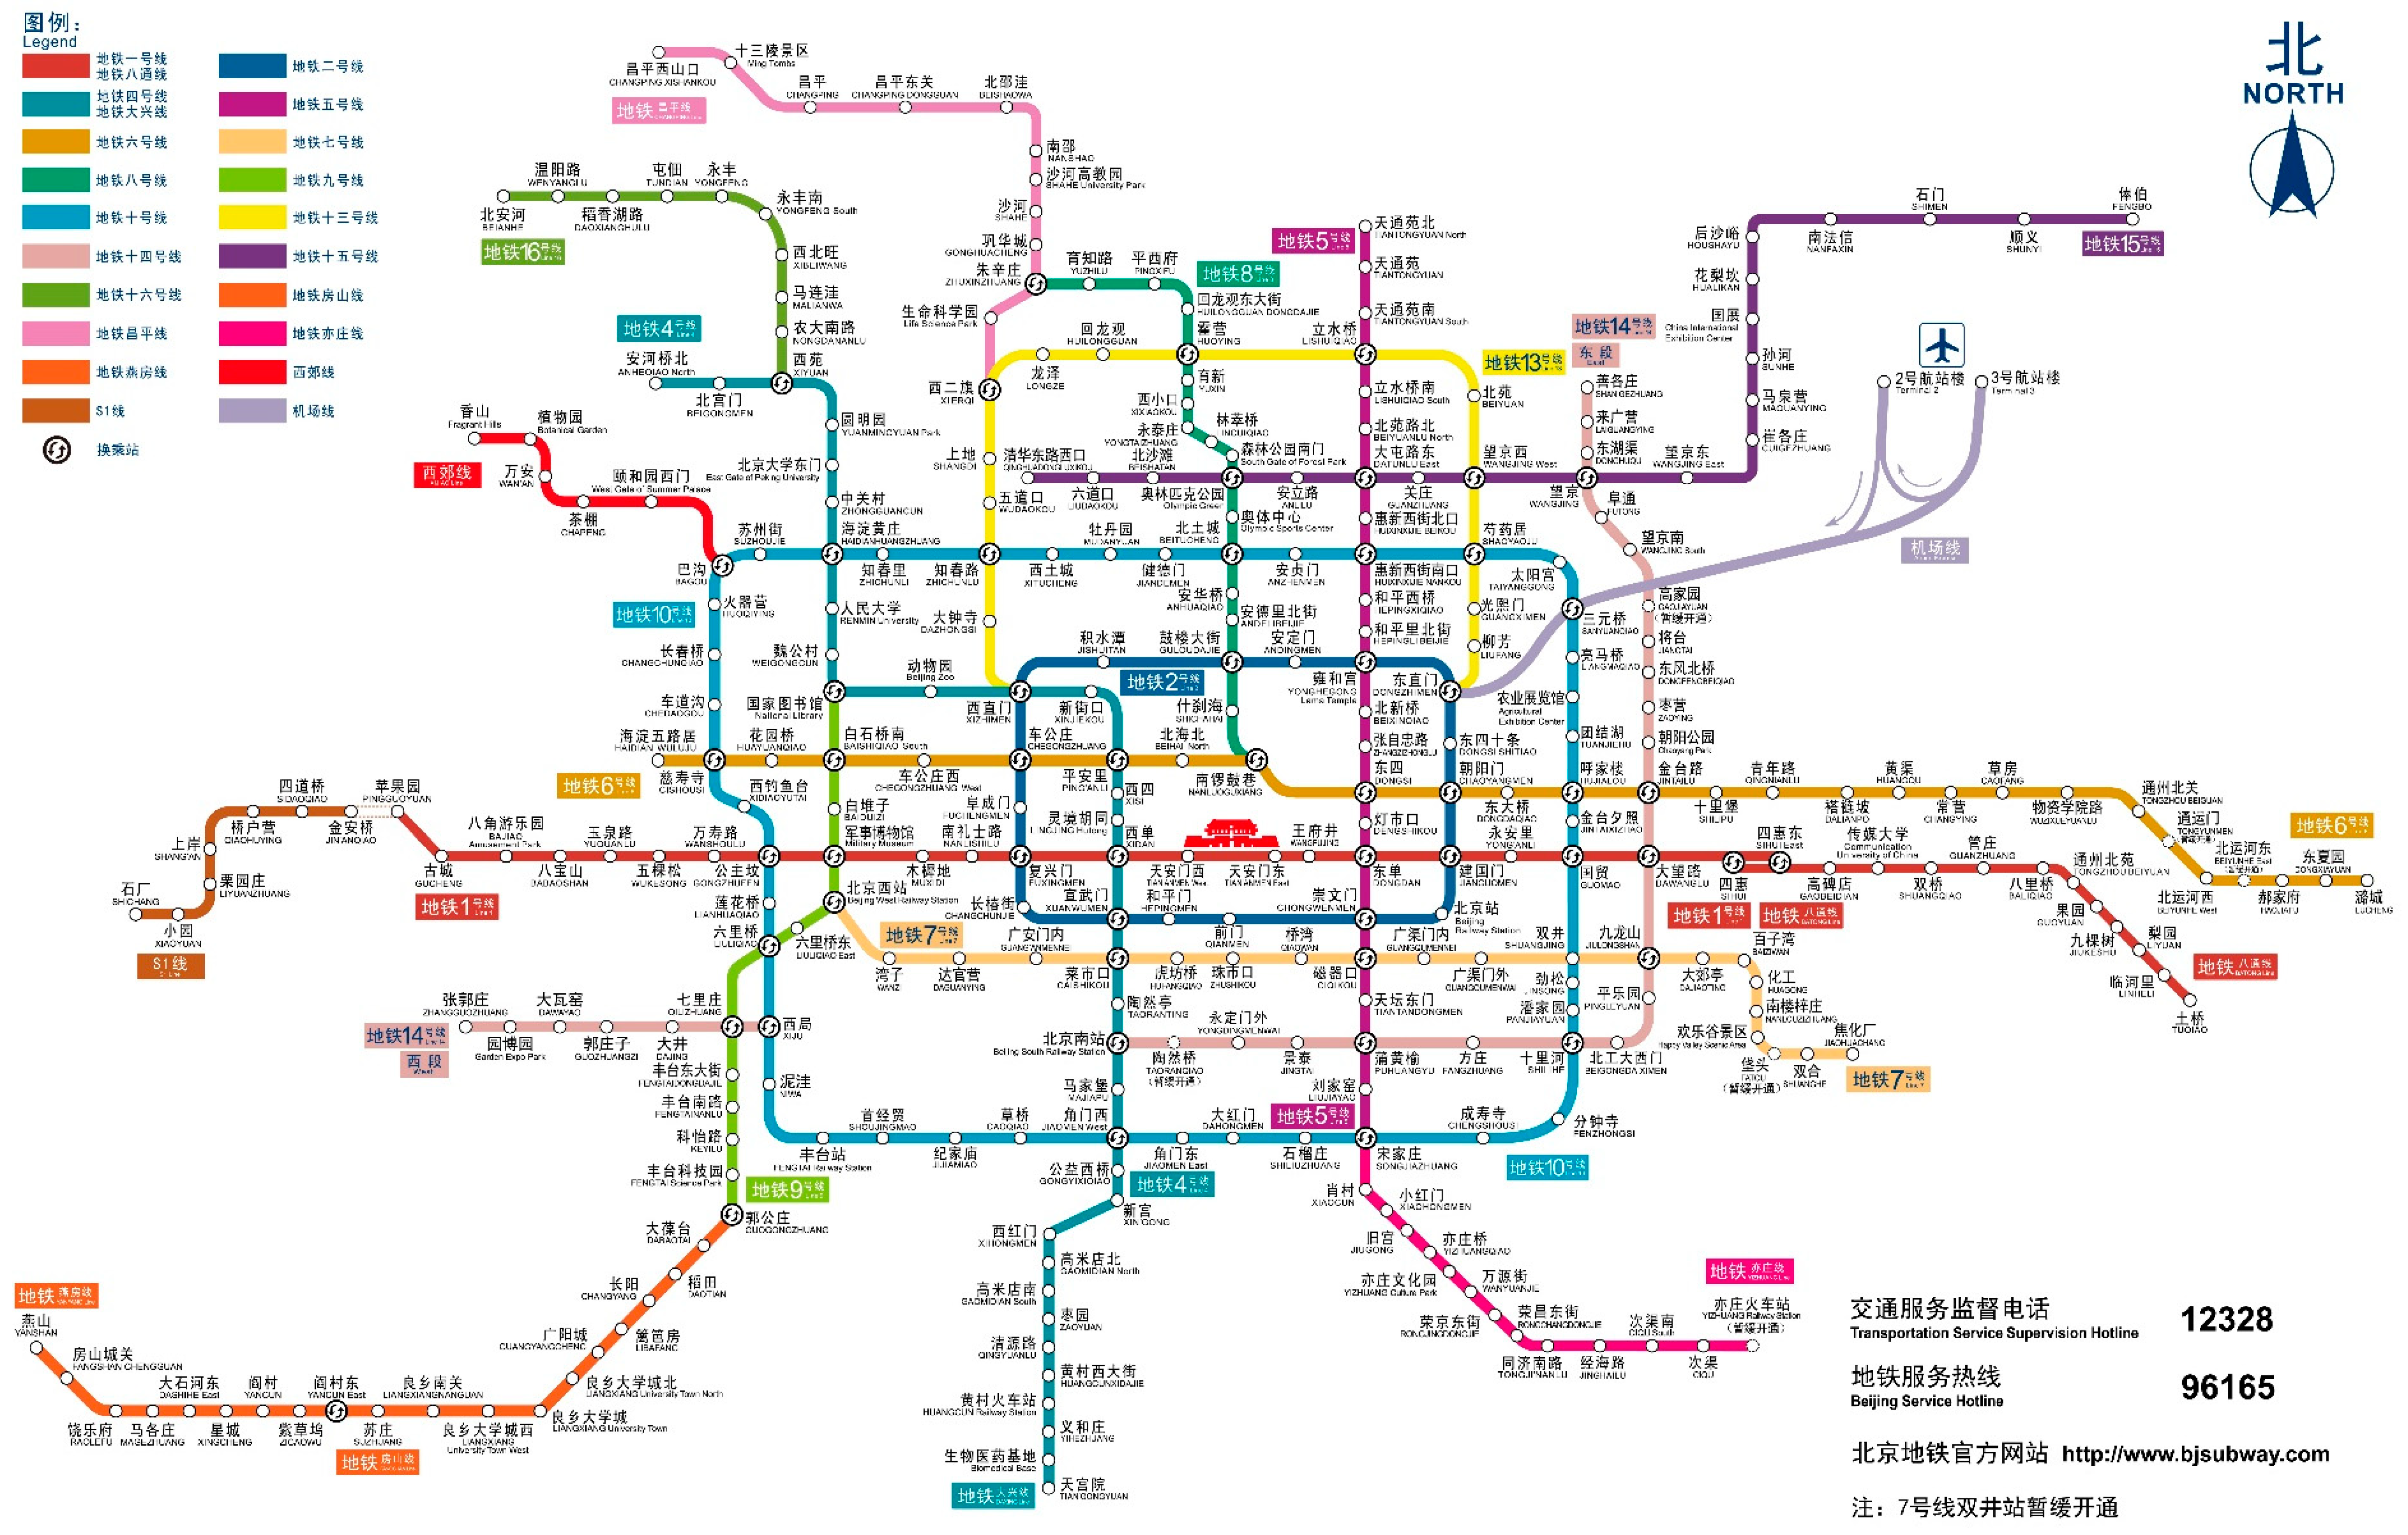
Section 2 discusses the data foundation of the Beijing Subway.
Section 3 provides an overview of the methodology, and
Section 4 describes its application and validation in the Beijing Subway. Finally, the conclusions and limitations of the work are discussed in
Section 5.
3. Methodology
In addition to the growth in passenger traffic attracted by the construction of new lines, fixed user groups are the key to a stable passenger flow in the Beijing Subway system [
3,
4]. This paper focuses on regular SIU identification to understand the main composition of passenger types. A discussion of the methodology follows to present the data mining process in 3 steps: (1)
Section 3.1 presents the data preprocessing, by which the data format used in the study is prepared; (2)
Section 3.2 presents the principle characteristics of regular SIUs and SITs by conclusions from previous studies; and (3)
Section 3.3 presents the data processing framework of SITs for detecting every principle characteristic proposed in
Section 3.2.
To begin with, the abbreviations we use are listed here: subway inelastic users (SIUs), subway inelastic trips (SITs), station code (SC), site number (SN), weekly station sequence (WSS), single station sequence (SSS), daily station sequence (DSS), weekly traveling days (WTDs), repeated station sequence (RSS), and entry time difference (ETD).
3.1. Weekly Station Sequence (WSS)
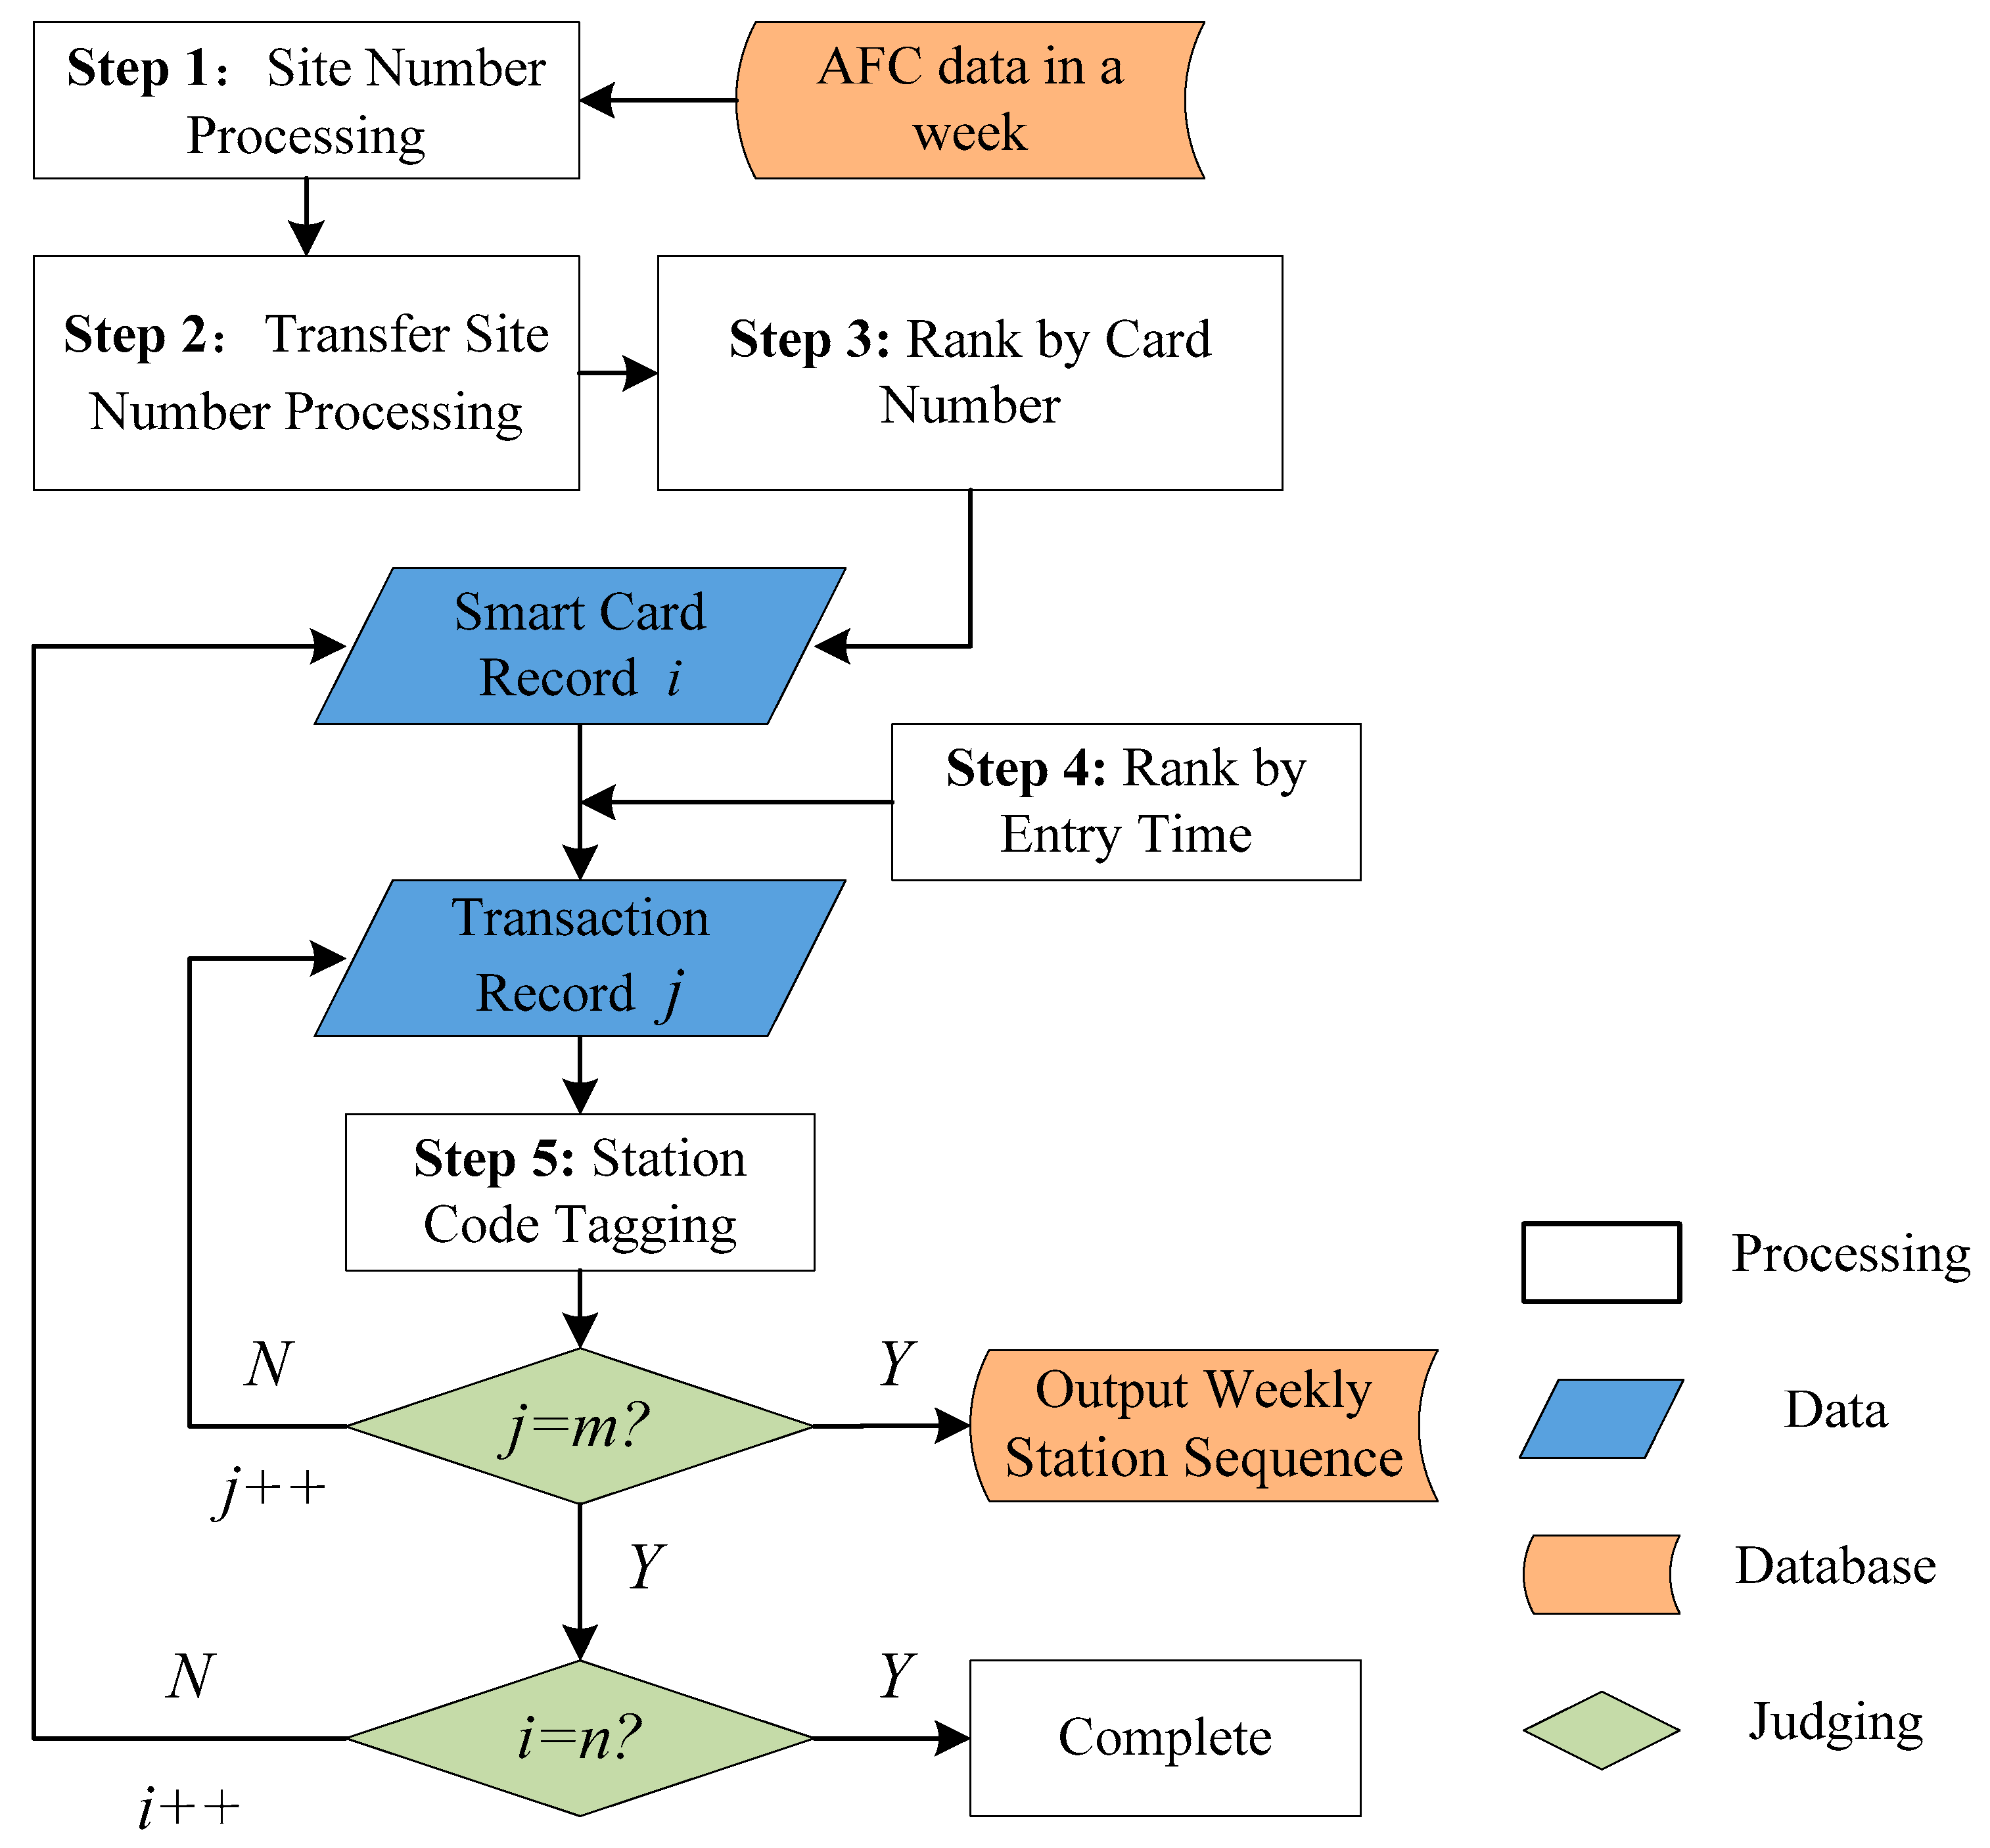
Weekly station sequence (WSS) is selected as the data-based format in this paper, which refers to a string of numbers consisting of station code (SC) within a week. WSS includes the user’s inbound and outbound station number by comparing whether the station is the same with the previous ones.
Figure 3 shows the data mining procedure for extracting WSS from weekly transaction records of the AFC data system. The details of the WSS tagging process are shown in
Table 2.
Taking an example of the transaction records in
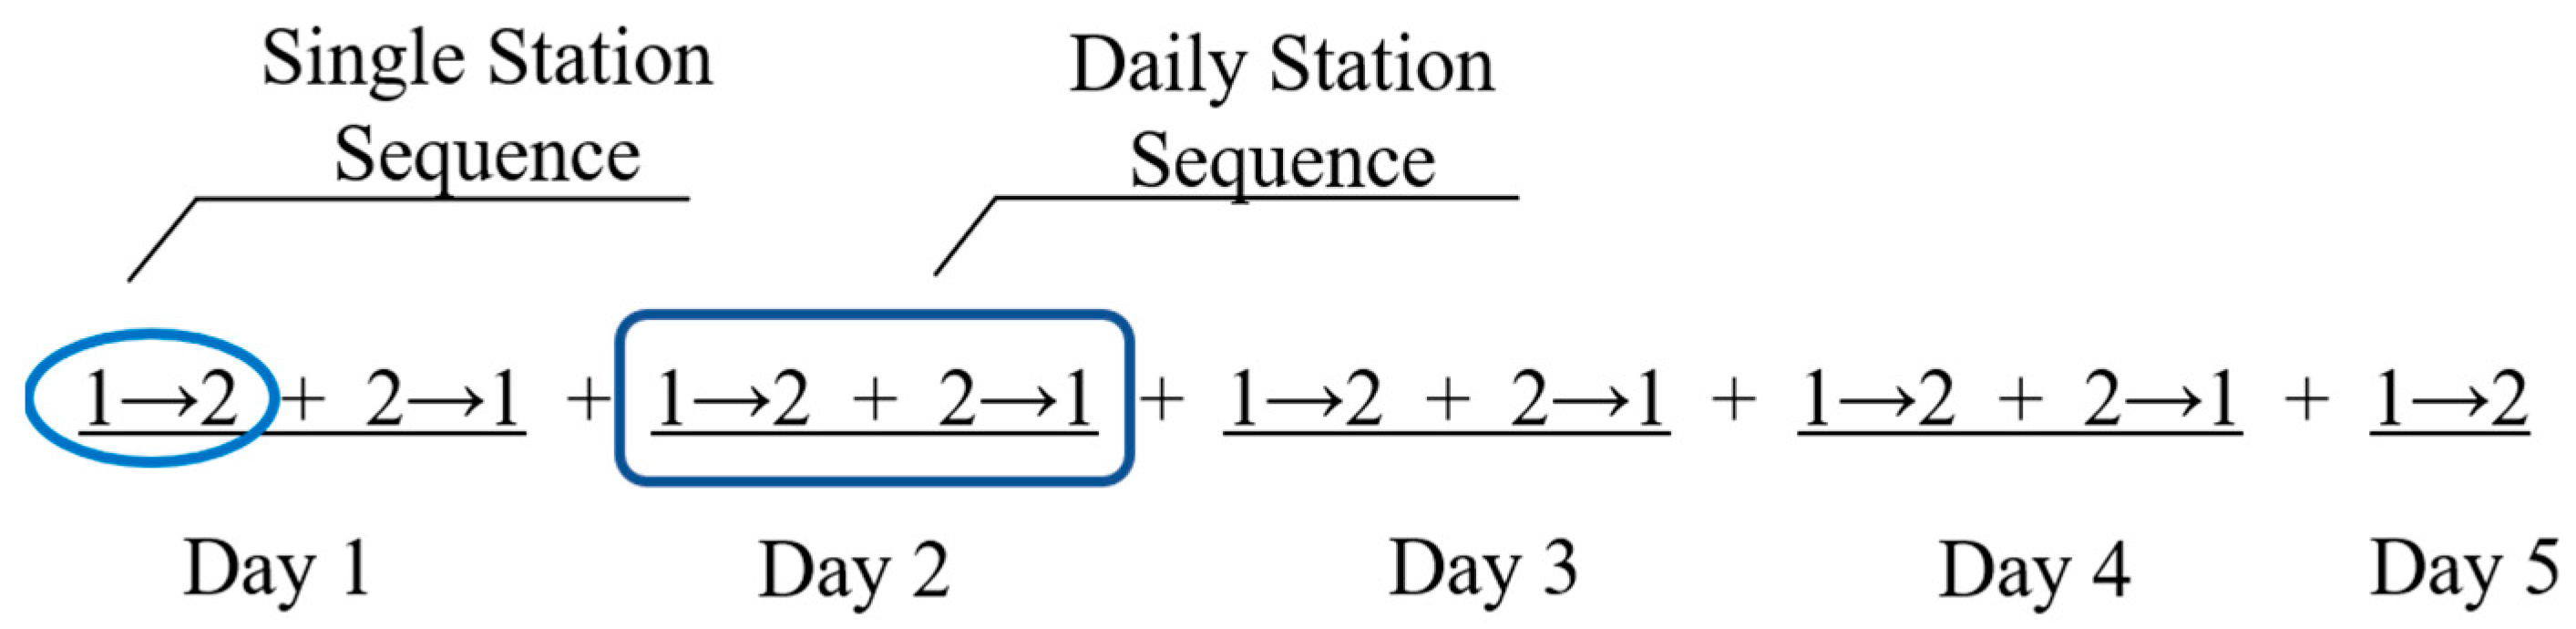
Table 1, the data mining results of WSS are computed as the array format shown in
Figure 4. Single station sequence (SSS) presents a single trip from origin to destination, which constitutes a daily station sequence (DSS). It can be determined in
Figure 4 that the user traveled between the first station and the second station from Day 1 to Day 4, and did not return by subway on Day 5. Furthermore, in WSS format, we adopt an arrow to indicate a trip and a plus sign to distinguish different trips. Therefore, WSS contains information about the selected stations, which is useful for detecting the regular stations and trips.
3.2. Subway Inelastic Trip (SIT) Identification Principles
Many studies have discussed how to recognize SIUs’ travel patterns by detecting the temporal and spatial characteristics of their trip chains [
12,
13,
22]. Indicators such as traveling days, route sequences, stops, and departure times are defined to measure the commuting intensity of each transit rider [
6,
11]. The frequency of the indicators or the thresholds of the frequency are the main factors to describe SIUs’ behavior. For example, traveling days in a week (≥3) with a time interval (≥7 h) is used as a condition to distinguish public transport commuters [
20]. Complex indicators such as the travel space balance or a sequence of intervals are introduced to identify passengers’ travel patterns [
9,
12,
13].
Most studies have concluded that: (1) SITs always repeat stops and lines with high probability, and (2) SIUs are used to choosing the same travel route and time every day. These conclusions provide the rationale to identify SITs. If the spatiotemporal characteristics of subway trips can be detected in a proper way, SITs can be recognized and identified [
2,
8,
33]. Hence, we focus on checking the spatiotemporal regularity and repeatability of trips to distinguish SITs and non-SITs in this paper. The repeated routes and stations are identified by detecting the WSS, and the repeated travel time is checked by comparing the entry time of the repeated station sequence (RSS) subsequently.
In summary, we determine to set SIT identification principles from 3 aspects: (1) number of weekly traveling days (WTDs), (2) number of repeated station sequences (RSSs), and (3) entry time difference (ETD) of RSSs. The specific principles for SITs are described as follows.
3.2.1. Principle 1: WTDs ≥ 2
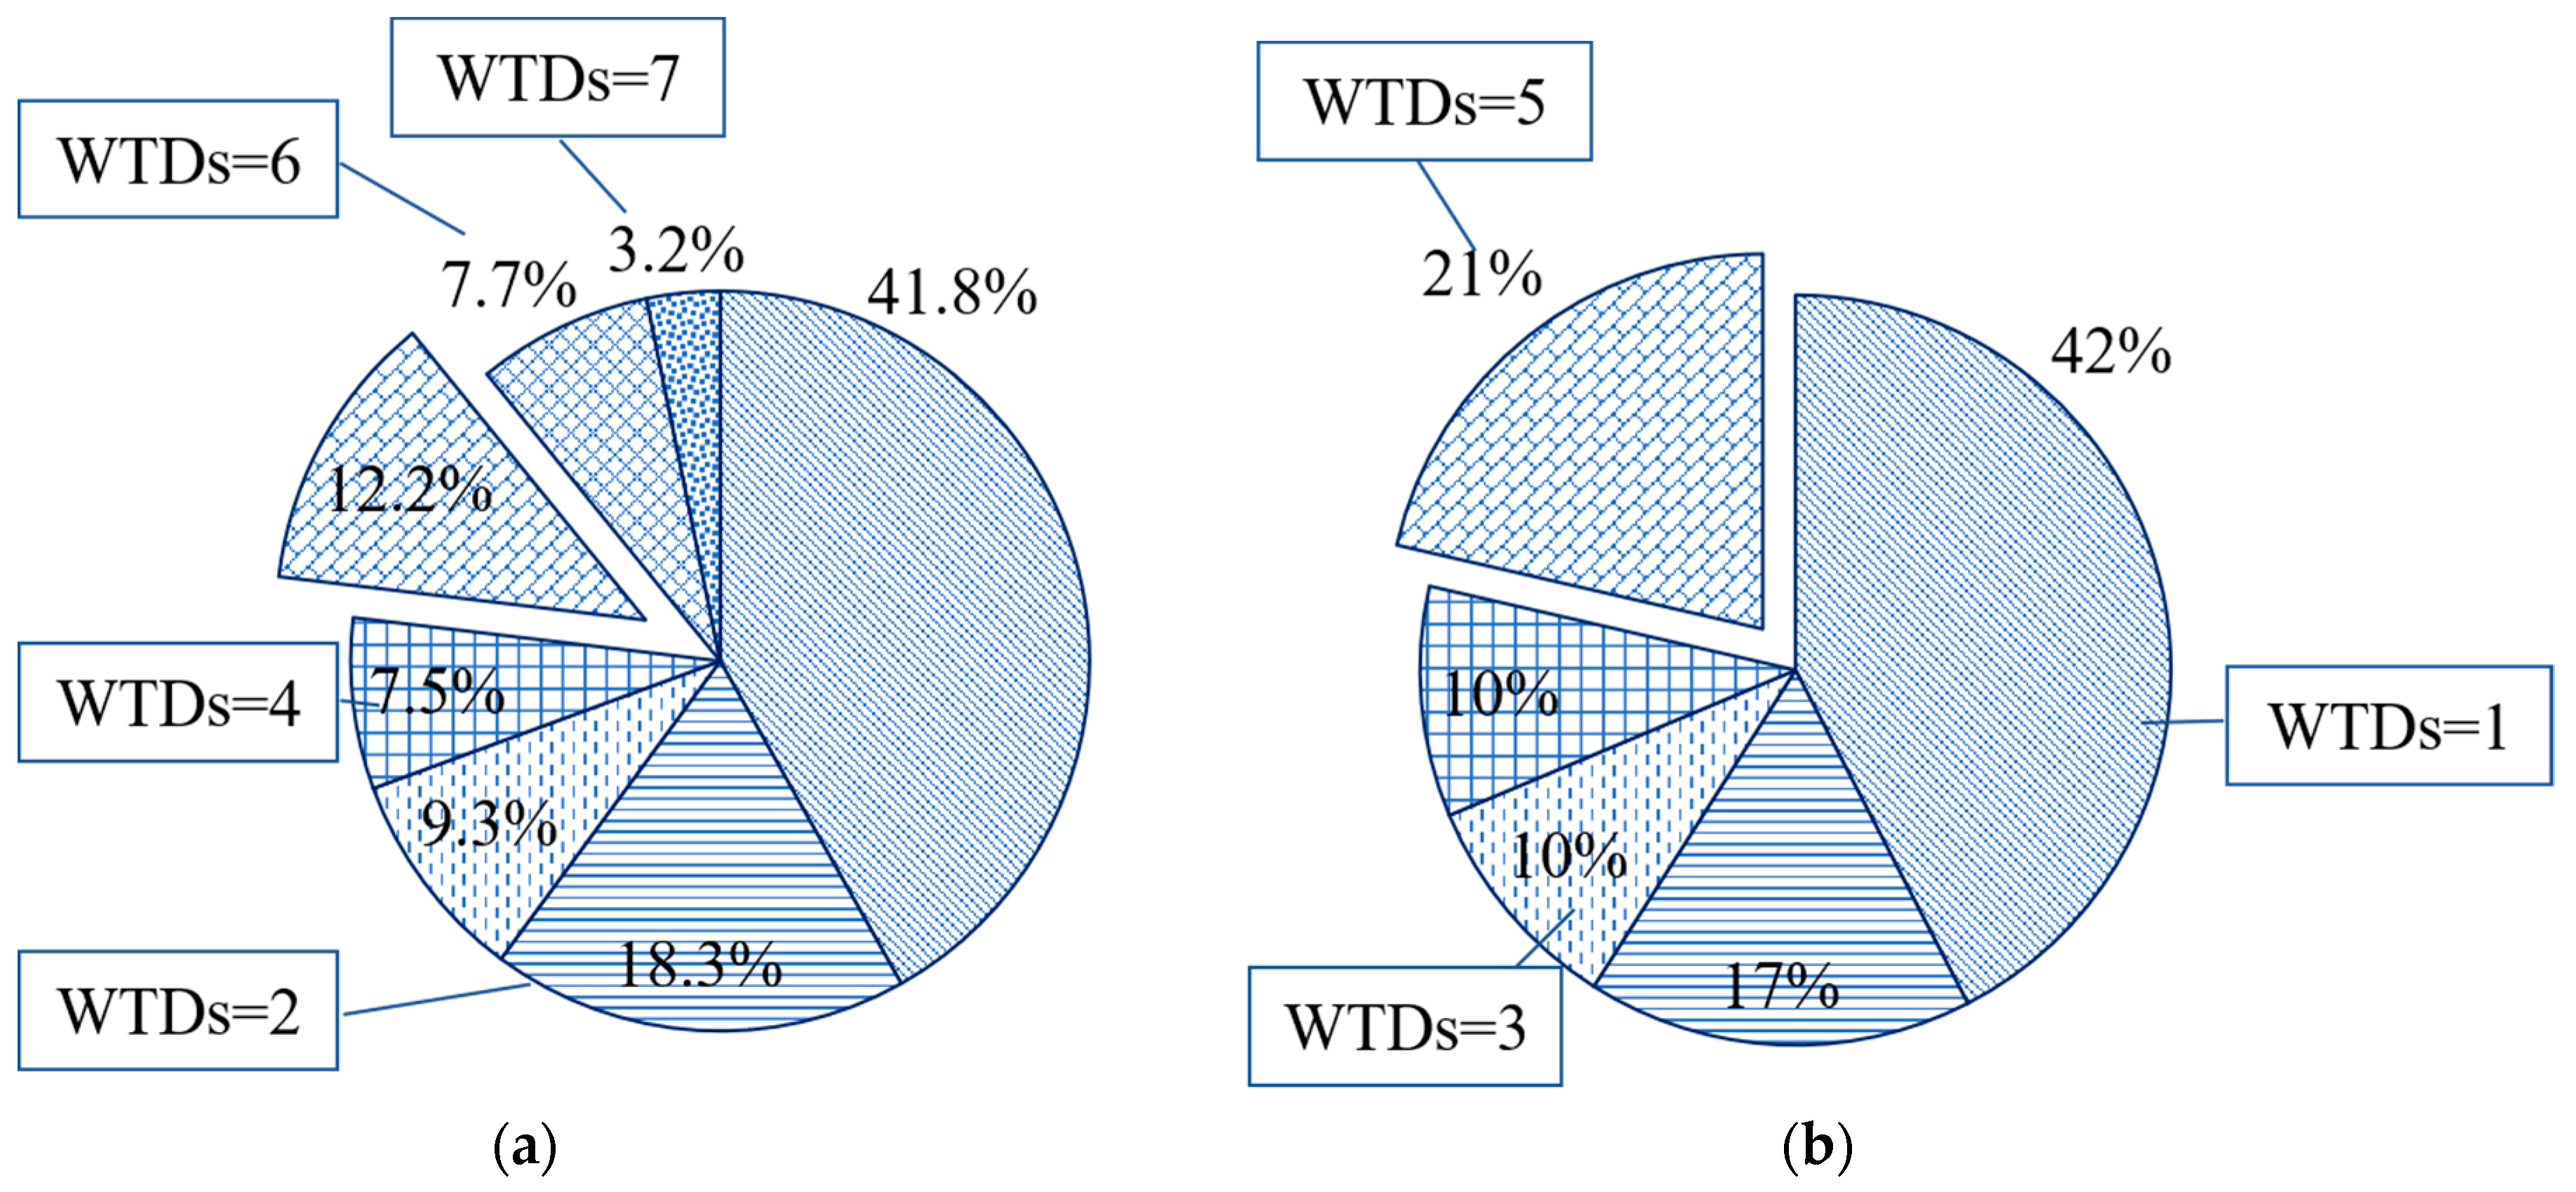
Weekly traveling days (WTDs) refers to the number of the days that users travel by subway in a week.
Figure 5 shows the distribution of subway users according to WTDs. It indicates that the proportion in a week or on workdays is around 42% when WTDs is equal to 1. About 23.1% of subway users travel by subway 5 or more days a week, of which 7.7% have 6 WTDs and 3.2% have 7.
If a user only takes the subway once a week, the transaction record might not contain enough information to understand the user’s travel demand [
33]. These are usually called one-way trips, and users are considered random users who might not travel regularly by subway [
17]. Hence, the condition WTDs ≥ 2 is employed to exclude random users and improve the efficiency of the SIT identification algorithm. In addition, the authors do not adopt traveling on workdays as a principle, because there is still a small group of SIUs who travel on weekends in Beijing.
3.2.2. Principle 2: RSS ≥ 2
Repeated station sequence (RSS) refers to an SSS that happens more than once. RSSs show the stations and routes that subway users choose every day, which indicates their origin and destination. RSSi is presented to the i RSS in a WSS. For example, in
Figure 4, there are 2 RSSs in the WSS. RSS
1 is 1→2, which appears 5 times, and RSS
2 is 2→1, which repeats 4 times. In this case, the first station can be predicted as the one near home and the second station as the one near the workplace.
Principle 2 focuses on the spatial regularity of SITs. The condition RSS ≥ 2 is employed to check that SITs at least repeat more than once. Though some studies require 3 times as a condition, we made it 2 to prevent missing some SITs [
2,
11,
33].
3.2.3. Principle 3: ETD [0, 30 min]
Entry time difference (ETD) of RSS refers to the entry time difference between repeated SSSs. It can be counted by Equation 1:
where
is the entry time of trip k of RSSi;
is the minimum of the absolute value of the time difference between
and the other trips of RSSi; and n refers to the repeated times of RSSi.
Principle 3 aims to measure the temporal regularity of SITs. Previous research has found that commuter travel time is concentrated in the morning and evening rush [
2,
8]. In Beijing, the average travel time in the morning and evening rush is 62.3 min and 52.8 min, respectively [
3,
4]. The threshold 30 min (about 50% of the average travel time) is set, for beyond that threshold riders might be late for their destination.
3.3. SIT Identification Framework
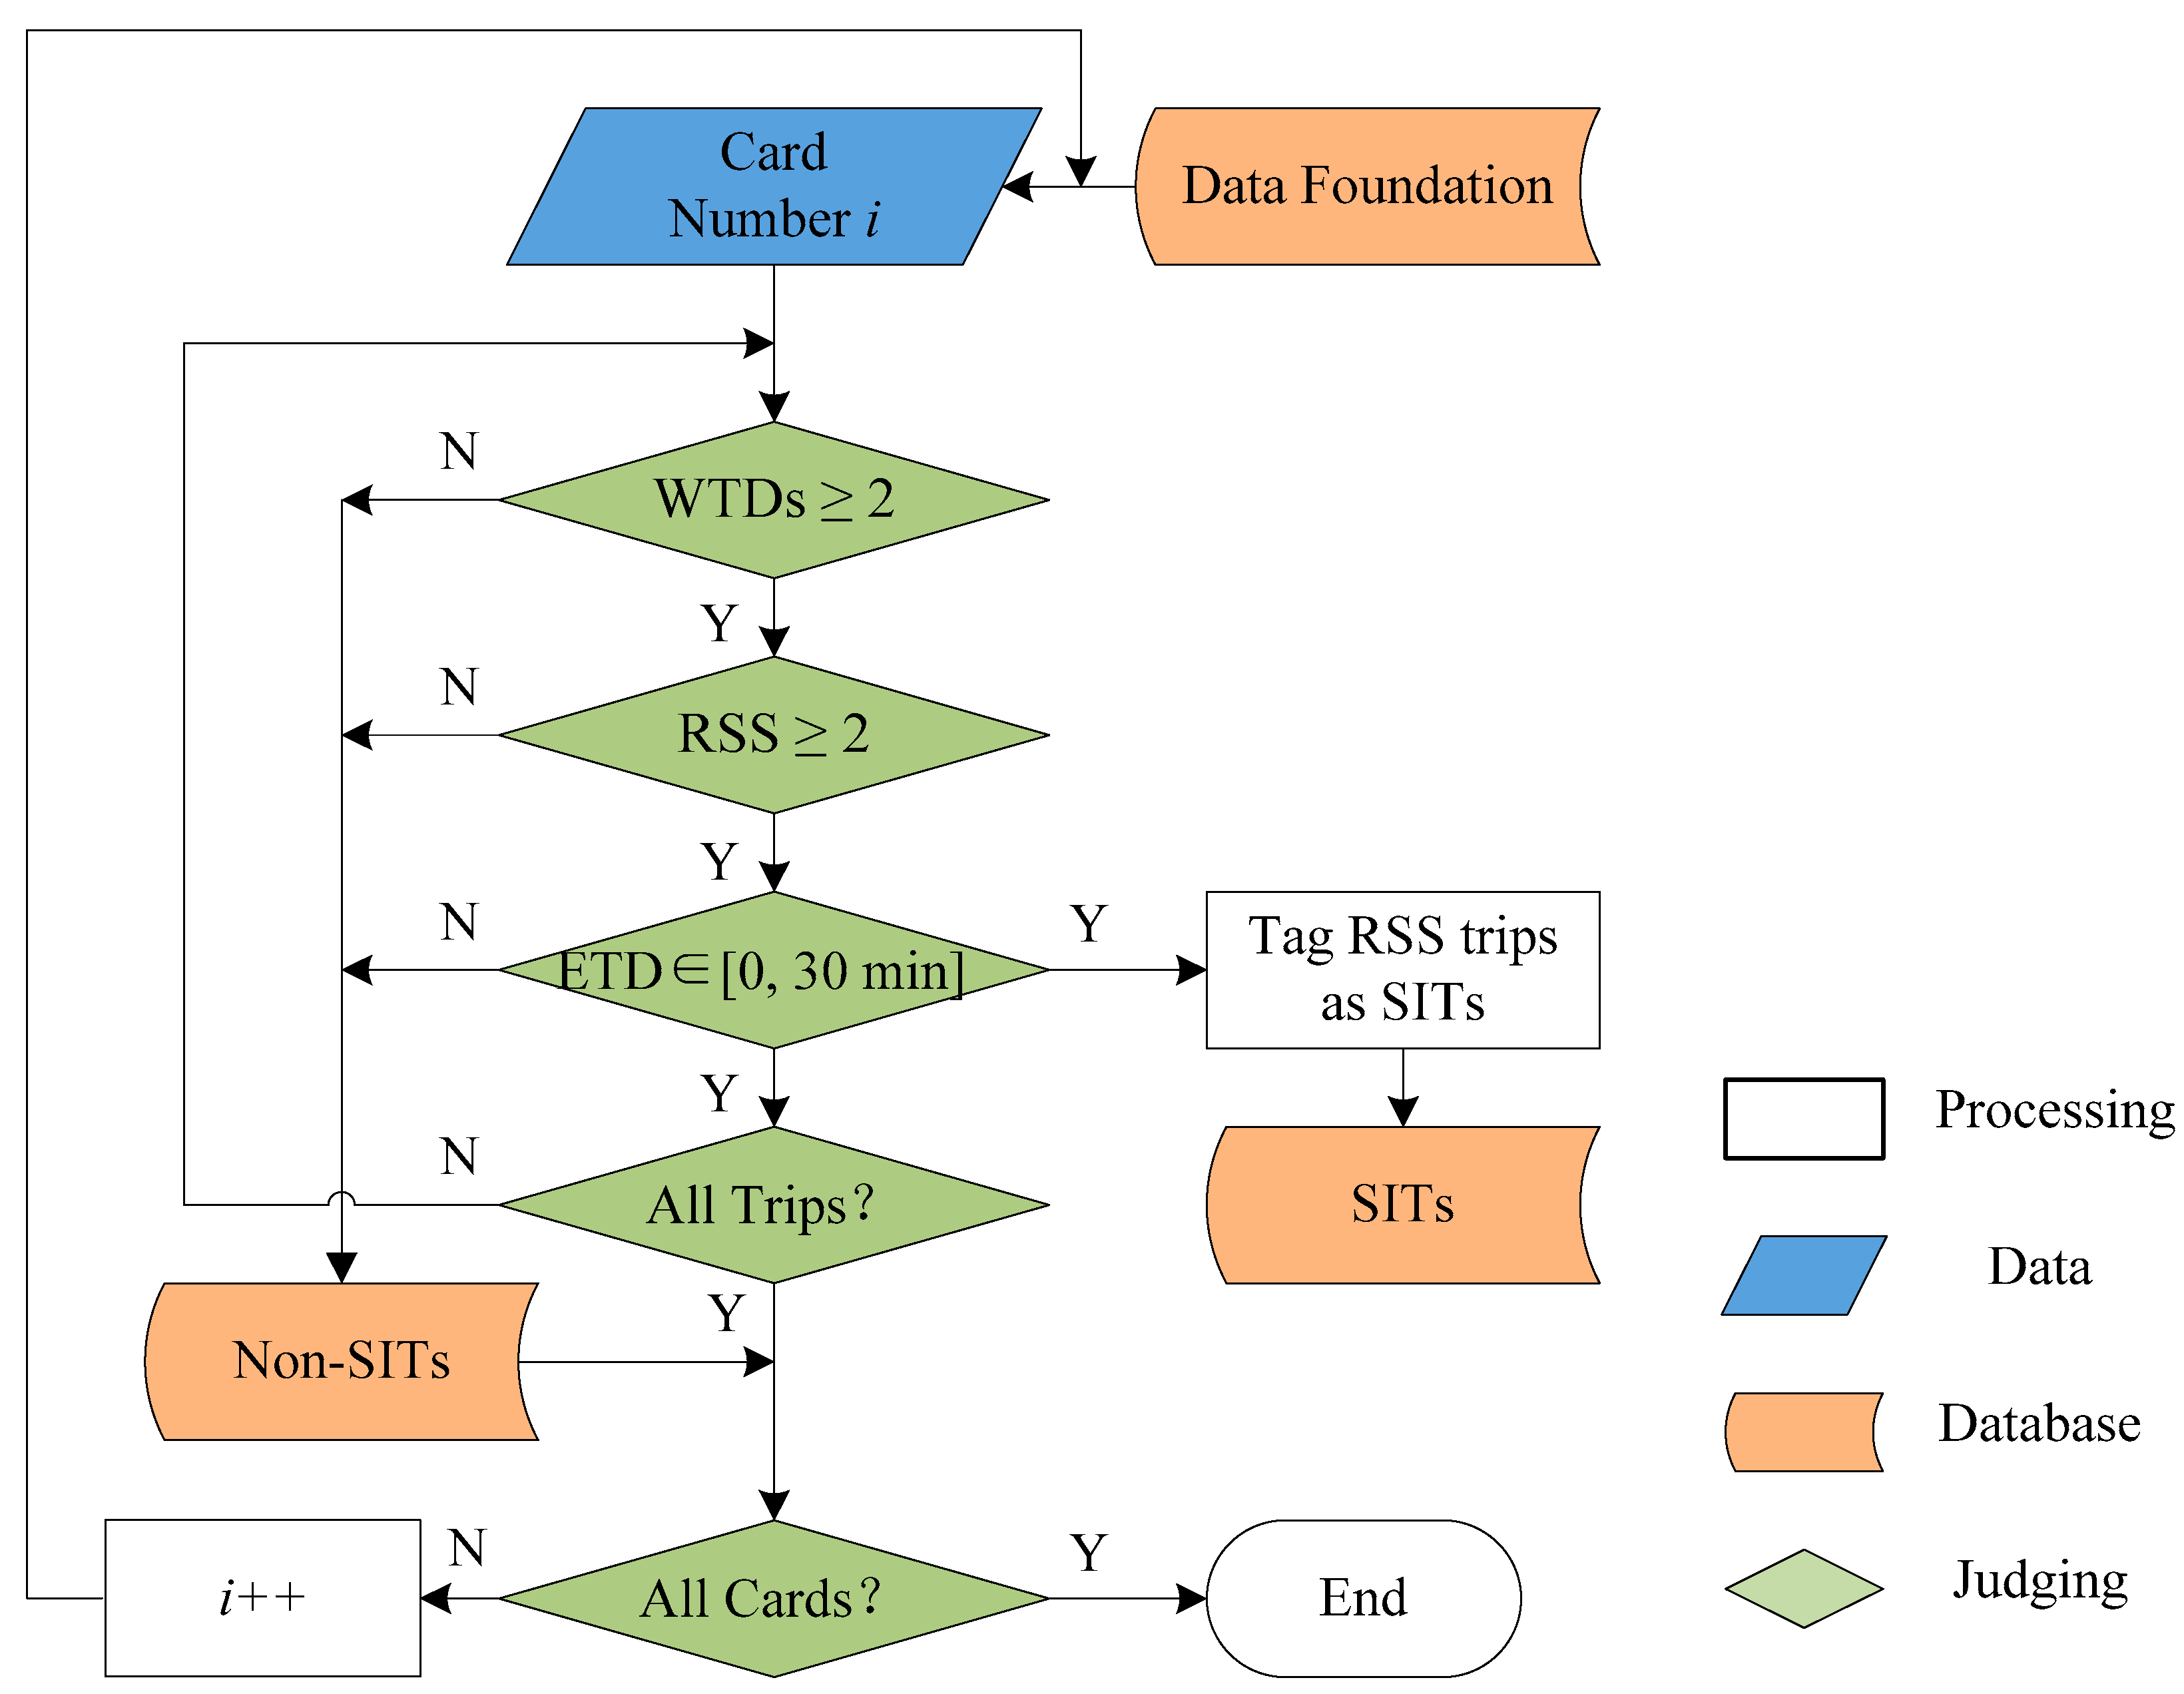
Based on the principles mentioned in
Section 3.2, the framework of SIT identification is designed as in
Figure 6. The input is the foundation database of all trips, and the output is the SIT database, which contains the identified inelastic trips. First, we read the data prepared in
Section 3.1 and renumber all cards. For Card Number i, transaction records are checked by Principle 1. If WTDs ≥ 2, proceed to the next step; if not, transaction records of Card Number i will be removed to {Non-SITs}. Then transaction records are judged by Principle 2 and Principle 3 until records of Card Number i are recognized and SITs are tagged and stored in {SITs}. When all cards and records are detected, the process ends.
4. Validation and Discussion
To validate the effectiveness of the proposed SIT identification method, a detailed revealed preference survey (RP) was conducted to collect the travel attributes of smart card holders in Beijing in May 2017. The RP survey was carried out around five subway stations by asking users to answer a questionnaire on the spot. The questionnaire included questions about personal information such as age, income, and occupation, and travel information such as trip purpose, travel route (origin and destination stations), and travel time. Crucially, every respondent was required to input his/her smart card number and trips were defined as a SIT or not based on this trip information.
The survey finally collected 453 samples, of which 389 card numbers can be matched to data collected in 2016 and 396 card numbers in 2017. In the available information, 247 of 389 and 224 of 396 are SIUs, and 142 of 389 and 172 of 356 are non-SIUs. We verify the accuracy of the SIT identification method by detecting collected data in {SITs} or {Non-SITs}, and the results are shown in
Table 3. The average accuracy rate of SIUs is as high as 94%, a little lower than the accuracy rate of non-SIUs, which is favorable proof of the proposed framework for SIT identification. Though the average accuracy rate is not higher than the results from previous studies (94.1% in [
11] and 94.5% in [
21]), the framework works in a simple way without as much work in mining data and collecting personal information.
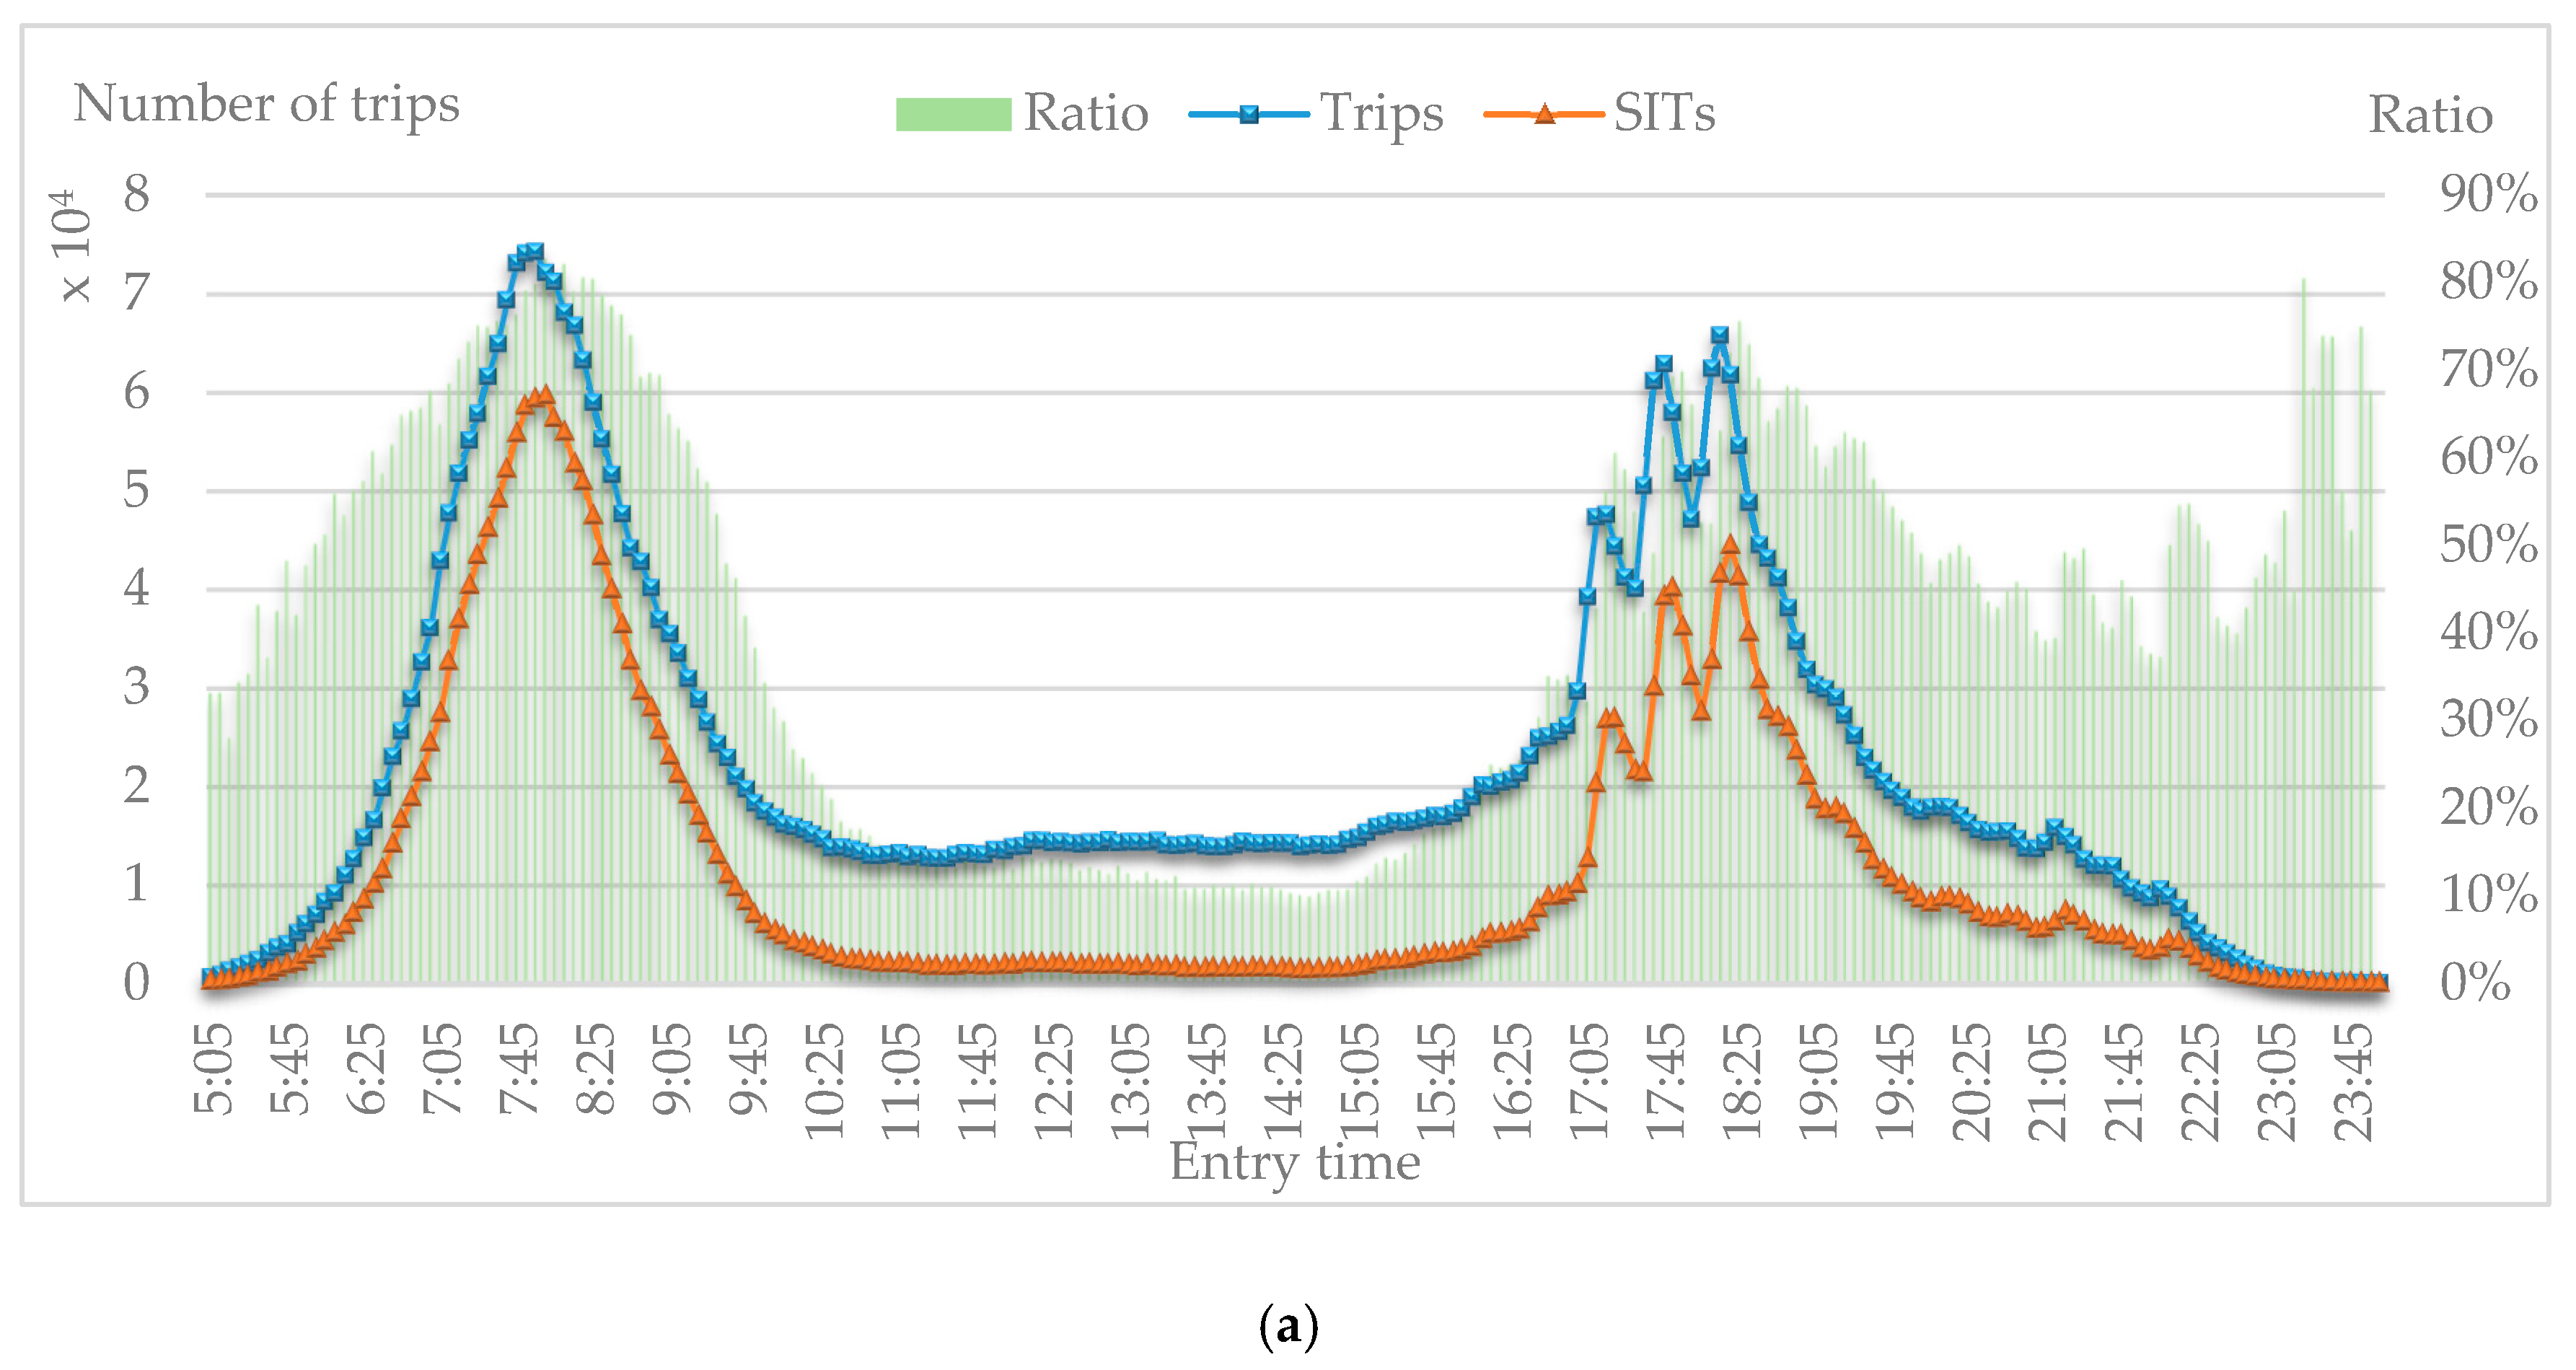
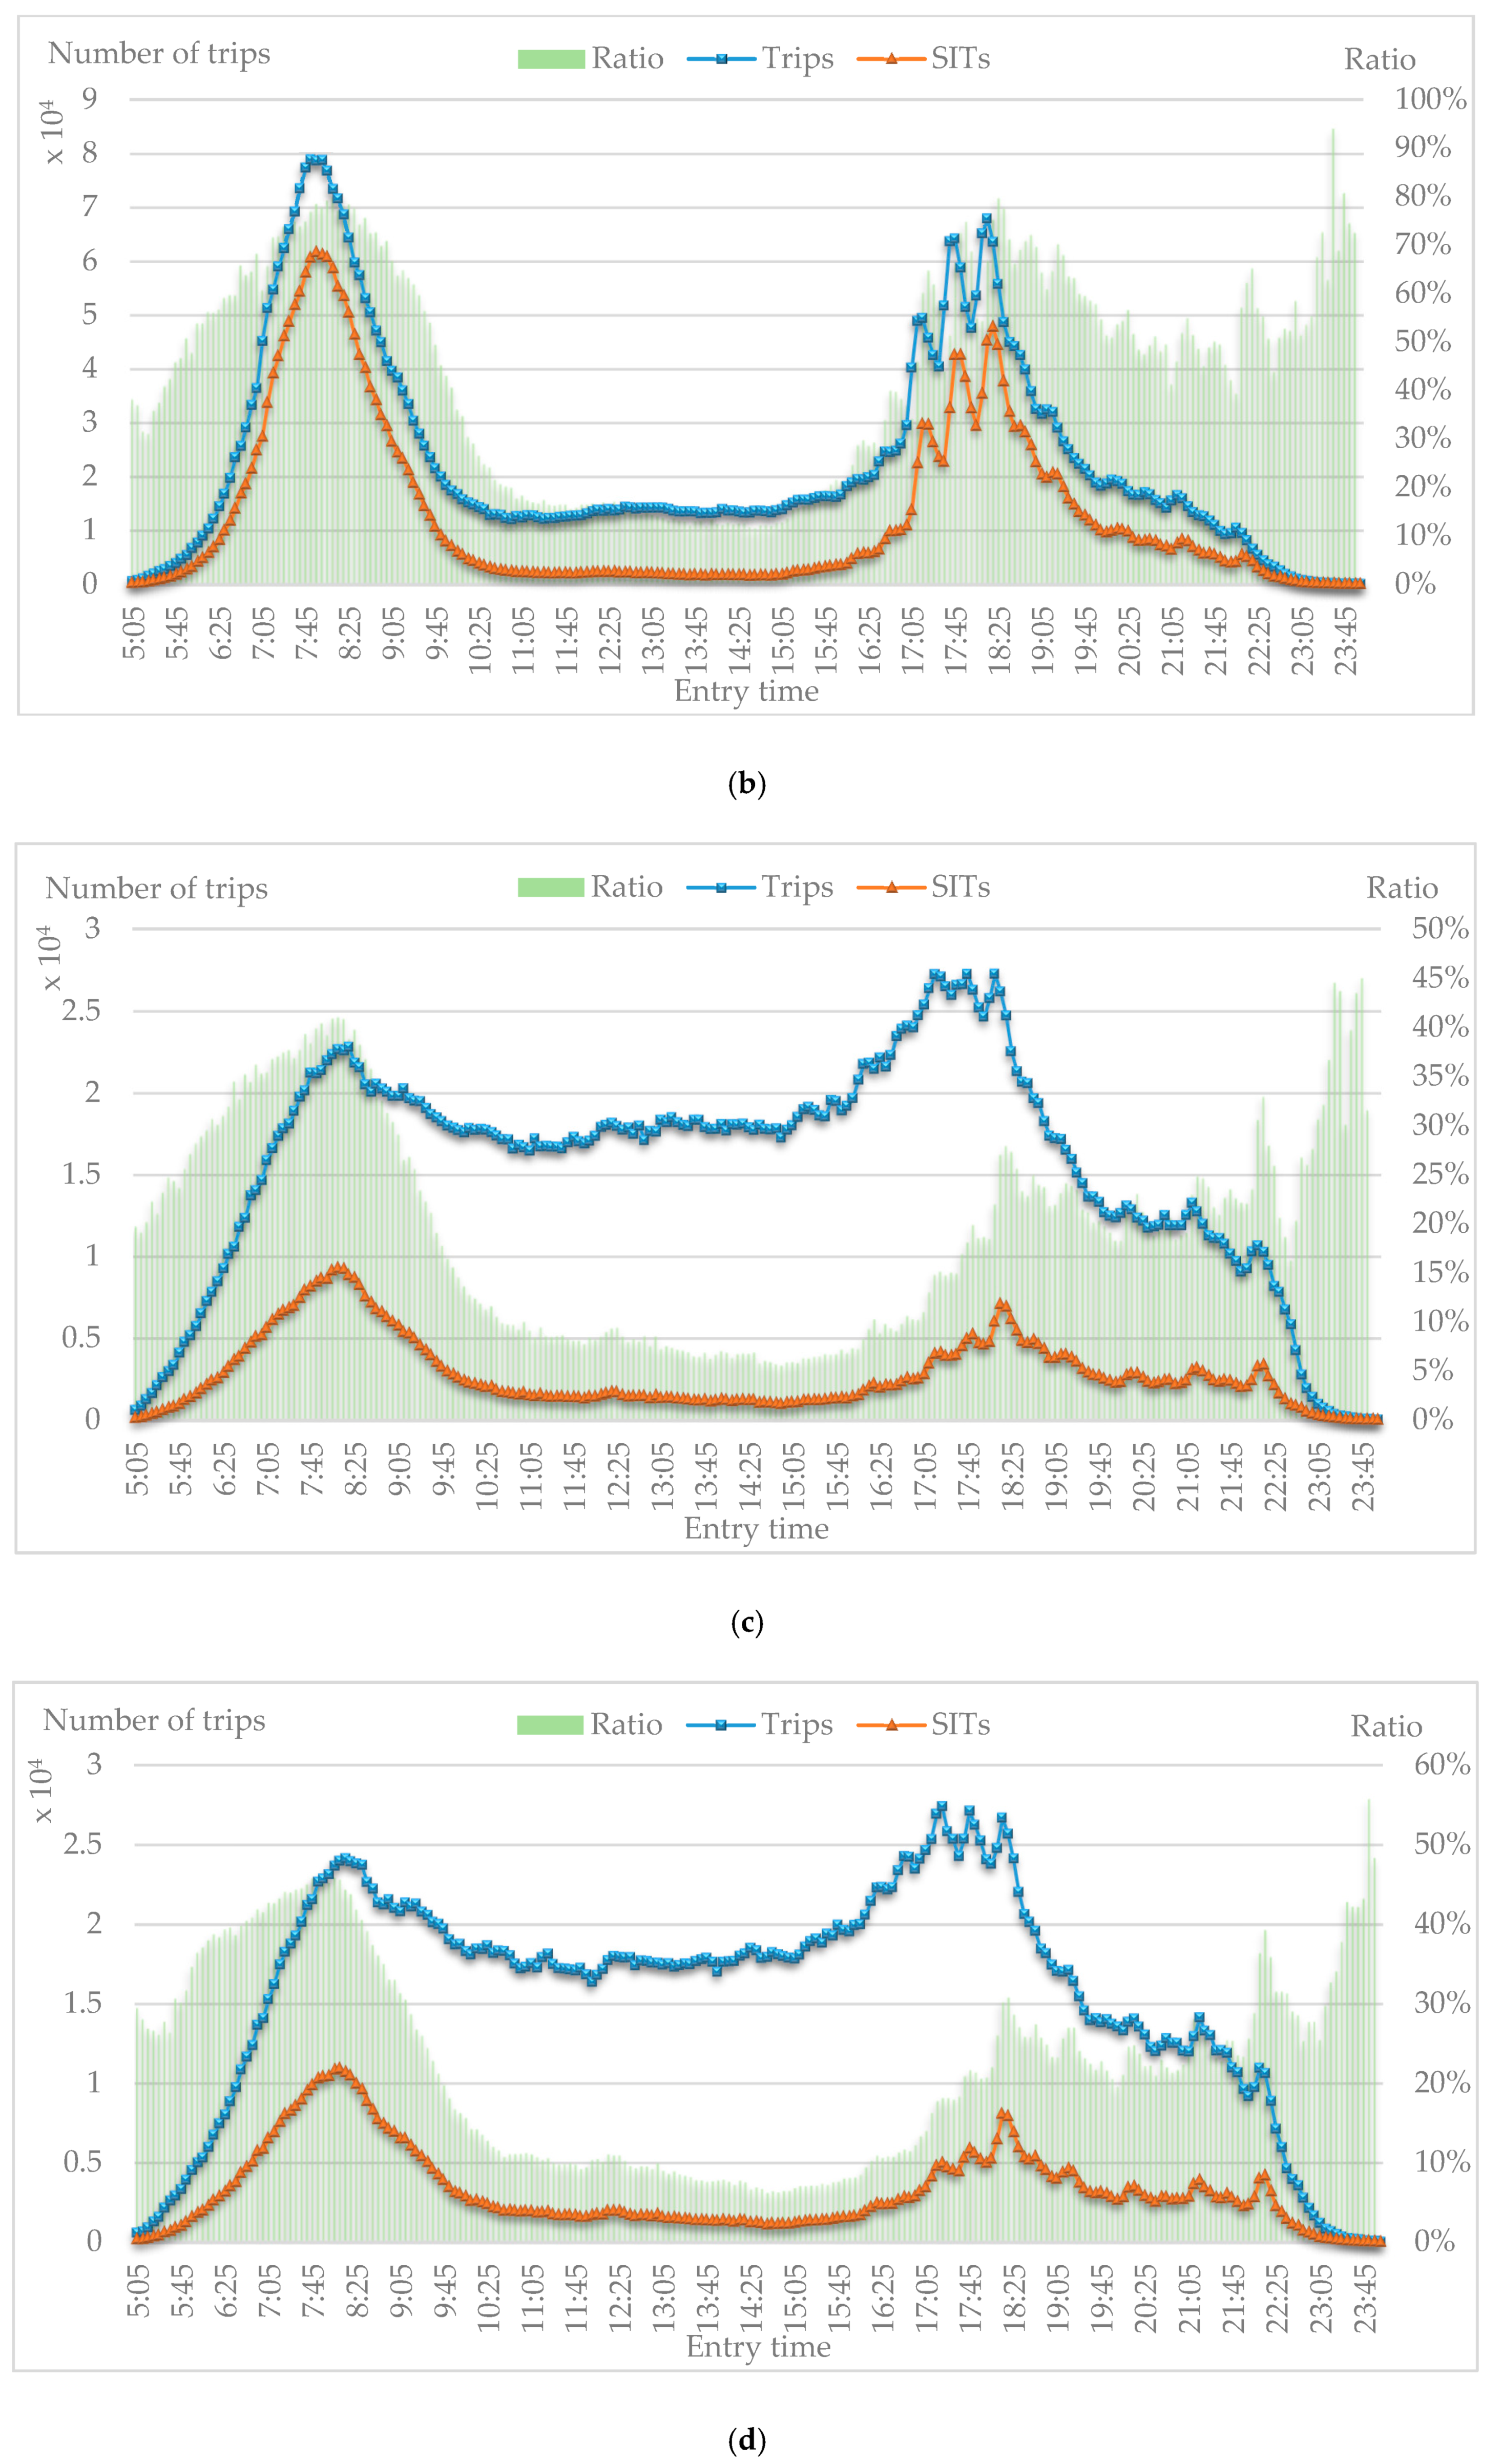
We analyzed the distribution of entry times of all trips and SITs to estimate classification and stability of SITs. With 14 distribution figures extracted from two weeks of data from the Beijing Subway, the curves and values of these distributions are found to be extremely similar for workdays and weekends. Hence, only four representative figures are demonstrated in
Figure 7. The horizontal axis presents entry times in 5 min intervals from 05:00 to 23:55, and the left ordinate shows number of trips (transaction records), while the right ordinate presents the ratio of SITs to all trips from 0% to 100%. Distributions of three indicators are shown in the figure: (1) trips refers to number of all trips, (2) SITs refers to number of SITs, and (3) ratio refers to the ratio of SITs to all trips.
Figure 7a,b shows two distributions of trips on Wednesday, for which the SITs curve is close to the trips curve with two peak hours (07:00 to 09:00 and 17:05 to 19:05). Meanwhile, the distribution of ratio has three peak areas (07:00 to 09:00, 17:40 to 19:40, and 23:20 to 23:35). The highest ratio reaches more than 80% in peak hours, and the average of ratio is about 75.6% in morning peak hours and about 64.2% in evening peak hours. The peak area from 23:20 to 23:35 indicates that a small percentage of passengers prefer to regularly travel at night.
Figure 7c,d shows two distributions of trips on Saturday. The similarity of the SITs curve and trips curve on weekends is not as high as what appears in
Figure 7a,b. The ratio is below the value on workdays; however, there are still about 40% of SITs travelling in the morning and night peak hours.
The distributions of trips suggest that SITs extracted by the proposed method are stable in number of SITs, travel time, and ratio of SITs to all trips on workdays, which is consistent with the definition of SITs. Additionally, some special SITs (such as those on late nights and weekends) were detected, which is in line with the diversity of occupations in Beijing [
1,
18]. In short, the distribution of trips strongly proves the feasibility of the proposed method.
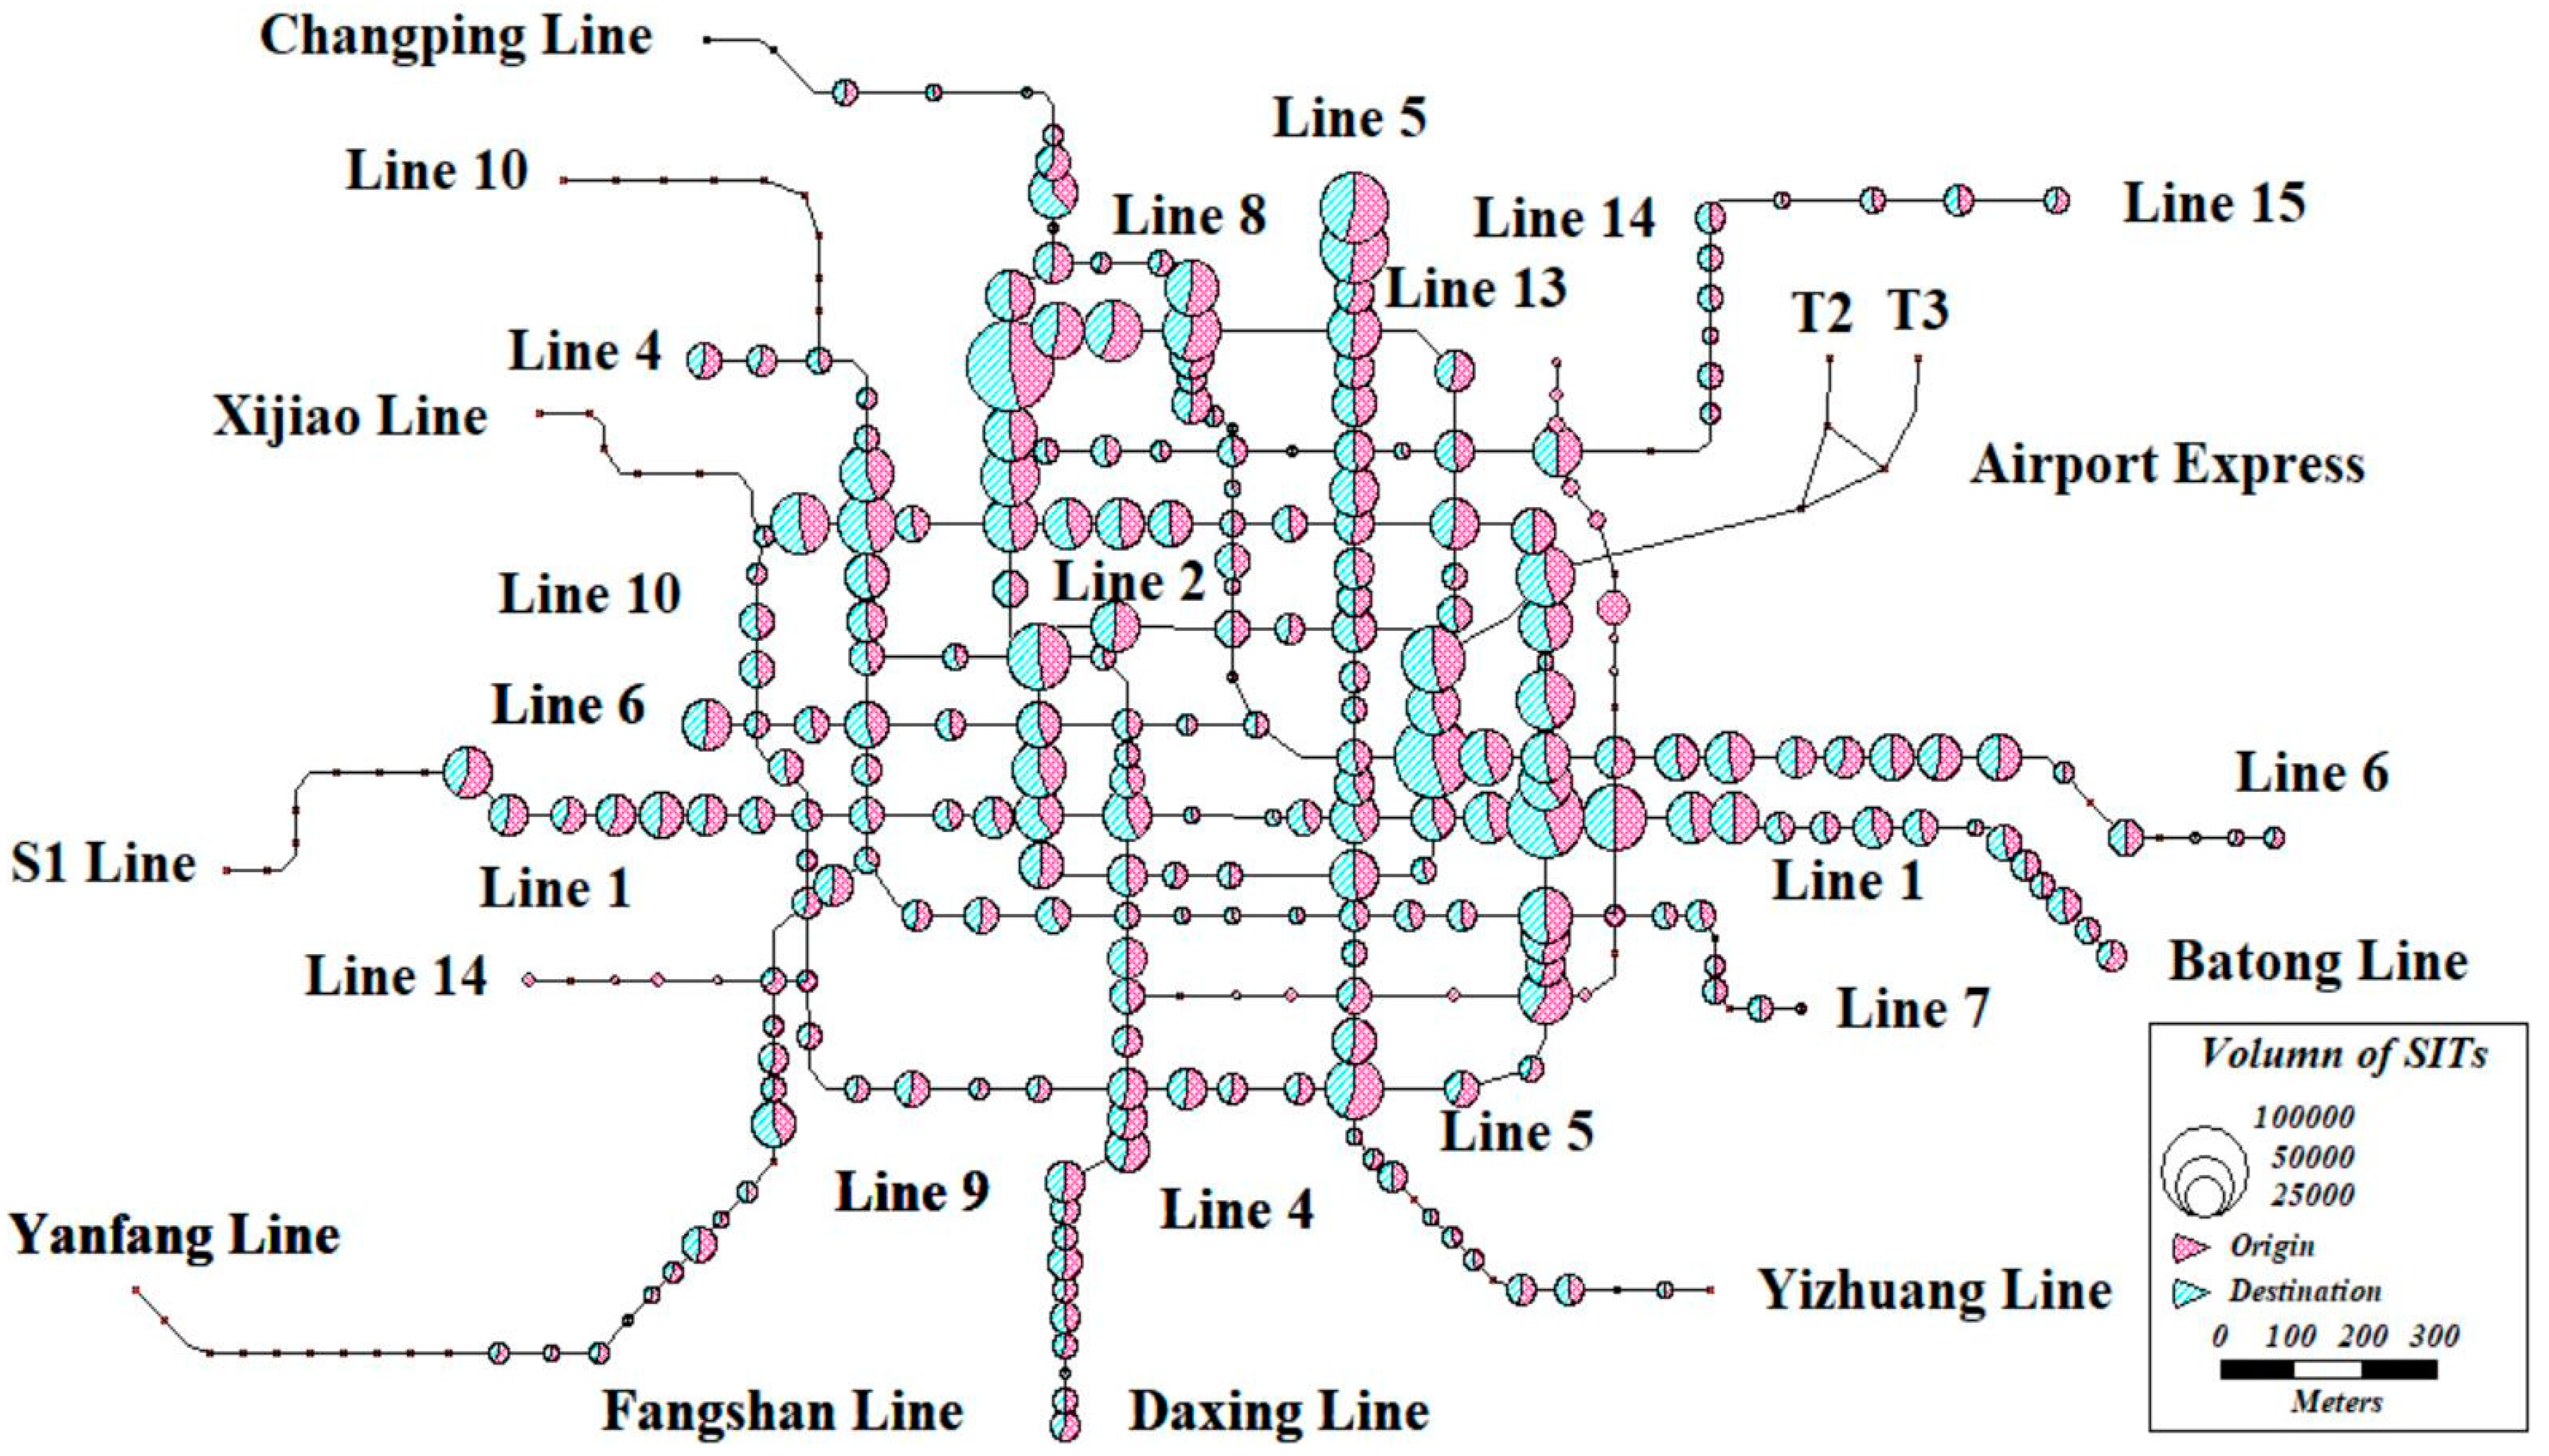
We further analyzed origin–destination (OD) distribution of SITs based on subway stations, and the distributions are also found to be similar on workdays and weekends. An example of OD distributions is shown in
Figure 8. First, distributions of origin are matched to distributions of destination, which indicates that most SIUs always prefer the same station as an origin or a destination and return to the origin station. This characteristic of SIUs has been proved and discussed in many studies [
1,
6,
11,
21]. Second, high passenger flow volumes of SITs are concentrated at the center of Beijing City, especially around and within the Fourth Ring Road. Third, the highest volumes are focused around two areas, Zhongguancun and Guomao, the two largest central business districts in Beijing, with millions of jobs. To some extent, OD distribution of SITs proves the stability of SIUs in choosing subway stations.
In summary, the proposed SIT identification methods have practicability in distinguishing subway users, which is very important to the future of the transit industry. Regular SITs are a large part of ridership on many transportation systems around the world. By data mining with extensive data, SITs and inelastic demand can be easily recognized for further infrastructure planning and system optimization.
5. Conclusions
A data mining methodology is proposed for identification of regular SITs and understanding of regular SIU characteristics of the Beijing Subway. WSS, used in this paper, is a novel and simple data format to enhance the visibility of data mining results. Three specific principles to identify SITs are presented, of which Principle 1 aims to enhance the data mining efficiency, Principle 2 to check the spatial regularity of SITs, and Principle 3 to measure the temporal regularity of SITs. Finally, the framework of the data mining process is proposed and applied to distinguish SITs and non-SITs in the Beijing Subway system. RP survey and analysis are performed to demonstrate the effectiveness of the proposed method. Results confirm that the method proposed in this paper is feasible for SIT identification and is easy to use in practice.
By applying the proposed method, managers of transit agencies can understand the features of SITs and have insight into the elaborate travel demands of passengers only based on AFC data without high cost and the effort of collecting extra information and preprocessing different data. The characteristics of SITs are helpful in assessing the LOS of the subway system and improvements can be proposed in the periods with a high ratio of SITs. The method also can be used to predict the origins and destinations of travelers. However, the principles for identifying SITs in this paper only focus on the repeatability of stations and travel time, and the conditions of SITs might not be as constant as we discussed. SITs might have different manifestations and characteristics when the influencing factors change, such as job and housing locations, congestion, and fare policies, which are not detected in this paper. In addition, the dataset used in this paper does not include the users’ personal attributes, and special SITs are hard to detect, which might lead to deviation in identifying SITs. Further studies will focus on examining and tracing the characteristics of SIUs over a longer term and improving the accuracy of the discrimination methods.


