Article

Price Determinants and GIS Analysis of the Housing Market in Vietnam: The Cases of Ho Chi Minh City and Hanoi

1
National Housing Organization, Ho Chi Minh City 700000, Vietnam
2
Faculty of Civil Engineering, Ton Duc Thang University, Ho Chi Minh City 700000, Vietnam
3
NIBC Global Institute, Ho Chi Minh City 700000, Vietnam
4
Major in Real Estate Studies, Faulty of Regional Development, Kongju National University, Yesan 32439, Korea
*
Authors to whom correspondence should be addressed.
Sustainability 2018, 10(12), 4720; https://doi.org/10.3390/su10124720
Submission received: 27 September 2018 / Revised: 17 November 2018 / Accepted: 6 December 2018 / Published: 11 December 2018
(This article belongs to the Section Energy Sustainability)

Abstract

:
Since the introduction of the Doi Moi economic reform in 1986, the real estate market in Vietnam has witnessed a sharp increase in foreign investment inflows and a remarkable growth in the housing market, particularly for high-rise apartments in large cities. This study investigates the determinants of apartment prices in Ho Chi Minh City (HCMC) and Hanoi, the two most representative cities in Vietnam. The spatial distribution of apartments and their price determinants were addressed by the spatial analysis of Geographic Information System (GIS) and the hedonic model. The price determinants of both cities were closely associated with downtown-related factors; moreover, the externalities of urbanization affected each city. While HCMC was more related to the locational attributes of urban amenities and community density as well as programs because of unmanaged urbanization, Hanoi was more related to housing attributes, since the majority of apartment projects were developed under urban infrastructure development supported by the central government. Apartment cluster maps of each city clearly show the contrast of housing distribution. Our findings clarify the impact of government policies on housing price determinants and can be a reference for private- and public-sector stakeholders seeking to undertake economically and socially sustainable housing development projects in Vietnam.

1. Introduction

1.1. The Growth of the Housing Market in Vietnam

Since the introduction of the Doi Moi Policy in 1986, Vietnam has achieved rapid growth and officially joined the World Trade Organization as its 150th member in December 2006, 20 years after the introduction of the policy [1]. Since then, the real estate development business has rapidly progressed, and both the country’s economic conditions and the real estate market have stabilized. However, real estate development and investment by foreign corporations have been increasingly reconsidered since the advent of the global financial crisis in 2008. As the real estate business has undergone a recession, the Vietnamese government has revised the land law to revive the economy [2,3]. The essential revision regards the opening of real estate ownership to foreigners, who have invested in large-scale residential complexes and mixed-use commercial facilities [4]. The revision of the land law has allowed foreigners to have direct possession of houses, especially apartments, which will lead to significant investment flows into new housing development projects. In the Vietnamese housing market, apartments were initially developed for foreigners and the upper class, but their popularity is expected to grow among different social classes. After the country had opened up and achieved new economic growth, the perception of houses shifted from housing as a shelter to a means of generating income and, since the 2000s, an object of speculation and a status symbol [5]. Responding to these shifts in perception, the Vietnamese government policies began discarding infrastructure improvement and land provision in the old residential areas to focus on large-scale development projects and housing complexes and related infrastructures. The perception of houses is known to be related to one’s social standing beyond one’s profit generation capacity [6]. However, institutional changes must support housing projects that can succeed. Projects are selected by analyzing the real estate market, identifying the real needs of end users, and, thus, supplying houses that can meet their needs. Most developments supported by the government deal with all project phases, from the planning to the construction work and the actual moving in of buyers. The Vietnamese government does not aim to stimulate speculation and tries to respond to the actual needs of the housing market through careful planning.

1.2. Significance of Ho Chi Minh City (HCMC) and Hanoi in Vietnam

In Vietnam, Hanoi and HCMC are the largest cities with the highest populations. The former is the political capital, while the latter is considered to be the financial capital. Both cities are crucial role models to other cities in the country. As presented in Table 1, both Hanoi and HCMC respectively comprise 8% and 9% of the nation’s total population and are responsible for 12.9% (2017) and 22.4% (2018) of GDP. The foreign direct investment (FDI) of both cities covers 22.3% of the entire national amount; they are, thus, seemingly the pioneers of national growth.
Moreover, in administrative categories, all cities are classified into six levels, based on the status of economic development, urbanization, density, and physical development including infrastructure. Only Hanoi and HCMC are ranked among the top “special” cities in terms of remarkable political and economic commitment to national growth and development [7]. Most other cities typically pursue urban development and performances similar to those of Hanoi and HCMC to escalate the city class and secure more financial aid from the central government and FDI. In this regard, the two special cities are significant role models and references for other cities to set development goals.

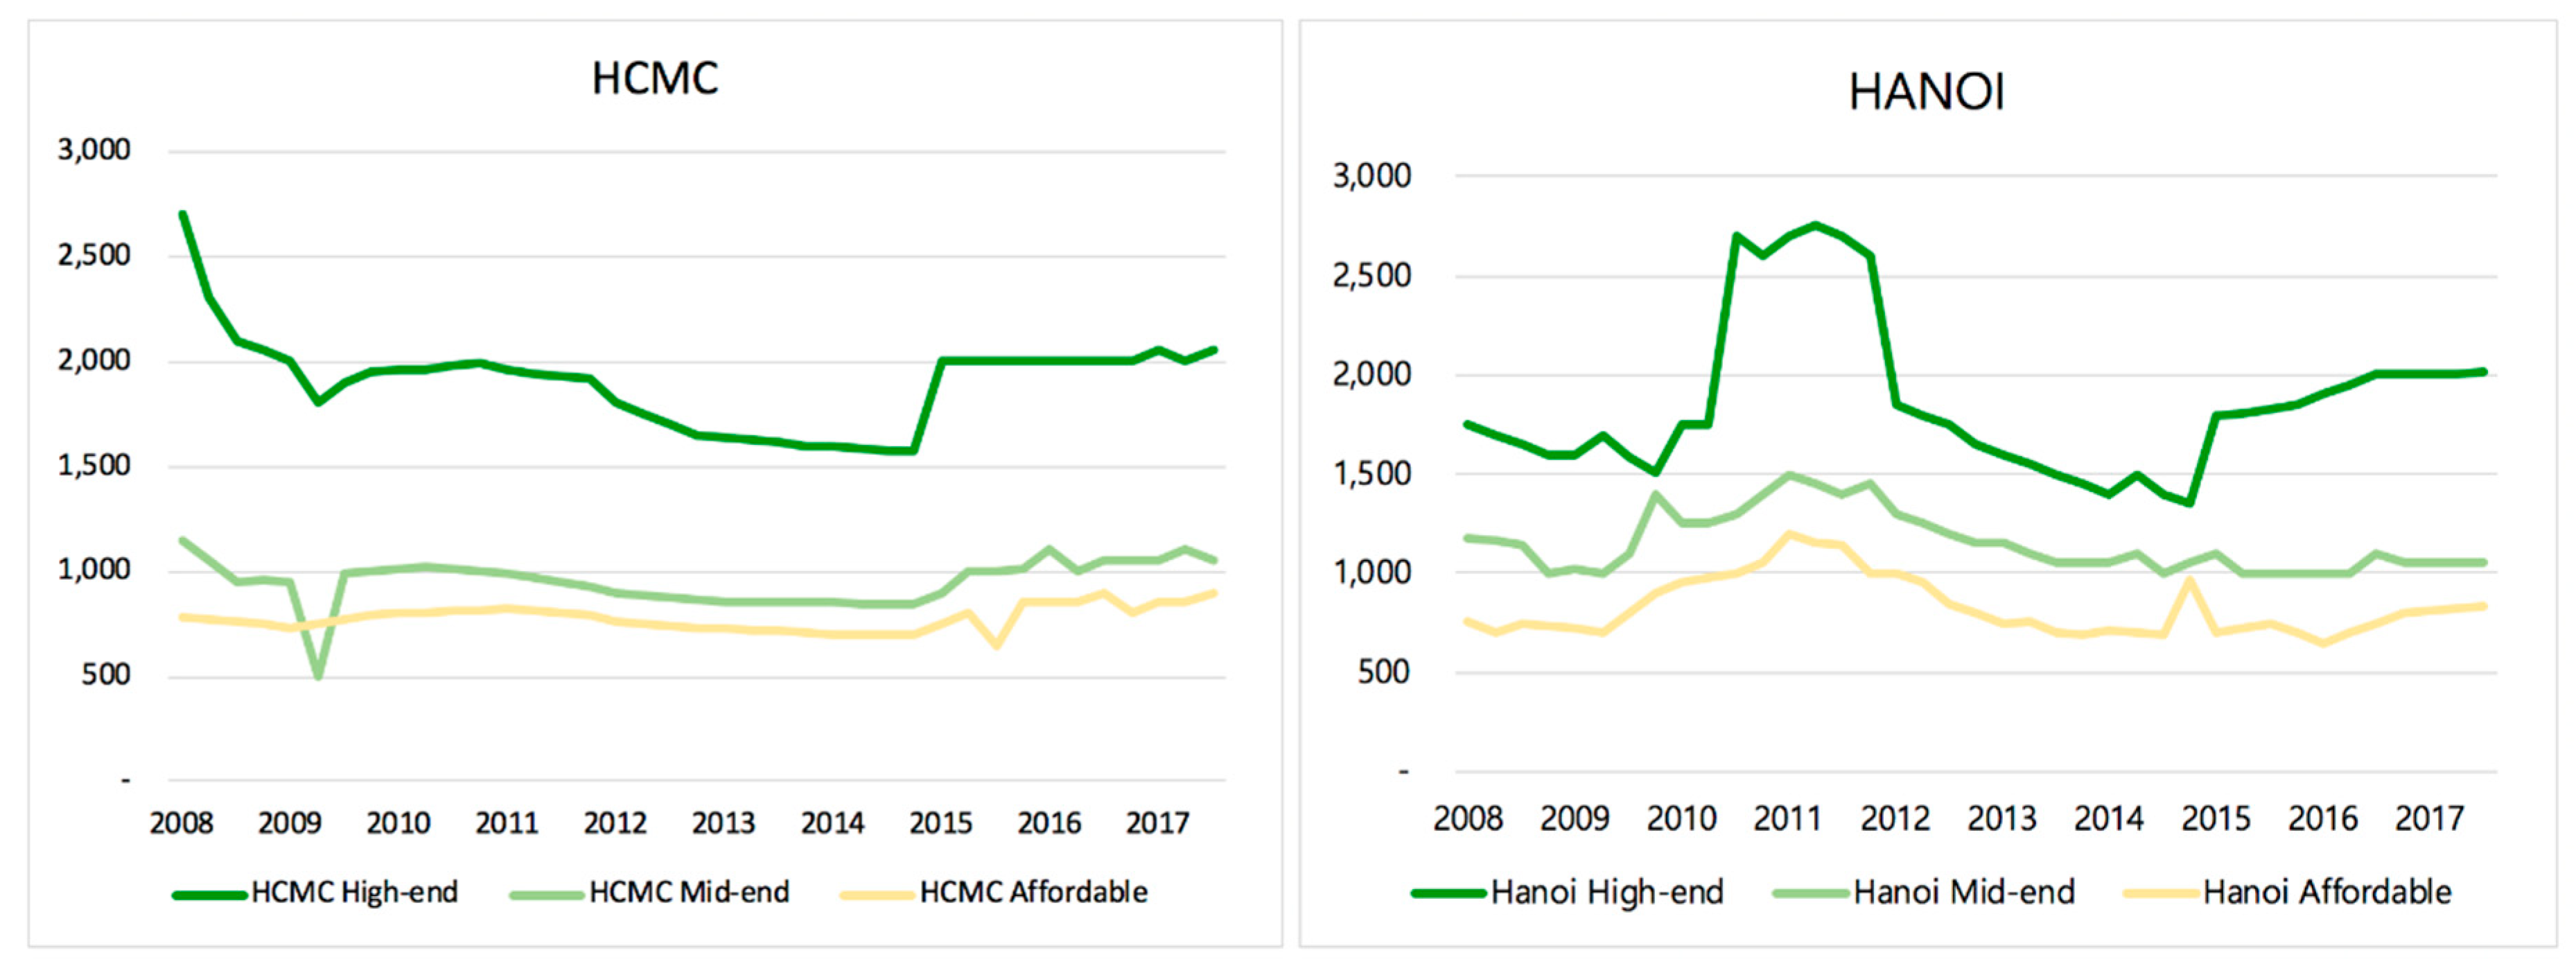
1.3. Differences between the Housing Market in HCMC and Hanoi

HCMC and Hanoi have different socioeconomic landscapes. While HCMC is the commercial and industrial hub of Vietnam, Hanoi serves as an administrative center. HCMC has a much larger economy and is more connected to Western countries than Hanoi, which, however, hires more people in the fields of technology and science and appeals more to offices, including the regional headquarters of multinational corporations [8]. While the real estate market is quick to accept institutional changes and capitalize on them in HCMC, the social norms and stiff bureaucratic organizations in Hanoi prevent its real estate market from rapidly accepting institutional changes, especially in their ambiguous aspects [9]. The bureaucrats of HCMC are the pioneers of reformation [10], whereas their Hanoi counterparts are not as cooperative with private enterprises [11]. These differences are reflected in the different perceptions of consumers in the two cities. A Nielsen research report found that the citizens of HCMC have a tendency toward individualism and are less concerned about how other people see them. On the contrary, the citizens of Hanoi practice collectivism and are more sensitive to the views of others [12]. With respect to the urban context, Hanoi reacts more evidently to rapid changes, probably because it has been a city of socialist governance and well-preserved historic fabric for many years compared with HCMC, whose social governance history spans only about a decade [13].
These contrasts are reflected in the housing market of the two cities and were particularly evident during the global financial crisis of 2008. Since most FDI was directed toward manufacturing and real estate developments, the capital of the real estate segment was concentrated in the southern region of HCMC and the northern region of Hanoi between 2006 and 2007. In this period, land prices skyrocketed by more than twofold and a housing market bubble emerged [14]. With the advent of the global financial crisis, the share of apartment development businesses led by foreign corporations dropped by 10 percentage points nationwide, from 25% to 15% in HCMC, whereas Hanoi experienced only a 2-percentage point reduction, from 10% to 8% [1].
The two cities have shown different trends in apartment prices since the global financial crisis [15]. While the prices in HCMC plummeted from 2008 and have continued to drop, the prices in Hanoi first dropped, then sharply increased, and then dropped again (Figure 1). Interestingly, significant differences have been found in the expenditure of the local government between the two cities. While local government expenditure in HCMC exceeded that in Hanoi in 2008, the situation reversed, and expenditure in Hanoi exceeded that in HCMC by 12%, 29%, and 27% in 2009, 2010, and 2011, respectively. The growth rate of local government expenditure in Hanoi doubled compared with that in HCMC in 2011 and 2012. During this period, apartment prices peaked in the housing market of Hanoi, whereas prices have constantly dropped in HCMC. As a result of the substantial investment and expenditure in support of the natural environment in Hanoi (Table 2), apartment supply in the city was 2.5 and 2.6 times higher than that in HCMC in 2011 and 2012, respectively. This development trend has significantly influenced the apartment market and its prices. In this context, there seems to be a need to review housing prices from the perspective of users and investigate which elements affect prices, which are influenced by the unique lifestyles, customs, institutions, and local realities of Vietnam [9,16].
In this study, we hypothesize that different patterns of housing development and different price determinants in the apartment market exist in HCMC and Hanoi. Thus, this study aims to, first, investigate the characteristics of the housing markets in HCMC and Hanoi by comparing their spatial distribution features. Second, the determinants of the apartment prices in the two cities are investigated and compared. Thus, this study can provide implications to assist in decision-making in both the public and the private sector regarding housing development in the rapidly changing real estate market in Vietnam.

2. Literature Review

To investigate the price determinants of apartments, this study adopted the hedonic price model. Although the model is limited as it cannot explicitly consider geographical location relations, such as spatial connections, it allows for easy interpretation and measurement. The hedonic price model is most extensively used in the division of submarkets.
Court (1939) conducted a pioneering study to understand values for a single source of pleasure and used the term “hedonic” to identify multiple attributes in heterogeneous commodities. He believed customers are attracted to multiple individual characteristics of commodities [17]. His study has a significant implication for housing price study by multivariate statistical methods. Furthermore, the theory of consumer demand strengthened the argument that customers’ decisions to purchase goods are made after considering their multiple attributes [18]. In addition, Rosen (1974) escalated the discussion of pricing models and hedonic theory. He demonstrated that varied, differentiated products are perceived with objectively measured characteristics; he observed that the price and value of products are defined using a set of implicit or hedonic prices. He argued this using a bid price, a model in which customers pursue the maximum willingness to pay to reach the highest satisfaction level for the implicit values of products [19]. His argument was widely accepted, and it significantly impacted the development of hedonic price regression analysis methods in housing studies and real estate market analysis. Thus, the hedonic price model in housing studies followed the primary hypothesis that housing price represents the composite attributes of the housing properties and reflects the maximum willingness to pay for multiple housing attributes. Recently, hedonic pricing methods have become more systematic with spatial information, such as geographically weighted regression [20] and geoadditive models [21].
Many empirical housing studies adopt hedonic pricing models. The price determinants can be grouped into three parts: housing, community, and locational attributes. Housing attributes include building quality, space arrangement, and physical characteristics such as land size, building scale, and housing year as well as attributes like having a garage/fireplace, and the number of bedrooms and bathrooms [22,23,24]. Community attributes refer to neighborhood quality in terms of socioeconomic and environmental traits such as educational opportunities [25,26], income level, ethnicity, community facilities [27], and neighborhood redevelopment plans [28]. Environmental externality effects are also included in this category, such as traffic noise [29,30,31,32,33], air quality [34,35,36,37], water quality [38,39], and greenspaces and parks [40,41,42,43,44]. Locational attributes indicate accessibility and proximity to major public facilities such as the central business district [45], commercial malls [46], road infrastructure [47], transportation stations [48], and schools [49].
However, only a few studies have focused on housing price determinants in Vietnam, while numerous studies have addressed the situation in other countries. Chung et al. (2014) examined 640 apartment units in HCMC using the hedonic price model and found similarities and differences in the price determinants of apartments in downtown districts, new town districts, and other districts. They found building density, neighborhood population density, unit size, land price, pool existence, and proximity to parks, international schools, and shopping malls [50] as the fundamental determinants of housing prices. Seo et al. (2018) investigated the price determinants of affordable apartments in HCMC, revealing that housing prices are significantly sensitive to proximity to downtown, access type to units, building height, foreign development, and proximity to main roads and shopping malls [46]. Huynh (2015) focused on the new town of HCMC (Phu My Hung) and found that the land size of the apartment complex, housing unit size, apartment grade, building age, building density, and proximity to dense areas significantly affect apartment prices [51]. Furthermore, few studies have addressed the housing market in Hanoi. Kato and Nguyen (2010) investigated housing in 10 districts of Hanoi and indicated adjacency to streets, capacity of the roads, and water supply [52] as the main apartment price determinants. Previous studies of the price determinants of apartments in Vietnam have observed that special price determinants reflect local climate conditions, ongoing rapid urbanization and its externalities, and dynamic housing development with foreign investment under the country’s transitional economic reform.

3. Research Methods

3.1. Data Collection and Geographic Information System (GIS) Setting

This study used data for 384 apartment projects in Vietnam that have been sold since 2000: 197 in HCMC and 187 in Hanoi. In this period, most commercial apartment projects have been developed with economic growth. The data set comprised the entire population of apartment projects of the two cities in the period. The housing prices were the average price of most housing units in the projects in the first quarter of HCMC and the third quarter of Hanoi in 2014. The information was collected from apartment surveys by sales and management offices conducted in HCMC from January to April 2014 and in Hanoi from August to October 2014. Additional data were obtained from related studies [50] and the National Housing Organization (Vietnam) as well as global real estate consultancies (CBRE Vietnam and Savills Vietnam), local realtors, and popular websites that deal with the real estate market such as batdongsan.com.vn and khudothimoi.com. Local surveyors in HCMC and Hanoi were involved in data collection with our research team and several translators helped us interview local experts of apartment projects.
The study analyzed the patterns of spatial distribution in the apartment complexes using ArcGIS 9.3 and the above-mentioned survey data. The analysis proceeded as follows: The investigator examined the apartment data of the two cities and converted them into spatial data, in the shape file (.shp) format, through a geocoding process that converts data into latitude and longitude coordinates on Google Maps. The average prices of apartment complexes were expressed in space by the inverse distance weighted method, which uses the interpolation of the ArcGIS Spatial Analysis Tool. Interpolation uses the already known functional values to determine or estimate the values of the remaining functions. This method can estimate the values of points not surveyed in the area where spatial data dots are distributed. The inverse distance weighted method directly calculates the influence of measuring points within a defined scope and, thus, obtains the data values of individual points. This study, however, was unable to statistically determine whether apartments were clustered or dispersed only with density analysis and, thus, also conducted a quantitative analysis of apartment clusters through nearest neighbor analysis to analyze the forms of spatial distribution. Nearest neighbor analysis measures differences in dot distribution patterns based on arbitrary such patterns.

3.2. Hedonic Price Model

The hedonic price model is most extensively used in the division of submarkets; its uses have been broad, and the coefficients calculated from the model can be interpreted as the shadow prices of the attributes of real estate. The hedonic price coefficients are entered in the follow-up model to identify the submarkets. Analyses based on the residuals of the hedonic model as well as its price coefficients are often conducted. The housing submarkets can be identified by using the correlations between the residuals as input variables in a cluster analysis based on the residuals of the hedonic model. When the hedonic price coefficients or residuals differ by submarket, the results of the identified submarkets are considered to be reliable.
The dependent variable in this study was the sales price per square meter, which is influenced by independent factors as shown by previous studies of HCMC apartments. The hedonic regression model, as described below, was used to determine the standardized values of apartments:
p = β 0 + k = 1 K β κ X κ + ε
where:
  • p denotes the sales price of an apartment unit;
  • ε is a vector of the random error terms;
  • β k (k = 1,…, K) is the coefficient matrix of independent variables X.
The dependent variable p captures the apartment price per unit as per the n × 1 vector of the surveys of housing prices; β is the regression coefficient matrix of observations of the independent variables as per the k × 1 vector of the coefficients, and ε is a vector of the random error terms. The relation between the dependent and independent variables is considered to be linear, as the interpretation of the estimation result is simpler and easier than any log function for comparing the determinants between HCMC and Hanoi. We also applied the semi-log function, which is a natural logarithm of the dependent variable; however, the adjusted R-squared value, which indicates the explanatory power of the regression model, was lower than that in the linear model. The dual log function was not considered because of the difficulty of dealing with dummy variables in our data set.
The independent variables used in this study were obtained from previous research on the Vietnamese housing market [46,50,51,52] that has also applied the hedonic regression model to examine the determinants of apartment prices. From this literature, we collected all the variables and then rearranged and regrouped them to avoid multicollinearity. The resulting groups were age of housing, average area, highest floor, total number of households, pool, mixed-use development, retail on ground level, location of new town or downtown, and proximity to park or river. Unlike the cases of HCMC, price determinant studies of Hanoi were limited. Therefore, we applied the variables used in HCMC studies to compare the two cities. Furthermore, they were also reviewed following the advice of local experts on housing market development in Vietnam. For instance, the variable, natural ventilation, is closely associated with public corridor arrangement in apartments and the tropical climate of Vietnam, which is an annual average temperature of 28 degrees Celsius with the highest peak of 39 degrees Celsius around noon in HCMC. The corridor used to access each housing unit has critical issues: air quality and heat. Thus, Vietnamese customers usually consider the availability of a natural air flow to the corridor to raise air quality and improve the cooling effect. Proximity to shopping malls is also associated with the tropical climate in these cities since they are considered to be a cultural community center in which to enjoy air conditioning. In addition, the variable, adjacency to main roads, is also critical. Unlike the downtown districts of HCMC, which are well planned with major road connections, most other districts have developed organically with widespread self-built housing constructions causing extreme urban densification with a too narrow road infrastructure. Numerous inner areas of these self-built residential districts, whose average road width is less than 1.5 m, are inaccessible to either cars or public transport. Thus, adjacency to a main road is critical for vehicle accessibility.
Following the advice of local experts on the housing market, the international education sector is booming in Vietnam and, thus, proximity of an international school is often demanded by homebuyers. Thus, this variable was also added to this study. HCMC and Hanoi have high population densities and inferior residential environments; however, each district in the cities shows a different population density and a different quality of neighborhood environment. As the literature indicates that higher population density negatively impacts on housing prices, the population density of the district was added in this study. The variable, foreign development, is associated with the newly emerging apartment market based on the flow of FDI into Vietnam. The apartments developed by Singaporean, Taiwanese, or Korean developers are normally considered to be high-quality housing and community environments.
The independent variables were divided into three categories: housing structure, community features, and local public facilities (Table 3).

4. Analysis Results

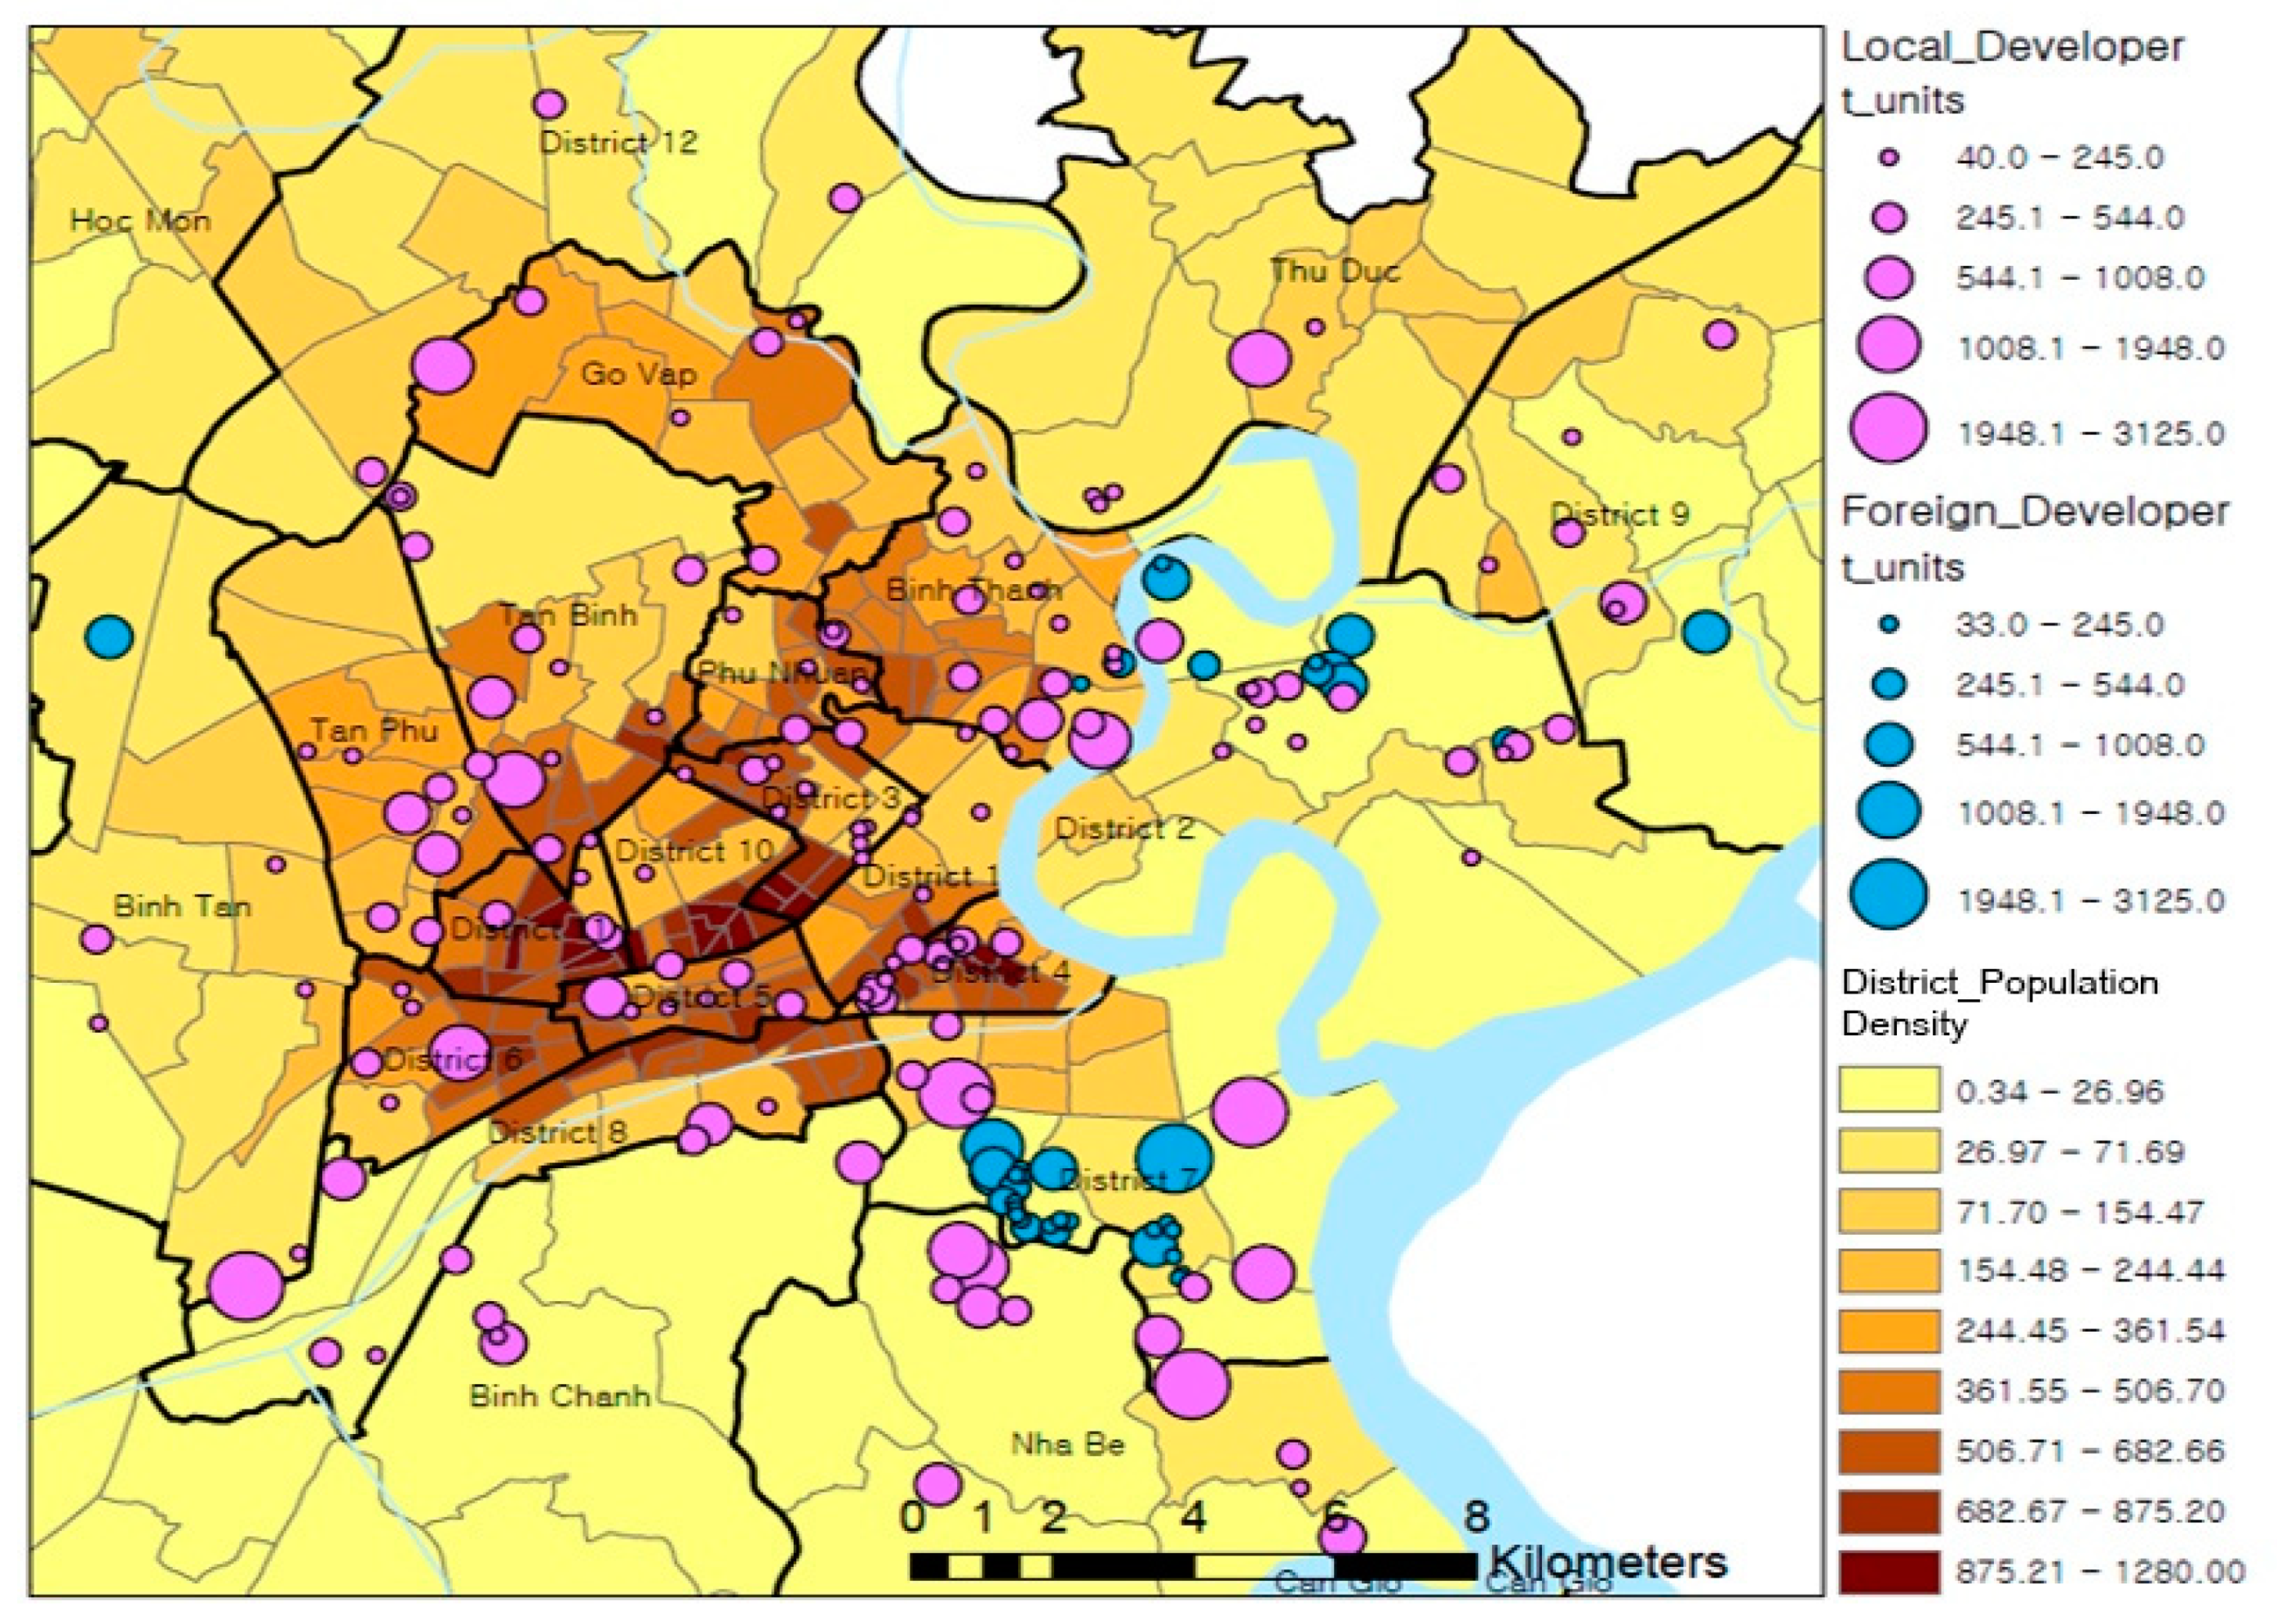
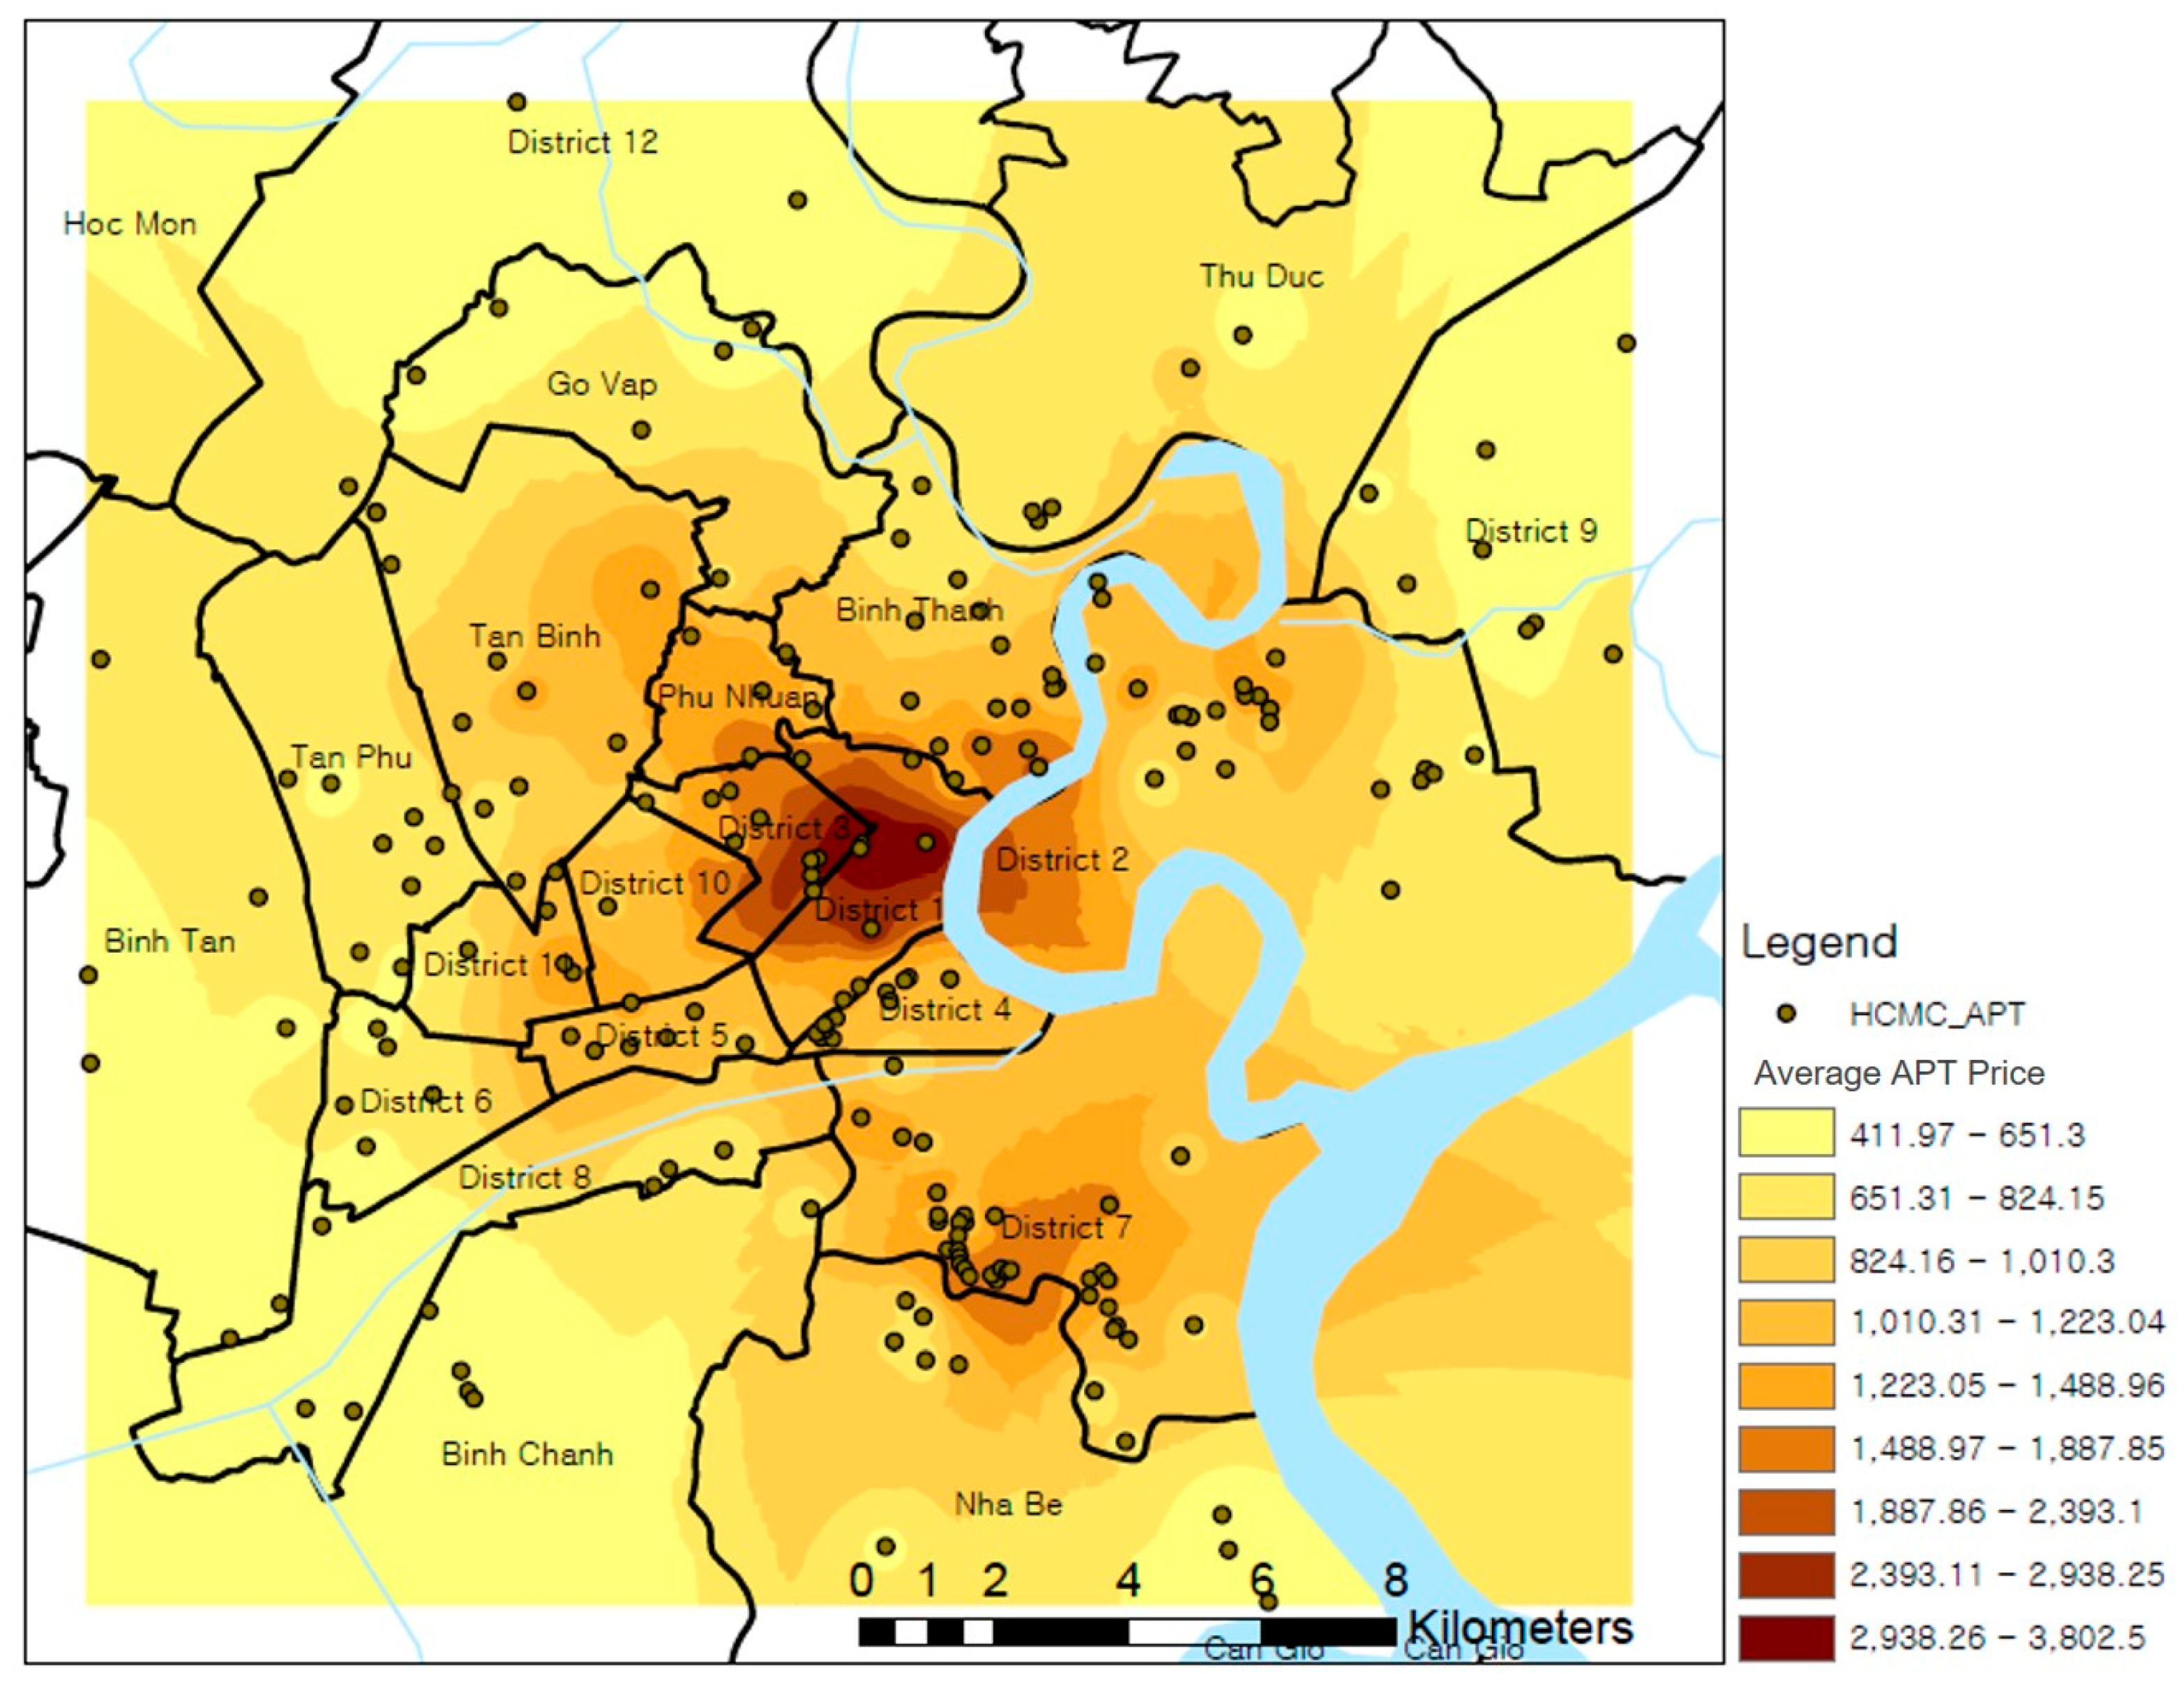
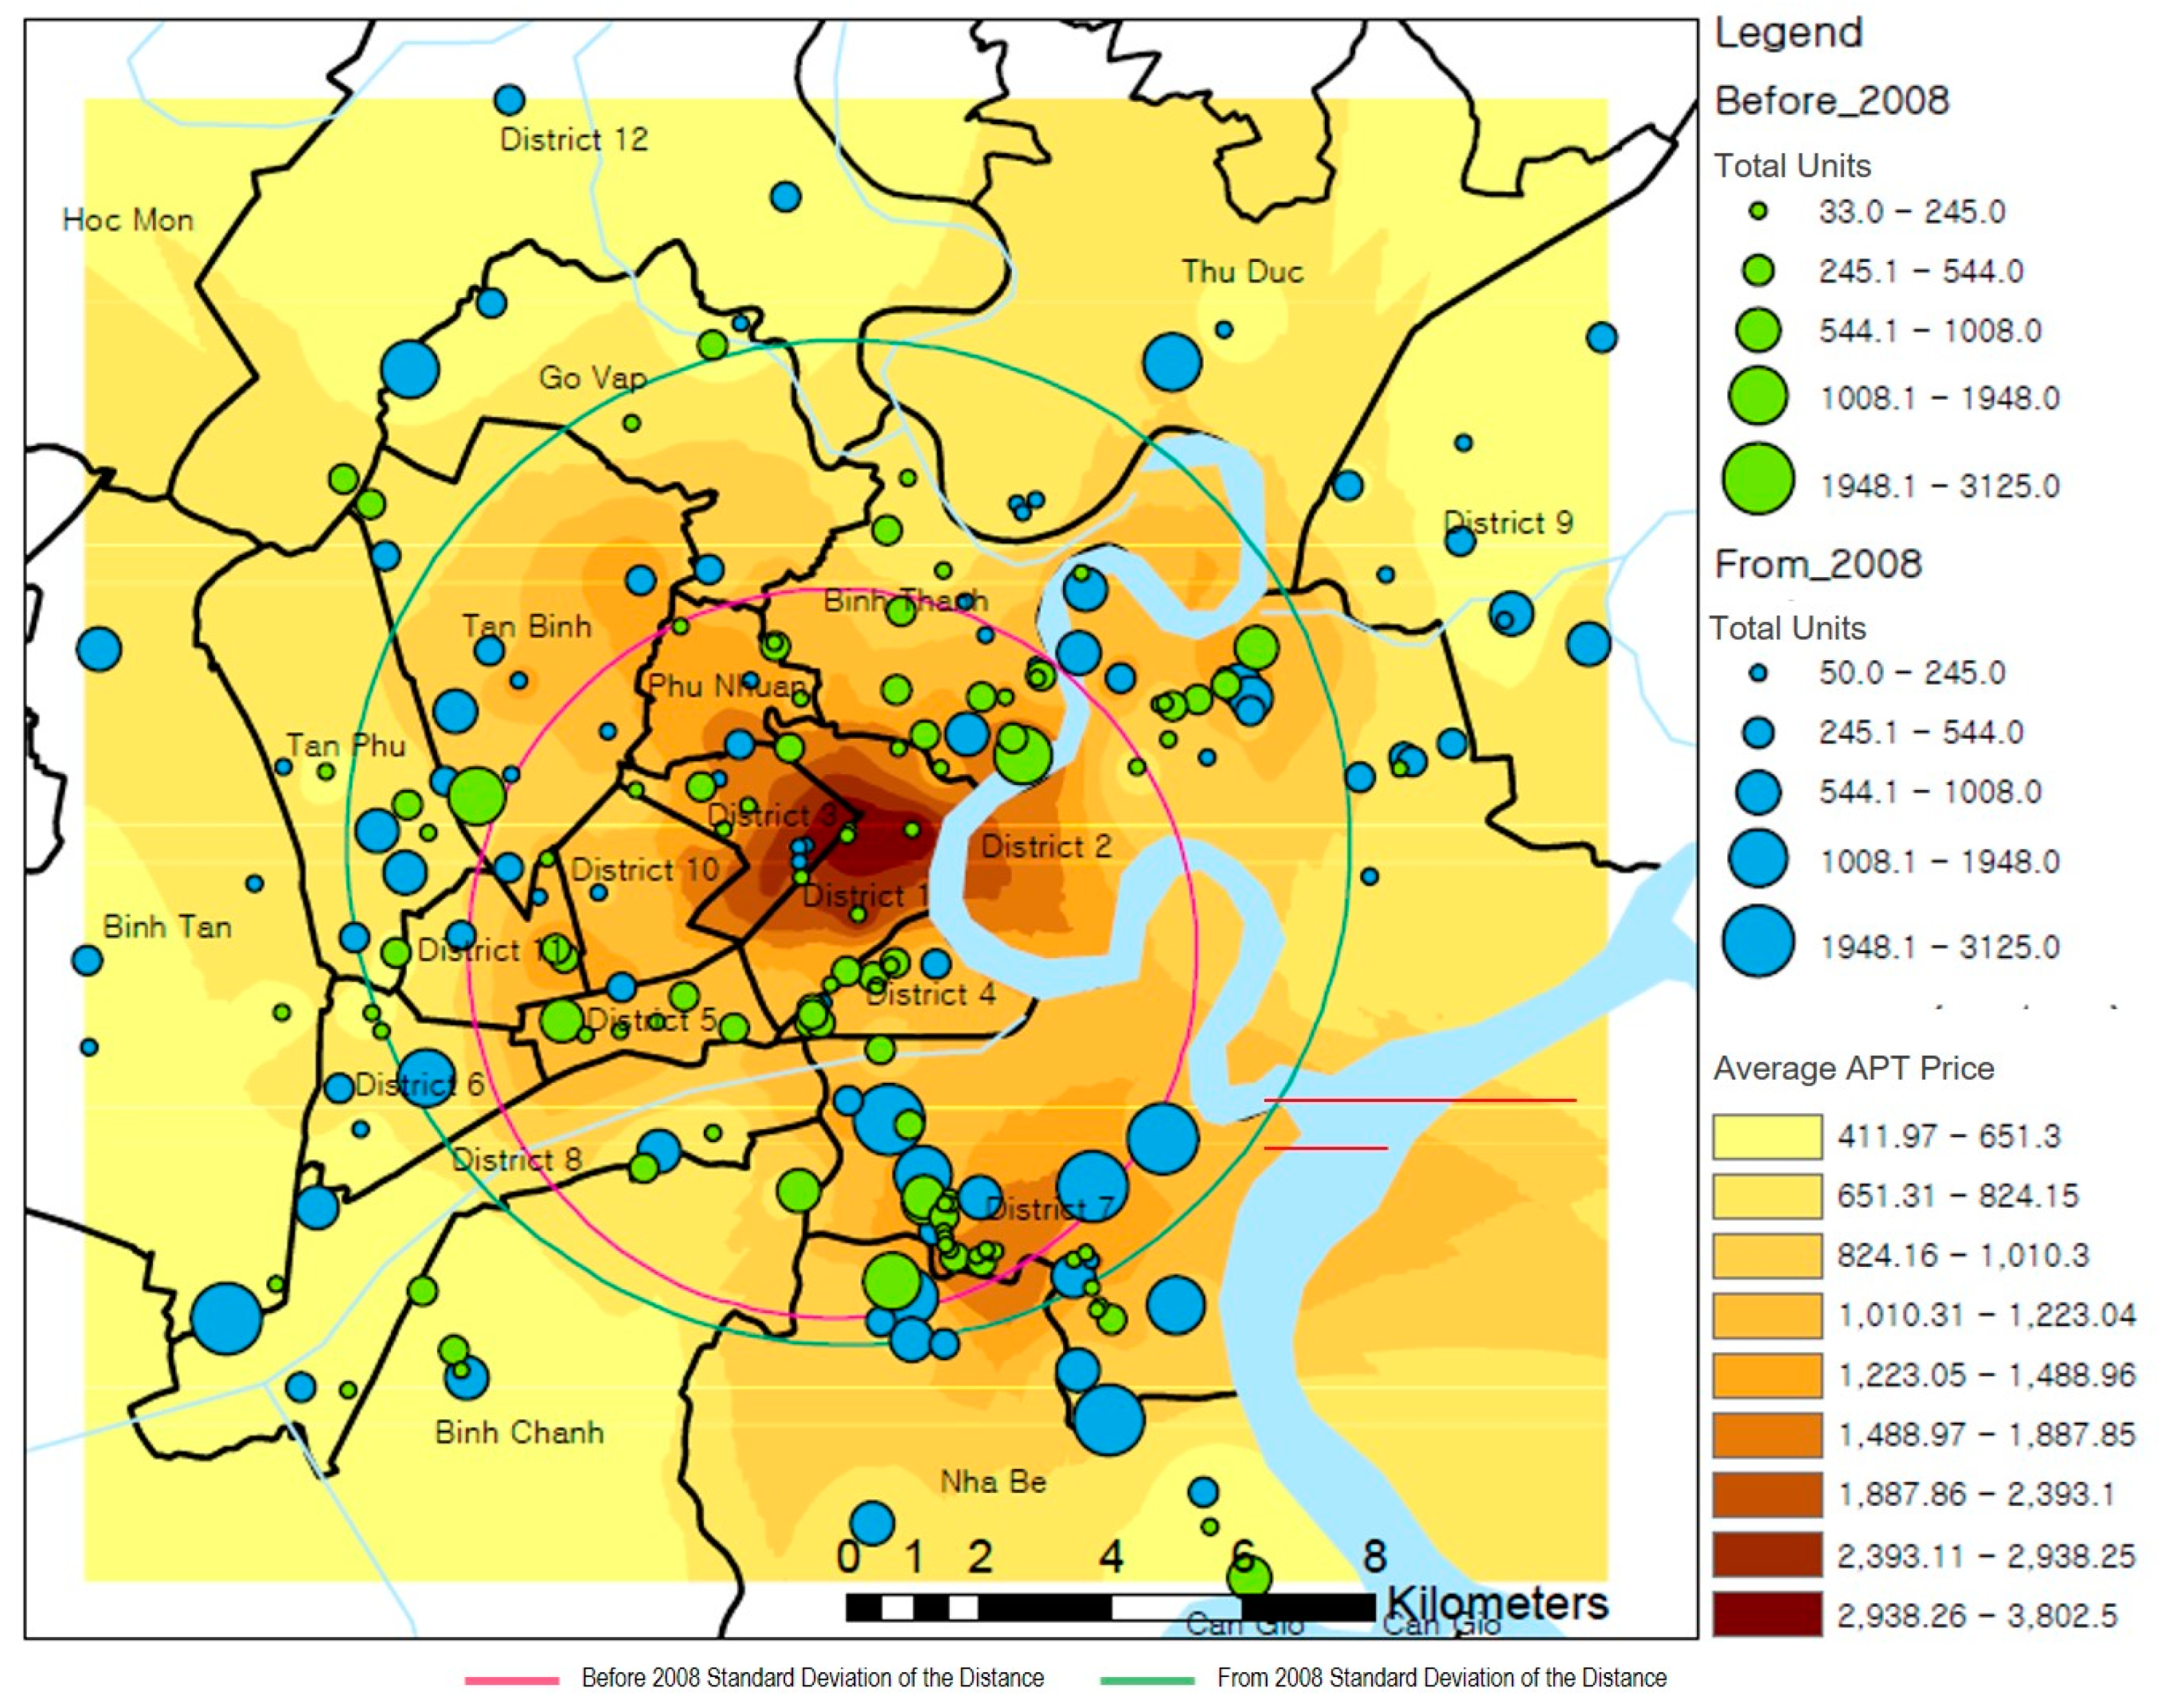
4.1. GIS Analysis of Apartments Distribution in HCMC and Hanoi

In HCMC, the central points are located along the city boundaries (between Districts 1 and 4) in the south-southeast direction when the weight of the complex size is considered (Figure 2). The standard deviation of the distance is 6.33 km. This study also examined the presence of clustering in the apartment complex distribution through nearest neighbor analysis and found statistically significant results in a 99% confidence interval. When the result of the nearest neighbor analysis is smaller than one, the degree of clustering is high. In HCMC, the value was 0.79, which indicates clustering in the apartment distribution (Z-Score = −5.62). Furthermore, Figure 2 shows that local developers constructed apartments around downtown (Districts 1 and 3) and in higher population density districts, whereas foreign developers built them on the peripheral areas with lower population density. The apartment projects distanced from downtown show larger scale with more housing units in HCMC.
In the case of Hanoi, central points can be found in the southwest direction from downtown (between Hoan Kiem and Hai Ba Trung), as shown in the distribution of apartment complexes (Figure 3). The standard deviation of the distance is 5.44 km. Overall, the apartment developments in Hanoi are inclined toward the southwest from downtown, which indicates that urban development is happening in the southwest, where there is no river, rather than in the northeast, which is close by a river that runs through the city in the northeast direction. With respect to clustering in the apartment distribution, the nearest neighbor analysis results show a value equal to 0.59, which indicates significant clustering in the apartment distribution (Z-Score = −10.6). Furthermore, Figure 3 shows that most apartment developments took place in the south-western location since infrastructure development has been focused in these areas due to the limitation of the urban river on the east side. Unlike HCMC, Hanoi does not show certain cluster patterns in specific areas. Small-scale apartment projects were located in high-density areas, and large-scale projects were developed in medium-density areas of Hanoi.

4.2. Descriptive Statistics of Apartment Projects in HCMC and Hanoi

Table 4 reports the descriptive statistics of apartment projects in HCMC and Hanoi. A total of 19 variables were used to compare and analyze the two cities, except for one variable, new town location, which exists only in HCMC.
The results indicate that the housing markets in HCMC and Hanoi are characterized by different patterns. The average price of apartments in HCMC is 1,074 dollars per square meter and 1,234 dollars in Hanoi. The price range in HCMC is more heterogeneous. The average number of floors is 31% higher in Hanoi than in HCMC. The ratio of developments carried out by foreign developers is 122% higher in HCMC than in Hanoi. The average land price for housing is 141% higher in Hanoi. The ratio of retail development on the ground level is 225% higher in Hanoi than in HCMC. More apartments of HCMC are located downtown, and the districts have higher population density than those in Hanoi. More apartments in Hanoi are not only closer to public facilities, such as parks, international schools, and shopping malls but also their development shows more heterogeneous patterns than those in HCMC.

4.3. Regression Results with GIS Analysis

The hedonic price model generated the regression results reported in Table 5. The results identify the significant determinants of apartment prices in HCMC and Hanoi.
In the ordinary least squares model of the HCMC case, the adjusted R-squared value was 0.742, which suggests a high explanatory power of the regression model. The factors found to exert a positive and significant influence on apartment prices were the existence of a swimming pool and mixed-use development in the group of community attributes. The population density of the district negatively affected apartment prices. Locational attributes such as downtown and proximity to a park and international schools were also found to have a positive influence on apartment prices, whereas distance to downtown was found to have a negative impact. Figure 4 shows the results of the GIS analysis, which operated a mapping of apartment prices based on the interpolation method. The map shows the higher apartment prices around Districts 1 and 3, new town, and Phu My Hung compared with other areas.
In the case of Hanoi, the regression model showed a value of 0.780 for the adjusted R-squared value, and the age of housing complexes was found to have a positive and significant impact on apartment prices. Among community attributes, development by a foreign developer was found to exert a positive influence on apartment prices. With respect to locational attributes, a downtown location positively affects apartment prices and proximity to downtown was found to have a negative impact. The GIS spatial analysis reported in Figure 5 shows higher prices downtown and for apartments built by foreign developers in Hanoi. Many foreign properties were built far away from downtown and are not clustered but randomly scattered. They were largely developed in the form of high-rise towers with mixed-use arrangements, for both commercial and residential purposes.
Table 6 presents the comparison results of the apartment price determinants between HCMC and Hanoi. The common price determinants are the downtown location, official land price, existence of a pool, and distance to downtown.

5. Discussion

The locational attribute of downtown proximity has a significant influence in both cities and is likely to depend on extreme traffic congestion and poor commuting conditions. Since most workplaces are concentrated in central business districts, with insufficient road capacity and a lack of public transportation, both cities struggle with traffic during peak hours [53]. Thus, most commuters use motorbikes and battle every day against traffic congestions and air pollution (Figure 6) [54,55]. Moreover, the situation worsens during the rainy season, since 70% of the HCMC area is vulnerable to urban flooding [56]. In this context, proximity to the center is a crucial factor in the housing choice [46,57].
In addition, the downtown location generated more preferred values for residents in both cities of Vietnam. Having a residence in downtown provides huge living benefits. Downtown, the location of Districts 1 and 3 in HCMC and Hoan Kiem and Hai BaTrung districts in Hanoi, provides a remarkable walkable environment with colonial-era buildings and streets, more business opportunities, a vibrant community, varied cultural events and performances, and the opportunity to enter the best public schools because of the residence-based registration system. For these advantages, Vietnamese perceive securing a better quality of life if they have housing downtown. Thus, this affects the apartment price. Moreover, the average unit area influences the price in both cities.
However, unique price determinants are observed in each city. The population density of the districts and specific location are significant determinants of apartment prices only in HCMC. While the population density of Hanoi is 140 persons per hectare, on average, in HCMC, it is 209 persons per hectare. The rate of urbanization is high in HCMC, and semi-permanent and temporary housing have been developed in many districts; the high density of the population is, thus, related to the quality of the residential environment and community [59,60]. This factor has a significant impact on apartment prices in HCMC. Proximity to an international school and a park also exerts a significant influence on prices only in HCMC. Figure 2 and Figure 3 clearly show a higher density of apartments in Hanoi and a lower density with scattered locations in HCMC. In addition, more than 40% of apartment complexes are close to international schools and parks in Hanoi, whereas this share declines to less than 20% in HCMC (Table 4). Thus, this factor has a significant impact on apartment prices only in HCMC. The existence of a pool is also a significant price determinant in the tropical climate of HCMC and is considered to be one of most preferred public facilities in apartments [46,50]; however, Hanoi, located in the northern region, experiences lower temperatures and, therefore, swimming pools are not a sensitive price factor.
In Hanoi, apartment projects carried out by foreign developers have a positive relationship with apartment prices. Local developers often lack the professional skills and management capacity for design and construction, and the resulting housing conditions are often below standard [61]. Many apartment buildings do not offer adequate open spaces and communal facilities. However, while international developers are known to provide better-quality apartments and superior living conditions [46,50], foreign development has a significant impact on apartment prices in Hanoi. This factor does not influence prices in HCMC, where professional local housing developers, such as the Vin Group and Novaland, supply dozens of high-quality apartments and provide outstanding living conditions. Therefore, foreign development only affects the sales price of apartments in Hanoi.
The impact of other significant apartment price determinants such as the mixed-use development and age of the housing unit can be explained by the economic situation and local reactions to it. The global financial crisis led to different development patterns in HCMC and Hanoi. Figure 7 and Figure 8 show the results of the GIS spatial analysis around the global financial crisis (2008). In HCMC, the financial crisis has changed the clustered distribution of apartment developments to a random distribution (Figure 7), whereas, Hanoi developed a high-density clustering pattern of apartment developments, including a mixed-use function, based on urban road constructions supported by the public authority after the global financial crisis. During this period, 72.2% of total apartment stocks were concentrated in the outskirts of Hanoi, where the land price is low (Figure 8). However, office and retail leasing businesses were not successful, resulting in numerous vacant spaces in Hanoi. The determinant of the mixed-use development, integrating housing, offices, and shopping malls is related to the successful management of the leasing business. The vertically mixed arrangement of floors in housing complexes is considered to be a popular trend in compact cities, as it minimizes the travel of residents and the need for infrastructure. This is viewed as a successful real estate development and exerts a positive influence on the price of properties in HCMC, whereas it does not affect prices in Hanoi because of oversupply on the outskirts and high rate of vacancy due to unsuccessful leasing.
The age of the housing unit is found to have a positive influence on apartment prices in Hanoi but an adverse impact in HCMC, where, as one would expect, the older the house, the lower the price. As the average age of housing complexes in Hanoi is low, about 3.4 years, this factor does not seem to be significantly related to degradation in housing quality, while the locational inferiority of suburban developments and lower land price are inherently related to apartment prices. Figure 8 shows the apartment locations and prices on the outskirts of the cities.

6. Conclusions

Since the introduction of the Doi Moi economic reform, the Vietnamese housing market has been characterized by a large amount of FDI inflows, which has significantly increased housing supply. The real estate market has begun showing different patterns between northern and southern regions, particularly Hanoi and HCMC. As these cities are administratively assigned as top-ranked “special cities” because of their remarkable political and economic commitment to national growth and development, they are considered to be significant role models and references for setting the development goals of other cities.
This study investigated the commonalities and differences in apartment price determinants in these special cities. The price determinants of both cities were closely associated with many advantages of the downtown location and its proximity. Serious traffic congestion, a negative externality of urbanization, is a critical issue for customers and this affects prices. As HCMC has been developed based on unmanaged urbanization and insufficient road capacity, more locational attributes such as parks and education facilities are more significant for better accessibility and proximity. Urbanization also affects the community environment, such as mixed-use development and neighborhood population density, both of which were identified as price determinants in HCMC. However, Hanoi was more related to housing attributes rather than community and locational attributes, since the majority of apartment projects were developed with high-density clustering with urban infrastructure development supported by the central government, and, therefore, secured better accessibility and proximity to urban amenities; housing quality was a more critical issue in Hanoi.
These findings show that housing price determinants can be related to urbanization and its management of the government and of negative externalities in developing countries. This can also be a significant reference for potential investors and developers seeking appropriate locations for their housing development projects in Vietnam. They should consider different market conditions and apartment price determinants because of the urbanization situation across Vietnam. Suitable development strategies and successful approaches can only be developed by taking into account the unique local urban contexts. Our results highlight the impact of housing policies on apartment prices, especially policies targeting land-use planning and infrastructure development. In the case of HCMC, the government should recognize how the externalities of urbanization can affect housing prices and ensure suitable residential land allocation to secure road capacity and connectivity. It also needs to enhance accessibility to public amenities. In Hanoi, customers prefer foreign developers, which provide a more professional construction, and, therefore, local government should monitor quality management during building procedures. Thus, both the private and the public sectors must understand the housing market dynamics associated with customers’ preferential interests and urbanization issues in Vietnam.
This study has some limitations. It considered many apartment-level and location-level variables but did not discuss housing attributes, such as the numbers of bedrooms and bathrooms, because of data limitations. Although building age was considered, changes in the market situation and spatial self-correlation were not. Follow-up studies must add these variables to improve the accuracy of the analysis.

Author Contributions

The following statements should be used “Conceptualization, C.Y.S., D.S. and J.K.; Methodology, C.Y.S.; Software, C.Y.S.; Validation, C.Y.S., D.S. and J.K.; Formal analysis, C.Y.S., D.S. and J.K.; Investigation, C.Y.S., D.S. and J.K.; Resources, C.Y.S.; Data curation, C.Y.S.; Writing-original draft preparation, C.Y.S. and D.S.; Writing-review and editing, C.Y.S., D.S. and J.K.; Visualization, C.Y.S. and D.S.; Supervision, C.Y.S., D.S. and J.K.; Project administration, D.S. and J.K.”

Funding

This research received no external funding

Conflicts of Interest

The authors declare that there are no conflicts of interest.

References

  1. Anwar, S.; Nguyen, L.P. Foreign direct investment and economic growth in Vietnam. Asia Pac. Bus. Rev. 2010, 16, 183–202. [Google Scholar] [CrossRef] [Green Version]
  2. Nguyen, V.Q. Vietnam’s New Land Law: The Impact on Foreign Developers; Tilleke&Gibbins: Bangkok, Thailand, 2014. [Google Scholar]
  3. Pham, T. The Revised Land Law Will Ensure More Transparent and Equitable Treatment for All Land Users; CBRE: Los Angeles, CA, USA, 2014. [Google Scholar]
  4. Nguyen, T.B.; van der Krabben, E.; Samsura, D.A.A. Commercial real estate investment in Ho Chi Minh City–a level playing field for foreign and domestic investors? Habitat Int. 2014, 44, 412–421. [Google Scholar] [CrossRef]
  5. Phe, H.H. Investment in residential property: Taxonomy of home improvers in central Hanoi. Habitat Int. 2002, 26, 471–486. [Google Scholar] [CrossRef]
  6. Huu Phe, H.; Wakely, P. Status, quality and the other trade-off: Towards a new theory of urban residential location. Urban Stud. 2000, 37, 7–35. [Google Scholar] [CrossRef]
  7. Cira, D. Vietnam Urbanization Review Technical Assistance Report; World Bank: Hanoi, Vietnam, 2011; p. 177. [Google Scholar]
  8. Surborg, B. Advanced services, the new economy and the built environment in Hanoi. Cities 2006, 23, 239–249. [Google Scholar] [CrossRef]
  9. Kim, A.M. North versus south: The impact of social norms in the market pricing of private property rights in Vietnam. World Dev. 2007, 35, 2079–2095. [Google Scholar] [CrossRef]
  10. Turley, W.S.; Womack, B. Asian socialism’s open doors: Guangzhou and Ho Chi Minh City. China J. 1998, 40, 95–119. [Google Scholar] [CrossRef]
  11. Cung, D.N.; Tuan, P.A.; Van, B.; Dapice, D. History or Policy: Why Don’t Northern Provinces Grow Faster; Harvard University: Cambridge, MA, USA, 2004. [Google Scholar]
  12. Cross, A.; Ryan, V.; Hoa, M.T.T. HCMC Hanoi Regional Consumer Differences; Nielsen: New York, NY, USA, 2009. [Google Scholar]
  13. Quang, N.; Kammeier, H.D. Changes in the political economy of Vietnam and their impacts on the built environment of Hanoi. Cities 2002, 19, 373–388. [Google Scholar] [CrossRef]
  14. Nguyen, T.N. Foreign direct investment in real estate projects and macroeconomic instability. ASEAN Econ. Bull. 2011, 28, 74–96. [Google Scholar] [CrossRef]
  15. CBRE. Vietnam Market Outlook. 2014. Available online: www.cbrevietnam.com (accessed on 7 July 2018).
  16. Kim, A.M. A market without the ‘right’ property rights. Econ. Transit. 2004, 12, 275–305. [Google Scholar] [CrossRef]
  17. Court, A.T. Hedonic price indexes with automotive examples. Dyn. Automob. Demand 1939. [Google Scholar]
  18. Lancaster, K.J. A new approach to consumer theory. J. Polit. Econ. 1966, 74, 132–157. [Google Scholar] [CrossRef]
  19. Rosen, S. Hedonic prices and implicit markets: Product differentiation in pure competition. J. Polit. Econ. 1974, 82, 34–55. [Google Scholar] [CrossRef]
  20. Massimo, D.E.; Del Giudice, V.; De Paola, P.; Forte, F.; Musolino, M.; Malerba, A. Geographically Weighted Regression for the Post Carbon City and Real Estate Market Analysis: A Case Study; International Symposium on New Metropolitan Perspectives; Springer: Berlin, Germany, 2018; pp. 142–149. [Google Scholar]
  21. Del Giudice, V.; De Paola, P. Spatial analysis of residential real estate rental market with geoadditive models. In Advances in Automated Valuation Modeling; Springer: Berlin, Germany, 2017; pp. 155–162. [Google Scholar]
  22. Kain, J.F.; Quigley, J.M. Measuring the value of housing quality. J. Am. Stat. Assoc. 1970, 65, 532–548. [Google Scholar] [CrossRef]
  23. Sirmans, G.S.; MacDonald, L.; Macpherson, D.A.; Zietz, E.N. The value of housing characteristics: A meta analysis. J. Real Estate Financ. Econ. 2006, 33, 215–240. [Google Scholar] [CrossRef]
  24. Kohlhase, J.E. The impact of toxic waste sites on housing values. J. Urban Econ. 1991, 30, 1–26. [Google Scholar] [CrossRef]
  25. Kilpatrick, J.A.; Hefner, F. House Price Impact of School District Choice; South Carolina Center for Applied Real Estate Education and Research: South Carolina, USA, 1998. [Google Scholar]
  26. Gibbons, S.; Machin, S. Valuing English primary schools. J. Urban Econ. 2003, 53, 197–219. [Google Scholar] [CrossRef] [Green Version]
  27. Visser, P.; Van Dam, F.; Hooimeijer, P. Residential environment and spatial variation in house prices in the Netherlands. Tijdschr. Econ. Soc. Geogr. 2008, 99, 348–360. [Google Scholar] [CrossRef]
  28. Baumont, C.; Legros, D. Neighborhood Effects in Spatial Housing Value Models. The Case of the Metropolitan Area of Paris (1999); Federal Reserve Bank of St Louis: St Louis, MO, USA, 2009. [Google Scholar]
  29. Bateman, I.; Day, B.; Lake, I.; Lovett, A. The Effect of Road Traffic on Residential Property Values: A Literature Review and Hedonic Pricing Study; Scottish Executive: Edinburgh, UK, 2001; Volume 207. [Google Scholar]
  30. Day, B.; Bateman, I.; Lake, I. Beyond implicit prices: Recovering theoretically consistent and transferable values for noise avoidance from a hedonic property price model. Environ. Resour. Econ. 2007, 37, 211–232. [Google Scholar] [CrossRef]
  31. Nelson, J.P. Highway noise and property values: A survey of recent evidence. J. Transp. Econ. Policy 1982, 16, 117–138. [Google Scholar]
  32. Schipper, Y.; Nijkamp, P.; Rietveld, P. Why do aircraft noise value estimates differ? A meta-analysis. J. Air Transp. Manag. 1998, 4, 117–124. [Google Scholar] [CrossRef]
  33. Del Giudice, V.; De Paola, P.; Manganelli, B.; Forte, F. The monetary valuation of environmental externalities through the analysis of real estate prices. Sustainability 2017, 9, 229. [Google Scholar] [CrossRef]
  34. Anderson, R.J., Jr.; Crocker, T.D. Air pollution and residential property values. Urban Stud. 1971, 8, 171–180. [Google Scholar] [CrossRef]
  35. Murdoch, J.C.; Thayer, M.A. Hedonic price estimation of variable urban air quality. J. Environ. Econ. Manag. 1988, 15, 143–146. [Google Scholar] [CrossRef]
  36. Graves, P.; Murdoch, J.C.; Thayer, M.A.; Waldman, D. The robustness of hedonic price estimation: Urban air quality. Land Econ. 1988, 64, 220–233. [Google Scholar] [CrossRef]
  37. Smith, V.K.; Huang, J.C. Can markets value air quality? A meta-analysis of hedonic property value models. J. Polit. Econ. 1995, 103, 209–227. [Google Scholar] [CrossRef]
  38. Michael, H.J.; Boyle, K.J.; Bouchard, R. Water Quality Affects Property Prices: A Case Study of Selected Maine Lakes; Maine Agricultural and Forest Experiment Station Report Number 398; University of Maine: Orono, ME, USA, 1996. [Google Scholar]
  39. Steinnes, D.N. Measuring the economic value of water quality. Ann. Reg. Sci. 1992, 26, 171–176. [Google Scholar] [CrossRef]
  40. Wilman, E.A.; Krutilla, J. Hedonic prices and beach recreational values. Adv. Appl. Microeconomics 1981, 1, 98. [Google Scholar]
  41. Anderson, S.T.; West, S.E. Open space, residential property values, and spatial context. Reg. Sci. Urban Econ. 2006, 36, 773–789. [Google Scholar] [CrossRef] [Green Version]
  42. Lutzenhiser, M.; Netusil, N.R. The effect of open spaces on a home’s sale price. Contemp. Econ. Policy 2001, 19, 291–298. [Google Scholar] [CrossRef]
  43. Nowak, D.J.; McPherson, E.G. Quantifying the impact of trees: The Chicago urban forest climate project. Unasylva 1993, 173, 39–44. [Google Scholar]
  44. Tyrväinen, L. The amenity value of the urban forest: An application of the hedonic pricing method. Landsc. Urban Plan. 1997, 37, 211–222. [Google Scholar] [CrossRef]
  45. Heikkila, E.; Gordon, P.; Kim, J.I.; Peiser, R.B.; Richardson, H.W.; Dale-Johnson, D. What happened to the cbd-distance gradient?: Land values in a policentric city. Environ. Plan. A 1989, 21, 221–232. [Google Scholar] [CrossRef]
  46. Seo, D.; Chung, Y.S.; Kwon, Y. Price determinants of affordable apartments in Vietnam: Toward the public–private partnerships for sustainable housing development. Sustainability 2018, 10, 197. [Google Scholar] [CrossRef]
  47. Landau, U.; Prashker, J.N.; Hirsh, M. The effect of temporal constraints on household travel behavior. Environ. Plan. A 1981, 13, 435–448. [Google Scholar] [CrossRef]
  48. Henneberry, J. Transport investment and house prices. J. Prop. Valuation Investment 1998, 16, 144–158. [Google Scholar] [CrossRef]
  49. Hanushek, E.A.; Yilmaz, K. Household Location and Schools in Metropolitan Areas with Heterogeneous Suburbs; Tiebout, Alonso, and Government Policy; NBER Working Papers 15; National Bureau of Economic Research: Cambridge, MA, USA, 2010. [Google Scholar]
  50. Chung, Y.S.; Kim, J.H.; Cho, J.H. Analysis of price determinants of apartments in Ho Chi Minh. J. Korean Hous. Assoc. 2014, 12, 13–21. [Google Scholar]
  51. Huynh, D. Phu my hung new urban development in Ho Chi Minh City: Only a partial success of a broader landscape. Int. J. Sustain. Built Environ. 2015, 4, 125–135. [Google Scholar] [CrossRef]
  52. Kato, H.; Nguyen, L.H. Land policy and property price in Hanoi, Vietnam. J. East. Asia Soc. Transp. Stud. 2010, 8, 1011–1026. [Google Scholar]
  53. Thanh-Nien-News. Shocking Photos Reveal How Saigon Traffic Has Gone from Bad to Worse. Available online: http://www.thanhniennews.com/society/shocking-photos-reveal-how-saigon-traffic-has-gone-from-bad-to-worse-51386.html (accessed on 22 June 2018).
  54. Lan, T.T.N.; Liem, N.Q.; Binh, N.T.T. Personal exposure to benzene of selected population groups and impact of commuting modes in Ho Chi Minh, Vietnam. Environ. Pollut. 2013, 175, 56–63. [Google Scholar] [CrossRef] [PubMed]
  55. Le, T.P.L.; Trinh, T.A. Encouraging public transport use to reduce traffic congestion and air pollutant: A case study of Ho Chi Minh City, Vietnam. Procedia Eng. 2016, 142, 236–243. [Google Scholar] [CrossRef]
  56. Eckert, R.; Schinkel, U. Liveable City tp. Ho Chi Minh-Adaptation as Response to Impacts of Climate Change. REAL CORP. 2009, 313–323. [Google Scholar]
  57. Seo, D.; Kwon, Y. In-migration and housing choice in Ho Chi Minh City: Toward sustainable housing development in Vietnam. Sustainability 2017, 9, 1738. [Google Scholar] [CrossRef]
  58. Vietnamnet. More Traffic Jams in Hanoi as Personal Vehicles Increase. Available online: https://english.vietnamnet.vn/fms/society/141019/more-traffic-jams-in-hanoi-as-personal-vehicles-increase.html (accessed on 15 October 2018).
  59. UN Habitat. Vietnam Housing Sector Profile; UN Habitat: Nairobi, Kenya, 2014; p. 158. [Google Scholar]
  60. UN Habitat. Mapping Urban Poverty in Ho Chi Minh City; UN Habitat: Hanoi Vietnam, 2008; p. 81. [Google Scholar]
  61. Tuoitrenews. Long-Lasting Troubles of Living in Apartments in Vietnam. Available online: http://tuoitrenews.vn/features/26584/longlasting-troubles-of-living-in-apartments-in-vietnam (accessed on 15 April 2018).
Figure 1. Apartment Prices in Ho Chi Minh City (HCMC) and Hanoi (Source: [15]).
Sustainability 10 04720 g001
Figure 2. Spatial Distribution Analysis of HCMC (Kernel Density).
Sustainability 10 04720 g002
Figure 3. Spatial Distribution Analysis of Hanoi (Kernel Density).
Sustainability 10 04720 g003
Figure 4. Map of Apartment Prices in HCMC.
Sustainability 10 04720 g004
Figure 5. Map of Apartment Prices in Hanoi; Indicator for Apartments of Foreign Developers.
Sustainability 10 04720 g005
Figure 6. Peak Hour Commuting in HCMC (left) and Hanoi (right) (Source: Thanh Nien News [53] and VietNamNet [58]).
Sustainability 10 04720 g006
Figure 7. Comparison of Apartment Complexes Developed Before and After the Financial Crisis of 2008 in HCMC / Note: The result of the nearest neighbor analysis was 0.68 (Z-Score = −6.2) before 2008 and 0.96 (Z-Score = −0.87) after 2008, which means that the null hypothesis that apartments were randomly distributed could not be rejected at the 99% confidence level.
Sustainability 10 04720 g007
Figure 8. Comparison of Apartment Complexes Developed Before and After the Financial Crisis of 2008 in Hanoi/Note: The result of the nearest neighbor analysis was 0.83 (Z-Score = −2.31) before 2008 and 0.65 (Z-Score = −7.89) after 2008, which indicates the presence of clustering at the 99% confidence level.
Sustainability 10 04720 g008
Table 1. Overview of Hanoi and Ho Chi Minh City (HCMC).
UnitHanoiHCMCVietnam
Population 7,587,800 (8%)8,444,600 (9%)94,569,072
DensityPopulation/km223004097276
Area (municipality)km233292061331,212
Area (metropolitan)km224,314.7010,619.40
GDP (total)USD. Billion31.20 (12.9%)53.83 (22.4%)240.78
GDP (per capita)USD403163892546
FDIUSD. Million27,638 (8.6%)43,879 (13.7%)319,613
Source: General Statistical Office of Vietnam; Note: proportion to total national amount in parentheses.
Table 2. Comparison of Local Government Expenditure and Apartment Supply.
YearHCMCHanoi
ExpenditureApartment SupplyExpenditureApartment Supply
200842,091950038,3205200
200950,950 (21.0%)11,500 (21.1%)57,537 (50.1%)15,500 (198%)
201056,944 (11.8%)19,500 (69.6%)72,622 (26.2%)15,000 (−3.2%)
201164,745 (13.7%)9000 (−53.8%)81,689 (12.5%)23,000 (53.3%)
201274,913 (15.7%)4000 (−55.6%)93,137 (14%)10,500 (−54.3%)
201369,173 (−7.7%)8000 (100%)80,627 (−13.4%)11,500 (9.5%)
201471,716 (3.7%)18,000 (125%)77,131 (−4.3%)17,500 (52.2%)
201559,735 (−20.1%)41,000 (127.8%)111,678 (30.9%)34,000 (94.3%)
201647,789 (−25%)38,000 (−7.3%)107,844 (−3.5%)35,000 (2.9%)
201767,075 (28.8%)31,900 (−16.1%)75,205 (−43.4%)35,300 (0.86%)
Source: General Statistical Office of Vietnam; Note: Annual growth rates in parentheses.
Table 3. Variable Description for the Hedonic Price Model.
CategoriesVariablesCodeUnitDescription
Housing Attributes Apartment price (Dependent)
Average unit area
Age of housing
Highest floor
avg_price
mdn_area
p_year
h_story
USD/m2
m2
year
floor
Average sales price per m2
Apartment unit area
Building age
Number of building floors
Community AttributesPopulation density of district
Total number of households
Pool
Mixed-use development
Development by foreign developers
Natural ventilation
Retail on ground level
pop_den
t_units
d_pool
d_of_ds
d_foreign
d_air
d_shop
person/ha
unit
dummy
dummy
dummy
dummy
dummy
District of apartment location
Total number of apartment units
Existence in the project
Commercial/office/residential
Foreign developer
Natural air flow in public corridor
Ground floor shops
Locational Attributes Location in new town
Location in downtown
Adjacency to main road
Distance to downtown
Proximity to park
Proximity to river
Proximity to international school
Proximity shopping mall
d_ncity
d_center
d_mroad
cbd_m
d_park
d_river
d_Is
d_com
dummy
dummy
dummy
m
dummy
dummy
dummy
dummy
Phu My Hung new town
Districts 1, 3/Hoan Kiem, Hai BaTrung
Over four lane road
To the Presidential Palace in District 1
Formal urban parks
Formal urban rivers
Primary and secondary schools
Corporate shopping malls
Note: The variables were selected from previous studies, and local consultants of housing developments also advised on the adequacy of the variables in the context of the local market of Vietnam.
Table 4. Descriptive Statistics of Apartment Projects in HCMC and Hanoi.
VariablesHCMC (n = 197)Hanoi (n = 187)
DescriptionCodeMeanS.D.MeanS.D.
Apartment price (USD/m2)avg_price10745871234469
Population density of districtpop_den209251140125
Total number of householdst_units415483512687
Age of housingp_year4.473.233.403.12
Highest floorh_story17.76.9923.17.87
Average unit areamdn_area96.926.910324.9
Development by foreign developersd_foreign0.200.400.090.28
Location downtownd_center0.090.280.020.15
Location in new townd_ncity0.180.39--
Poold_pool0.480.500.280.45
Mixed-use developmentd_of_ds0.050.210.070.26
Retail on ground leveld_shop0.080.270.260.44
Adjacency to the main roadd_mroad0.410.490.600.49
Proximity to parkd_park0.200.400.440.50
Proximity to riverd_river0.190.400.180.38
Proximity to international schoold_Is0.160.370.400.49
Proximity shopping malld_com0.330.470.460.50
Distance to downtowncbd_m5957289260152546
Natural ventilationd_air0.370.480.780.42
Table 5. Regression Results.
Independent VariableHCMCHanoi
Population density of districtpop_den−0.096 (−2.140) **0.019 (0.435)
Total number of householdst_units−0.028 (−0.531)0.028 (0.658)
Age of housing p_year−0.120 (−2.514) **0.132 (3.148) **
Highest floorh_story−0.104 (−1.797)0.036 (0.750)
Average unit areamdn_area0.103 (2.082)0.101 (2.356) *
Development by foreign developersd_foreign0.055 (0.943)0.297 (6.984)**
Location in downtownd_center0.327 (7.242) **0.345 (8.510) **
Location in new townd_ncity0.045 (0.818)
Poold_pool0.196 (3.943) **0.071 (1.541) *
Mixed-use developmentd_of_ds0.222 (5.227) **0.069 (1.716)
Retail on ground leveld_shop−0.014 (−0.348)−0.035 (−0.853) *
Adjacency to the main roadd_mroad0.035 (0.834)0.032 (0.772)
Proximity to parkd_park0.121 (2.987) **0.068 (1.780)
Proximity to riverd_river−0.009 (−0.202)0.014 (0.382)
Proximity to international schoold_Is0.121 (2.417) **0.076 (1.730)
Proximity shopping malld_com0.015 (0.355)−0.012 (−0.310)
Distance to downtowncbd_m−0.450 (−8.846) **−0.472 (−8.728) **
Natural ventilationd_air−0.005 (−0.127)0.020 (0.542)
n197187
Adjusted R20.7420.780
Note: T-stats in parentheses. ** denotes the 1% significance level; * denotes the 5% significance level. In this study, all variance inflation factor values from the Hanoi data set were less than 2.475, and those from the HCMC data set were less than 2.551. Furthermore, all values of tolerance for Hanoi were more than 0.404, and those for HCMC were more than 0.392. Therefore, there is no multicollinearity issue.
Table 6. Significant Price Determinants in HCMC and Hanoi.
HCMCHanoi
Common Determinants(−) Distance to downtown **
(+) Location in downtown **
(+) Average unit area **
Different Determinants(−) Age of housing **
(+) Mixed-use development **
(+) Proximity to park **
(+) Proximity to international school **
(−) Population density of district **
(+) Pool **
(+) Age of housing **
(+) Development by foreign developers **
** denotes the 1% significance level; * denotes the 5% significance level.

