Article

A GIS-Based Framework Creating Green Stormwater Infrastructure Inventory Relevant to Surface Transportation Planning

Department of Civil and Environmental Engineering, University of South Florida, 4202 E. Fowler Avenue, ENB 118, Tampa, FL 33620, USA
*
Author to whom correspondence should be addressed.
Sustainability 2018, 10(12), 4710; https://doi.org/10.3390/su10124710
Submission received: 30 October 2018 / Revised: 28 November 2018 / Accepted: 8 December 2018 / Published: 11 December 2018

Abstract

:
The stormwater runoff that carries pollutants from the land adjacent to road transportation systems may impair the water environment and threaten the ecosystem and human health. A proper management approach like green stormwater infrastructure (GSI) can help control flooding and the runoff pollutants. One barrier for GSI analysis relevant to system-level surface transportation planning is the lack of the inventory of GSI in many U.S. cities. This study aims to develop a GIS-based framework for creating GSI inventory in a time and labor efficient way, different from the traditional survey-based method. The new proposed framework consists of three steps, including road categorization, GSI mapping, and GSI type identification using the GIS data, high-resolution land-cover image, and Google Earth street view pictures. The new approach was tested in Philadelphia, Pennsylvania and also applied in Tampa, Florida. The results showed that the new GIS-based framework can achieve similar accuracy to the survey-based method while saving time and labor. The GSI inventory created in the study demonstrated the usefulness of the proposed framework for analyzing the status of GSI implementation and identifying gaps for future planning in terms of potential locations and underrepresented GSI types.

1. Introduction

National Pollutant Discharge Elimination System (NPDES) regulates that transportation authorities are responsible for managing the stormwater runoff that carries pollutants from the land adjacent to road transportation systems. The proper stormwater management can help control flooding and the runoff pollutants that may impair the water environment and threaten the ecosystem and human health [1,2]. Green infrastructure is a stormwater management approach with many economic and human health benefits including flood mitigation, erosion control, improved water quality, groundwater recharge, mitigated effect of urban heat islands, reduced energy demands for cooling, and enhanced aesthetics and access to green space [3,4,5]. Unlike gray stormwater infrastructure systems that are often large and centralized, green stormwater infrastructure (GSI) can be applied at different spatial scales and decentralized arrangements [6]. GSI like basins [7], bioswales [8], bioretention [9], and constructed wetlands [10] have been adopted and implemented in the transportation infrastructure design. However, such implementation is project-based without analysis at the system level or watershed scale [11]. The individual GSI can mitigate local stormwater runoff but may not lead to performance improvements in the entire stormwater network at the watershed scale [12]. To facilitate a system level analysis for urban stormwater management, a spatial GSI inventory at a large scale (sub-watershed or watershed) is needed. However, the GSI inventory is currently lacking in many United States (U.S.) cities. This is because the traditional method to create such an inventory is based on survey and inspection data collection [13,14]. It can help build up the GSI inventory accurately, but consumes time and labor meaning that not all cities can afford it. A new framework is needed to construct an inventory of the implemented GSI using the existing geospatial data in a more efficient and economical manner. Such a framework could benefit GSI system-wide assessment and modeling, and future stormwater infrastructure planning.
The previous studies on the topic of urban GSI mapping primarily focused on identifying the potential opportunities for implementing GSI [15,16,17,18,19,20]. Among the limited number of the studies that mapped implemented GSI, some applied geospatial techniques such as remote sensing to enhance the land use/land cover classification using the remotely sensed images [21,22,23,24]. However, most of them focused on GSI detection under the connotation of ‘green space.’ In other words, they intended to find the GSI footprints without consideration of the unique features of engineered GSI (i.e., GSI types). These studies contributed to the development of the GSI mapping method but lacked actual applications of their methods. Moreover, there is no study focusing on either mapping the implemented GSI or identifying various types of GSI based on their surface features. Hale et al. used topographic data and aerial imagery to identify retention basins; however, this study was limited to the detection of a single GSI type [25]. Only one project focused on creating a comprehensive GSI inventory that was developed by the City of Philadelphia [26]. A GSI database was built for the entire metropolitan area in the project. The GSI mapping was primarily conducted by survey collection (though the mapping method was not explicitly described in the project, the information in the metadata and guidelines matches the survey-based process [26,27]). In addition, errors were found in terms of mapping and GSI type recognition; for example, some sports fields and concrete parking lots were misclassified as GSI, especially in the regions of intensive roads.
To fill the research gap in the GSI mapping, this study aims to develop a framework for creating GSI inventory in a time and labor efficient way. The framework is based on the Geographic Information System (GIS) technique and GSI’s visual features. Since it is hard to detect the underground structures from the visual features, e.g., the invisible connections between the inlet and the hybrid GSI nearby [28], the applicability of this framework is limited to surface GSI. All the required data for the framework is available in most municipalities from the government and public organizations. The paper focuses on the transportation-related GSI because the transportation infrastructure planners are key stakeholders for large-scale implementation of GSI. The transportation-related GSI refers to the GSI facilities designed with or serving the road transportation systems including freeways, arterials, collectors, and local roads. The GSI facilities serving only buildings, pedestrian pavements, or parking lots are not included. Therefore, the framework proposed in this paper includes the GSI of bioretention, bioswales (dry or wet swales), basins (dry or wet ponds), infiltration basins, infiltration trenches, and vegetated filter strips (Table 1). Some GSI types are excluded from this study, since they are either rarely applied to transportation planning or commonly applied to pedestrian pavements other than vehicle roads. Table 1 summarizes the type of GSI and their applications to transportation planning. The GSI nomenclature used by the U.S. Environmental Protection Agency (EPA) and the Water Research Foundation [29,30] was adopted in this study, it is worth mentioning that various terms were used interchangeably for some GSI types [31].

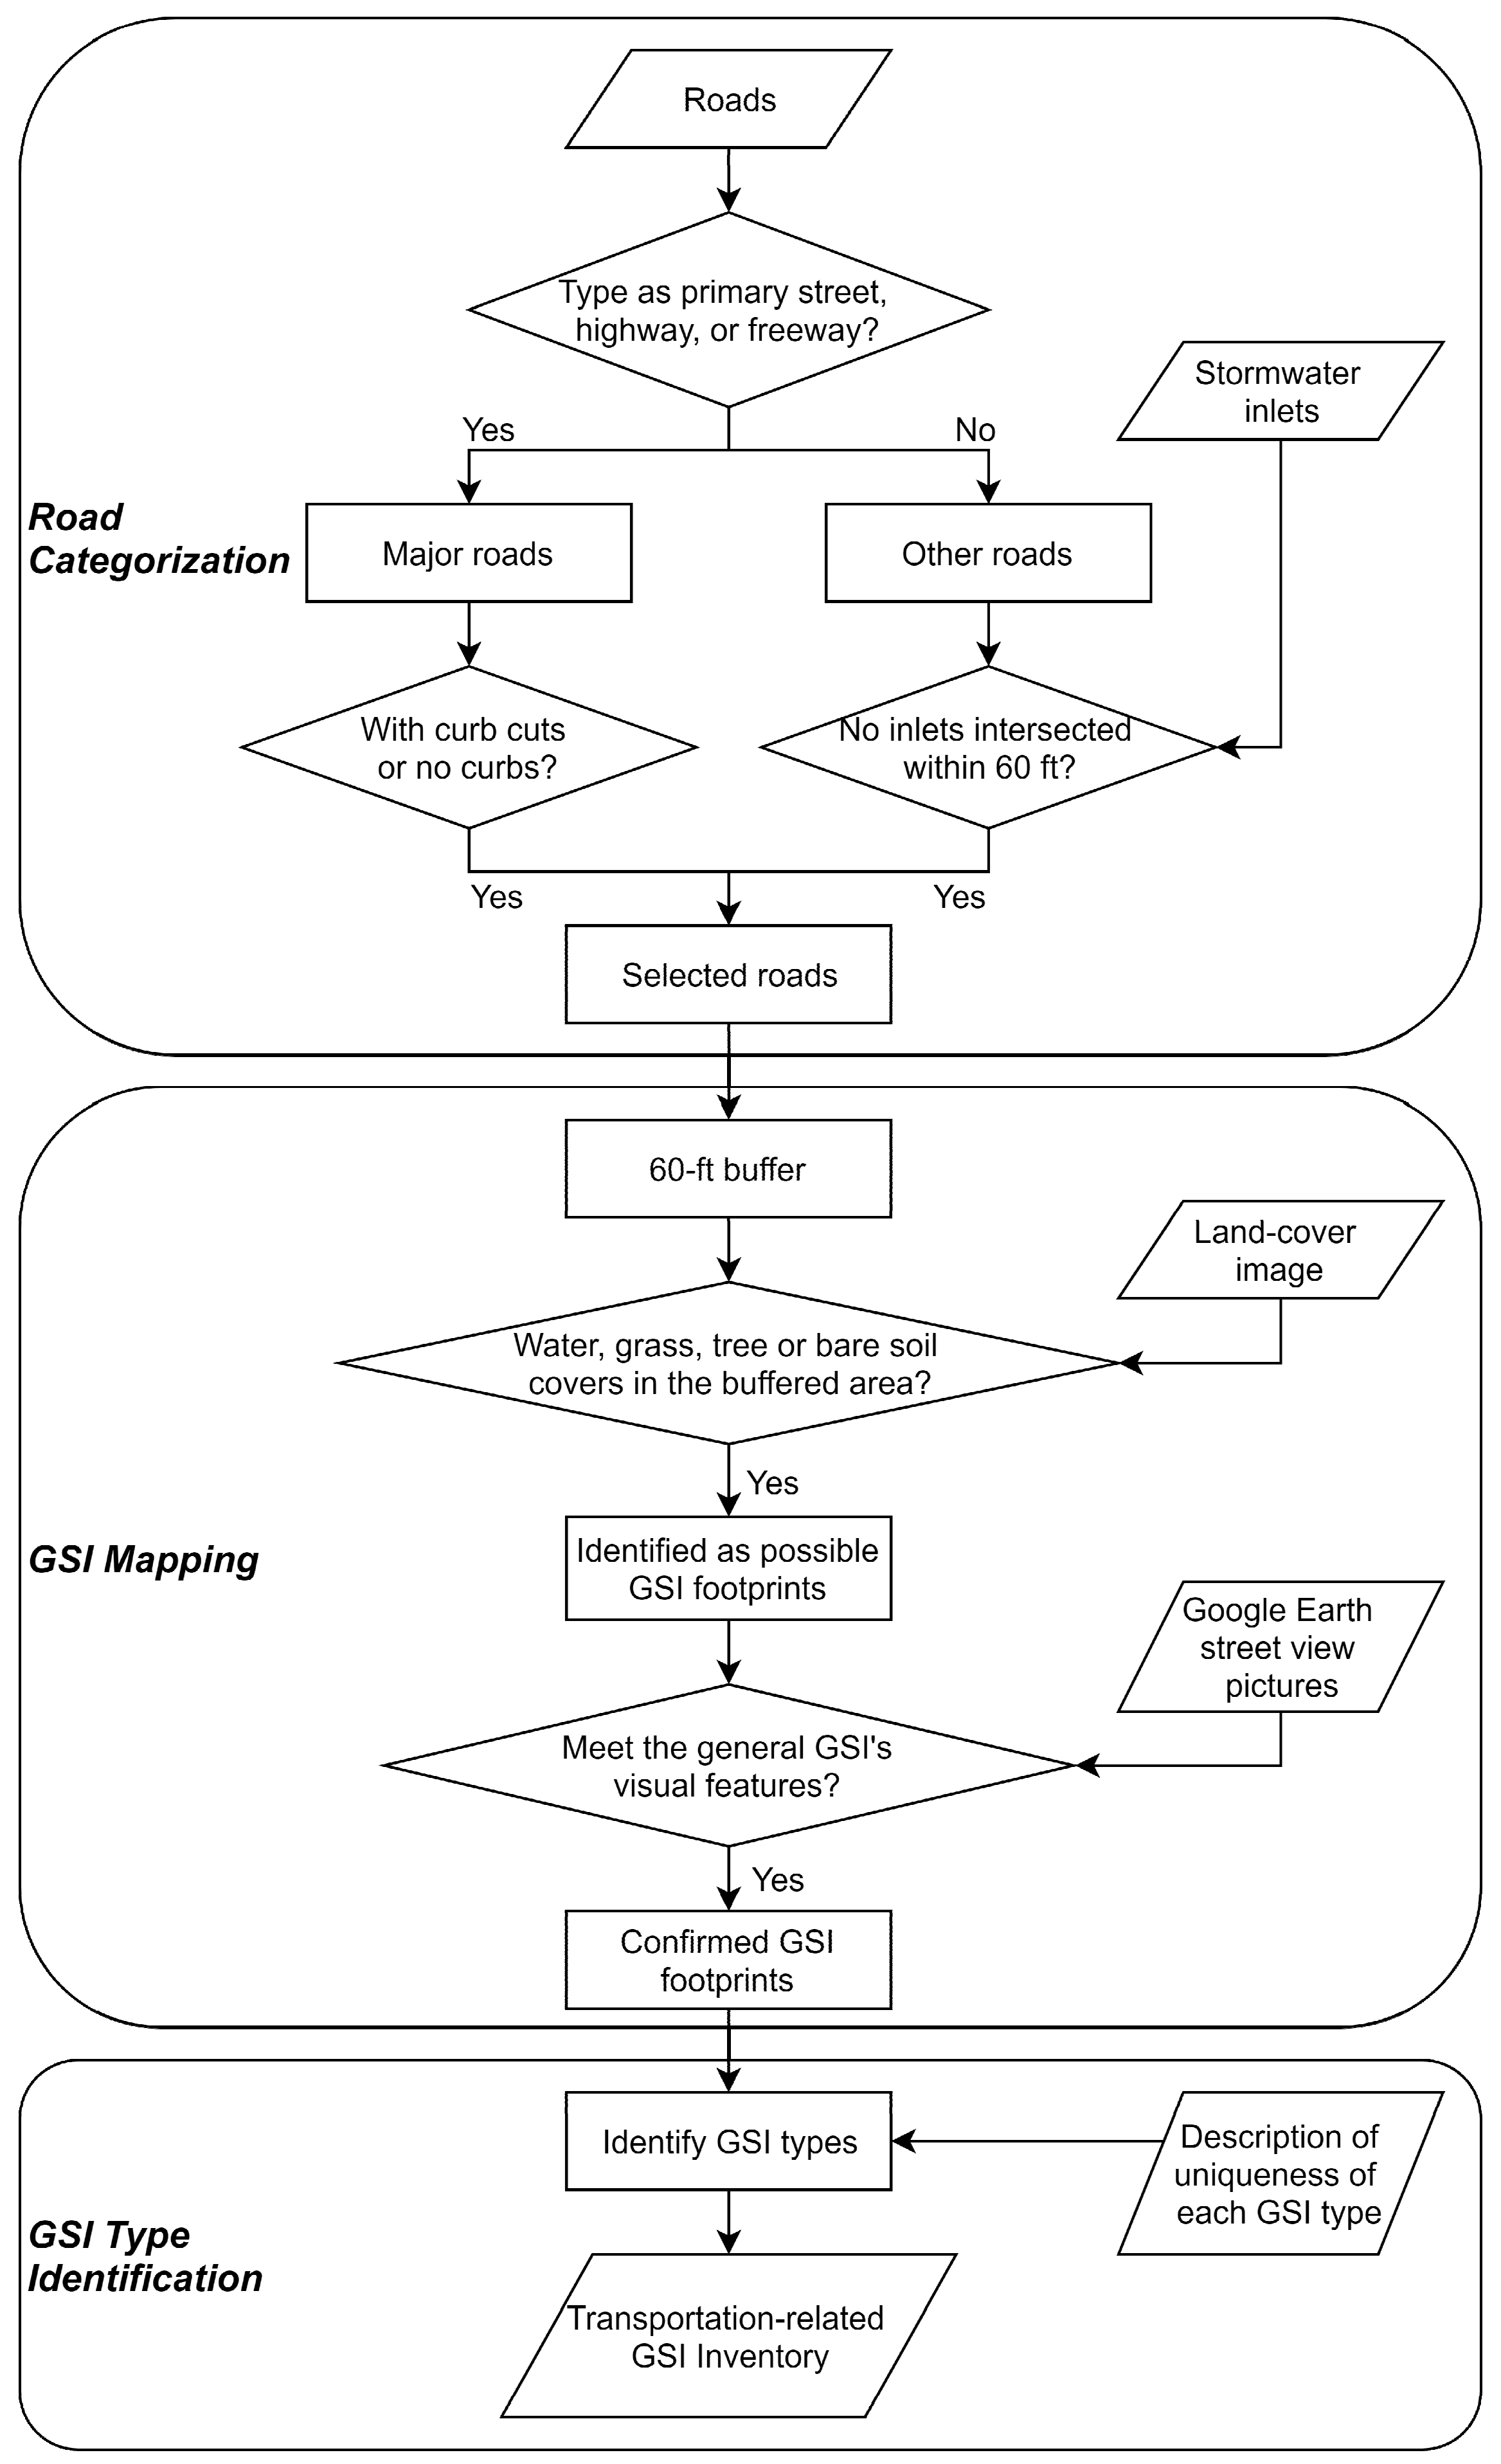
2. Structure of the GIS-Based Framework

2.1. An Overview of the Framework

The proposed GIS-based framework consists of three steps: Categorizing the roads that may contain GSI nearby, Mapping the existing GSI relevant to transportation, and Identifying GSI types according to their visual features (Figure 1).
All the roads within the area of interest are categorized into major roads and other roads. They are screened by the corresponding criteria and the roads with potential implemented GSI nearby are selected. The land covers of water, grass, tree, and bare soil that fall within the 60-ft buffered areas of the selected roads are identified as the possible GSI footprints, which are confirmed later with the help of Google Earth street view pictures. The types of confirmed GSI sites are identified according to the unique visual characteristics of each GSI type. Eventually the GSI inventory is created with the information collected from the last two steps, including the GSI footprints and types.
The first step of categorizing roads is automated if all the needed data is provided, which helps reduce the workload in the next two steps greatly. For the second step of mapping GSI, the method can automatically find possible GSI footprints, but the confirmation of the GSI footprints requires manual work. The third step of identifying GSI type needs manual work as well. As a result, the framework is half automated.
The framework was tested in Philadelphia, Pennsylvania with accuracy assessment, and then applied in Tampa, Florida. Both the areas of Philadelphia and Tampa adopted gray and green infrastructures for stormwater management during their urban development.
The details in each step are introduced in the following sections.

2.2. Data Requirements

This framework basically requires the GIS data of road centerlines, stormwater management facilities like water inlets, a high-resolution land-cover image, elevation data, and street view pictures as a reference provided by Google Earth.
Specifically, Table 2 lists the collected data and their sources to create the implemented GSI inventory in Tampa, an application of this GIS-based framework method. All the data of road systems and stormwater management facilities were formatted as shapefiles and available to the public through an open data link. The data on stormwater discharge points and open drains are not required but can help select the roads with potential implemented GSI nearby. The non-public raster image of Tampa land cover was created with a rule-based object-orientated classification method utilizing high-resolution imagery, Light Detection and Ranging (LIDAR) data, and ancillary GIS data by the University of South Florida (USF) Water Institute. It has a 1-ft-by-1-ft resolution, providing extremely high accuracy as a reference map. The one-meter Digital Elevation Models (DEMs) produced by the U.S. Geological Survey (USGS) was used as the elevation layer for identifying GSI types. All the data were adjusted using the “GCS_North_American_1983” ArcGIS file of the coordinate system.

2.3. Categorizing the Roads with Potential Implemented GSI Nearby

In the U.S., the stormwater management is required to be conducted together with surface transportation planning [35]. Both gray and green stormwater infrastructures are considered as options. For instance, community roads usually come with cemented open drains and highways have more water inlets for faster drainage. For the framework developed in this paper, it is critical to find the roads near which GSI may exist, in other words, to exclude the roads that are associated with only gray infrastructure.
In this study, all the roads within the area of interest were categorized into major roads (i.e., interstates, highways, state roads, or county roads) and other roads. The major roads with curb cuts or no curbs and the other roads with no inlets intersected within 60 ft were considered as the ones that may contain GSI nearby and selected for further analysis.
For the major roads, the associated GSI usually exist along with the traditional gray infrastructure to ensure the flood drainage of the major roads under extreme storm events [36,37]. It is common to see GSI and gray water inlets along the same major road. Thus, a better way to determine if the major roads contain GSI nearby is to check if there are curb cuts or even no curbs on the sides of major roads. Those curb cuts or no-curb sides can lead the stormwater runoff to the pervious surface nearby. Some GIS data of road centerlines contain the curb information (e.g., concrete curb, curb cuts, or no curbs) in the attribute table. However, if the curb information is not provided in GIS data, they can be created manually by checking the road pictures (e.g., Google Earth street view pictures) section by section. Each section typically adopts a single curb plan, i.e., full curbs, curb cuts, or no curbs. The manual workload of checking curb information is acceptable because of the limited number of major roads.
For the other roads, usually either green a stormwater solution or gray infrastructure would be implemented. It means GSI would be hardly found along the roads with water inlets. As a result, the other roads with no inlets intersected within 60 ft, as well as the major roads with curb cuts or no curbs, were selected to locate the possible GSI nearby in the next step.

2.4. Mapping GSI Relevant to Transportation

A 60 ft buffer was created for each selected road to determine the search area where the GSI may potentially occur. The 60 ft buffer is the distance from the road centerline to the edge of the road. A single travel lane is usually 10–12 ft wide [38]. For example, the State of Florida adopts 12 ft as the primary travel lane width in the urban area [39]. The roads in the urban area usually consist of one to four lanes in one direction, depending on the type of road, e.g., freeways, arterials, collectors, or local roads. This means a buffer of 48 ft on one side of the road centerline is typically sufficient to cover the road surface. In addition, the setback from the right of way line to the structures (e.g., buildings or parking lots) is required, for instance, Florida requires a minimum distance of 12 ft [40]. The buffer with the selected width should be able to cover the entire road surface in one direction and part of the spacer between the road and the nearby buildings or parking lots, where transportation-related GSI is commonly implemented. After several trials, the 60 ft buffer was chosen as the best fit, which was neither too narrow to cover GSI along some major roads, nor too wide to include the greenspace of non-public properties. Then, the buffer of selected roads was overlapped with the land-cover image. The GSI are usually identified as water, grass, or tree covers, according to the GSI type and their surface covers (e.g., wet ponds would be observed as water, and bioswale as grass or bushes). Therefore, all the water, grass, tree, or bare soil covers in the buffered areas were considered as the possible GSI footprints and converted to vector polygons based on the pixel relativity. The possible GSI polygons were checked manually to determine if they met the general GSI’s visual features, with the help of Google Earth street view pictures. Since the possible GSI polygons are limited in amount, the time needed for visual confirmation was reasonable. All the confirmed GSI footprints were stored as GIS datasets for the final GSI inventory with type identification.

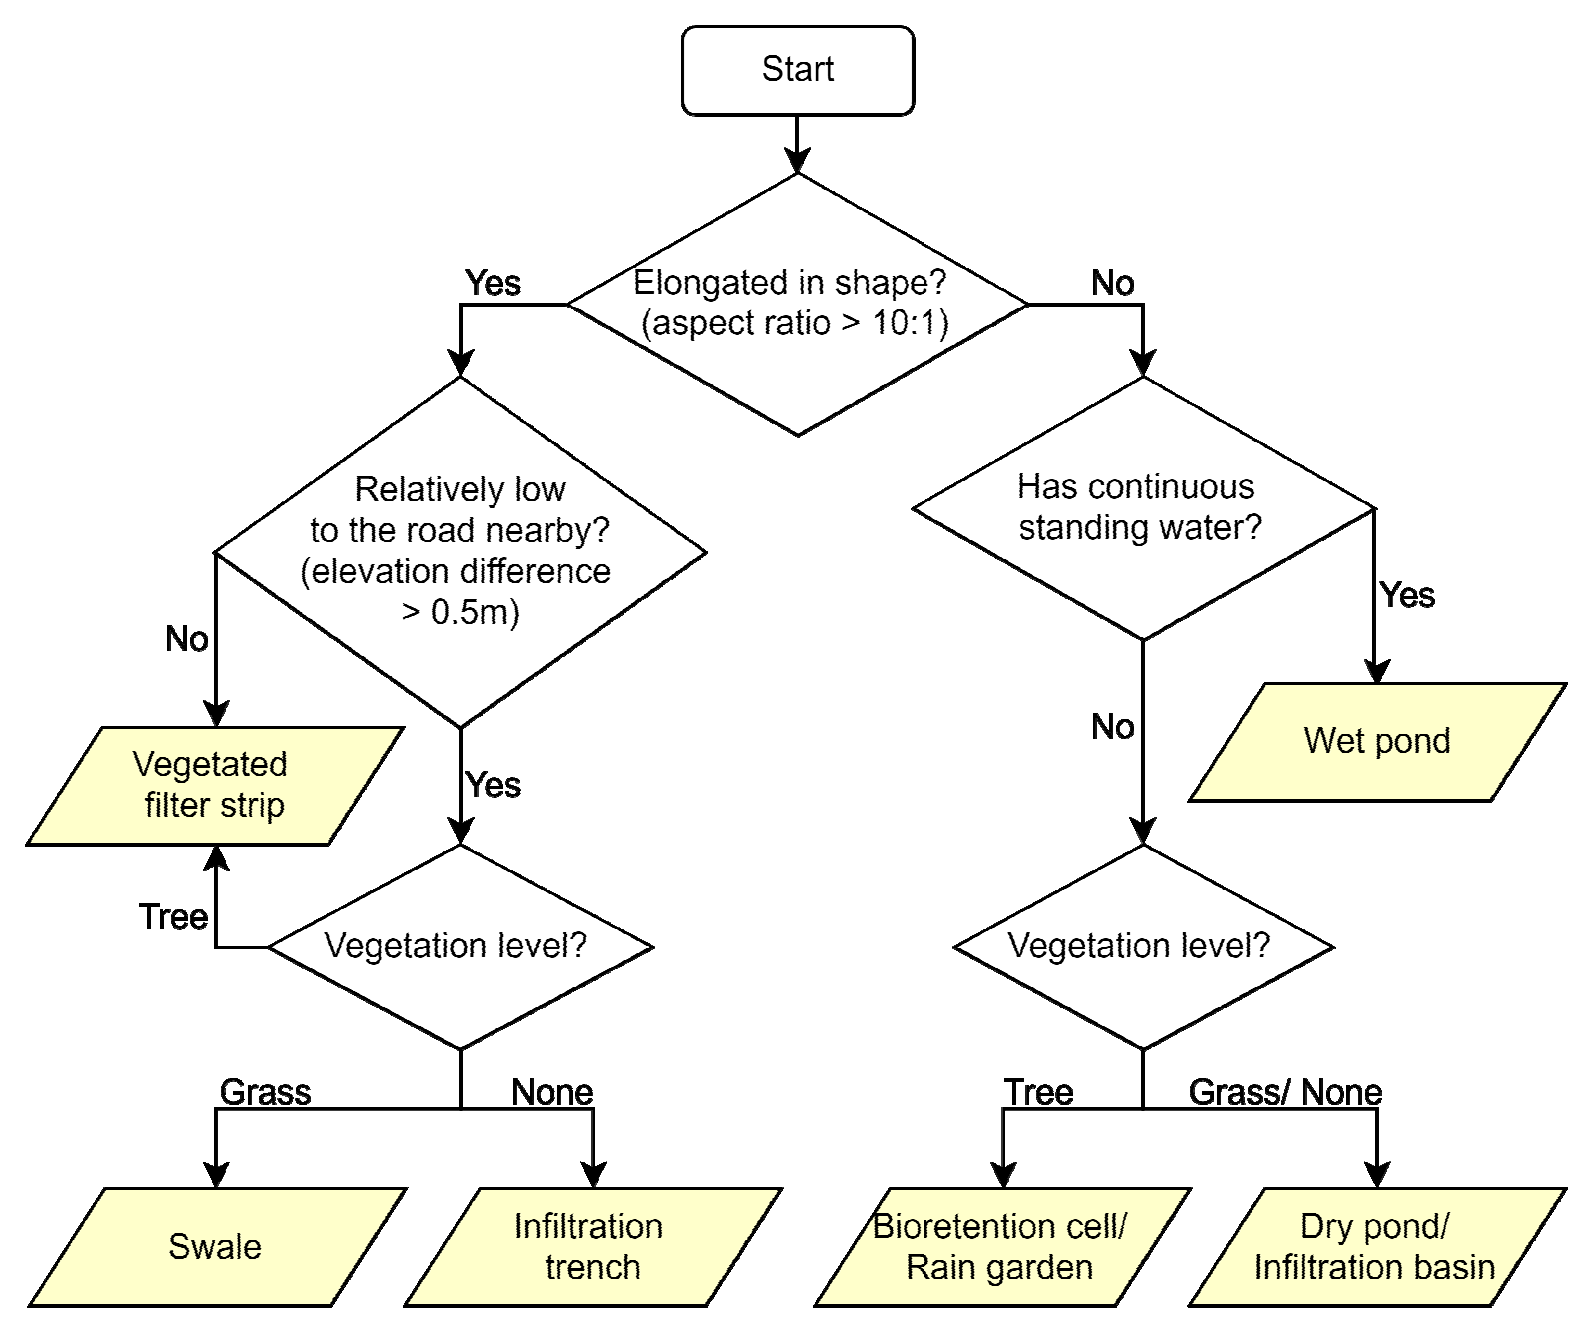
2.5. Identifying GSI Types from Visual Features

The framework uses the visual features from the Google Earth street view pictures to identify the GSI types. The visual variables considered include shape, relative elevation, vegetation level, and continuous standing water.
Figure 2 shows the decision-making flowchart that can be used to identify different types of GSI using their visual features. The same shape can be shared by different types of GSI, but it is a useful way to separate them into a couple of groups, namely elongated in shape or not. Swales, infiltration trenches, and vegetated filter strips usually have one of their dimensions being far larger than other dimensions. The aspect ratio of 10:1 was used in this study to determine if the detected GSI was elongated. The value of the aspect ratio is an empirical number and determined from case studies [4,41,42,43]. Vegetated filter strips in the design of mild slope could then be filtered out of this elongated-shape group because they often do not have a visual elevation difference from the surrounding area [44], while swales and infiltration trenches always do. The elevation difference in the framework refers to the one between the lowest point of the GSI surface and the adjacent point of the road nearby. The Digital Elevation Models (DEMs) produced by USGS were used to show the spatial elevation differences. If the elevation difference is larger than 0.5 m, it can be visually detected in the Google Earth pictures. The elongated-shape GSI with the elevation difference of ≤0.5 m can be identified as vegetated filter strips. The level of vegetation can be used to differentiate between swales, infiltration trenches, and the low-lying vegetated filter strips, which all have varying and distinct levels of vegetation. Three categories were developed to represent the vegetation level—tree, grass, and none. “Grass” vegetation level refers to a groundcover with grass as the major vegetation present, while “tree” refers to the vegetation containing other plants as dominant, such as bushes, flowers, and small trees. The vegetation level could be judged from the Google Earth pictures. Another way to classify it is to use the land-cover image that contains the three classes of forest, grass, or bare soil, which can roughly represent the vegetation level of tree, grass, and none, correspondingly [33]. For the group of non-elongated-shape GSI, wet ponds can be simple to sort out, since they are the only element with continuous standing water. The criterion of the vegetation level also helps differentiate between the dry pond/infiltration basin and the bioretention cell/rain garden. The framework does not distinguish infiltration basins from dry ponds, since they share almost the same visual features at the surface.

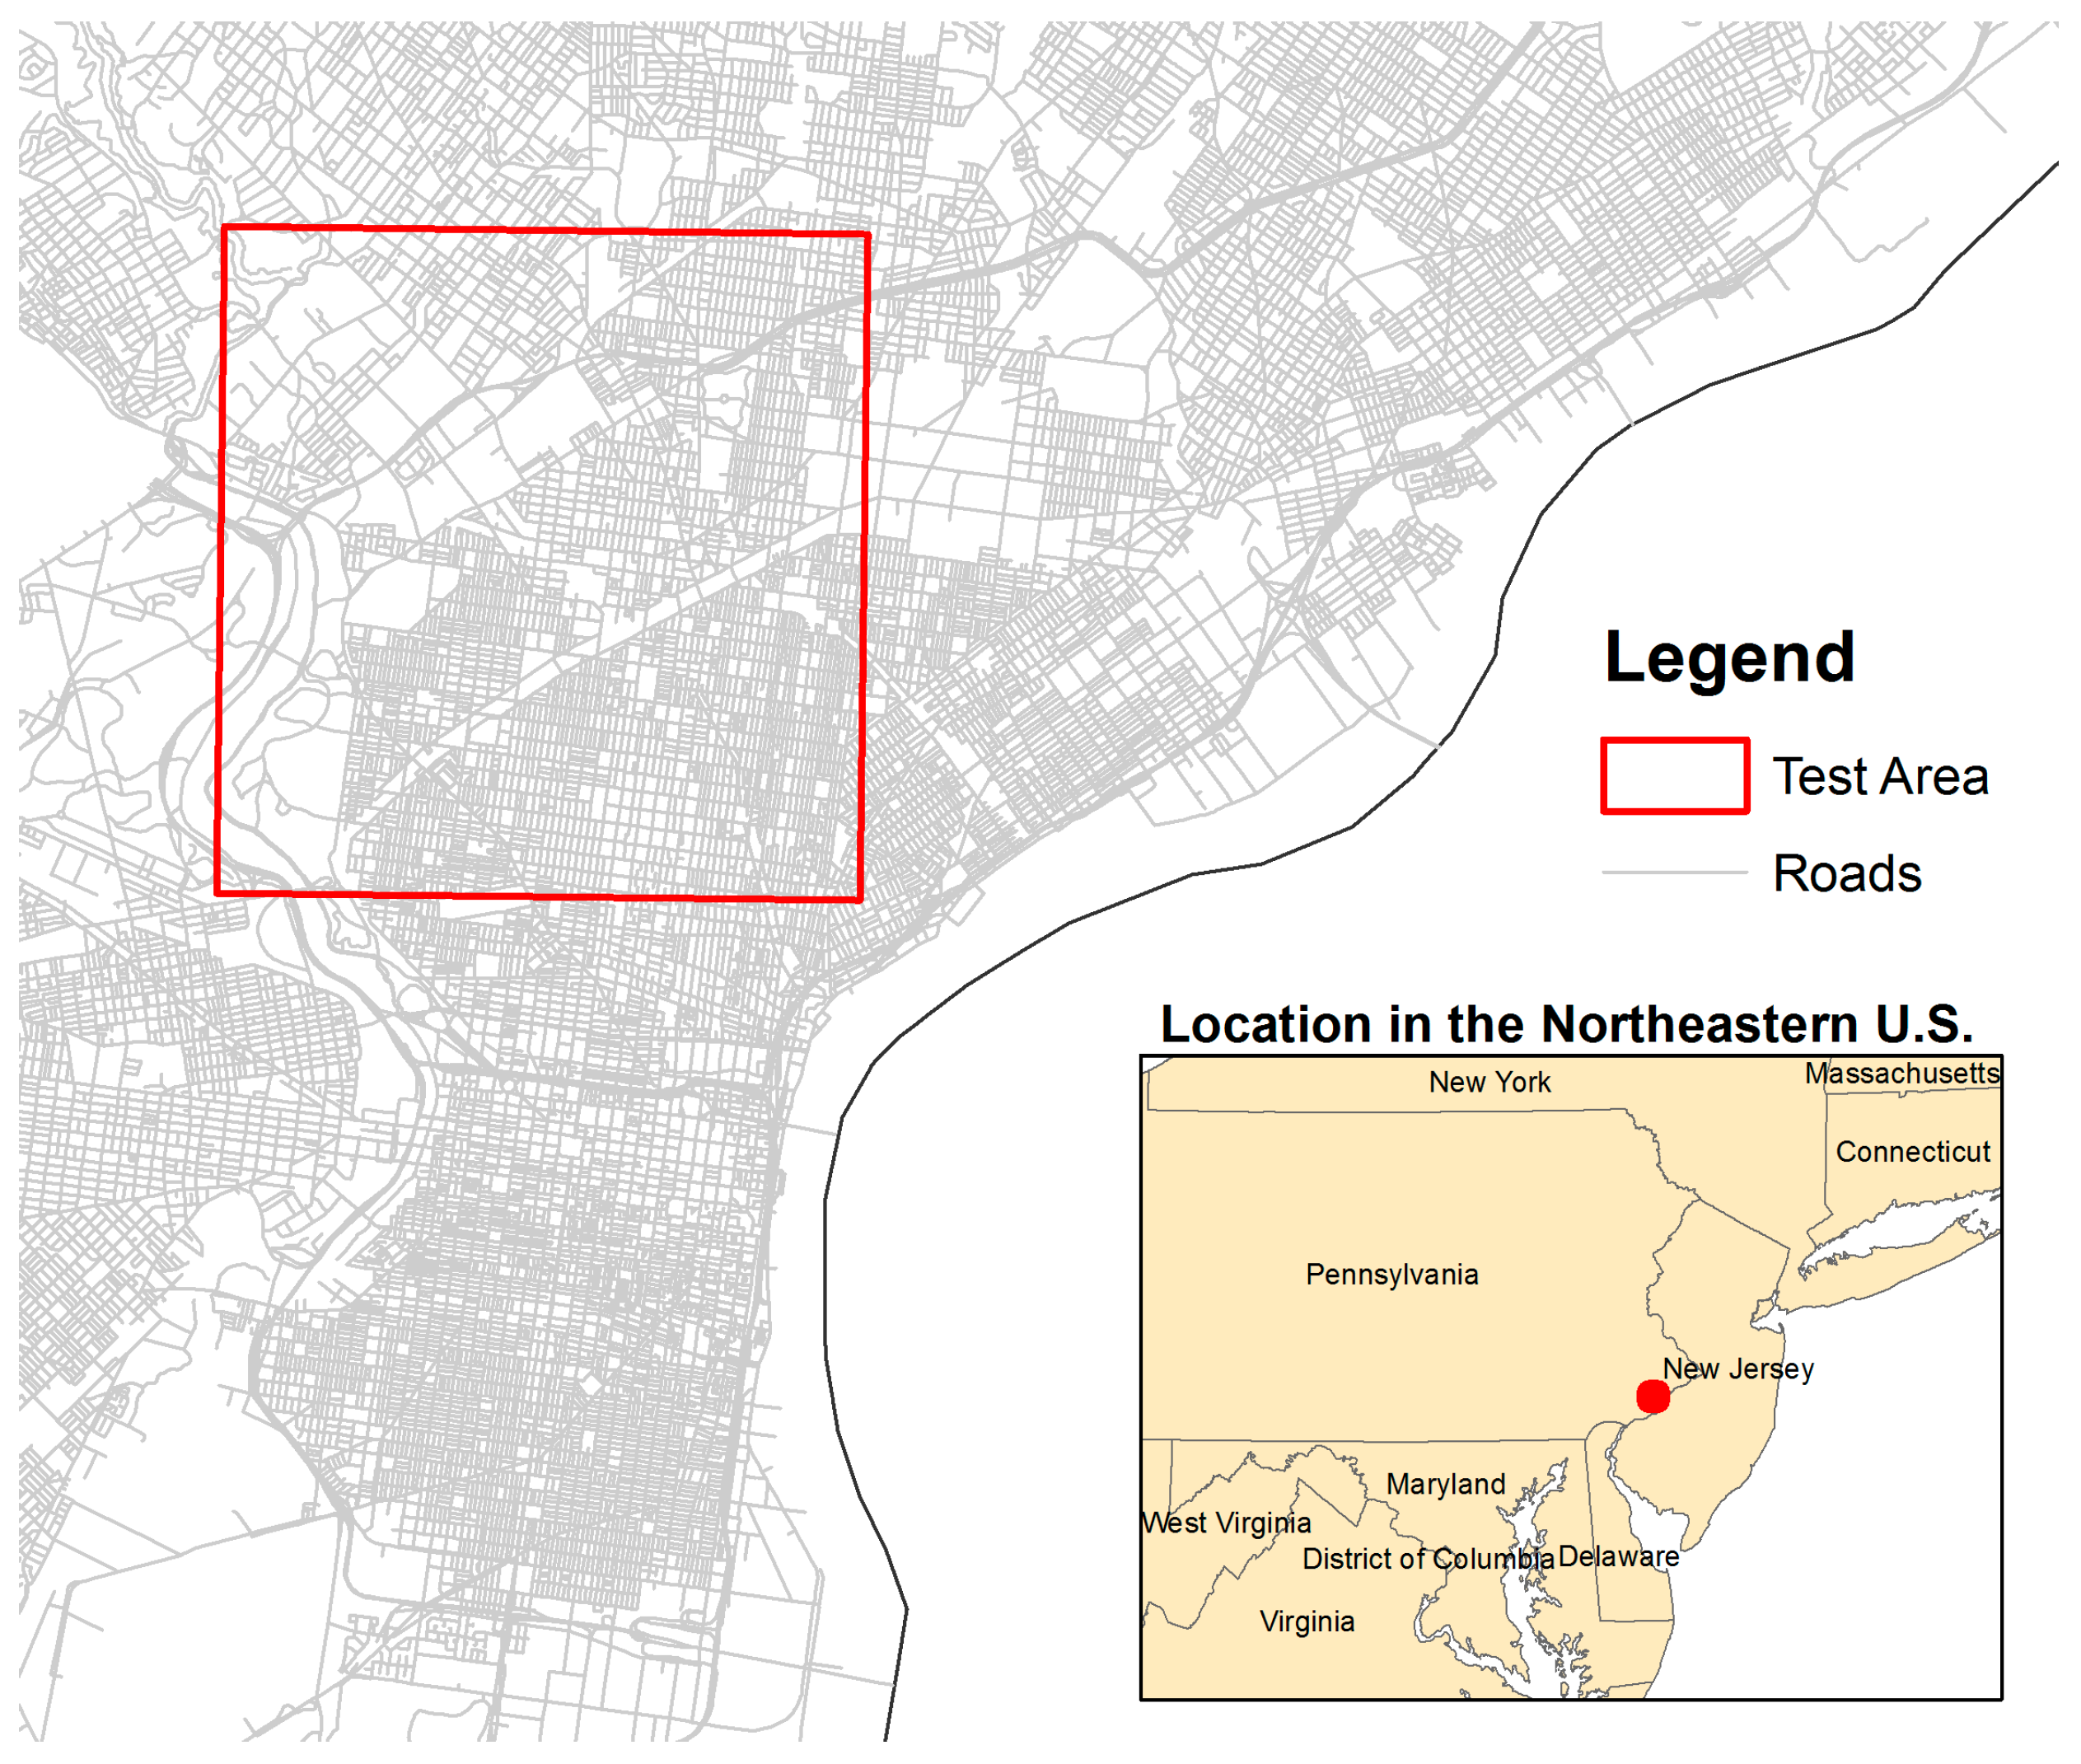
3. Framework Testing

3.1. Test Area and Results

The framework was tested for the GSI inventory in Philadelphia, Pennsylvania, where the dataset of GSI is available to the public [26]. Philadelphia’s GSI data were typically collected via survey and the City of Philadelphia claimed no responsibility for the data’s accuracy shown in the metadata. A rectangular region in central Philadelphia was selected as the test area, limiting the framework testing at an acceptable scale (Figure 3).
To apply the GIS-based framework developed, the GIS data of roads, water inlets, and land-cover images were acquired within the test area [45]. The GIS-based GSI inventory was created by following the steps mentioned in Section 2. A total of 427 transportation-related GSI elements were detected within the test area, in comparison to the 588 GSI in the same area in the City’s inventory. It is important to note that the City’s inventory also contains the GSI elements not related to road transportation systems. It took one person 19 h in total to create the GSI inventory, including the whole process of mapping GSI and identifying their types. The time for collecting data listed in Table 2 is not included. There is no record of the time that the City had spent on constructing the GSI inventory, but the challenge of mapping GSI was expressed [46]. The framework is considered an efficient solution for creating GSI inventory with lower time and labor requirement.

3.2. Accuracy Assessment

According to the binomial probability theory and its formula [47],
N = z 2 pq / E 2 ,
where z is the number of standard normal deviates (here it is 2, covering 95.4%), p is the expected accuracy in percentage (here it is 90), q is equal to 100-p, and E is the allowable error in percentage (here it is 5). A total of 144 samples were picked randomly from the Google Earth base map. Both the accuracies of GIS inventory created by the city government (Table 3) and this study (Table 4) were assessed. In the accuracy assessment tables, the producer’s accuracy means how accurate the GSI in the base map could be identified in the inventory map, and the user’s accuracy refers to the one in the opposite way.
According to Table 3 and Table 4, the total accuracies of the GSI inventory obtained from the city of Philadelphia are very close to the accuracies of the inventory created using the developed framework, which indicates the GIS-based approach can achieve similar accuracy as the traditional survey-based method. The new GIS-based approach excluded the detection of the GSI types of wetlands and tree trenches identified using the traditional method (Table 3) due to their rare application to the surface transportation planning.
The new method resulted in a slightly lower accuracy for basins compared with the one from the city (86% vs. 89% for producer’s accuracy, 89% vs. 91% for user’s accuracy), but has higher accuracy for swales and bioretention systems (e.g., 92% vs. 89% for swale in terms of user’s accuracy). It implies that the GIS-based framework has a good ability to detect the GSI of small size (e.g., swales and bioretention systems that usually have surface area of 200–10,000 ft2 [48]), but has the possibility of missing the large-size GSI like basins (requires minimum surface area of 0.25 acres [49]) because they are easily confused with surface waters and grassland landscape from the GIS perspective. In contrast, the traditional method has lower accuracy on mapping the GSI of small size due to the time constraints of surveyors for collecting the information of all small-size GSI. In other words, the GIS-based method scans through the entire studied area and has the advantage of catching the small-size GSI, compared to the labor-intensive survey method.
Overall, the new GIS-based method can achieve similar accuracy as the traditional survey-based method, while saving time and labor on inventory creation. In this case, it took one day to build up the GIS inventory, compared to the survey work that usually takes months.

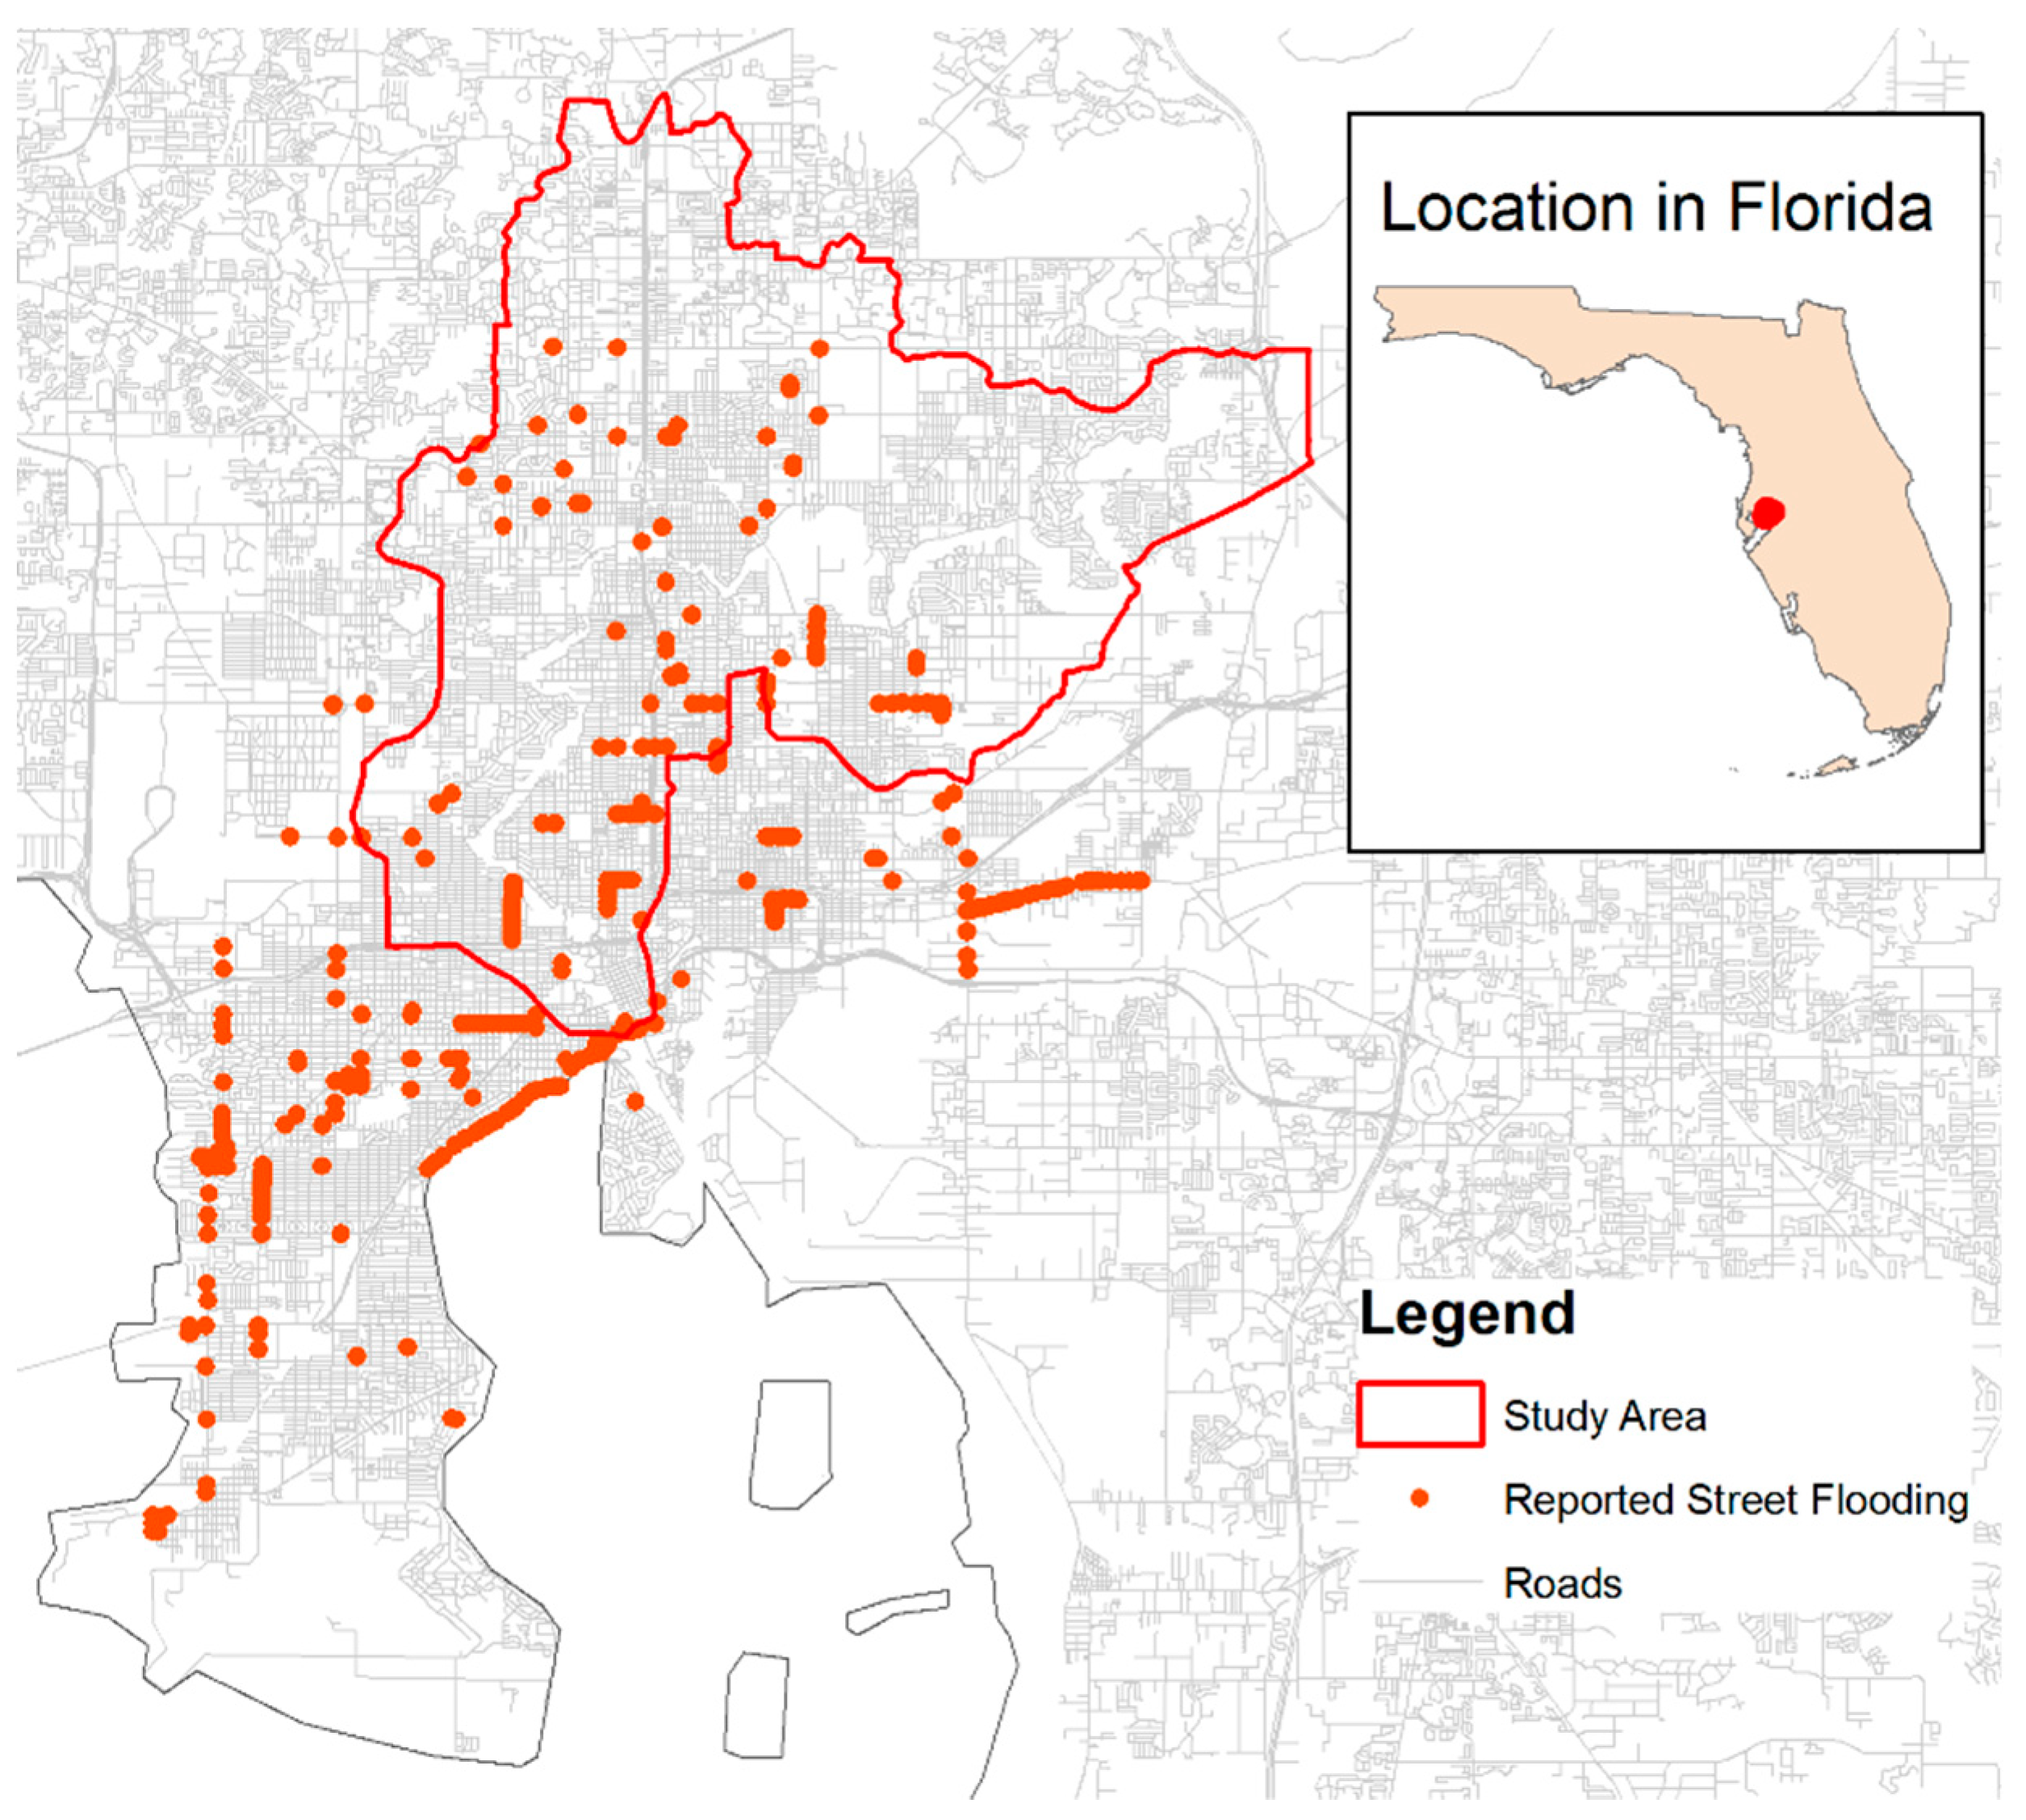
4. Framework Application
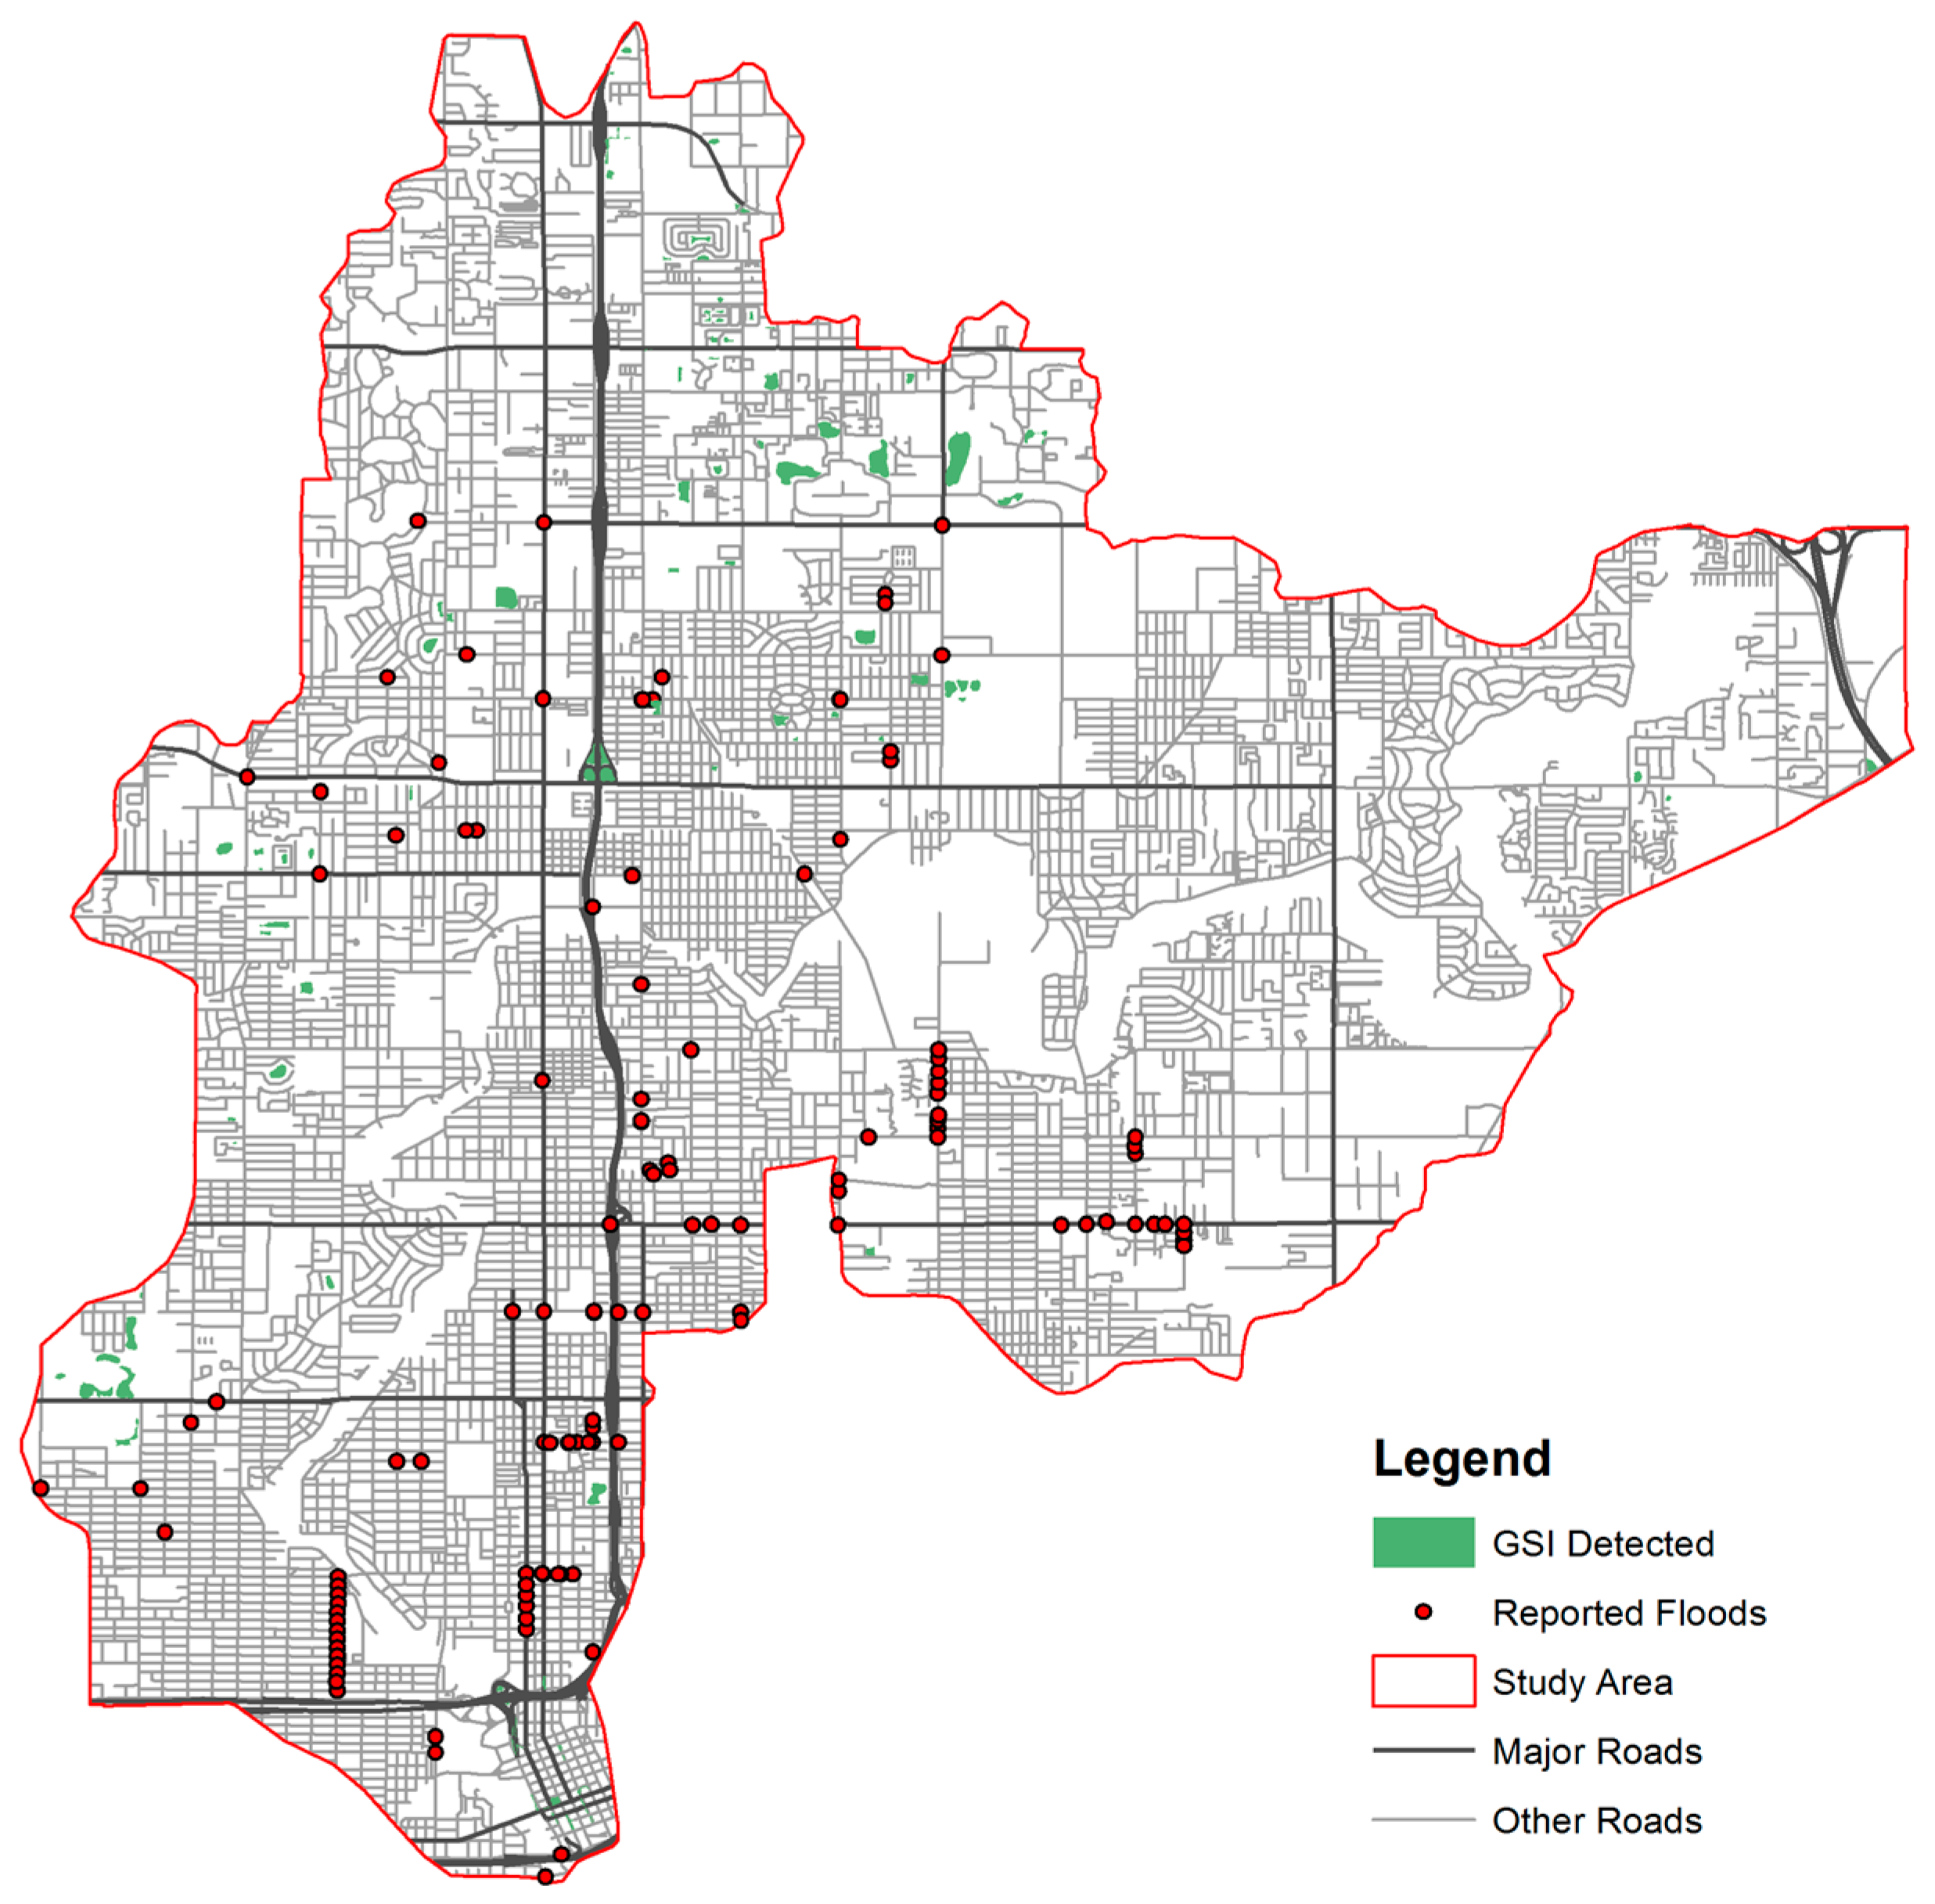
4.1. Study Area

To define the study area for applying the framework to create the GSI inventory, some requirements were taken into consideration:
  • A region in the scale of watershed or subwatershed;
  • A region under flood risk;
  • An area consisting of diverse land uses.
The paper used the Watershed Boundary Dataset from USGS that defines the national hydrological boundary at six different geographical levels from regions to sub-watersheds [50]. To meet the requirements, the Middle Hillsborough River-Spillway 20 subwatershed area (HUC12 code: 031002050503) was selected for this study (see Figure 4). It covers an area of 125 km2, approximately 30% area of the City of Tampa. Figure 4 also shows the reported street flooding provided by City of Tampa Transportation and Stormwater Services recording the flooding locations during 2015 to 2017. According to the reported street flooding in the last three years, about half of the study area has suffered from the flooding incidents and better stormwater management is needed in the area. Adjacent to downtown Tampa, most of the study area is for urban use, including business, commercial, residential, recreational and some other community mixed uses. The inventory of GSI was created for this study area as a representative of the City of Tampa and the Hillsborough County.

4.2. Results and Discussion

Using the developed method, a total of 89 GSI were mapped within the study area (see Figure 5). The urban area in Tampa expanded from south to north, indicating the communities in the north were newly built. In line with the characteristics of city development, most of the GSI as new practices of stormwater management were detected in the north of the study area. A limited number of the GSI were implemented along the major roads. This indicates that the gray infrastructure is used as the main stormwater facilities in the major road system in Tampa. For the business districts at the southern corner of the study area, the GSI were rarely detected because gray stormwater features have been preferentially implemented in the downtown and its surrounding areas. For the street flooding, most reported incidents happened in the area with few GSI; less street flooding occurred in the north of the study area where more GSI were implemented. There are many factors that can contribute to the fewer flooding reports in the north area, including the characteristics of the drainage system, the interest of people in reporting issues, as well as the GSI’s function of infiltration and storage of stormwater [51].
All the GSI detected were identified with their types (see Table 5). Most of the GSI are wet ponds with a relatively larger surface area (43,000–176,000 ft2 in this case). The GSI with ground vegetation, such as bioretention systems, rain gardens, or vegetated filter strips, were implemented to a very limited extent. Specifically, large-size GSI like dry or wet ponds were easier to be selected by the transportation agency for the stormwater management at the transportation connections, e.g., freeway ramps, or junctions of two major roads. Those regions have a relatively large pervious area without surface cement and asphalt, requiring some GSI type of corresponding surface size. In addition, dry or wet ponds are competitive in costs due to their simpler structure than GSI types with ground vegetation like bioretention systems [30]. On the other hand, small-size GSI like bioretention systems and vegetated filter strips were more often constructed along community roads or near community public areas. This is because bioretention systems, rain gardens, and vegetated filter strips usually have multi-layer designs, performing better in stormwater quality control with the functions of plant uptake, soil adsorption and filtration, and biological treatment. These GSI can benefit the community with better contaminant removal, as well as improving site aesthetics, reducing noise, and providing shade and wind cover [52]. However, their implementation was limited due to the complexity of multi-layer design, relatively small size, and the requirement of active community engagement [53].

5. Conclusions

According to the previous studies, GSI as an alternative stormwater management strategy could provide significant benefits such as energy saving and environmental impact reduction, especially when implemented on a large scale (e.g., watersheds) [6,54]. However, to implement GSI on a large scale, an accurate inventory of existing GSI is important for strategic planning for future GSI implementation. Compared with the traditional survey-based method, this study developed an efficient alternative method to map the GSI footprints and identify their types. The newly developed framework was tested with an acceptable accuracy as the traditional survey-based method in the case of Philadelphia. The novelty of the proposed framework lies not in the individual steps but the combination of all steps that can save time and labor to create a relatively accurate GSI inventory. The framework is transferable and can be applied to other locations besides the study area in this research. It can help cities create their own GSI inventory and facilitate the development of GSI relevant to surface transportation planning.
Within the study area in Tampa, the GSI was implemented to a very limited extent for urban transportation stormwater management. Among the GSI mapped, most of them are those with large surface areas (e.g., wet or dry ponds), commonly occurring in the transportation connections. The GSI inventory created for the study area is an example of demonstrating the usefulness of the proposed framework for analyzing the status of GSI implementation and identifying gaps for future planning in terms of potential locations and underrepresented GSI types (e.g., bioretention in this study).

Author Contributions

Conceptualization, Q.Z., Q.L. and X.X.; Methodology, X.X. and Q.Z.; Validation, X.X. and D.S.P.S.; Formal Analysis, X.X., D.S.P.S. and Q.Z.; Investigation, X.X. and D.S.P.S.; Writing—Original Draft Preparation, X.X. and D.S.P.S.; Writing—Review & Editing, Q.Z. and Q.L.; Supervision, Q.Z.; Funding Acquisition, Q.L. and Q.Z.

Funding

This research was funded partially by the U.S. Environmental Protection Agency Grant No. 83556901, and partially by the U.S. Department of Transportation Grant No. 69A3551747119.

Acknowledgments

The contents of this paper reflect the views of the authors, who are responsible for the facts and the accuracy of the information presented herein. This document is disseminated in the interest of information exchange. The study is funded, partially by the Center for Reinventing Aging Infrastructure for Nutrient Management (RAINmgt), supported by US EPA grant 83556901, and partially by the grant from the U.S. Department of Transportation’s University Transportation Centers Program under the Agreement ID: 69A3551747119. However, the U.S. Government assumes no liability for the contents or use thereof.

Conflicts of Interest

The authors declare no conflict of interest.

References

  1. Forman, R.T.; Alexander, L.E. Roads and their major ecological effects. Annu. Rev. Ecol. Syst. 1998, 29, 207–231. [Google Scholar] [CrossRef]
  2. Line, D.E.; White, N.M. Effects of development on runoff and pollutant export. Water Environ. Res. 2007, 79, 185–190. [Google Scholar] [CrossRef] [PubMed]
  3. Wendel, H.E.W.; Downs, J.A.; Mihelcic, J.R. Assessing equitable access to urban green space: The role of engineered water infrastructure. Environ. Sci. Technol. 2011, 45, 6728–6734. [Google Scholar] [CrossRef] [PubMed]
  4. Bowen, K.J.; Lynch, Y. The public health benefits of green infrastructure: The potential of economic framing for enhanced decision-making. Curr. Opin. Environ. Sustain. 2017, 25, 90–95. [Google Scholar] [CrossRef]
  5. Demuzere, M.; Orru, K.; Heidrich, O.; Olazabal, E.; Geneletti, D.; Orru, H.; Bhave, A.; Mittal, N.; Feliu, E.; Faehnle, M. Mitigating and adapting to climate change: Multi-functional and multi-scale assessment of green urban infrastructure. J. Environ. Manag. 2014, 146, 107–115. [Google Scholar] [CrossRef] [PubMed]
  6. Suppakittpaisarn, P.; Jiang, X.; Sullivan, W.C. Green Infrastructure, green stormwater infrastructure, and human health: A review. Curr. Landsc. Ecol. Rep. 2017, 2, 96–110. [Google Scholar] [CrossRef]
  7. Belizario, P.; Scalize, P.; Albuquerque, A. Heavy metal removal in a detention basin for road runoff. Open Eng. 2016, 6, 412–417. [Google Scholar] [CrossRef]
  8. Lucas, S.; Clar, M.; Gracie, J.A. Green street retrofit in a Chesapeake Bay community using bioswales. In Proceedings of the 2011 Low Impact Development Conference, Philadelphia, PA, USA, 25–28 September 2011. [Google Scholar] [CrossRef]
  9. Lucke, T.; Nichols, P.W. The pollution removal and stormwater reduction performance of street-side bioretention basins after ten years in operation. Sci. Total Environ. 2015, 536, 784–792. [Google Scholar] [CrossRef]
  10. Li, J.; Liang, Z.; Gao, Z.; Li, Y. Experiment and simulation of the purification effects of multi-level series constructed wetlands on urban surface runoff. Ecol. Eng. 2016, 91, 74–84. [Google Scholar] [CrossRef]
  11. Pennino, M.J.; McDonald, R.I.; Jaffe, P.R. Watershed-scale impacts of stormwater green infrastructure on hydrology, nutrient fluxes, and combined sewer overflows in the mid-Atlantic region. Sci. Total Environ. 2016, 565, 1044–1053. [Google Scholar] [CrossRef]
  12. Roy, A.H.; Wenger, S.J.; Fletcher, T.D.; Walsh, C.J.; Ladson, A.R.; Shuster, W.D.; Thurston, H.W.; Brown, R.R. Impediments and solutions to sustainable, watershed-scale urban stormwater management: Lessons from Australia and the United States. J. Environ. Manag. 2008, 42, 344–359. [Google Scholar] [CrossRef] [PubMed]
  13. Rowe, A.; Rector, P.; Bakacs, M. Survey results of green infrastructure implementation in New Jersey. J. Sustain. Water Built. Environ. 2016, 2, 04016001. [Google Scholar] [CrossRef]
  14. Georgetown Climate Center. Green Infrastructure Toolkit. Available online: https://www.georgetownclimate.org/adaptation/toolkits/green-infrastructure-toolkit/introduction.html?full (accessed on 13 November 2018).
  15. US EPA. How Do You Select Good Sites for Green Infrastructure? Available online: https://www.epa.gov/sites/production/files/2015-11/documents/how_to_determine_best_opportunites_for_green_infrastructure.pdf (accessed on 15 August 2017).
  16. US EPA. Green Infrastructure Opportunities and Barriers in the Greater Los Angeles Region (EPA 833-R-13-001); US Environmental Protection Agency: Los Angeles, CA, USA, 2013.
  17. US EPA. Coastal Stormwater Management Through Green Infrastructure a Handbook for Municipalities (EPA 842-R-14-004); US Environmental Protection Agency: Washington, DC, USA, 2014.
  18. Huron River Watershed Council. Guide to Green Infrastructure Opportunity Maps for Washtenaw County. Available online: https://www.hrwc.org/wp-content/uploads/2014/03/Guide-to-GI-Opportunities-v2.pdf (accessed on 15 August 2017).
  19. Cleland, B.; Karll, K. Identify your green infrastructure priorities. In Proceedings of the Great Lakes and St. Lawrence Green Infrastructure Conference, Detroit, MI, USA, 31 May–2 June 2017. [Google Scholar]
  20. Meerow, S.; Newell, J.P. Spatial planning for multifunctional green infrastructure: Growing resilience in Detroit. Landsc. Urban Plan. 2017, 159, 62–75. [Google Scholar] [CrossRef]
  21. Dennis, M.; Barlow, D.; Cavan, G.; Cook, P.A.; Gilchrist, A.; Handley, J.; James, P.; Thompson, J.; Tzoulas, K.; Wheater, C.P. Mapping urban green infrastructure: A novel landscape-based approach to incorporating land use and land cover in the mapping of human-dominated systems. Land 2018, 7, 17. [Google Scholar] [CrossRef]
  22. Labib, S.M.; Harris, A. The potentials of Sentinel-2 and LandSat-8 data in green infrastructure extraction, using object based image analysis (OBIA) method. Eur. J. Remote Sens. 2018, 51, 231–240. [Google Scholar] [CrossRef]
  23. Liquete, C.; Kleeschulte, S.; Dige, G.; Maes, J.; Grizzetti, B.; Olah, B.; Zulian, G. Mapping green infrastructure based on ecosystem services and ecological networks: A Pan-European case study. Environ. Sci. Policy 2015, 54, 268–280. [Google Scholar] [CrossRef] [Green Version]
  24. Wang, J.X.; Banzhaf, E. Derive an understanding of Green Infrastructure for the quality of life in cities by means of integrated RS mapping tools. In Proceedings of the 2017 Joint Urban Remote Sensing Event (JURSE), Dubai, UAE, 6–8 March 2017. [Google Scholar] [CrossRef]
  25. Hale, R.L.; Turnbull, L.; Earl, S.R.; Childers, D.L.; Grimm, N.B. Stormwater infrastructure controls runoff and dissolved material export from arid urban watersheds. Ecosystems 2015, 18, 62–75. [Google Scholar] [CrossRef]
  26. City of Philadelphia. Green Stormwater Infrastructure—SMP Footprints. Available online: http://metadata.phila.gov/#home/datasetdetails/5543864320583086178c4e6f/representationdetails/56eaddf28597748205e975da/ (accessed on 16 August 2017).
  27. Philadelphia Water Department. Green Stormwater Infrastructure (GSI) Planning Guidelines. Available online: http://phillywatersheds.org/doc/GSI/150305_PWDGSI_Planning_Guidelines_Version1.0.pdf (accessed on 15 March 2018).
  28. Tu, M.-C.; Traver, R. Clogging impacts on distribution pipe delivery of street runoff to an infiltration bed. Water 2018, 10, 1045. [Google Scholar] [CrossRef]
  29. US EPA. What Is Green Infrastructure? Available online: https://www.epa.gov/green-infrastructure/what-green-infrastructure (accessed on 15 March 2018).
  30. WERF. User’s Guide to the BMP and LID Whole Life Cost Models Version 2.0 (Report SW2R08); Water Environment & Reuse Foundation: Alexandria, VA, USA, 2009. [Google Scholar]
  31. McPhillips, L.E.; Matsler, A.M. Temporal evolution of green stormwater infrastructure strategies in three US cities. Front. Built Environ. 2018, 4, 26. [Google Scholar] [CrossRef]
  32. City of Tampa. City of Tampa GeoHub. Available online: http://city-tampa.opendata.arcgis.com/ (accessed on 20 August 2017).
  33. USF Water Institute. Tampa Tree Canopy and Land Cover. Available online: http://waterinstitute.maps.arcgis.com/apps/Viewer/index.html?appid=7fa10b957c4d4ee6a4a5bb91f9316118 (accessed on 20 August 2017).
  34. U.S. Geological Survey. The National Map—TNM Download. Available online: https://viewer.nationalmap.gov/basic/ (accessed on 30 August 2017).
  35. Florida DOT. Manual of Uniform Minimum Standards for Design, Construction and Maintenance for Streets and Highways (Topic# 625-000-015); Florida Department of Transportation: Tallahassee, FL, USA, 2016.
  36. Pitt, S.; Pitt, R.; Field, R.; Tafuri, A.N.; Khalid, A.; Reddy, F.; O’Bannon, D. Use of green infrastructure integrated with conventional gray infrastructure for combined sewer overflow control: Kansas City, MO. In Proceedings of the Water Environment Federation, WEFTEC 2011, Los Angeles, CA, USA, 16–19 October 2011. [Google Scholar]
  37. US EPA. Green Infrastructure Permitting and Enforcement Series Fact Sheet 3: Sanitary Sewer Overflows (EPA 832F12014); US Environmental Protection Agency: Washington, DC, USA, 2012.
  38. NSCTO. Urban Street Design Guide—Lane Width. Available online: https://nacto.org/publication/urban-street-design-guide/street-design-elements/lane-width/ (accessed on 10 August 2017).
  39. Florida DOT. Roadway Design Bulletin 14-17: Urban Arterial Lane Width and Bicycle Lane Options; Florida Department of Transportation: Tallahassee, FL, USA, 2014.
  40. Florida DOT. Driveway Information Guide; Florida Department of Transportation: Tallahassee, FL, USA, 2008.
  41. Purvis, R.A.; Winston, R.J.; Hunt, W.F.; Lipscomb, B.; Narayanaswamy, K.; McDaniel, A.; Lauffer, M.S.; Libes, S. Evaluating the Water Quality Benefits of a Bioswale in Brunswick County, North Carolina (NC), USA. Water 2018, 10, 134. [Google Scholar] [CrossRef]
  42. Vestergren, S. Infiltration Trenches in Scania: A Study of the Hydraulics and the Pollutant Removal Effect. Master Thesis, Lund University, Lund, Sweden, 2010. [Google Scholar]
  43. Bicudo, J.; Stone, R.P.; Pastrik, E.; Patterson, J.; Hazlewood, P.P.; Mlynarz, D. Vegetated Filter Strip Design—Overview and Case Study. In Proceedings of the 2006 ASAE Annual Meeting, St. Joseph, MI, USA, 9–12 July 2006. [Google Scholar] [CrossRef]
  44. Minnesota Pollution Control Agency. Minnesota Stormwater Manual—Vegetated Filter Strips. Available online: https://stormwater.pca.state.mn.us/index.php?title=Vegetated_filter_strips (accessed on 13 September 2017).
  45. OpenDataPhilly.com. Open Data in the Philadelphia Region. Available online: https://www.opendataphilly.org/ (accessed on 30 March 2018).
  46. CityMart. Philadelphia Green Stormwater Infrastructure Program. Available online: https://www.citymart.com/philadelphia-gsi (accessed on 30 March 2018).
  47. USFWS. Accuracy Assessment. Available online: https://www.fws.gov/gisdownloads/R8/individual/Justin/RS_presentations/11%20Accuracy%20assessment.pptx (accessed on 31 March 2018).
  48. New Jersey Department of Environmental Protection. New Jersey Stormwater Best Management Practices Manual Chapter 9.1: Bioretention Systems; New Jersey Department of Envrionmental Protection: Trenton, NJ, USA, 2009.
  49. New Jersey Department of Environmental Protection. New Jersey Stormwater Management Technical Manual Chapter 6.12: Wet Ponds; New Jersey Department of Environmental Protection: Trenton, NJ, USA, 2011.
  50. U.S. Geological Survey. Watershed Boundary Dataset. Available online: https://www.usgs.gov/core-science-systems/ngp/national-hydrography/watershed-boundary-dataset?qt-science_support_page_related_con=4#qt-science_support_page_related_con (accessed on 20 August 2017).
  51. Liu, W.; Chen, W.; Peng, C. Assessing the effectiveness of green infrastructures on urban flooding reduction: A community scale study. Ecol. Model. 2014, 291, 6–14. [Google Scholar] [CrossRef] [Green Version]
  52. Tzoulas, K.; Korpela, K.; Venn, S.; Yli-Pelkonen, V.; Kaźmierczak, A.; Niemela, J.; James, P. Promoting ecosystem and human health in urban areas using Green Infrastructure: A literature review. Landsc. Urban Plan. 2007, 81, 167–178. [Google Scholar] [CrossRef] [Green Version]
  53. Allen, W.L. Environmental reviews and case studies: Advancing green infrastructure at all scales: From landscape to site. J. Environ. Pract. 2012, 14, 17–25. [Google Scholar] [CrossRef]
  54. Pochee, H.; Johnston, I. Understanding design scales for a range of potential green infrastructure benefits in a London Garden City. Build. Serv. Eng. Res. Technol. 2017, 38, 728–756. [Google Scholar] [CrossRef]
Figure 1. The process diagram to create the GSI inventory.
Sustainability 10 04710 g001
Figure 2. The decision-making flowchart to identify GSI types.
Sustainability 10 04710 g002
Figure 3. The test area of the framework.
Sustainability 10 04710 g003
Figure 4. The study area for the framework application.
Sustainability 10 04710 g004
Figure 5. GSI mapped in the study area.
Sustainability 10 04710 g005
Table 1. The green stormwater infrastructures (GSI) and their applications to surface transportation planning.
Green Stormwater InfrastructureMechanism TypeApplied to Transportation Planning? If Yes, What Is the Common Place to Use?
Rain barrels/cisternsRetention/detentionNo
Bioretention cells/rain gardensFiltration/retentionYes, local roads
Dry/wet swalesInfiltrationYes, local roads/ highways
Dry/wet pondsRetention/detentionYes, highways
Constructed wetlandsDetentionRarely
Infiltration basinInfiltrationYes, highways
Infiltration trenchesInfiltrationYes, highways
Vegetated filter stripsFiltrationYes, highways
Sand filtersFiltrationRarely
Riparian buffersFiltrationRarely
Permeable pavementsInfiltrationYes, pedestrian pavements and parking lots
Downspout disconnectionSite designNo
Urban tree canopySite designYes, local roads and pedestrian pavements
Green roofsSite designNo
Land conservationSite designNo
Table 2. Data collected and the sources for creating GSI inventory.
DataProduced YearSource
Road centerline2017City of Tampa GeoHub [32]
Stormwater inlets2017
Stormwater discharge points2017
Stormwater open drains2017
Tampa land cover2011USF Water Institute [33]
Digital Elevation Models2007, 2010U.S. Geological Survey [34]
Table 3. Accuracy assessment of the City of Philadelphia’s GSI inventory.
GSI TypeCountPercentAccuracy Assessment
Producer’sUser’s
Basin4231%89%91%
Swale6447%86%89%
Bioretention cell/rain garden2116%75%82%
Wetland64%100%100%
Tree Trench21%100%100%
Total135 87%
Table 4. Accuracy assessment of the GSI inventory created in this project.
GSI TypeCountPercentAccuracy Assessment
Producer’sUser’s
Basin4635%86%89%
Swale6046%88%92%
Bioretention cell/rain garden2418%78%85%
Total130 86%
Table 5. Different types of GSI identified.
TypeCountAverage Surface Area (1000 ft2)
Dry pond593.0
Bioretention cell/rain garden31.7
Vegetated filter strip415.4
Wet pond7791.8

