Dynamic Comprehensive Benefit Evaluation of the Transnational Power Grid Interconnection Project Based on Combination Weighting and TOPSIS Grey Projection Method

Abstract
:1. Introduction
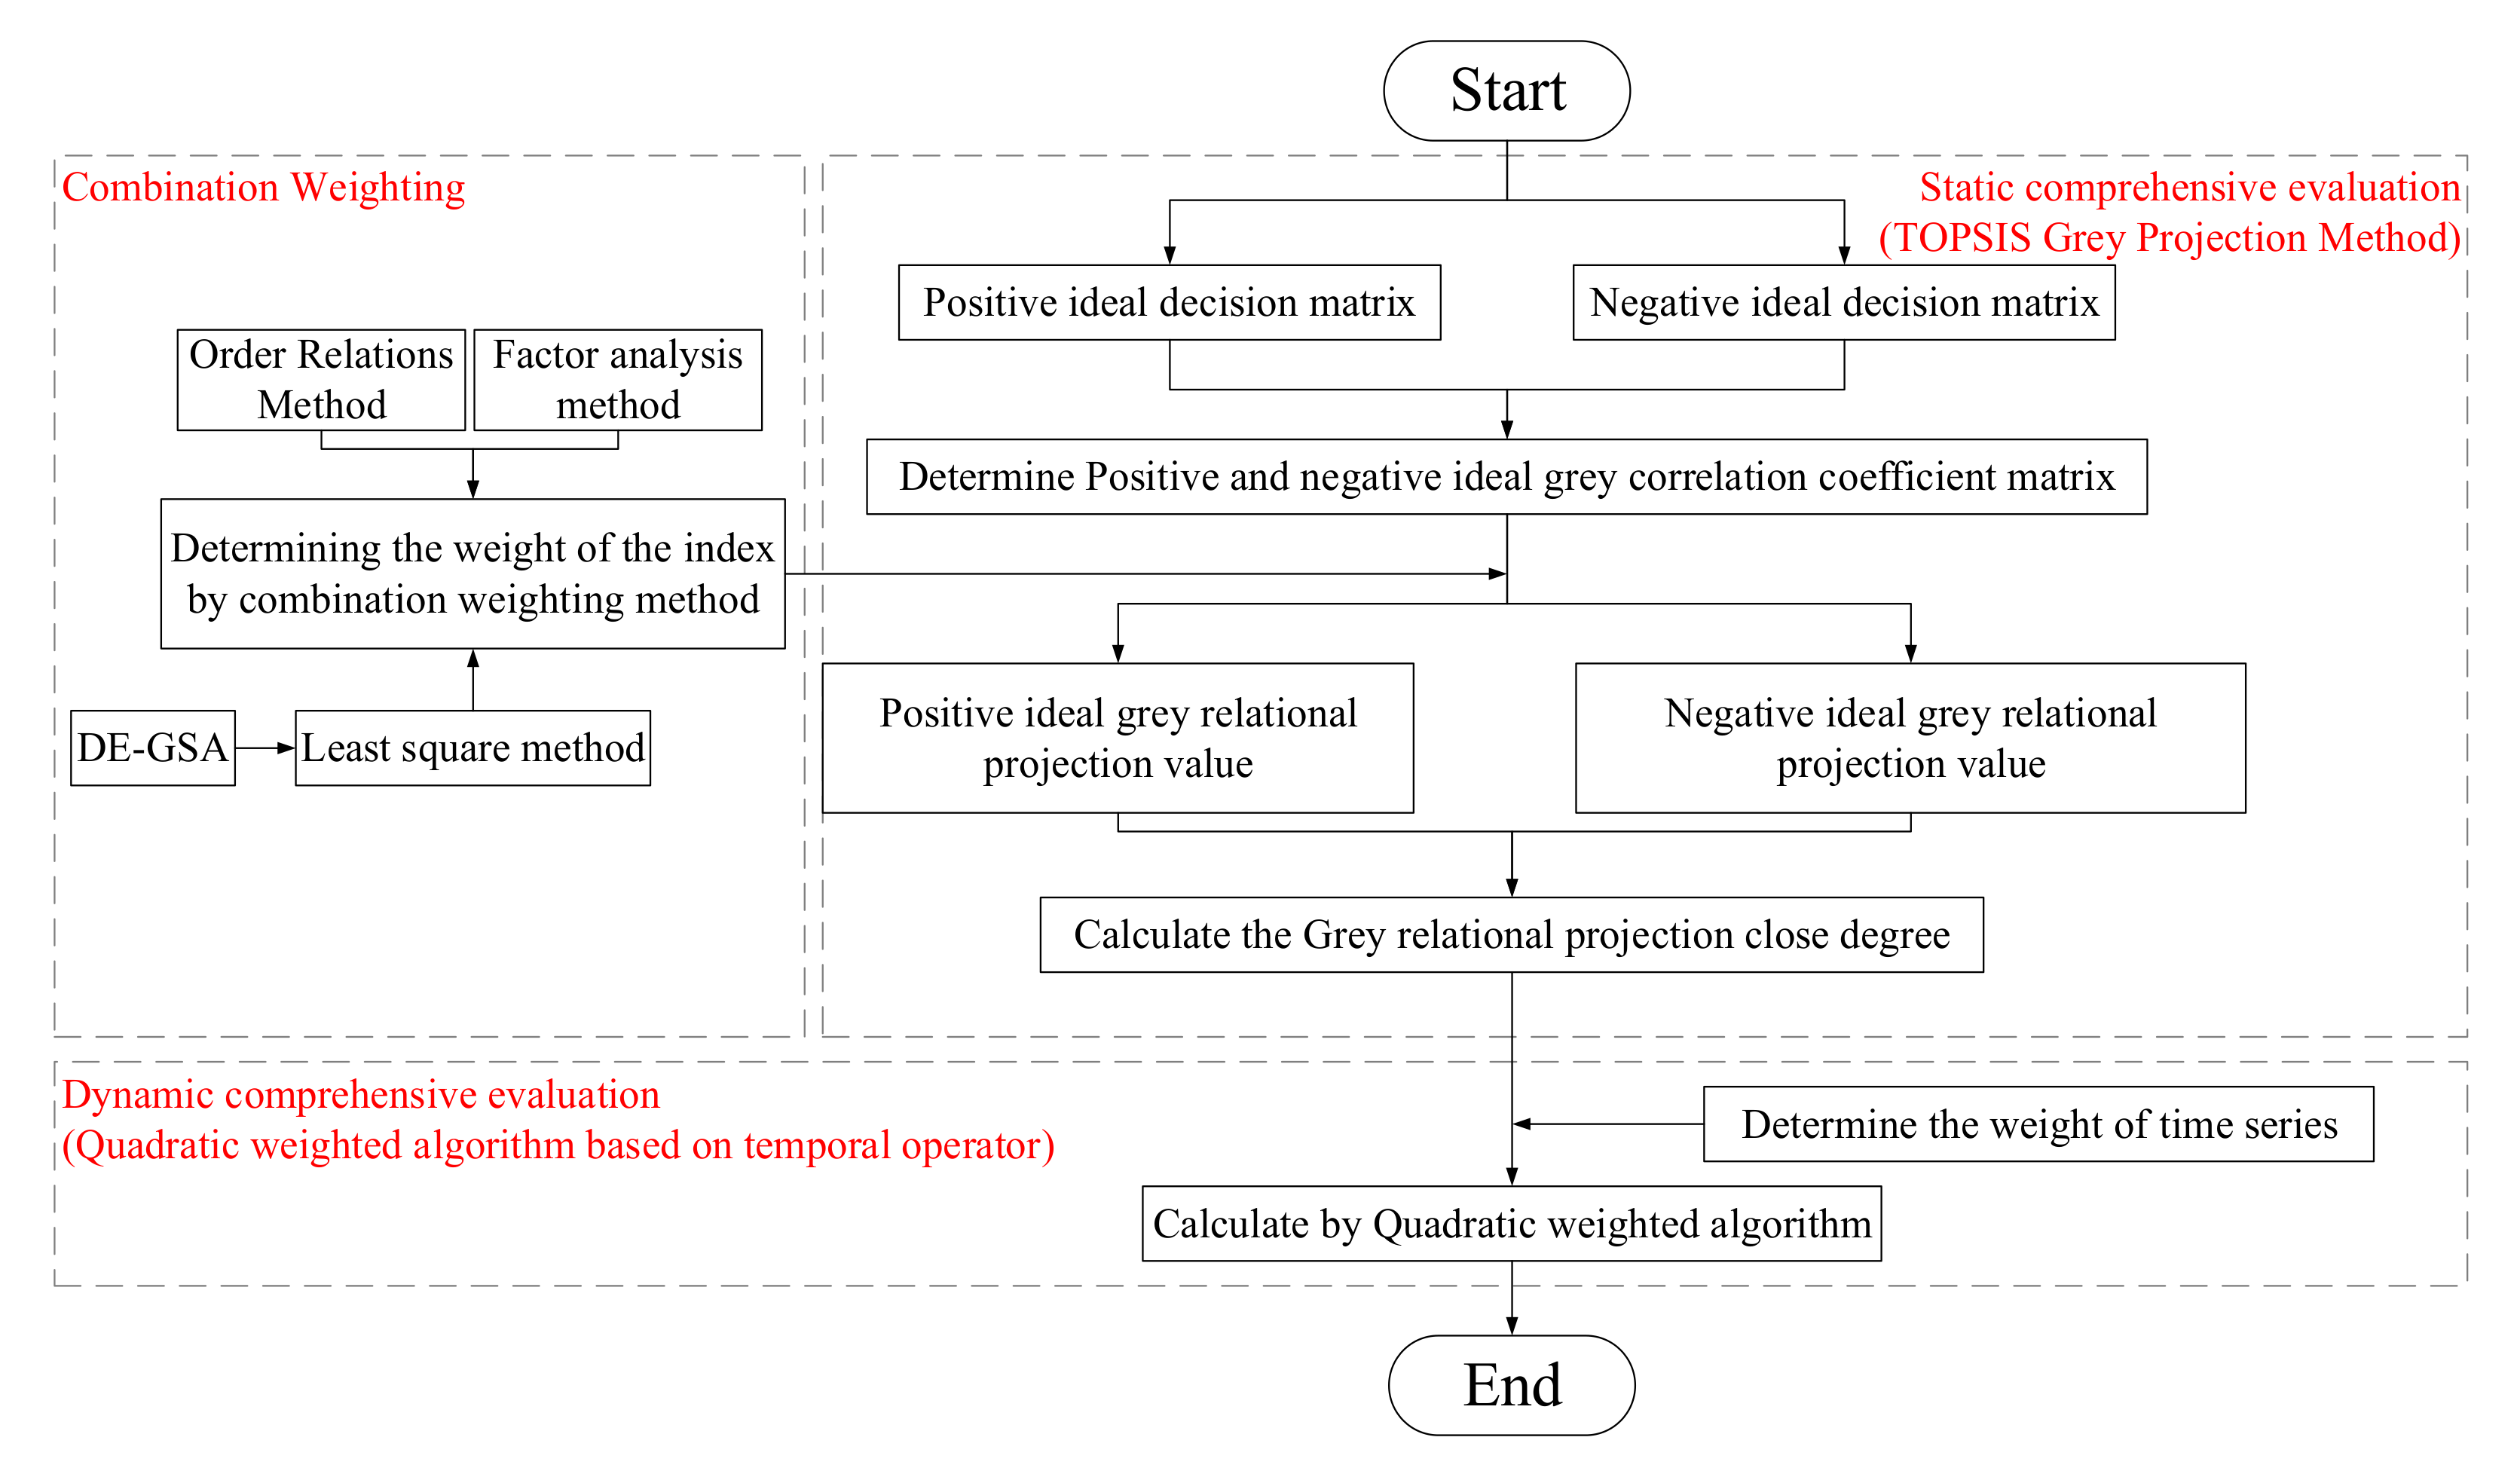
2. Methods
2.1. Combination Weighting Method
2.1.1. Order Relations Method
2.1.2. Factor Analysis Method
2.1.3. Least Squares Method
2.2. TOPSIS Grey Projection Method
2.3. Quadratic Weighted Algorithm Based on Temporal Operator
3. Comprehensive Benefit Evaluation Index System of Transnational Power Grid Interconnection Project
3.1. Comprehensive Benefit Evaluation Index System
3.2. Analysis of the Benefit Evaluation Index
3.2.1. Economic Benefit
3.2.2. Social Benefit
3.2.3. Environmental Benefit
3.2.4. Technical Benefit
4. Case Study
4.1. Case Background and Data Sources
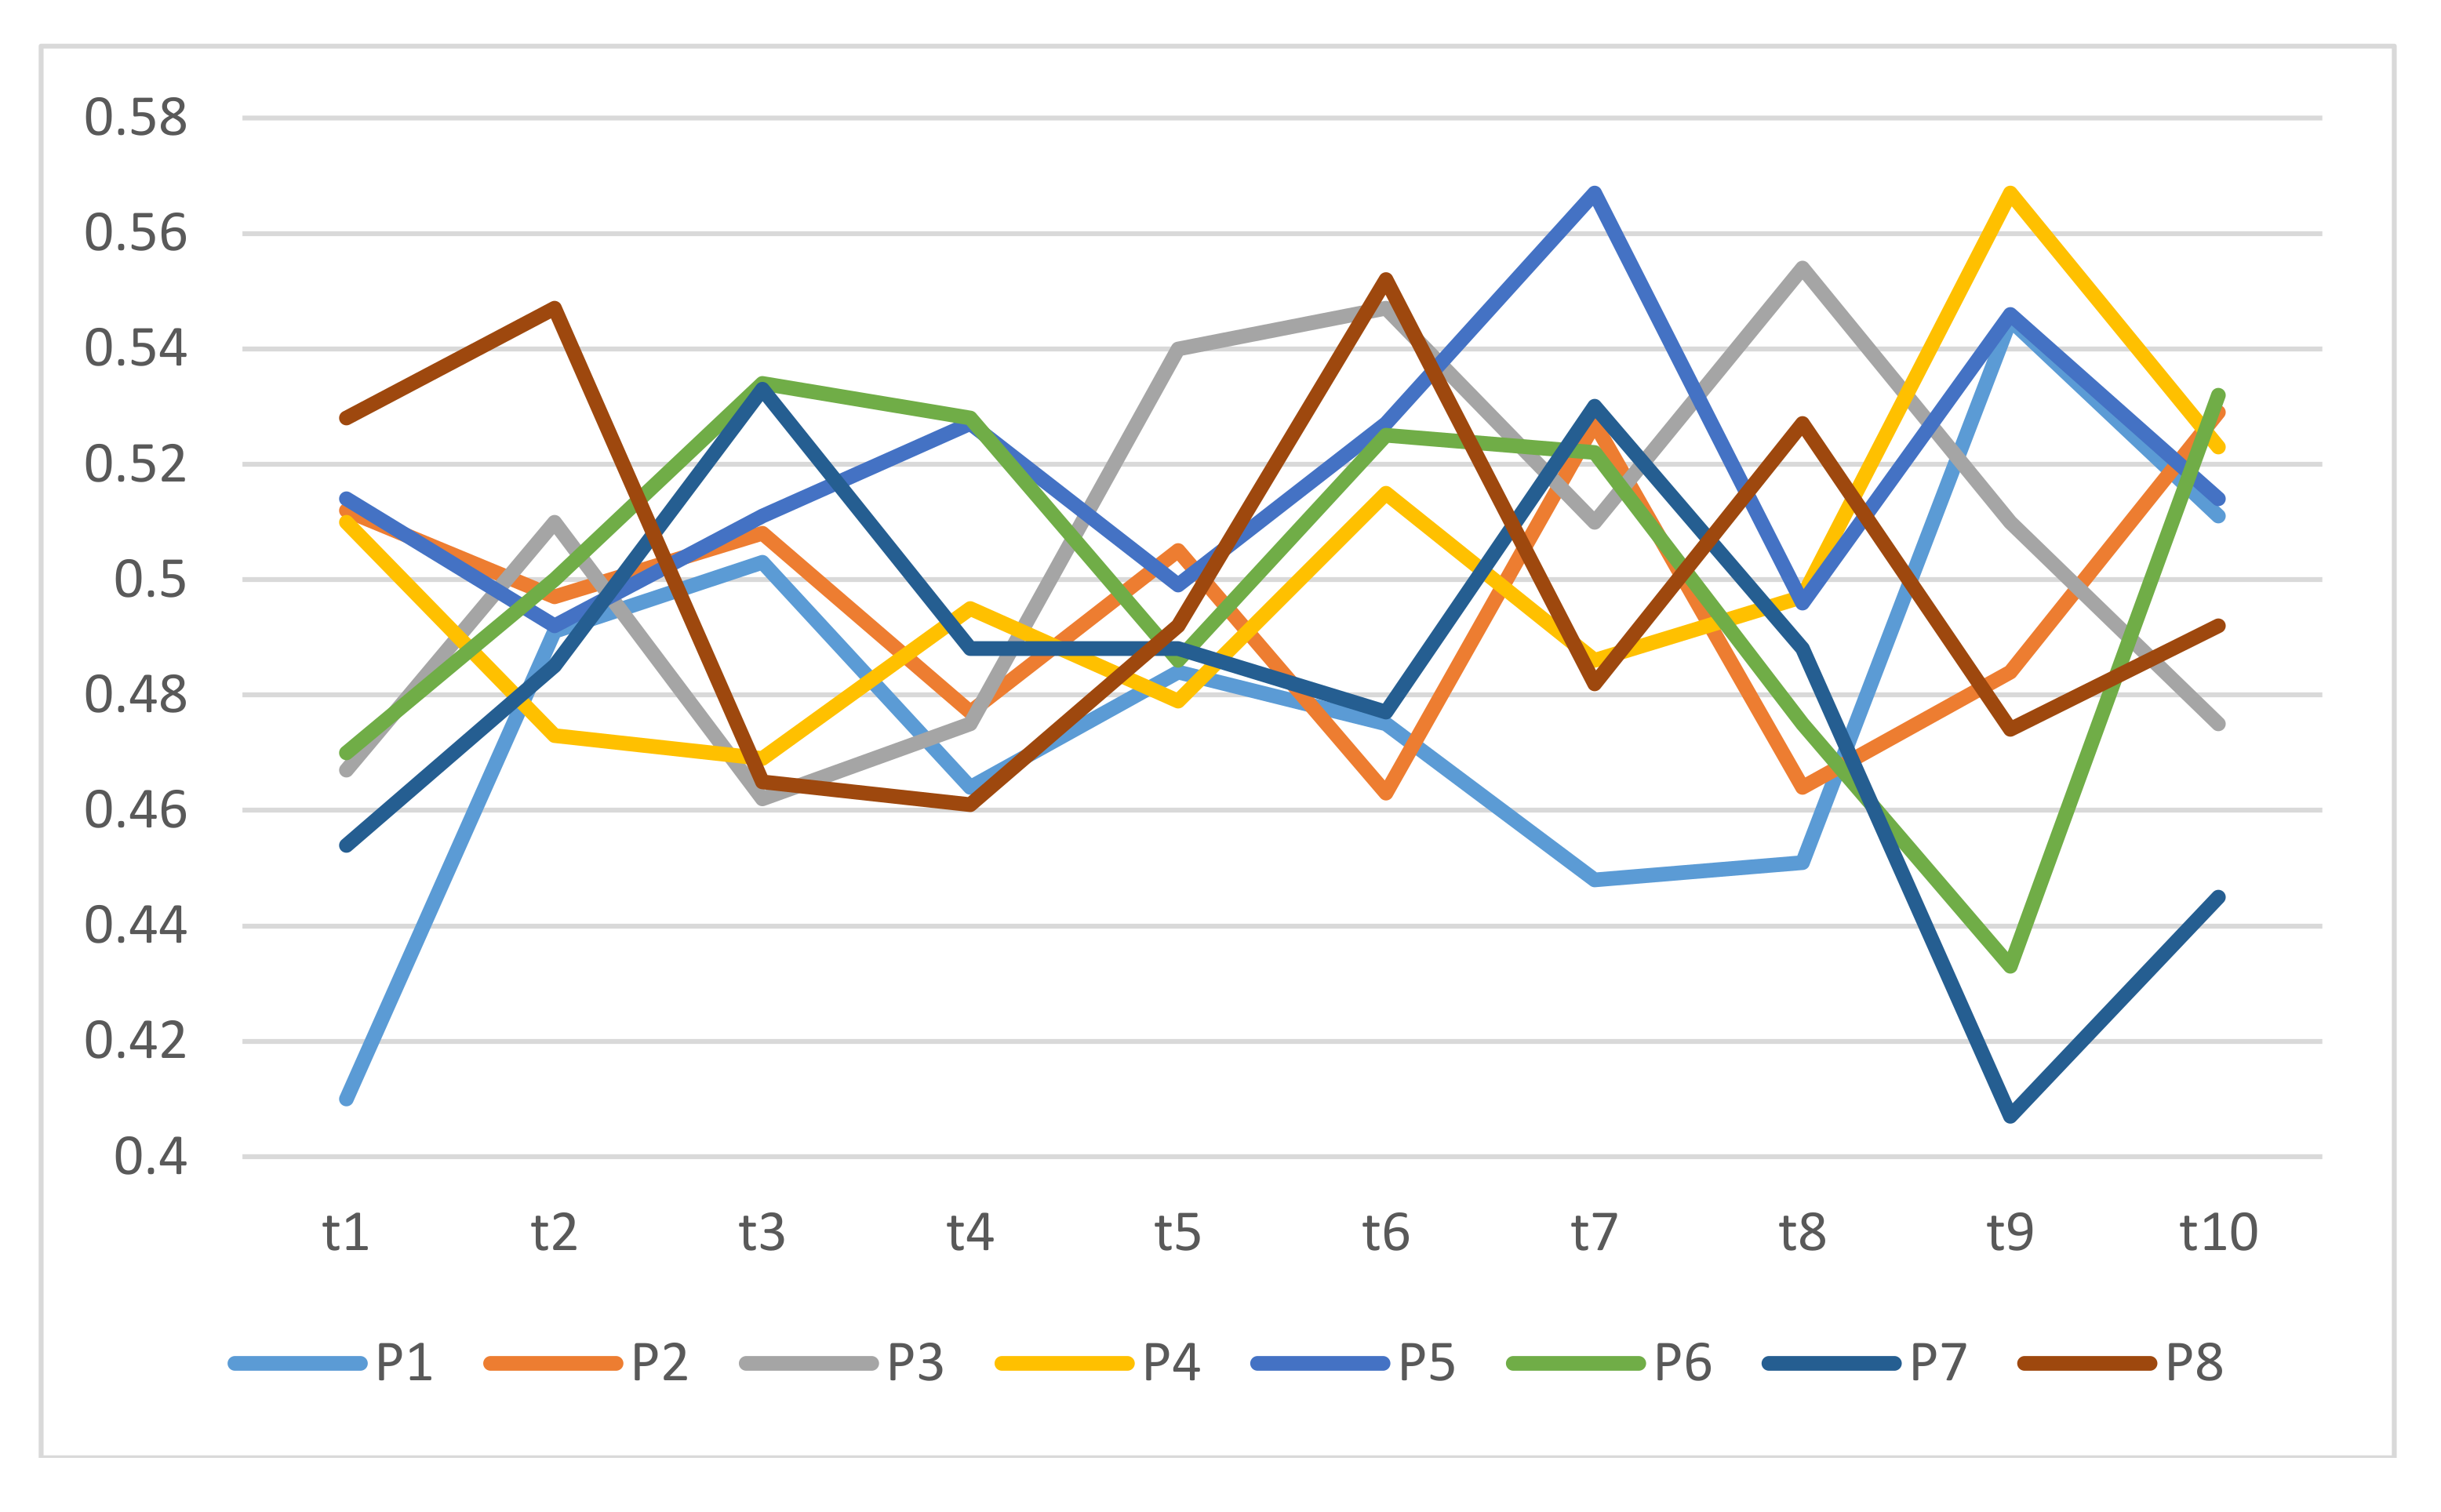
4.2. Static Comprehensive Evaluation Results
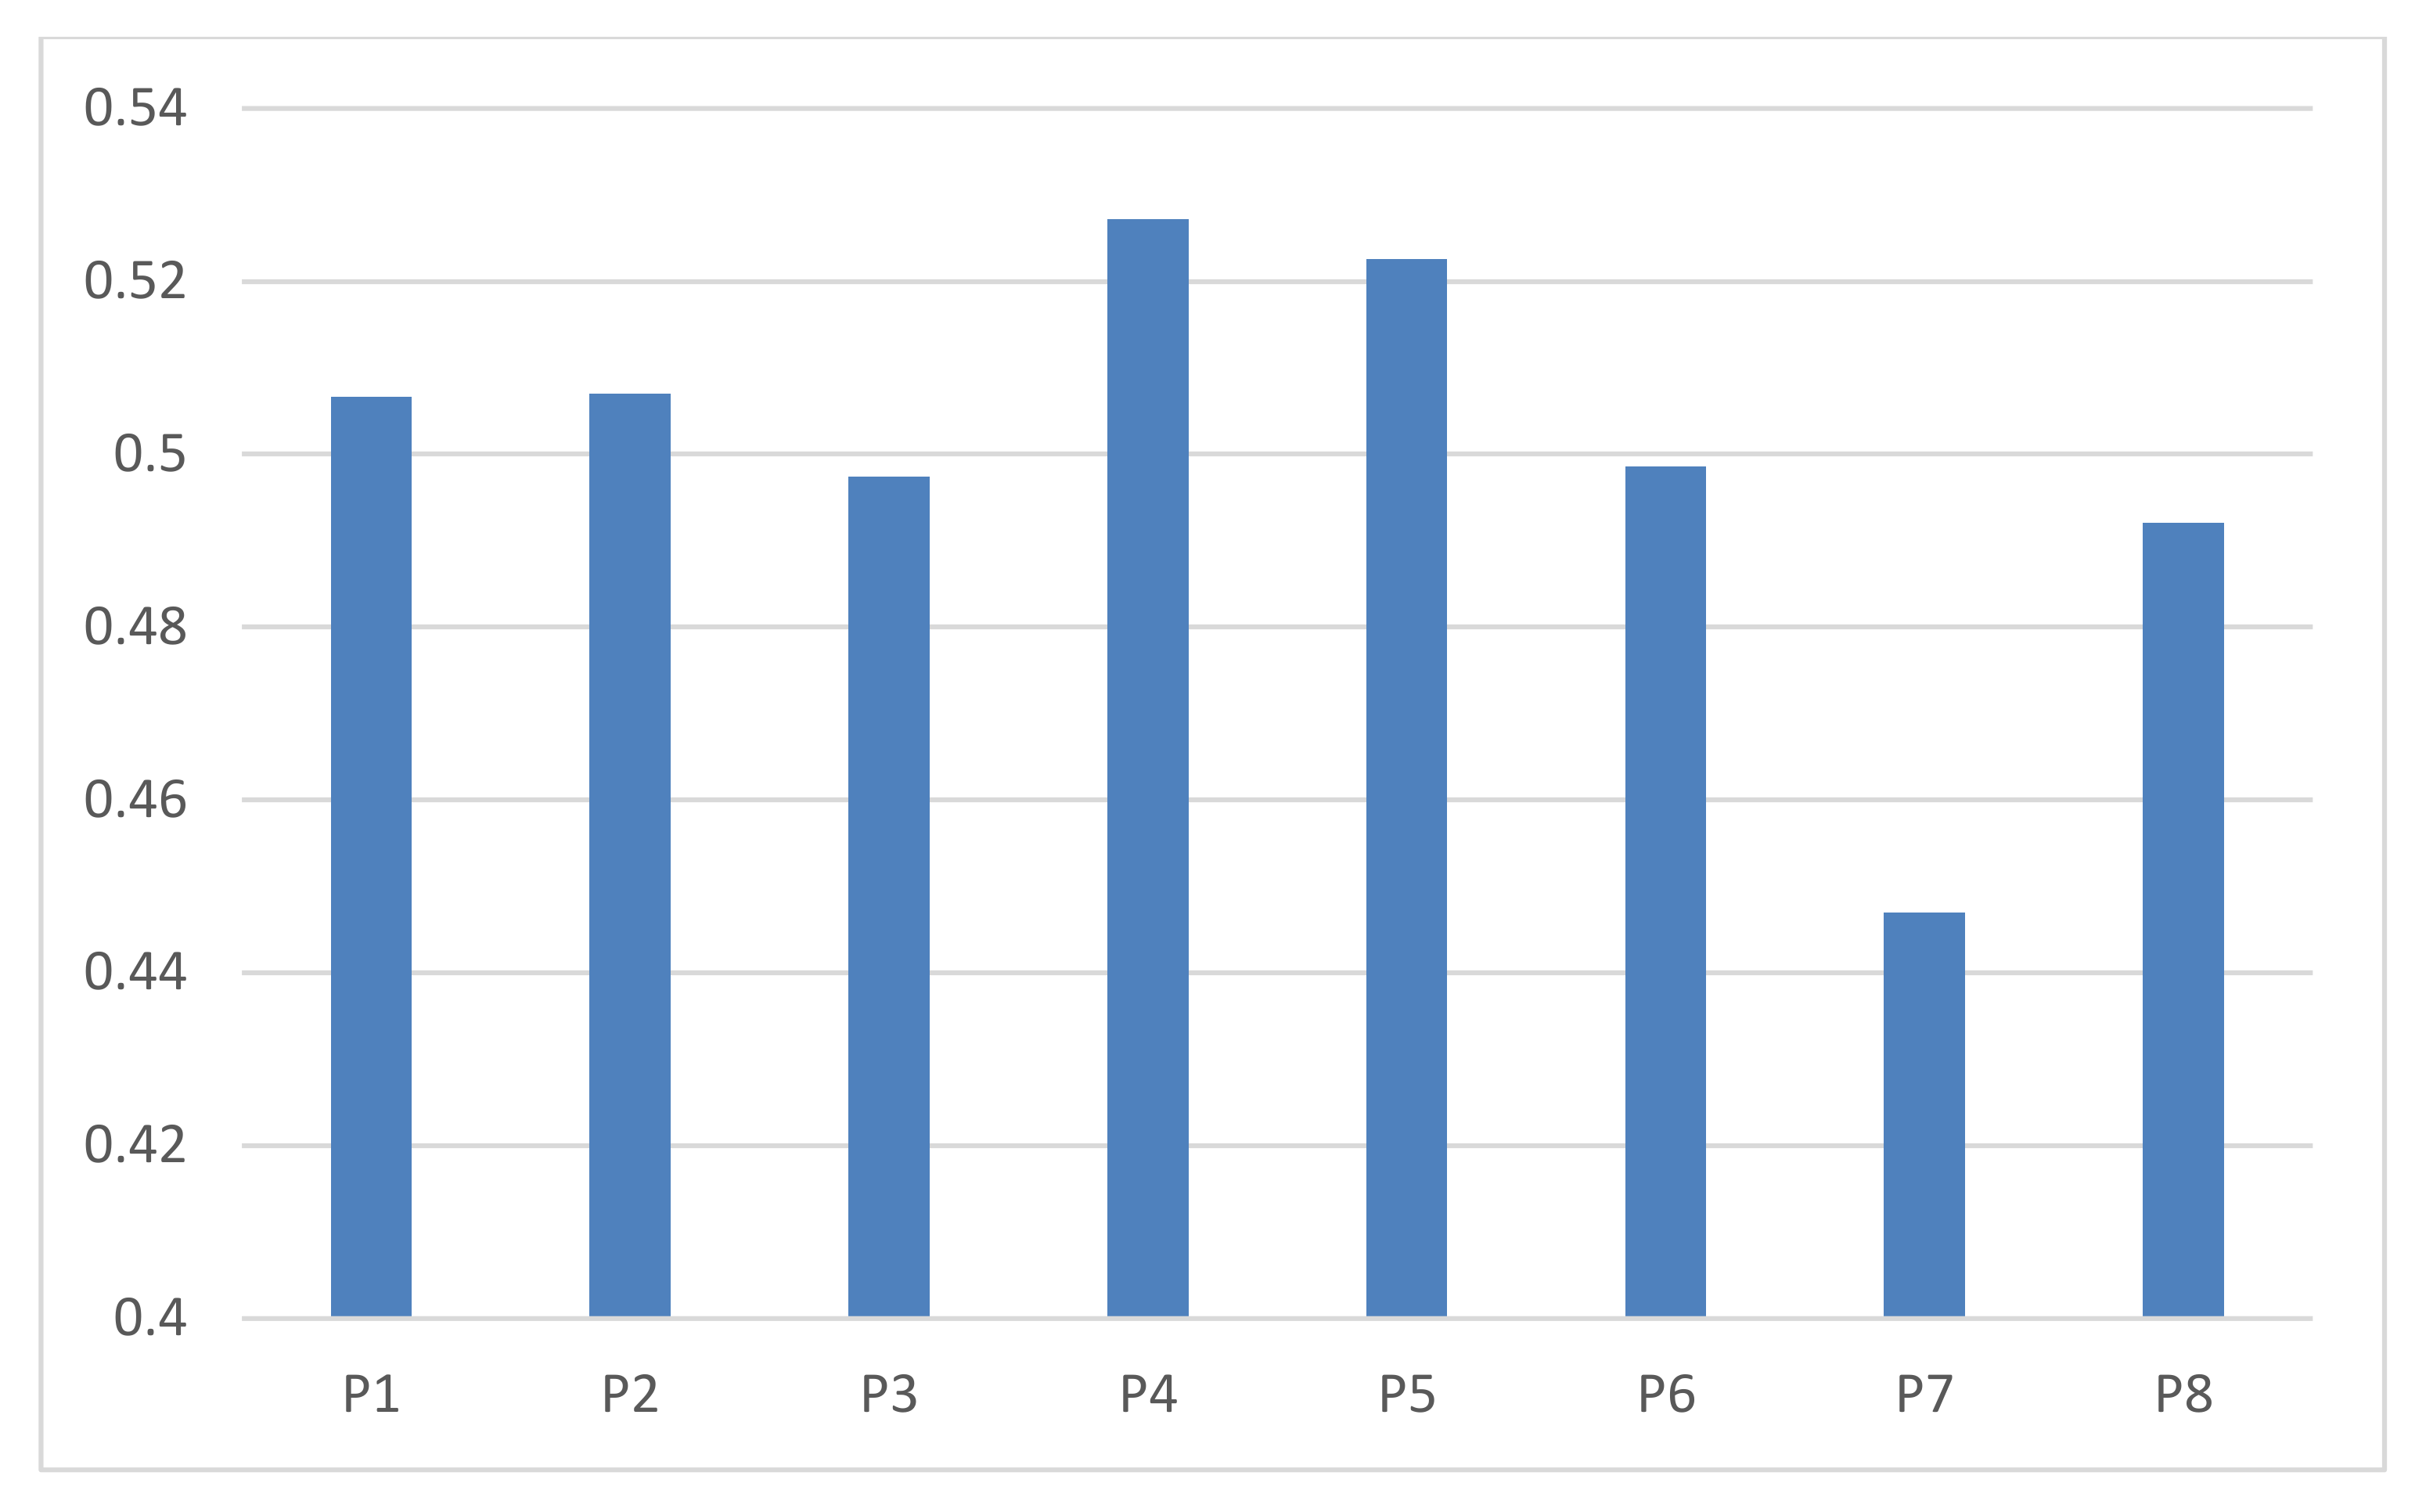
4.3. Dynamic Comprehensive Evaluation Results
4.4. Result Analysis
5. Conclusions
Author Contributions
Funding
Conflicts of Interest
References
- Wan, J.; Lai, M.; Zhang, W. Study on post-evaluation method of economic benefits for power grid construction project. Hubei Electr. Power 2016, 40, 58–62. [Google Scholar]
- Bie, P.; Zhang, B.; Deng, W.; Luo, Y.; Zhao, S.; Li, M. Economic benefits evaluating of wind power integration considering transmission congestion. In Proceedings of the IEEE Power Systems Conference, Clemson, SC, USA, 28 September–1 October 2016; pp. 1–6. [Google Scholar]
- Xue, M.; Mao, Y. Comprehensive evaluation of social benefit of power grid construction project based on Analytic Hierarchy Process. SME Manag. Technol. 2013, 15, 313. [Google Scholar]
- Liu, H.; Jicong, Y.U.; Lei, L.; Liu, G. Comprehensive evaluation of social benefits of mineral resources development in ordos basin. Stud. Sociol. Sci. 2013, 4, 25–29. [Google Scholar]
- Song, Q.; Wang, H.; Wen, F.; Ledwich, G.; Xue, Y. Pressure state response-based method for evaluating social benefits from smart grid development. J. Energy Eng. 2015, 141, 04014020. [Google Scholar] [CrossRef]
- Tian, S.; Cheng, H.; Zeng, P.; Liu, L.; Qi, Q.; Yao, L. A novel evaluation method of societal benefits of ultra-high voltage power grid optimizing power energy allocation. J. Renew. Sustain. Energy 2015, 7, 8–11. [Google Scholar] [CrossRef]
- Zhu, F.; Zheng, Y.; Guo, X.; Wang, S. Environmental impacts and benefits of regional power grid interconnections for China. Energy Policy 2005, 33, 1797–1805. [Google Scholar] [CrossRef]
- Zheng, M.; Wang, X.; Meinrenken, C.J.; Ding, Y. Economic and environmental benefits of coordinating dispatch among distributed electricity storage. Appl. Energy 2017, 210, 842–855. [Google Scholar] [CrossRef]
- Feng, F.; Song, G.; Shen, L.; Xiao, J. Environmental benefits analysis based on life cycle assessment of rice straw-based synthetic natural gas in China. Energy 2017, 139, 341–349. [Google Scholar] [CrossRef]
- Hernández, J.C.; Bueno, P.G.; Sanchez-Sutil, F. Enhanced utility-scale photovoltaic units with frequency support functions and dynamic grid support for transmission systems. IET Renew. Power Gener. 2017, 11, 361–372. [Google Scholar] [CrossRef]
- Favuzza, S.; Ippolito, M.; Massaro, F.; Mineo, L.; Musca, R.; Zizzo, G. New energy corridors in the euro-mediterranean area: The pivotal role of sicily. Energies 2018, 11, 1415. [Google Scholar] [CrossRef]
- Hernández, J.C.; Sanchez-Sutil, F.; Vidal, P.G.; Rus-Casas, C. Primary frequency control and dynamic grid support for vehicle-to-grid in transmission systems. Int. J. Electr. Power Energy Syst. 2018, 100, 152–166. [Google Scholar] [CrossRef]
- Zhao, H.; Zhao, H.; Guo, S. Evaluating the comprehensive benefit of eco-industrial parks by employing multi-criteria decision making approach for circular economy. J. Clean. Prod. 2017, 142, 2262–2276. [Google Scholar] [CrossRef]
- Singh, A.; Basak, P. Economic and environmental evaluation of municipal solid waste management system using industrial ecology approach: Evidence from India. J. Clean. Prod. 2018, 195, 10–20. [Google Scholar] [CrossRef]
- Paula, E.C.D.; Amaral, M.C.S. Environmental and economic evaluation of end-of-life reverse osmosis membranes recycling by means of chemical conversion. J. Clean. Prod. 2018, 194, 85–93. [Google Scholar] [CrossRef]
- Zuo, Y.; Liu, H. Evaluation on comprehensive benefit of wind power generation and utilization of wind energy. In Proceedings of the ICSESS 2012—Proceedings of 2012 IEEE 3rd International Conference on Software Engineering and Service Science, Beijing, China, 22–24 June 2012; Volume 31, pp. 635–638. [Google Scholar]
- Wu, Q.; Peng, C. Comprehensive benefit evaluation of the power distribution network planning project based on improved IAHP and multi-level extension assessment method. Sustainability 2016, 8, 796. [Google Scholar] [CrossRef]
- Liu, Y.; Tao, W.; Zhou, K.; Ye, Y.; Li, J.; Xu, P. Comprehensive evaluation on secondary equipment condition based on matter-element extension model with variable weight. Power Syst. Prot. Control 2017, 45, 80–85. [Google Scholar]
- Du, Z.; Weng, H.; Liu, D.; Tang, T.; Zhao, J. Evaluation Index System and Comprehensive Evaluation Methods of the Power Grid Infrastructure Projects. In Proceedings of the International Conference on Advances in Energy, Environment and Chemical Science, Singapore, 29–31 July 2016; Volume 76, pp. 9–13. [Google Scholar]
- Zhang, X.; Chen, X.; Liu, H.; Zhao, B. Application of integrated weight method and support vector machine in the comprehensive evaluation of power quality. In Proceedings of the IEEE International Conference on Electric Utility Deregulation and Restructuring and Power Technologies, Nanjing, China, 6–9 April 2008; pp. 2181–2186. [Google Scholar]
- Ze-Hong, L.I.; Wang, Z.G.; Liu, Y. Risk assessment of power construction project contract combining fuzzy comprehensive evaluation and improvement of neural network. Sci. Technol. Ind. 2009, 9, 31–35. [Google Scholar]
- Wen, J.; Li, F.; Zeng, X.; Shen, K.; He, H.; Liang, Y. Genetic algorithm-based fuzzy comprehensive evaluation of water quality in dongzhaigang. Water 2015, 7, 4821–4847. [Google Scholar] [CrossRef]
- Ren, R.; Fu, J.; Chao, J.; Yuan, H.; Li, J. The application of BP neural network optimized by genetic algorithm in students’ comprehensive quality evaluation. Int. J. Simul. 2016, 17, 1–7. [Google Scholar]
- Zhao, K.; Ben-Wei, L.I.; Dong, L.I.; Hai-Ning, L.I. Comprehensive evaluation of aeroengine performance based on improved PSO. Aeroengine 2014, 40, 13–17. [Google Scholar]
- Zhou, G.L.; Lu, C. Study on evaluation method of carbon reduction capability in real estate development projects based on AFSA. Appl. Mech. Mater. 2014, 675–677, 1887–1892. [Google Scholar] [CrossRef]
- Wang, X.; Guo, Y.; Lan, T. Rank correlation analysis of formation of consistent judgement matrix. J. Northeast. Univ. 2006, 27, 115–118. [Google Scholar]
- Zhou, L.S.; Chen, L.I. Key indicators selection for smart grid low-carbon benefits based on structure entropy and factor analysis. East China Electr. Power 2014, 42, 150–156. [Google Scholar]
- Li, X.N.; Zhang, L.J.; Chen, H.; Xing, C.X. Comprehensive evaluation of urban sustainable innovation ability based on factor analysis method. In Proceedings of the 2017 IEEE World Congress on Services (SERVICES), Honolulu, HI, USA, 25–30 June 2017; pp. 114–121. [Google Scholar]
- Mei-Juan, L.I.; Chen, G.H.; Lin, Z.B.; Lin-Ming, X.U. Dynamic evaluation method based on TOPSIS. Chin. J. Manag. Sci. 2015, 23, 156–161. [Google Scholar]
- Fan, D.C.; Ming-Yue, D.U. Dynamic comprehensive evaluation of the high-tech industry technology innovation ability based on TOPSIS grey relation projection method—In the perspective of integration of Beijing-Tianjin-Hebei region. Oper. Res. Manag. Sci. 2017, 26, 154–163. [Google Scholar]
- Zhou, Y.; Wei, H.U.; Yong, M.; Jiang, T.; Hui, W.; Yi, K. Dynamic comprehensive evaluation method of power industry development level based on provincial data. Autom. Electr. Power Syst. 2016, 40, 76–83. [Google Scholar]
- Wang, M.X.; Zhao, H.H.; Cui, J.X.; Fan, D.; Lv, B.; Wang, G. Evaluating green development level of nine cities within the Pearl River delta, China. J. Clean. Prod. 2017, 174, 315–323. [Google Scholar] [CrossRef]
- Li, J.; Wu, F.; Li, J.; Zhao, Y. Research on risk evaluation of transnational power networking projects based on the matter-element extension theory and granular computing. Energies 2017, 10, 1523. [Google Scholar] [CrossRef]
- Zhang, Y.; Gong, Z. Hybrid differential evolution gravitation search algorithm based on threshold statistical learning. J. Comput. Res. Dev. 2014, 51, 2187–2194. [Google Scholar]


| Methods | Researcher | |
|---|---|---|
| Traditional evaluation | Triangular fuzzy function method | Zuo Y. et al. [16] |
| Analytic hierarchy process | Wu Q. et al. [17] | |
| Matter-element extension | Liu Y. et al. [18] | |
| Rumania Selection Method | Du Z. et al. [19] | |
| Intelligent evaluation | Support Vector Machine | Zhang X. et al. [20] |
| Neural Networks | Ze-Hong L. I. [21] | |
| Genetic Algorithm | Wen J. et al. [22] Rongrong R. et al. [23] | |
| Particle Swarm Algorithm | Zhao K. et al. [24] | |
| Artificial Fish Swarm Algorithm | Zhou G. L. et al. [25] |
| Object | First-Level Index | Second-Level Index |
|---|---|---|
| Comprehensive Benefit of the Transnational Power Grid Interconnection Project G | Economic Benefit A | Return on investment A1 |
| Power Price Competition A2 | ||
| Forex expansion ratio in export A3 | ||
| Social Benefit B | Employment effect B1 | |
| Direct contribution rate of GDP B2 | ||
| International friendship degree B3 | ||
| Environmental Benefit C | Comprehensive energy consumption efficiency C1 | |
| Proportion of clean energy C2 | ||
| Carbon dioxide emission reduction C3 | ||
| Technical Benefit D | Cable adoption rate D1 | |
| “N-1” criterion D2 | ||
| Reliability rate of power supply D3 |
| Index | ||||||||||
|---|---|---|---|---|---|---|---|---|---|---|
| A1 | 0.074 | 0.070 | 0.050 | 0.117 | 0.074 | 0.060 | 0.109 | 0.056 | 0.099 | 0.063 |
| A2 | 0.052 | 0.078 | 0.078 | 0.050 | 0.082 | 0.050 | 0.092 | 0.055 | 0.076 | 0.096 |
| A3 | 0.05 | 0.051 | 0.089 | 0.127 | 0.050 | 0.067 | 0.084 | 0.075 | 0.050 | 0.056 |
| B1 | 0.064 | 0.050 | 0.067 | 0.063 | 0.100 | 0.050 | 0.106 | 0.085 | 0.060 | 0.107 |
| B2 | 0.115 | 0.062 | 0.149 | 0.061 | 0.050 | 0.050 | 0.050 | 0.061 | 0.097 | 0.057 |
| B3 | 0.105 | 0.058 | 0.050 | 0.050 | 0.064 | 0.103 | 0.058 | 0.050 | 0.135 | 0.069 |
| C1 | 0.058 | 0.050 | 0.105 | 0.065 | 0.148 | 0.064 | 0.053 | 0.061 | 0.057 | 0.050 |
| C2 | 0.091 | 0.086 | 0.111 | 0.055 | 0.063 | 0.088 | 0.070 | 0.142 | 0.137 | 0.089 |
| C3 | 0.102 | 0.111 | 0.109 | 0.117 | 0.078 | 0.105 | 0.111 | 0.058 | 0.077 | 0.083 |
| D1 | 0.091 | 0.136 | 0.057 | 0.065 | 0.092 | 0.176 | 0.153 | 0.122 | 0.062 | 0.159 |
| D2 | 0.103 | 0.139 | 0.084 | 0.157 | 0.149 | 0.117 | 0.050 | 0.062 | 0.074 | 0.102 |
| D3 | 0.096 | 0.110 | 0.050 | 0.073 | 0.050 | 0.072 | 0.068 | 0.173 | 0.076 | 0.069 |
| Index | P1 | P2 | P3 | P4 | P5 | P6 | P7 | P8 |
|---|---|---|---|---|---|---|---|---|
| A1 | 0.673 | 0.922 | 0.604 | 0.757 | 1.000 | 0.733 | 0.639 | 0.817 |
| A2 | 0.783 | 0.690 | 0.743 | 0.906 | 0.743 | 0.906 | 1.000 | 0.673 |
| A3 | 0.765 | 0.692 | 0.838 | 0.791 | 0.753 | 1.000 | 0.927 | 0.745 |
| B1 | 0.575 | 0.634 | 0.591 | 0.695 | 0.673 | 0.769 | 0.743 | 1.000 |
| B2 | 0.582 | 0.724 | 1.000 | 0.876 | 0.651 | 0.629 | 0.711 | 0.896 |
| B3 | 0.478 | 0.592 | 0.521 | 1.000 | 0.613 | 0.442 | 0.506 | 0.744 |
| C1 | 0.998 | 0.999 | 1.000 | 1.000 | 0.998 | 1.000 | 1.000 | 1.000 |
| C2 | 0.428 | 0.450 | 0.649 | 0.516 | 1.000 | 0.762 | 0.444 | 0.428 |
| C3 | 0.333 | 1.000 | 0.394 | 0.498 | 0.429 | 0.525 | 0.362 | 0.585 |
| D1 | 0.959 | 0.856 | 0.814 | 0.815 | 0.868 | 1.000 | 0.987 | 0.854 |
| D2 | 0.764 | 0.856 | 0.717 | 0.743 | 0.981 | 0.695 | 0.828 | 1.000 |
| D3 | 0.871 | 1.000 | 0.797 | 0.808 | 0.881 | 0.839 | 0.800 | 0.953 |
| Index | P1 | P2 | P3 | P4 | P5 | P6 | P7 | P8 |
|---|---|---|---|---|---|---|---|---|
| A1 | 0.855 | 0.637 | 1.000 | 0.750 | 0.604 | 0.774 | 0.917 | 0.699 |
| A2 | 0.828 | 0.967 | 0.878 | 0.724 | 0.878 | 0.724 | 0.673 | 1.000 |
| A3 | 0.879 | 1.000 | 0.799 | 0.848 | 0.895 | 0.692 | 0.732 | 0.907 |
| B1 | 1.000 | 0.861 | 0.956 | 0.769 | 0.797 | 0.695 | 0.718 | 0.575 |
| B2 | 1.000 | 0.748 | 0.582 | 0.634 | 0.845 | 0.886 | 0.763 | 0.624 |
| B3 | 0.853 | 0.635 | 0.744 | 0.442 | 0.613 | 1.000 | 0.777 | 0.521 |
| C1 | 1.000 | 1.000 | 0.998 | 0.999 | 1.000 | 0.999 | 0.998 | 0.998 |
| C2 | 1.000 | 0.898 | 0.557 | 0.715 | 0.428 | 0.494 | 0.921 | 1.000 |
| C3 | 1.000 | 0.333 | 0.685 | 0.502 | 0.599 | 0.477 | 0.810 | 0.437 |
| D1 | 0.843 | 0.943 | 1.000 | 0.999 | 0.929 | 0.814 | 0.823 | 0.945 |
| D2 | 0.885 | 0.787 | 0.958 | 0.915 | 0.704 | 1.000 | 0.813 | 0.695 |
| D3 | 0.903 | 0.797 | 1.000 | 0.983 | 0.893 | 0.940 | 0.996 | 0.829 |
| Index | ||||||||||
|---|---|---|---|---|---|---|---|---|---|---|
| P1 | 0.410 | 0.491 | 0.503 | 0.464 | 0.484 | 0.475 | 0.448 | 0.451 | 0.545 | 0.511 |
| P2 | 0.512 | 0.497 | 0.508 | 0.477 | 0.505 | 0.463 | 0.527 | 0.464 | 0.484 | 0.529 |
| P3 | 0.467 | 0.510 | 0.462 | 0.475 | 0.540 | 0.547 | 0.510 | 0.554 | 0.510 | 0.475 |
| P4 | 0.510 | 0.473 | 0.469 | 0.495 | 0.479 | 0.515 | 0.486 | 0.497 | 0.567 | 0.523 |
| P5 | 0.514 | 0.492 | 0.511 | 0.527 | 0.499 | 0.527 | 0.567 | 0.496 | 0.546 | 0.514 |
| P6 | 0.470 | 0.500 | 0.534 | 0.528 | 0.486 | 0.525 | 0.522 | 0.475 | 0.433 | 0.532 |
| P7 | 0.454 | 0.485 | 0.533 | 0.488 | 0.488 | 0.477 | 0.530 | 0.488 | 0.407 | 0.445 |
| P8 | 0.528 | 0.547 | 0.465 | 0.461 | 0.492 | 0.552 | 0.482 | 0.527 | 0.474 | 0.492 |
© 2018 by the authors. Licensee MDPI, Basel, Switzerland. This article is an open access article distributed under the terms and conditions of the Creative Commons Attribution (CC BY) license (http://creativecommons.org/licenses/by/4.0/).
Share and Cite
Li, J.; Xu, J.; Tan, X. Dynamic Comprehensive Benefit Evaluation of the Transnational Power Grid Interconnection Project Based on Combination Weighting and TOPSIS Grey Projection Method. Sustainability 2018, 10, 4672. https://doi.org/10.3390/su10124672
Li J, Xu J, Tan X. Dynamic Comprehensive Benefit Evaluation of the Transnational Power Grid Interconnection Project Based on Combination Weighting and TOPSIS Grey Projection Method. Sustainability. 2018; 10(12):4672. https://doi.org/10.3390/su10124672
Chicago/Turabian StyleLi, Jinying, Jiaming Xu, and Xin Tan. 2018. "Dynamic Comprehensive Benefit Evaluation of the Transnational Power Grid Interconnection Project Based on Combination Weighting and TOPSIS Grey Projection Method" Sustainability 10, no. 12: 4672. https://doi.org/10.3390/su10124672
APA StyleLi, J., Xu, J., & Tan, X. (2018). Dynamic Comprehensive Benefit Evaluation of the Transnational Power Grid Interconnection Project Based on Combination Weighting and TOPSIS Grey Projection Method. Sustainability, 10(12), 4672. https://doi.org/10.3390/su10124672