Environmental Impact Associated with the Supply Chain and Production of Grounding and Roasting Coffee through Life Cycle Analysis

 ,
, 
Abstract
1. Introduction
2. Materials and Methods
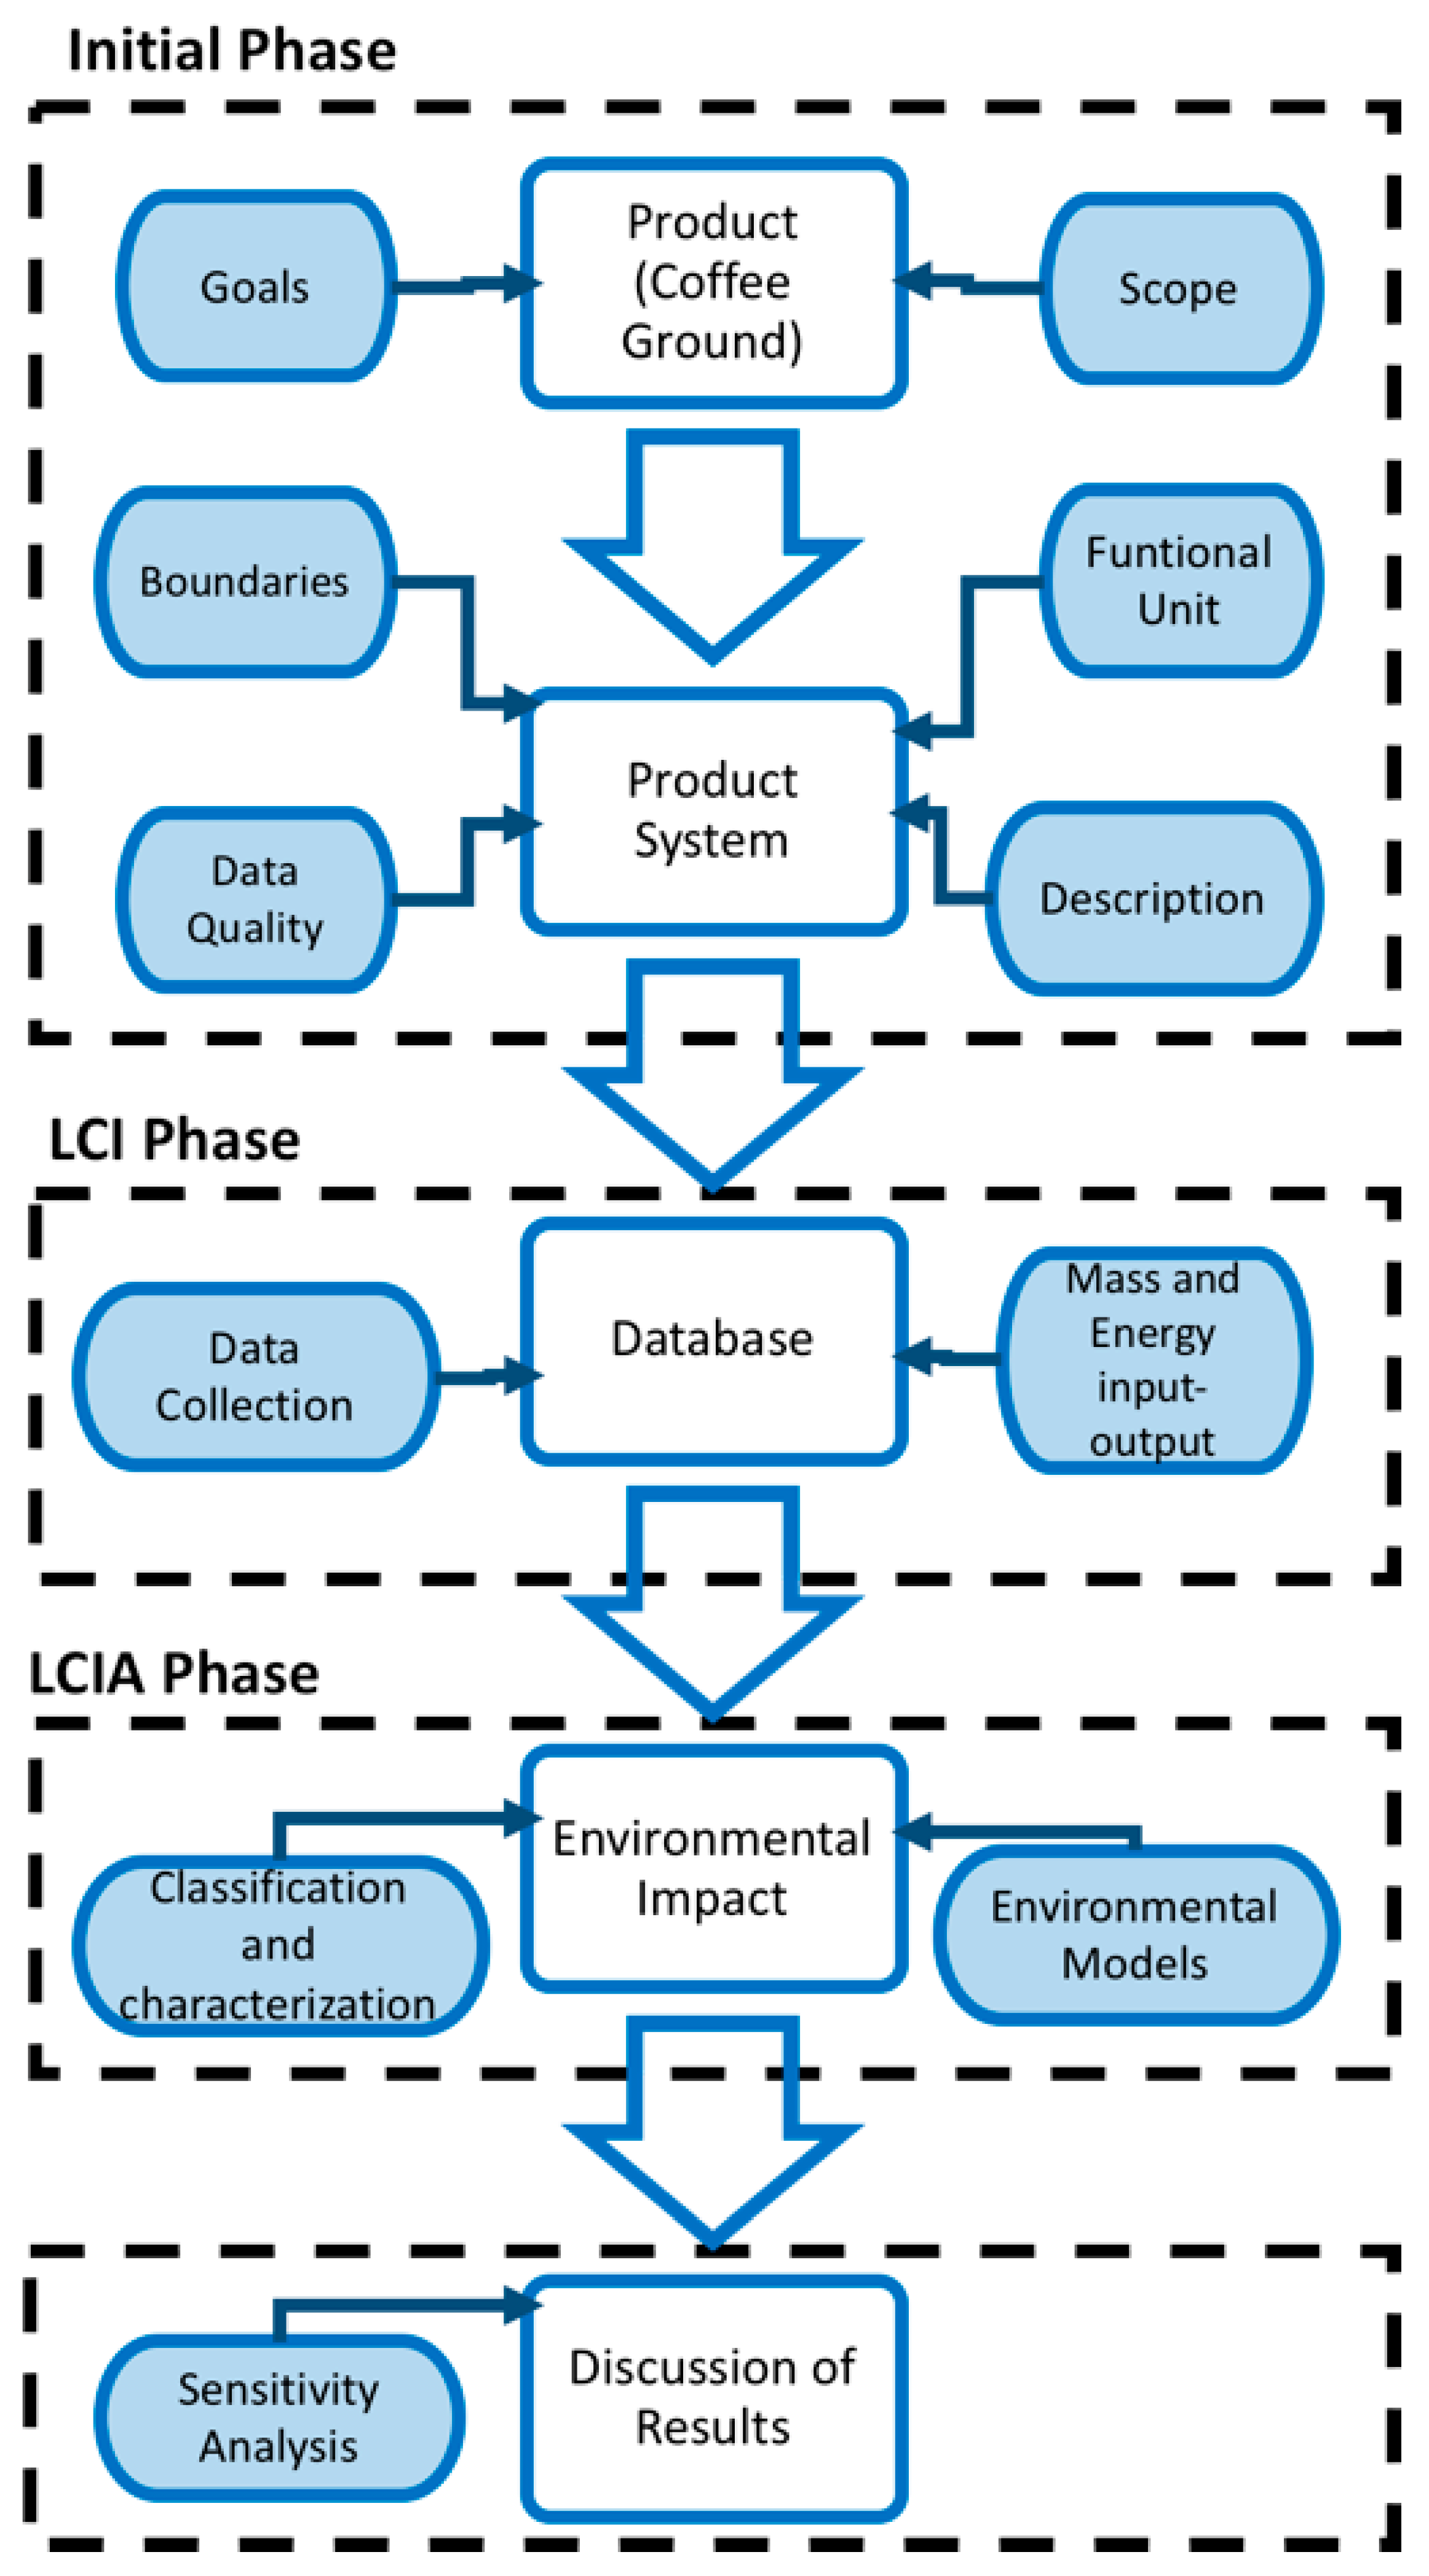
2.1. Initial Phase: Objectives and Scopes
2.2. Life Cycle Inventory
2.3. Life Cycle Impact Evaluation
2.4. Life Cycle Interpretation
3. Results
3.1. LCA of Ground Coffee Production
3.1.1. Initial Phase
- To quantify environmental impacts associated to cultivation and processing of coffee through traditional processing using the wet process to obtain a determined amount of toasted and ground Arabica coffee;
- to develop a database by means of the quantification of material and energy flows that are inputted and outputted from the product system for the LCI conformation; and
- to propose two current scenarios of energetic supply to the conventional processing of the coffee grain by the wet process that compares the use in each case of liquefied petroleum gas (LPG) and waste biomass (WB) generated by the product system itself.
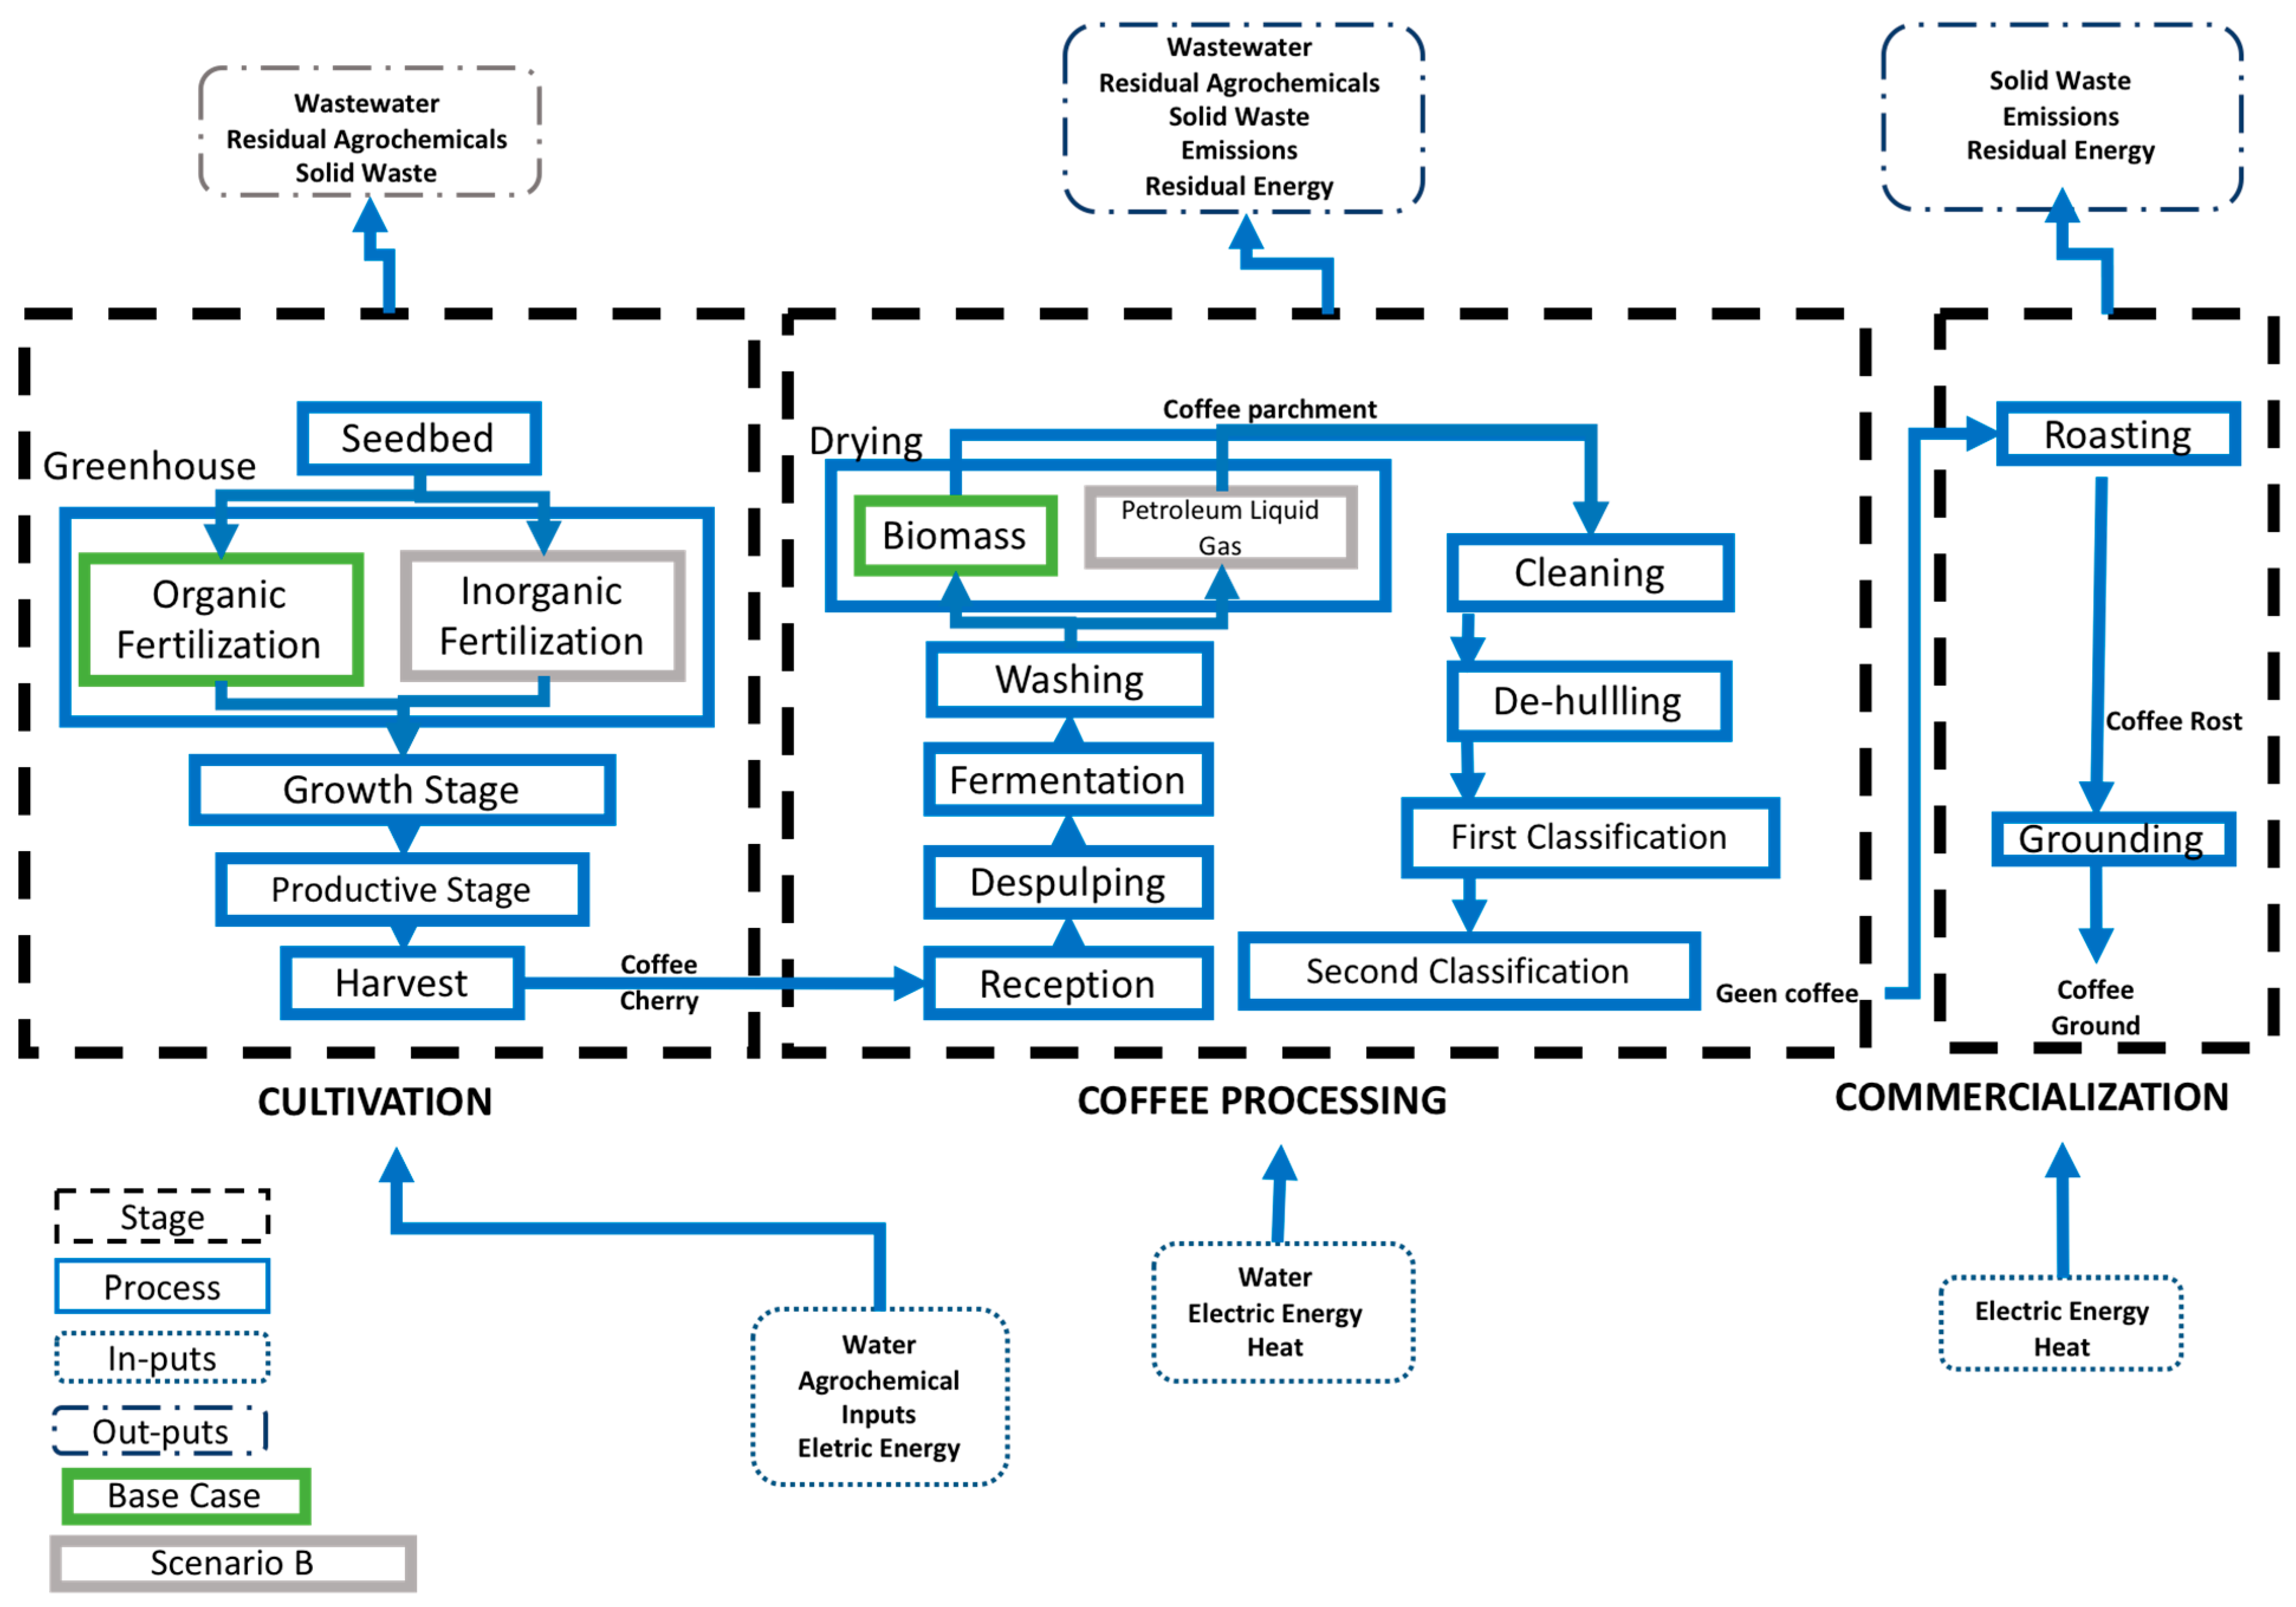
- The LCI was compiled and quantified taking into account the following stages (Figure 2):
- (i)
- Extraction, mining, milling, and pre-manufacturing of raw materials;
- (ii)
- upstream energy flow supplied to the product system;
- (iii)
- agricultural process represented through the coffee plantation, which included the following sub-phases: (a) seedbed, (b) nursery, (c) plant growth phase, and (d) plant’s productive phase; and
- (iv)
- coffee processing, which corresponded to the benefit via the wet process and coffee commercialization, with the analysis of the sub-phases: (a) Process of coffee that benefitted (b) roasting, and (c) grinding;
- due to the variability in the harvest yield that a coffee plant can have in different cultivation conditions, a yield determined by the conditions of local producers was proposed according to data collected in the field research (Table 2); and
- the allocation procedures for multiple streams, co-products, and products were established by mass and economic causality as per ISO 14,044 [22]. In the case of energy processes, such as the drying and roasting of coffee beans, allotted flows were based on energy balances from each production stream, including intermediate flows.
3.1.2. EcoInvent Datasets Adaptation
3.1.3. Product System Description
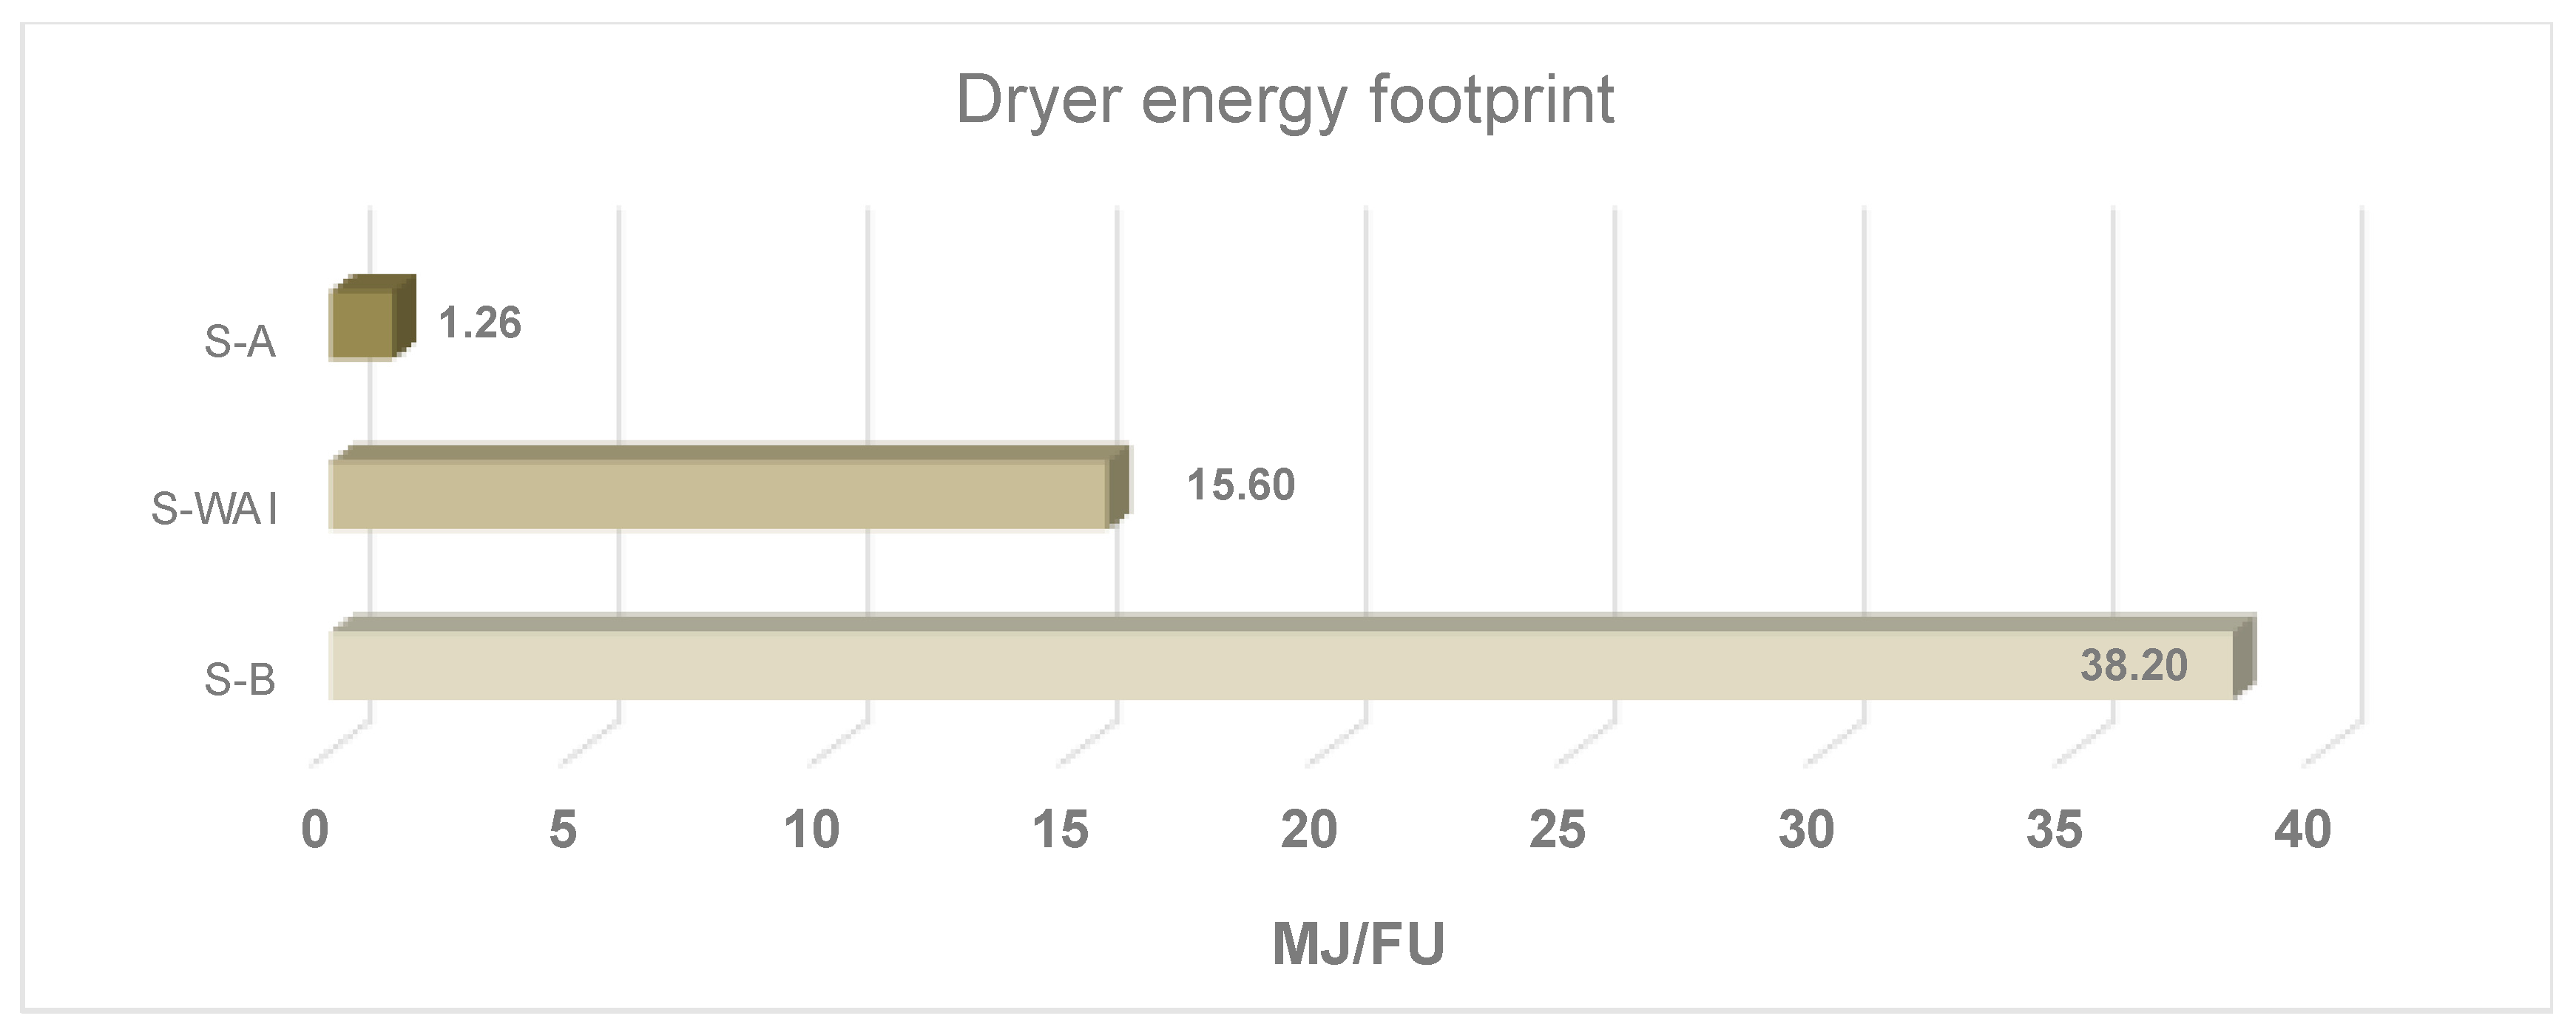
3.1.4. Proposals for Sensitivity Analysis
3.2. Life Cycle Inventory
3.3. Impact Evaluation Phase
4. Discussion
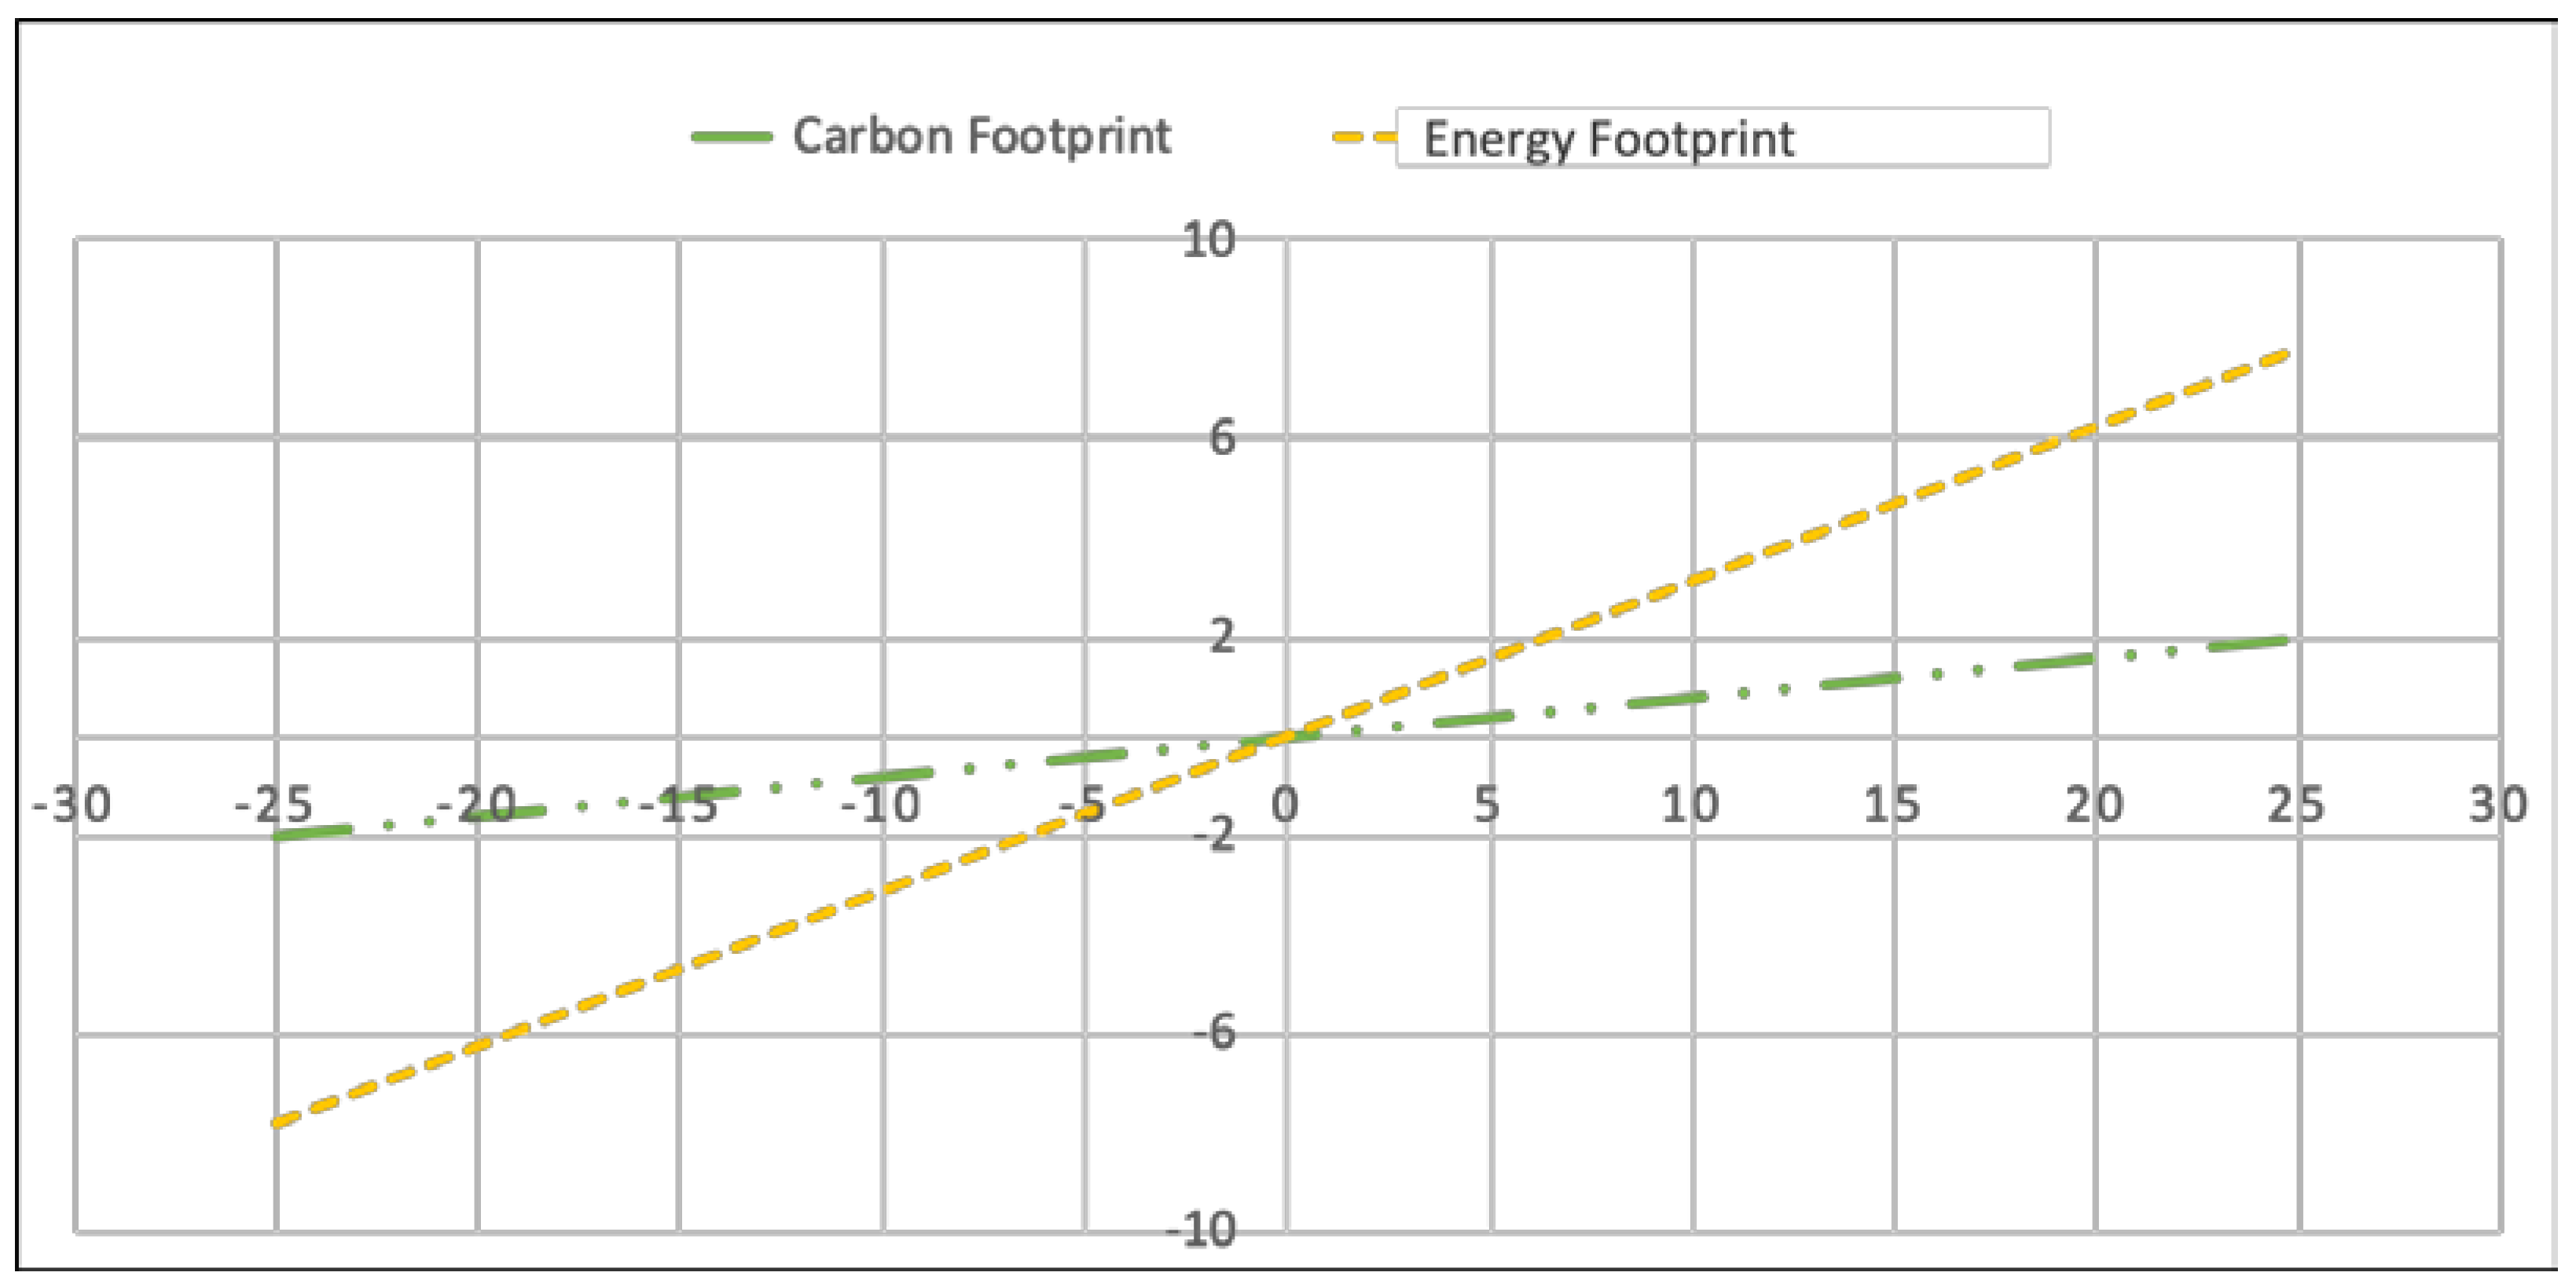
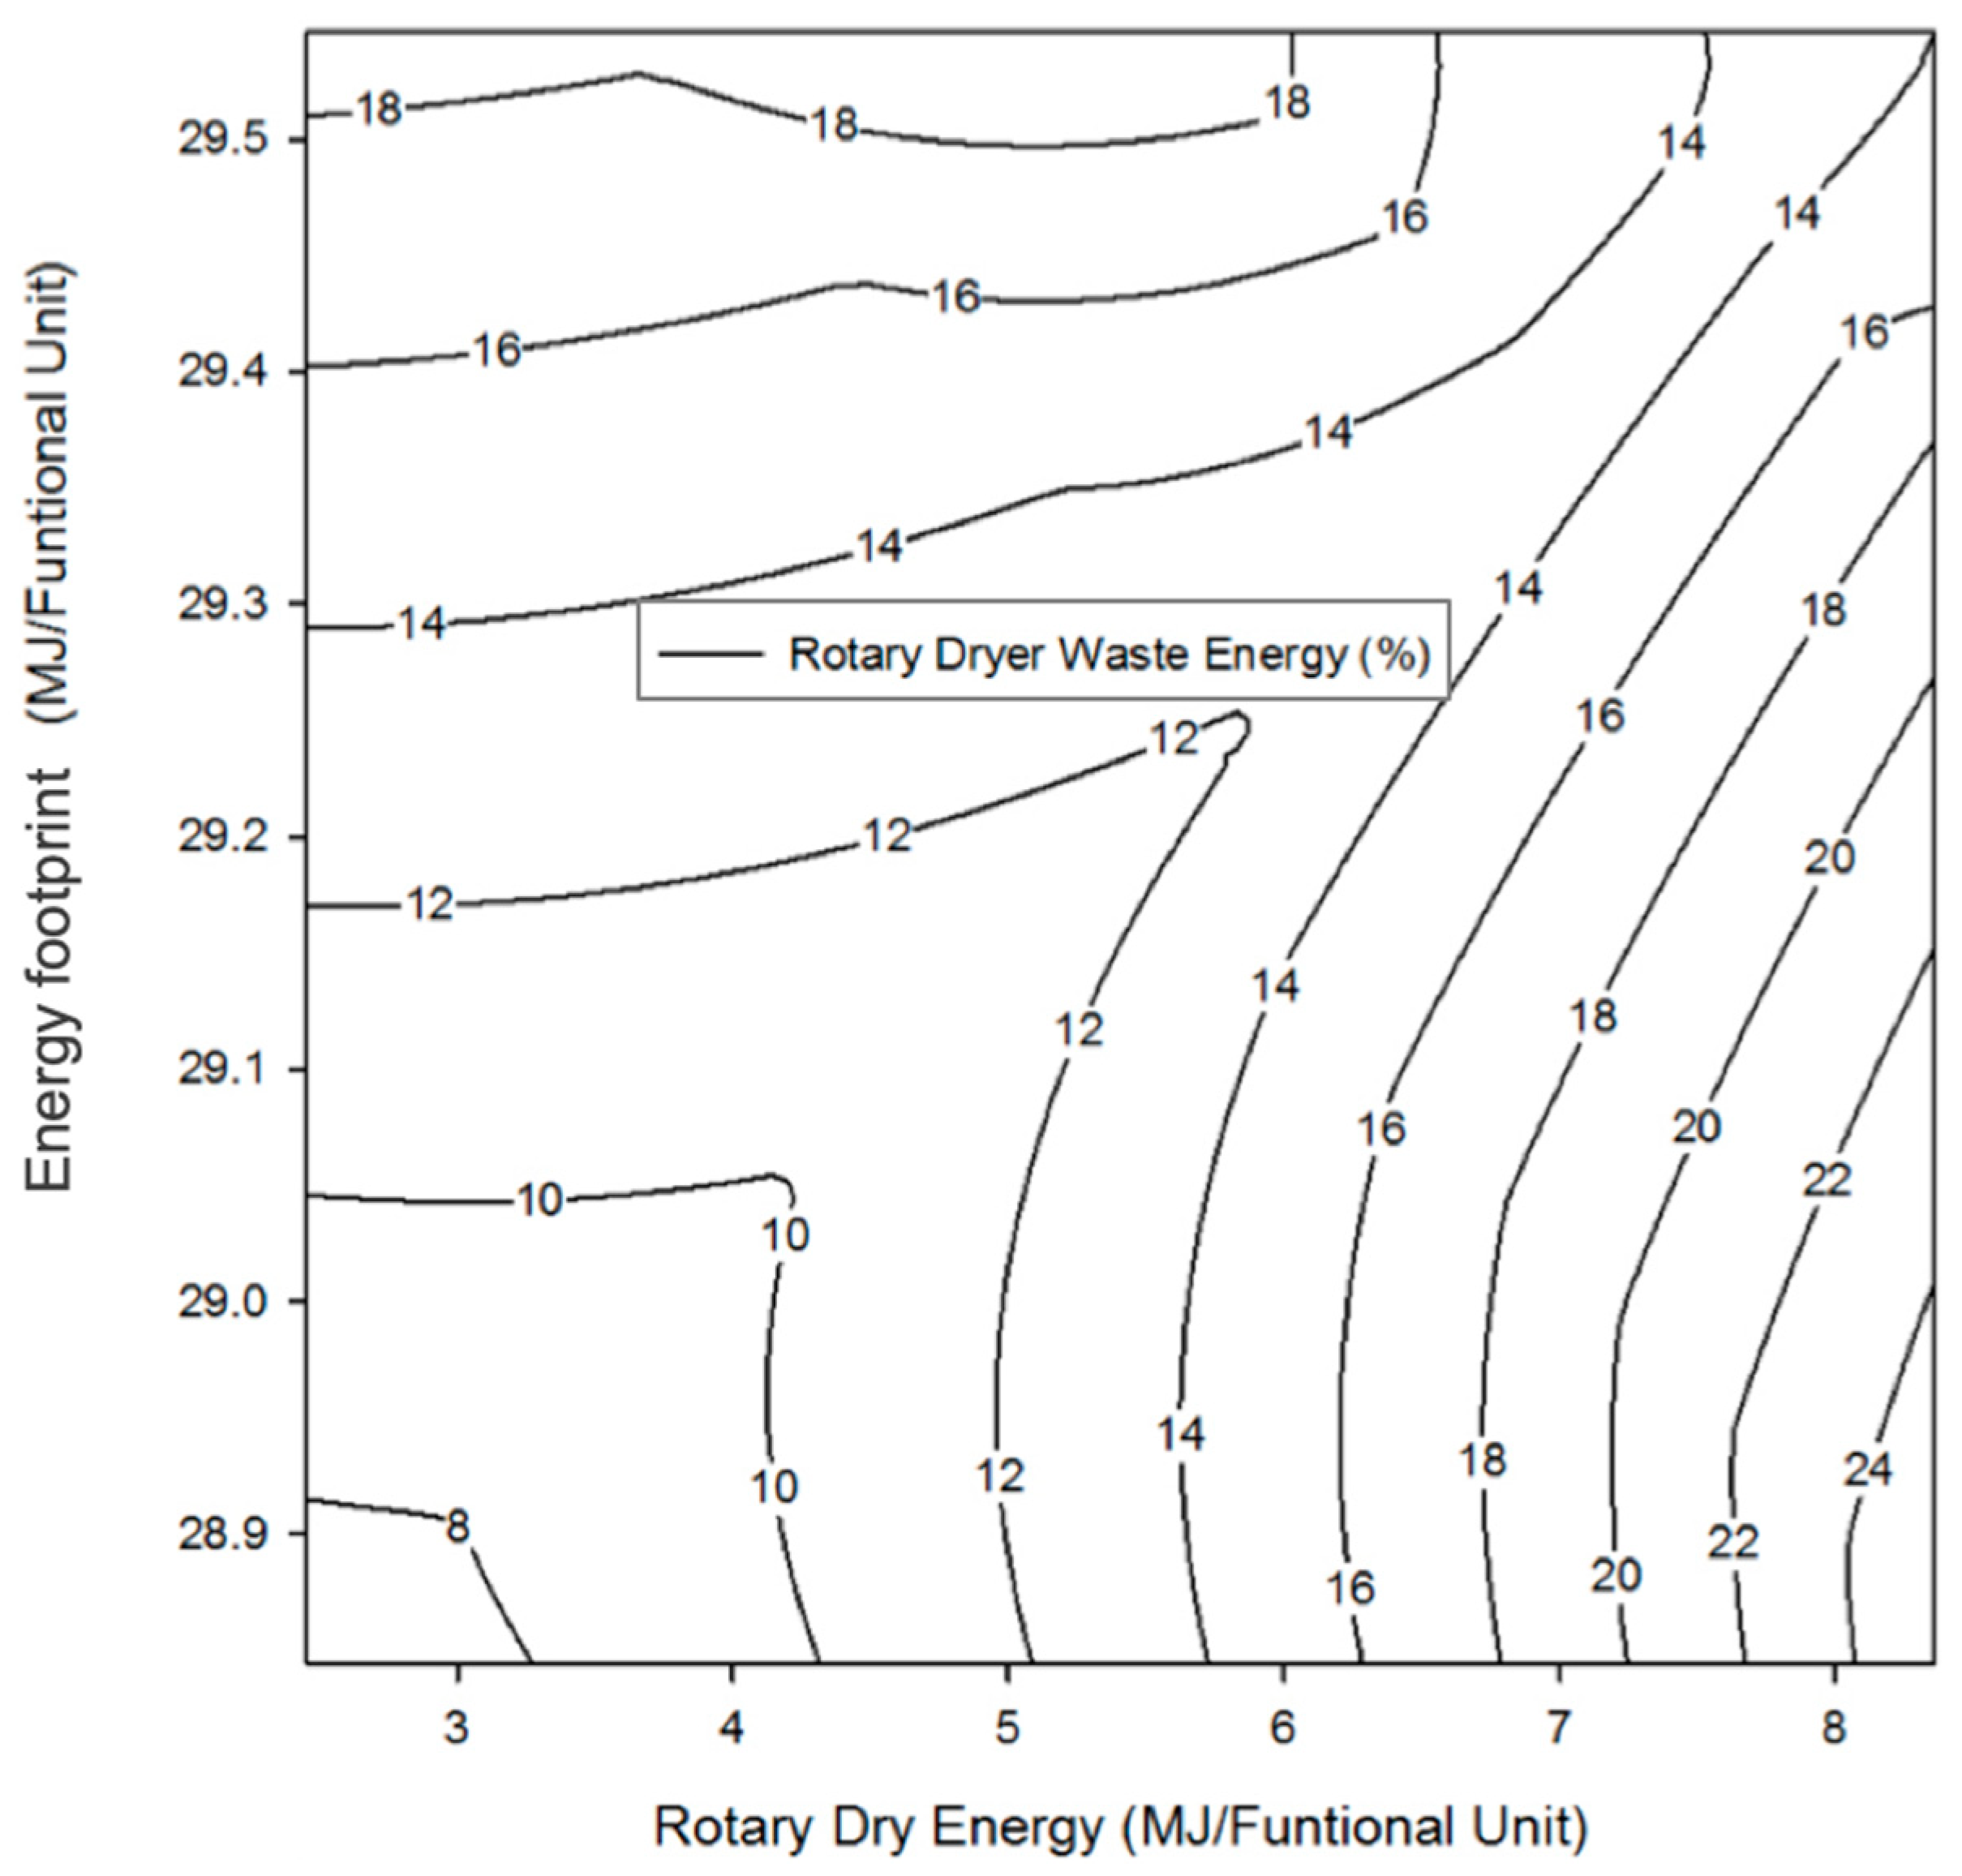
Sensitivity Analysis
5. Conclusions
Author Contributions
Funding
Acknowledgments
Conflicts of Interest
References
- Gurram, R.; Al-Shannag, M.; Knapp, S.; Das, T.; Singsaas, E.; Alkasrawi, M. Technical possibilities of bioethanol production from coffee pulp: A renewable feedstock. Clean Technol. Environ. Policy 2016, 18, 269–278. [Google Scholar] [CrossRef]
- Hernández, T.N. Índices de calidad ambiental de suelos asociados a contenidos de agua y concentraciones de nitrógeno en cultivos de café. Bachelor’s Thesis, Universidad Veracruzana, Veracruz, Mexico, 2014. [Google Scholar]
- Oliveira, L.S.; Franca, S.A. An overview of the potential uses for coffee husks. In Coffee in Health and Disease Prevention, 1st ed.; Preedy, V.R., Ed.; Academic Press: London, UK, 2015; pp. 283–291. ISBN 978-0-12-409517-5. [Google Scholar]
- Gómez, O.D.; Gómez, V.M. Consultoría e Ingeniería Ambienta, 1st ed.; Mundi-Prensa: Madrid, Spain, 2007. [Google Scholar]
- Cherubini, F.; Bargigli, S.; Ulgiati, S. Life cycle assessment (LCA) of waste management strategies: Landfilling, sorting plant and incineration. Energy 2009, 34, 2116–2123. [Google Scholar] [CrossRef]
- Coltro, L.; Mourad, A.; Oliveira, P.; Baddini, J.; Kletecke, R. Environmental profile of Brazilian green coffee. Int. J. Life Cycle Assess. 2006, 11, 16–21. [Google Scholar] [CrossRef]
- Humbert, S.; Loerincik, Y.; Rossi, V.; Margni, M.; Jolliet, O. Life cycle assessment of spray dried soluble coffee and comparison with alternatives (drip filter and capsule espresso). J. Clean. Prod. 2009, 17, 1351–1358. [Google Scholar] [CrossRef]
- Killian, B.; Rivera, L.; Soto, M.; Navichoc, D. Carbon footprint across the coffee supply chain: The case of Costa Rican coffee. J. Agric. Sci. Technol. 2013, 3, 151. [Google Scholar]
- Noponen, M.R.; Edwards-Jones, G.; Haggar, J.P.; Soto, G.; Attarzadeh, N.; Healey, J.R. Greenhouse gas emissions in coffee grown with differing input levels under conventional and organic management. Agric. Ecosyst. Environ. 2012, 151, 6–15. [Google Scholar] [CrossRef]
- Segura-Madrigal, M.A.; Andrade, H.J. Huella de carbono en cadenas productivas de café (Coffea arabica L.) con diferentes estándares de certificación en Costa Rica. Luna Azul 2012, 35, 60–77. [Google Scholar]
- Valenzuela, V.E.E. Diseño de Estrategias de Sostenibilidad Ambiental en Agroecosistemas Plataneros Asociados con Café, con Base en los Impactos Ambientales Determinados Mediante el Análisis de Ciclo de Vida (ACV). Doctor’s Thesis, Universidad Nacional de Colombia, Bogotá, Colombia, 2016. [Google Scholar]
- Dierks, S. Case Study Tchibo Privat Kaffee Rarity Machare by Tchibo GMBH; Case Study Undertaken within the PCF Pilot Project Germany; Öko-Institut: Berlin, Germany, 2008; Available online: http://www.pcf-projekt.de/files/1232962944/pcf_tchibo_coffee.pdf (accessed on 7 May 2018).
- Domínguez-Patiño, J.; Martínez, A.R.; Romero, R.J.; Orozco, I.H. Life Cycle Assessment on Real Time in a Coffee Machine. J. Chem. 2014, 8, 1142–1149. [Google Scholar]
- Arzoumanidis, I.; Salomone, R.; Petti, L.; Mondello, G.; Raggi, A. Is there a simplified LCA tool suitable for the agri-food industry? An assessment of selected tools. J. Clean. Prod. 2017, 149, 406–425. [Google Scholar] [CrossRef]
- Chapagain, A.K.; Hoekstra, A.Y. The Water Needed to Have the Dutch Drink Coffee; Value of Water Research Report Series; UNESCO–IHE: Delft, The Netherlands, 2003; Volume 14, Available online: https://waterfootprint.org/media/downloads/Report14.pdf (accessed on 6 May 2018).
- Chapagain, A.K.; Hoekstra, A.Y. The water footprint of coffee and tea consumption in The Netherlands. Ecol. Econ. 2007, 64, 109–118. [Google Scholar] [CrossRef]
- Mekonnen, M.M.; Hoekstra, A.Y. The green, blue and grey water footprint of crops and derived crop products. Hydrol. Earth Syst. Sci. 2011, 15, 1577–1600. [Google Scholar] [CrossRef]
- Ridoutt, B.G.; Pfister, S. A revised approach to water footprinting to make transparent the impacts of consumption and production on global freshwater scarcity. Glob. Environ. Chang. 2010, 20, 113–120. [Google Scholar] [CrossRef]
- Rodríguez, N.; Sanz, J.R.; Oliveros, C.E.; Ramírez, C.A. Beneficio del café en Colombia: Prácticas y estrategias para el ahorro, uso eficiente del agua y el control de la contaminación hídrica en el proceso de beneficio húmedo del café. Centro Nacional de Investigaciones de Café, Federación Nacional de Cafeteros de Colombia: Colombia, 2015. Available online: http://biblioteca.cenicafe.org/handle/10778/659 (accessed on 5 May 2018).
- Karim, A.I.M. Life Cycle Analysis and Life Cycle Impact Assessment Methodologies: A State of the Art. Master’s Thesis, University of Lleida, Cataluña, Spain, 2011. [Google Scholar]
- Pasqualino, J.; Meneses, M.; Castells, F. The carbon footprint and energy consumption of beverage packaging selection and disposal. J. Food Eng. 2011, 103, 357–365. [Google Scholar] [CrossRef]
- International Organization for Standardization (ISO). ISO 14040 and 14044 Environmental Management-Life Cycle Assessment-Principles and Framework. Available online: https://www.iso.org/standard/37456.html (accessed on 5 April 2018).
- Narita, Y.; Inouye, K. Review on utilization and composition of coffee silverskin. Food Res. Int. 2014, 61, 16–22. [Google Scholar] [CrossRef]
- Curran, M.A. Life Cycle Assessment Handbook: A Guide for Environmentally Sustainable Products, 1st ed.; John Wiley & Sons, Inc.: Salem, MA, USA, 2012; ISBN 9781118099728. [Google Scholar]
- Giraldi, M.R.; François, J.L.; Martin-del-Campo, C. Life cycle assessment of hydrogen production from a high temperature electrolysis process coupled to a high temperature gas nuclear reactor. Int. J. Hydrogen Energy 2015, 40, 4019–4033. [Google Scholar] [CrossRef]
- Huijbregts, M.A.; Steinmann, Z.J.; Elshout, P.M.; Stam, G.; Verones, F.; Vieira, M.; Zijp, M.; Hollander, A.; Van Zelm, R. ReCiPe2016: A harmonised life cycle impact assessment method at midpoint and endpoint level. Int. J. Life Cycle Assess. 2017, 22, 138–147. [Google Scholar] [CrossRef]
- Notarnicola, B.; Tassielli, G.; Renzulli, P.A.; Giudice, A.L. Life Cycle Assessment in the agri-food sector: An overview of its key aspects, international initiatives, certification, labelling schemesand methodological issues. In Life Cycle Assessment in the Agri-Food Sector, 1st ed.; Springer International Publishing: Basel, Switzerland, 2015; pp. 1–56. ISBN 978-3-319-11940-3. [Google Scholar]
- Viere, T.; von Enden, J.; Schaltegger, S. Life cycle and supply chain information in environmental management accounting: A coffee case study. In Environmental Management Accounting and Supply Chain Management, 1st ed.; Springer Science + Business Media: Dordrecht, The Netherlands, 2011; pp. 23–40. ISBN 978-94-007-1390-1. [Google Scholar]
- Benveniste, G.; Gazulla, C.; Fullana, P.; Celades, I.; Ros, T.; Zaera, V.; Godes, B. Análisis de ciclo de vida y reglas de categoría de producto en la construcción. El caso de las baldosas cerámicas. Informes de la Construcción 2011, 63, 71–81. [Google Scholar] [CrossRef]
- Hospido, A.; Davis, J.; Berlin, J.; Sonesson, U. A review of methodological issues affecting LCA of novel food products. Int. J. Life Cycle Assess. 2010, 15, 44–52. [Google Scholar] [CrossRef]
- Rebitzer, G.; Ekvall, T.; Frischknecht, R.; Hunkeler, D.; Norris, G.; Rydberg, T.; Schmidtg, W.P.; Suhh, S.; Weidemai, B.P.; Pennington, D.W. Life cycle assessment: Part 1: Framework, goal and scope definition, inventory analysis, and applications. Environ. Int. 2004, 30, 701–720. [Google Scholar] [CrossRef]
- Ecoinvent v3. Ecoinvent Database Swiss Center for Life Cycle Inventory. Available online: https://www.ecoinvent.org/database/database.html (accessed on 4 April 2018).
- Aguirre, D.M.; Jácome, C.J.S.L. (Fieldwork in the Coffee Sector Company, Beneficio Puerto Rico, Loma Alta, Veracruz, México). Personal communication, 2018.
- Mussatto, S.I.; Machado, E.M.; Martins, S.; Teixeira, J.A. Production, composition, and application of coffee and its industrial residues. Food Bioprocess Technol. 2011, 4, 661. [Google Scholar] [CrossRef]
- Rincón, V.E.; Rincón, G.D. (Fieldwork in the Coffee Sector Company, La Laja, Tlaltetela, Veracruz, México). Personal communication, 2018.
- Mendoza, E.; Teresa, M. Café y cultura productiva en una región de Veracruz. Nueva Antropol. 2009, 22, 33–56. [Google Scholar]
- Herrera, M.E.; Galindo, A. (Fieldwork in the Coffee Sector Company, Los Barreales, Xalapa, Veracruz, México). Personal communication, 2018.
- Houbron, E.; Cano, V.; Reyes, L.C.; Rustrían, E. En busca de una Solución para el Tratamiento de los Desechos del Café Gaceta de la Universidad Veracruzana. Available online: https://www.uv.mx/gaceta/Gaceta101/101/ABCiencia/ABCIencia_08.htm (accessed on 3 April 2018).
- De Monte, M.; Padoano, E.; Pozzetto, D. Waste heat recovery in a coffee roasting plant. Appl. Therm. Eng. 2003, 23, 1033–1044. [Google Scholar] [CrossRef]
- Giraldo, C.I. Cadenas productivas lácteos y café Universidad EAN, Bogotá, Colombia. Available online: http://hdl.handle.net/10882/2712 (accessed on 10 April 2018).
- Dadi, D.; Mengistie, E.; Terefe, G.; Getahun, T.; Haddis, A.; Birke, W.; Beyene, A.; Luis, P.; Van der Bruggen, B. Assessment of the effluent quality of wet coffee processing wastewater and its influence on downstream water quality. Ecohydrol. Hydrobiol. 2018, 18, 201–211. [Google Scholar] [CrossRef]
- López, R.; Díaz, G.; Zamarripa, A. El Sistema Producto Café en México: Problemática y Tecnología de Producción; Instituto Nacional de Investigaciones Forestales, Agrícolas y Pecuarias (INIFAP): Cotaxtla, México, 2013; ISBN 978-607-006-72. [Google Scholar]
- Tirabanti, J. Manejo agroforestal multiestrato para el cultivo de café. Una propuesta de ecosistemas frágiles; Organización Soluciones Practicas: Moyobamba, Perú, 2011. [Google Scholar]
- Esquivel, P.; Jiménez, V.M. Functional properties of coffee and coffee by-products. Food Res. Int. 2012, 46, 488–495. [Google Scholar] [CrossRef]
- Oliveros, C.E.; Sanz, J.R.; Ramirez, C.A.; Peñuela, A.E. Aprovechamiento eficiente de la energía en el secado mecánico del café. Avances Técnicos 2009, 380, 1–8. [Google Scholar]
- Rodríguez, N.; Zambrano, D.A. Los Subproductos del Café: Fuente de Energía Renovable. Avances Técnicos 2010, 393, 1–8. [Google Scholar]
- Hernández, M.G.; Córdoba, S.S. México, café y productores: Historia de la cultura cafetalera que transformó nuestras regiones, 1st ed.; Centro Agropecuario del Café, Universidad Autónoma de Chapingo: Estado de México, México, 2011. [Google Scholar]
- Vera, L.D.; Vélez, J.A.; Marulanda, N. Assessment of the environmental impact of three types of fertilizers on the cultivation of coffee at the Las Delicias indigenous reservation (Cauca) starting from the life cycle assessment. Revista Facultad de Ingeniería Universidad de Antioquia 2016, 81, 93–101. [Google Scholar] [CrossRef]
- Hassard, H.A.; Couch, M.H.; Techa-Erawan, T.; McLellan, B.C. Product carbon footprint and energy analysis of alternative coffee products in Japan. J. Clean. Prod. 2014, 73, 310–321. [Google Scholar] [CrossRef]
- Chanakya, H.N.; De Alwis, A.A.P. Environmental issues and management in primary coffee processing. Process Saf. Environ. Prot. 2004, 82, 291–300. [Google Scholar] [CrossRef]
- Arévalo, D.; Lozano, J.; Sabogal, J. Estudio nacional de huella hídrica Colombia sector agrícola. Revista Internacional de Sostenibilidad, Tecnología y Humanismo 2011, 6, 101–126. [Google Scholar]
- Martins, L.D.; Eugenio, F.C.; Rodrigues, W.N.; Brinate, S.V.B.; Colodetti, T.V.; Amaral, J.F.T.; Jesus, W.C., Jr.; Ramalho, J.C.; Dos Santos, A.R.; Tomaz, M.A. A bitter cup: The estimation of spatial distribution of carbon balance in Coffea spp. plantations reveals increased carbon footprint in tropical regions. Plant Soil Environ. 2015, 61, 544–552. [Google Scholar] [CrossRef]
- Moreno, O.J.A. (Fieldwork in the Coffee Sector Company, Solo Café de Calidad, Coatepec, Veracruz, México). Personal communication, 2018.
- Cárdenas, J.E.; Vásquez, J.R.; Cortés, V.; Espinal, R.; Vega, S. Análisis del ciclo de vida del procesamiento y la distribución del café del beneficio ecológico en la finca Juancito y convencional en la finca La Montaña, Francisco Morazán. Bachelor’s Thesis, Escuela Agrícola Panamericana, Tegucigalpa, Honduras, 2013. [Google Scholar]
- Büsser, S.; Jungbluth, N. The role of flexible packaging in the life cycle of coffee and butter. Int. J. Life Cycle Assess. 2009, 14, 80–91. [Google Scholar] [CrossRef]
- Pozos, S.J.M. (Fieldwork in the Coffee Sector Company, Beneficio Ecológico “San Miguel”, Xico, Veracruz, México). Personal communication, 2018.
- García, B.J.A. (Fieldwork in the Coffee Sector Company, Beneficio Guadalupe, Teocelo, Veracruz, México). Personal communication, 2018.
- Von Blottnitz, H.; Curran, M.A. A review of assessments conducted on bio-ethanol as a transportation fuel from a net energy, greenhouse gas, and environmental life cycle perspective. J. Clean. Prod. 2007, 15, 607–619. [Google Scholar] [CrossRef]
- Kljajić, M.V.; Andjelković, A.S.; Gvozdenac, D.D. Viability analysis of heat recovery solution for industrial process of roasting coffee. Therm. Sci. 2016, 20, S623–S637. [Google Scholar] [CrossRef]
- Pantaleo, A.M.; Fordham, J.; Oyewunmi, O.A.; Markides, C.N. Intermittent waste heat recovery: Investment profitability of ORC cogeneration for batch, gas-fired coffee roasting. Energy Procedia 2017, 129, 575–582. [Google Scholar] [CrossRef]
- Adams, M.; Ghaly, A.E. Maximizing sustainability of the Costa Rican coffee industry. J. Clean. Prod. 2007, 15, 1716–1729. [Google Scholar] [CrossRef]
- Huijbregts, M.A.; Rombouts, L.J.; Hellweg, S.; Frischknecht, R.; Hendriks, A.J.; van de Meent, D.; Ragas, A.M.J.; Reijnders, L.; Struijs, J. Is Cumulative Fossil Energy Demand a Useful Indicator for the Environmental Performance of Products? Environ. Sci. Technol. 2006, 40, 641–648. [Google Scholar] [CrossRef]
- Meisterling, K.; Samaras, C.; Schweizer, V.J. Decisions to reduce greenhouse gases from agriculture and product transport: LCA case study of organic and conventional wheat. J. Clean. Prod. 2009, 17, 222–230. [Google Scholar] [CrossRef]
- Weber, C.L.; Matthews, H.S. Food-miles and the relative climate impacts of food choices in the United States. Environ. Sci. Technol. 2008, 42, 3508–3513. [Google Scholar] [CrossRef]
- Akpinar, E.K.; Midilli, A.; Bicer, Y. The first and second law analyses of thermodynamic of pumpkin drying process. J. Food Eng. 2006, 72, 320–331. [Google Scholar] [CrossRef]
- Hernández, W.N.; Hernández, F.J.; Vargas, Z.; Rodríguez, G.C.; García, M.A. Coffee grain rotary drying optimization. Revista Mexicana de Ingeniería Química 2013, 12, 315–325. [Google Scholar]


| Impact Category | Description | Unit |
|---|---|---|
| Carbon footprint | This indicator evaluates the impact of greenhouse gas emissions associated to the product system. | Kg CO2 equivalent |
| Water footprint | Shows all impacts related to water consumption. It refers to the water that is consumed and therefore it is no longer available for humans or ecosystems | m3 |
| Energy footprint | This indicator summarizes the energy supply from the product system, through a “bottom-up” structure, and the supply chain of conventional and non-conventional fuels are quantified. | MJ |
| Relation | Ratio |
|---|---|
| Coffee Cherry: Ground Coffee | 7.42 |
| Dry Parchment Coffee: Ground Coffee | 1.71 |
| Green Coffee: Ground Coffee | 1.34 |
| Toasted Coffee: Ground Coffee | 1.02 |
| Stage | Flow | Amount | Unit/UF |
|---|---|---|---|
| Cultivation stage | |||
| Seedbed place | Water supply | 4.26 × 100 | kg |
| Wastewater | 4.28 × 10⁻³ | m3 | |
| Polyethylene mesh | 7.29 × 10⁻⁶ | kg | |
| Substrate | 25.13 × 10⁻³ | kg | |
| Agrochemical disinfection | 1.54 × 10⁻⁶ | kg | |
| Power consumption | 873.00 × 10⁻⁶ | kWh | |
| Nursery | Agrochemical required | 1.77 × 10⁻³ | kg |
| Water supply | 1.25 × 100 | kg | |
| Residual agrochemical | 231.10 × 10⁻⁶ | kg | |
| Wastewater | 483.10 × 10⁻⁶ | kg | |
| Polyethylene | 287.3 × 10⁻⁶ | kg | |
| Substrate | 85.60 × 10⁻³ | kg | |
| Power consumption | 239.00 × 10⁻⁶ | kWh | |
| Coffee plantation | Substrate | 3.16 × 10⁻³ | kg |
| Polyethylene bags | 280.00 × 10⁻⁶ | kg | |
| Water | 287.30 × 10⁻³ | kg | |
| Wastewater | 2.08 × 100 | m3 | |
| Agrochemicals | 707.00 × 10⁻³ | kg | |
| Residual agrochemicals | 228.70 × 10⁻³ | kg | |
| Coffee processing stage | |||
| Reception | Process water | 11.20 × 100 | kg |
| Pulper | Wastewater | 3.62 × 10⁻³ | m3 |
| Power consumption | 3.31 × 10⁻³ | kWh | |
| Fermentation | Process water | 11.90 × 100 | kg |
| Wastewater | 6.44 × 10⁻³ | m3 | |
| Washing | Process water | 7.14 × 100 | kg |
| Wastewater | 7.70 × 10⁻³ | m3 | |
| Power consumption | 200.00 × 100 | kWh | |
| Straw burner | Energy supplied | 18.85 × 100 | MJ |
| Residual energy | 14.62 × 100 | MJ | |
| Power consumption | 110.00 × 10⁻³ | kWh | |
| Biomass | 639.26 × 10⁻³ | kg | |
| Dryer | Energy supplied | 4.23 × 100 | MJ |
| Residual energy | 2.09 × 100 | MJ | |
| Power consumption | 88.60 × 10⁻³ | kWh | |
| Cleaning and adjustment processes | Power consumption | 32.50 × 10⁻³ | kWh |
| Commercialization stage | |||
| Roasting | Energy supplied | 2.63 × 100 | MJ |
| Residual energy | 433.29 × 10⁻³ | MJ | |
| Waste | 330.00 × 10⁻³ | kg | |
| Power consumption | 110.00 × 10⁻³ | kWh | |
| Grounding | Waste | 15.20 × 10⁻³ | kg |
| Power consumption | 18.58 × 10⁻³ | kWh | |
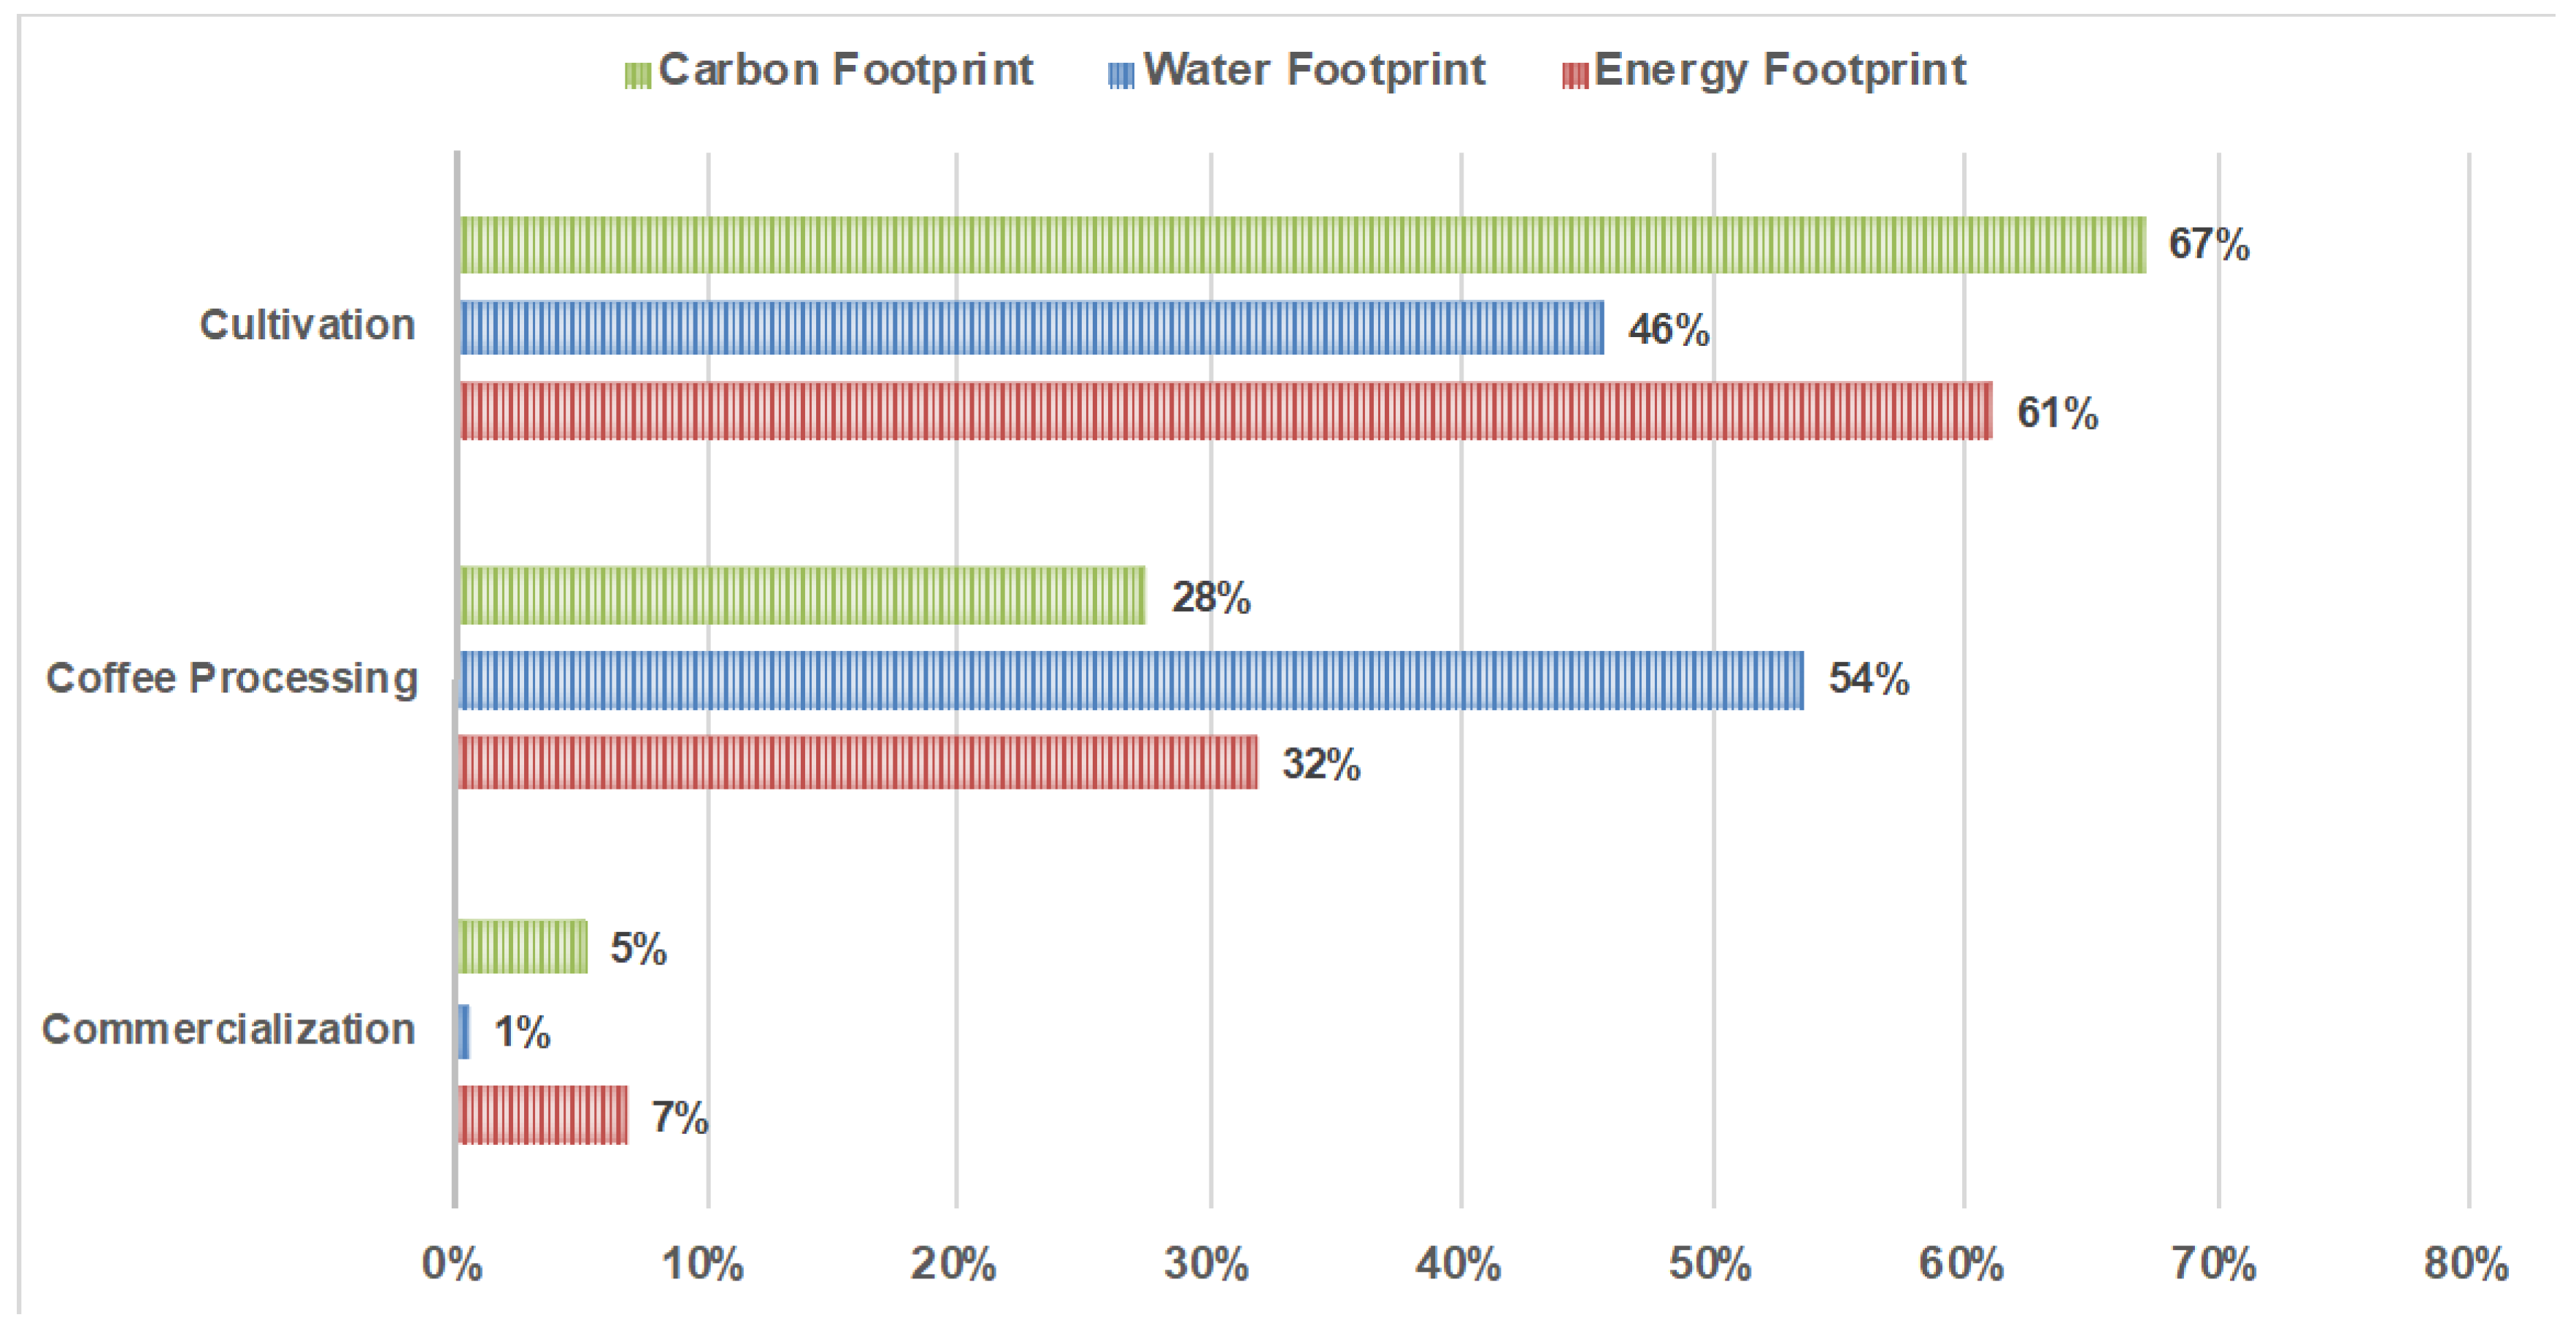
| Carbon Footprint Kg CO2 eq | Water Footprint m3 Water Used | Energy Footprint MJ | ||||
|---|---|---|---|---|---|---|
| S-A | S-B | S-A | S-B | S-A | S-B | |
| Cultivation | 1.89 × 100 | 2.82 × 100 | 43.7 × 10⁻³ | 45.1 × 10⁻³ | 28.50 × 100 | 42.1 × 100 |
| Coffee processing | 1.50 × 100 | 2.82 × 100 | 53.2 × 10⁻³ | 66.9 × 10⁻³ | 2.25 × 100 | 59.0 × 100 |
| Commercialization | 1.58 × 100 | 2.90 × 100 | 53.6 × 10⁻³ | 67.2 × 10⁻³ | 7.05 × 100 | 63.7 × 100 |
© 2018 by the authors. Licensee MDPI, Basel, Switzerland. This article is an open access article distributed under the terms and conditions of the Creative Commons Attribution (CC BY) license (http://creativecommons.org/licenses/by/4.0/).
Share and Cite
Giraldi-Díaz, M.R.; De Medina-Salas, L.; Castillo-González, E.; León-Lira, R. Environmental Impact Associated with the Supply Chain and Production of Grounding and Roasting Coffee through Life Cycle Analysis. Sustainability 2018, 10, 4598. https://doi.org/10.3390/su10124598
Giraldi-Díaz MR, De Medina-Salas L, Castillo-González E, León-Lira R. Environmental Impact Associated with the Supply Chain and Production of Grounding and Roasting Coffee through Life Cycle Analysis. Sustainability. 2018; 10(12):4598. https://doi.org/10.3390/su10124598
Chicago/Turabian StyleGiraldi-Díaz, Mario R., Lorena De Medina-Salas, Eduardo Castillo-González, and Rosario León-Lira. 2018. "Environmental Impact Associated with the Supply Chain and Production of Grounding and Roasting Coffee through Life Cycle Analysis" Sustainability 10, no. 12: 4598. https://doi.org/10.3390/su10124598
APA StyleGiraldi-Díaz, M. R., De Medina-Salas, L., Castillo-González, E., & León-Lira, R. (2018). Environmental Impact Associated with the Supply Chain and Production of Grounding and Roasting Coffee through Life Cycle Analysis. Sustainability, 10(12), 4598. https://doi.org/10.3390/su10124598