Urban Form, Growth, and Accessibility in Space and Time: Anatomy of Land Use at the Parcel-Level in a Small to Medium-Sized American City


Abstract
1. Introduction
2. Material and Methodology
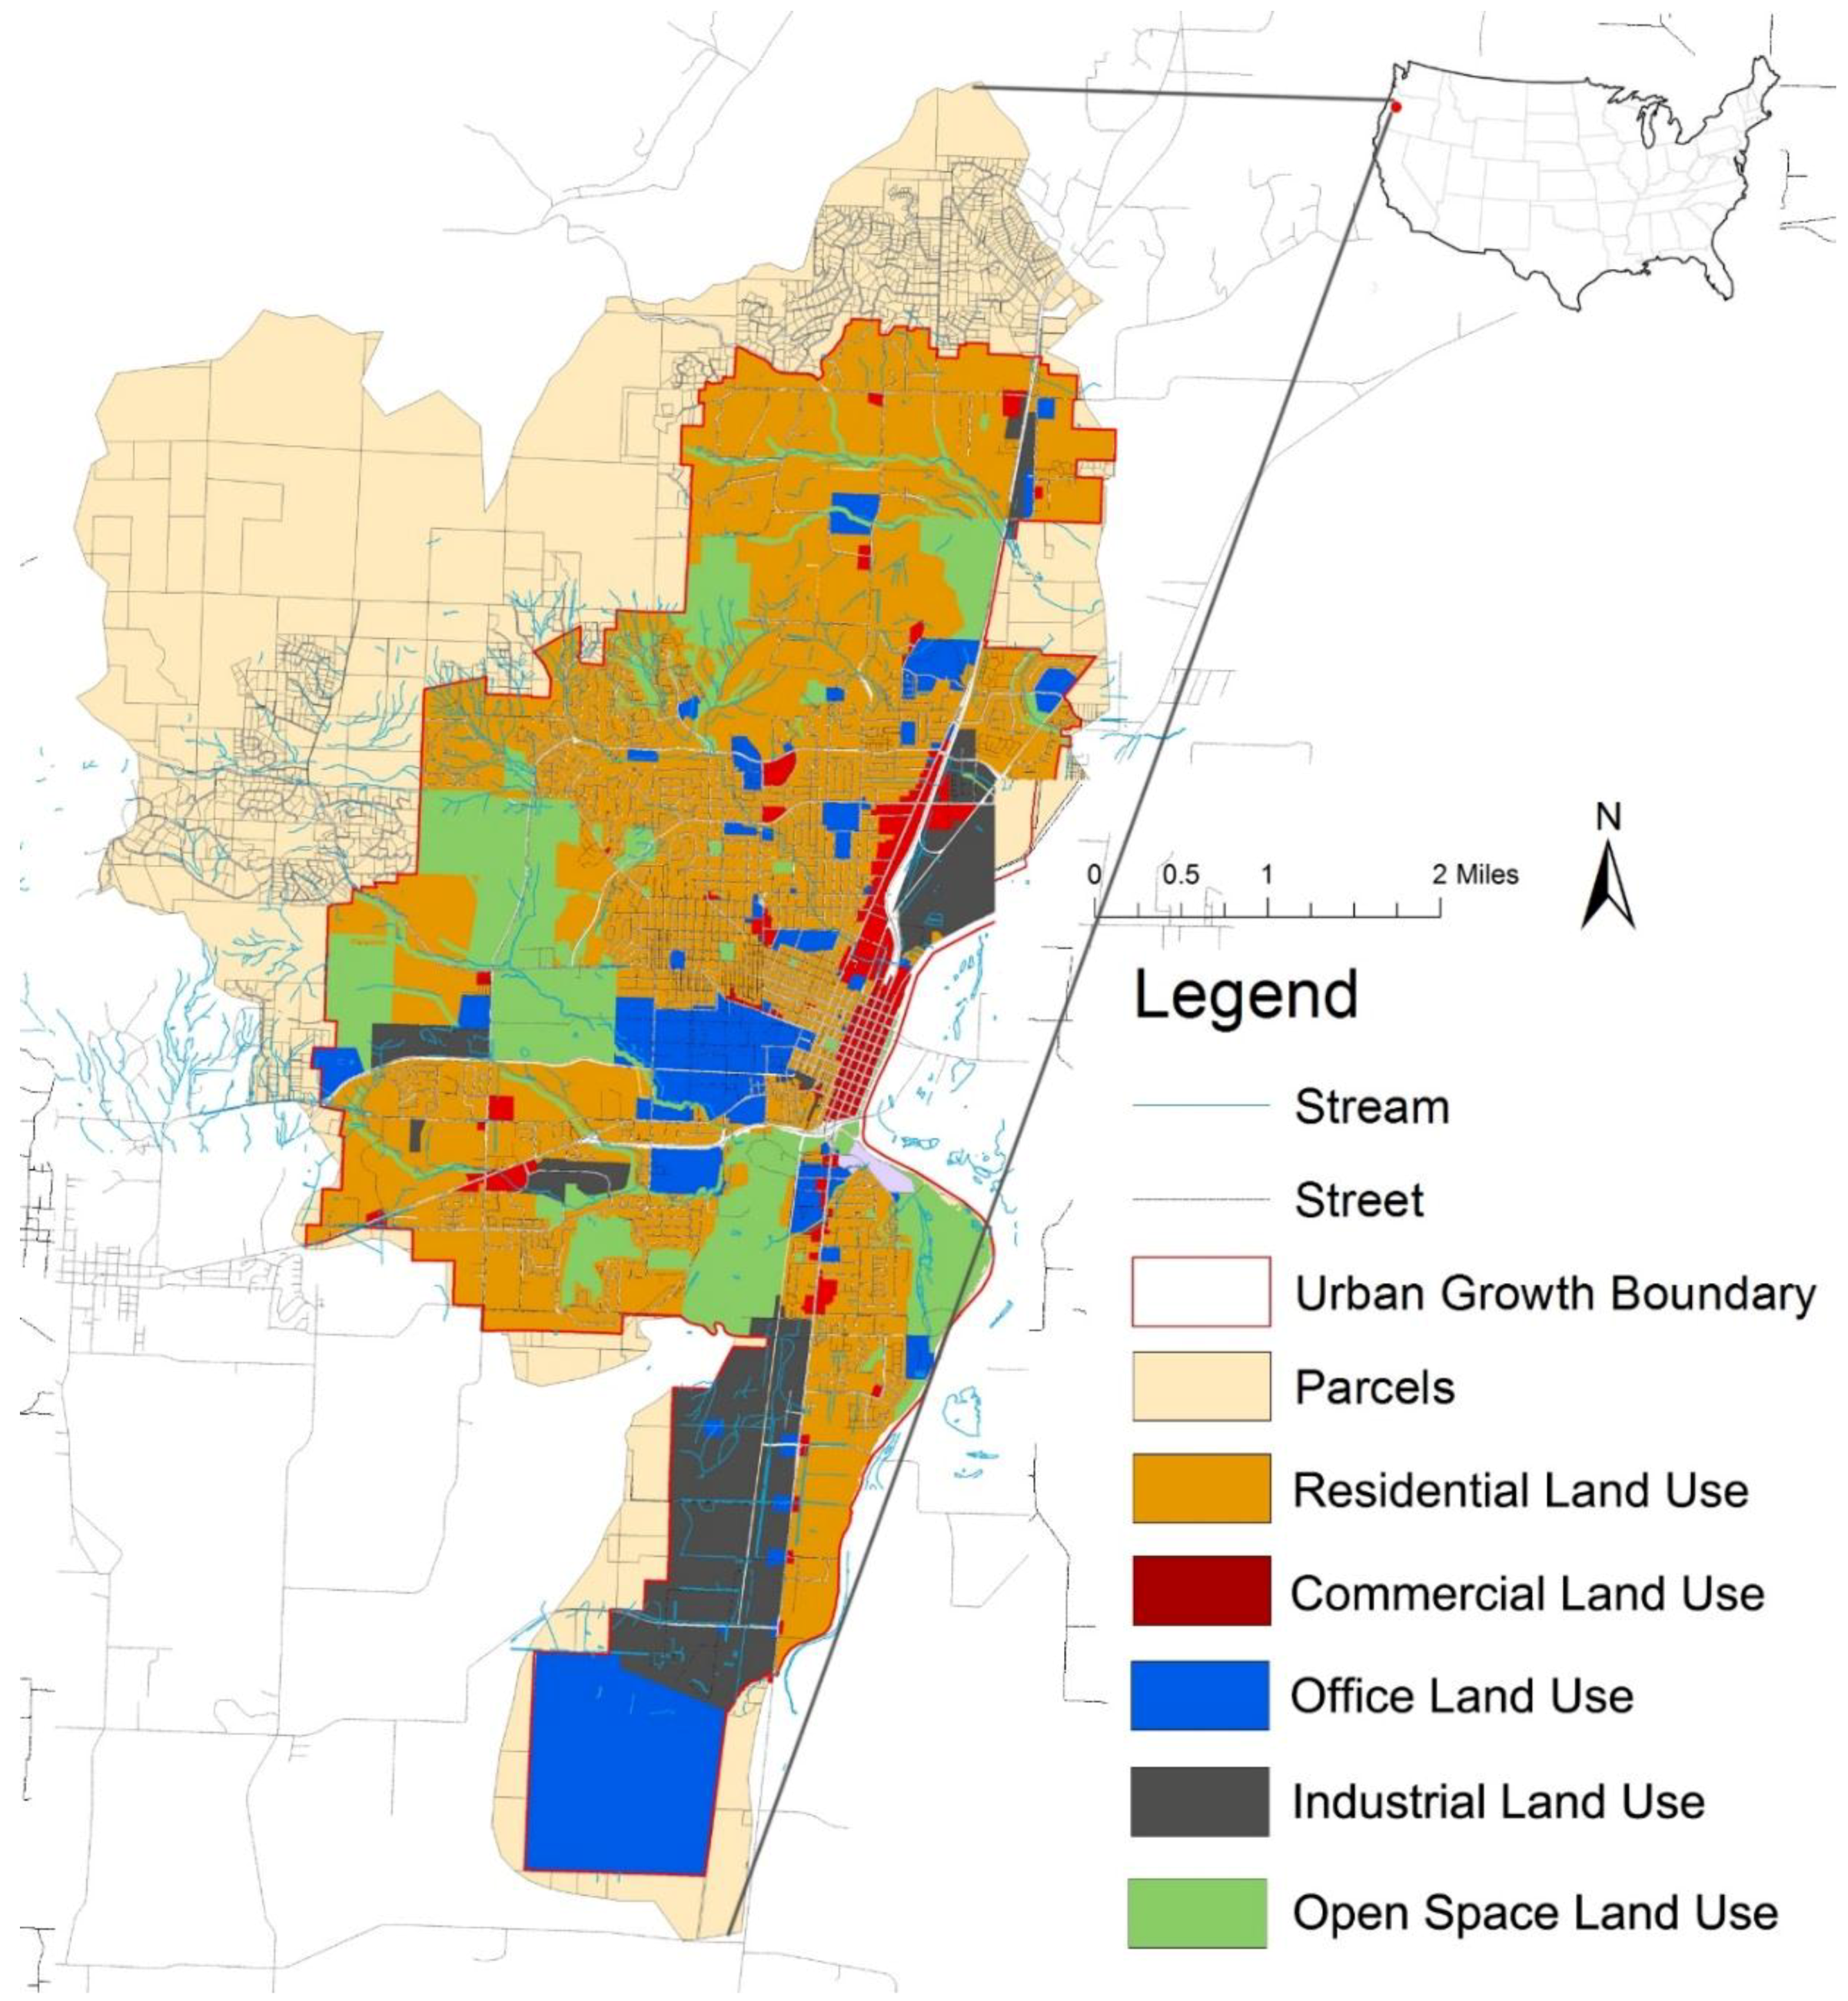
2.1. Study Area
2.2. Urban Form and Growth Model
2.3. Urban Accessibility Model
2.4. Correlation and Regression Models for Urban Form and Accessibility
3. Results and Discussions
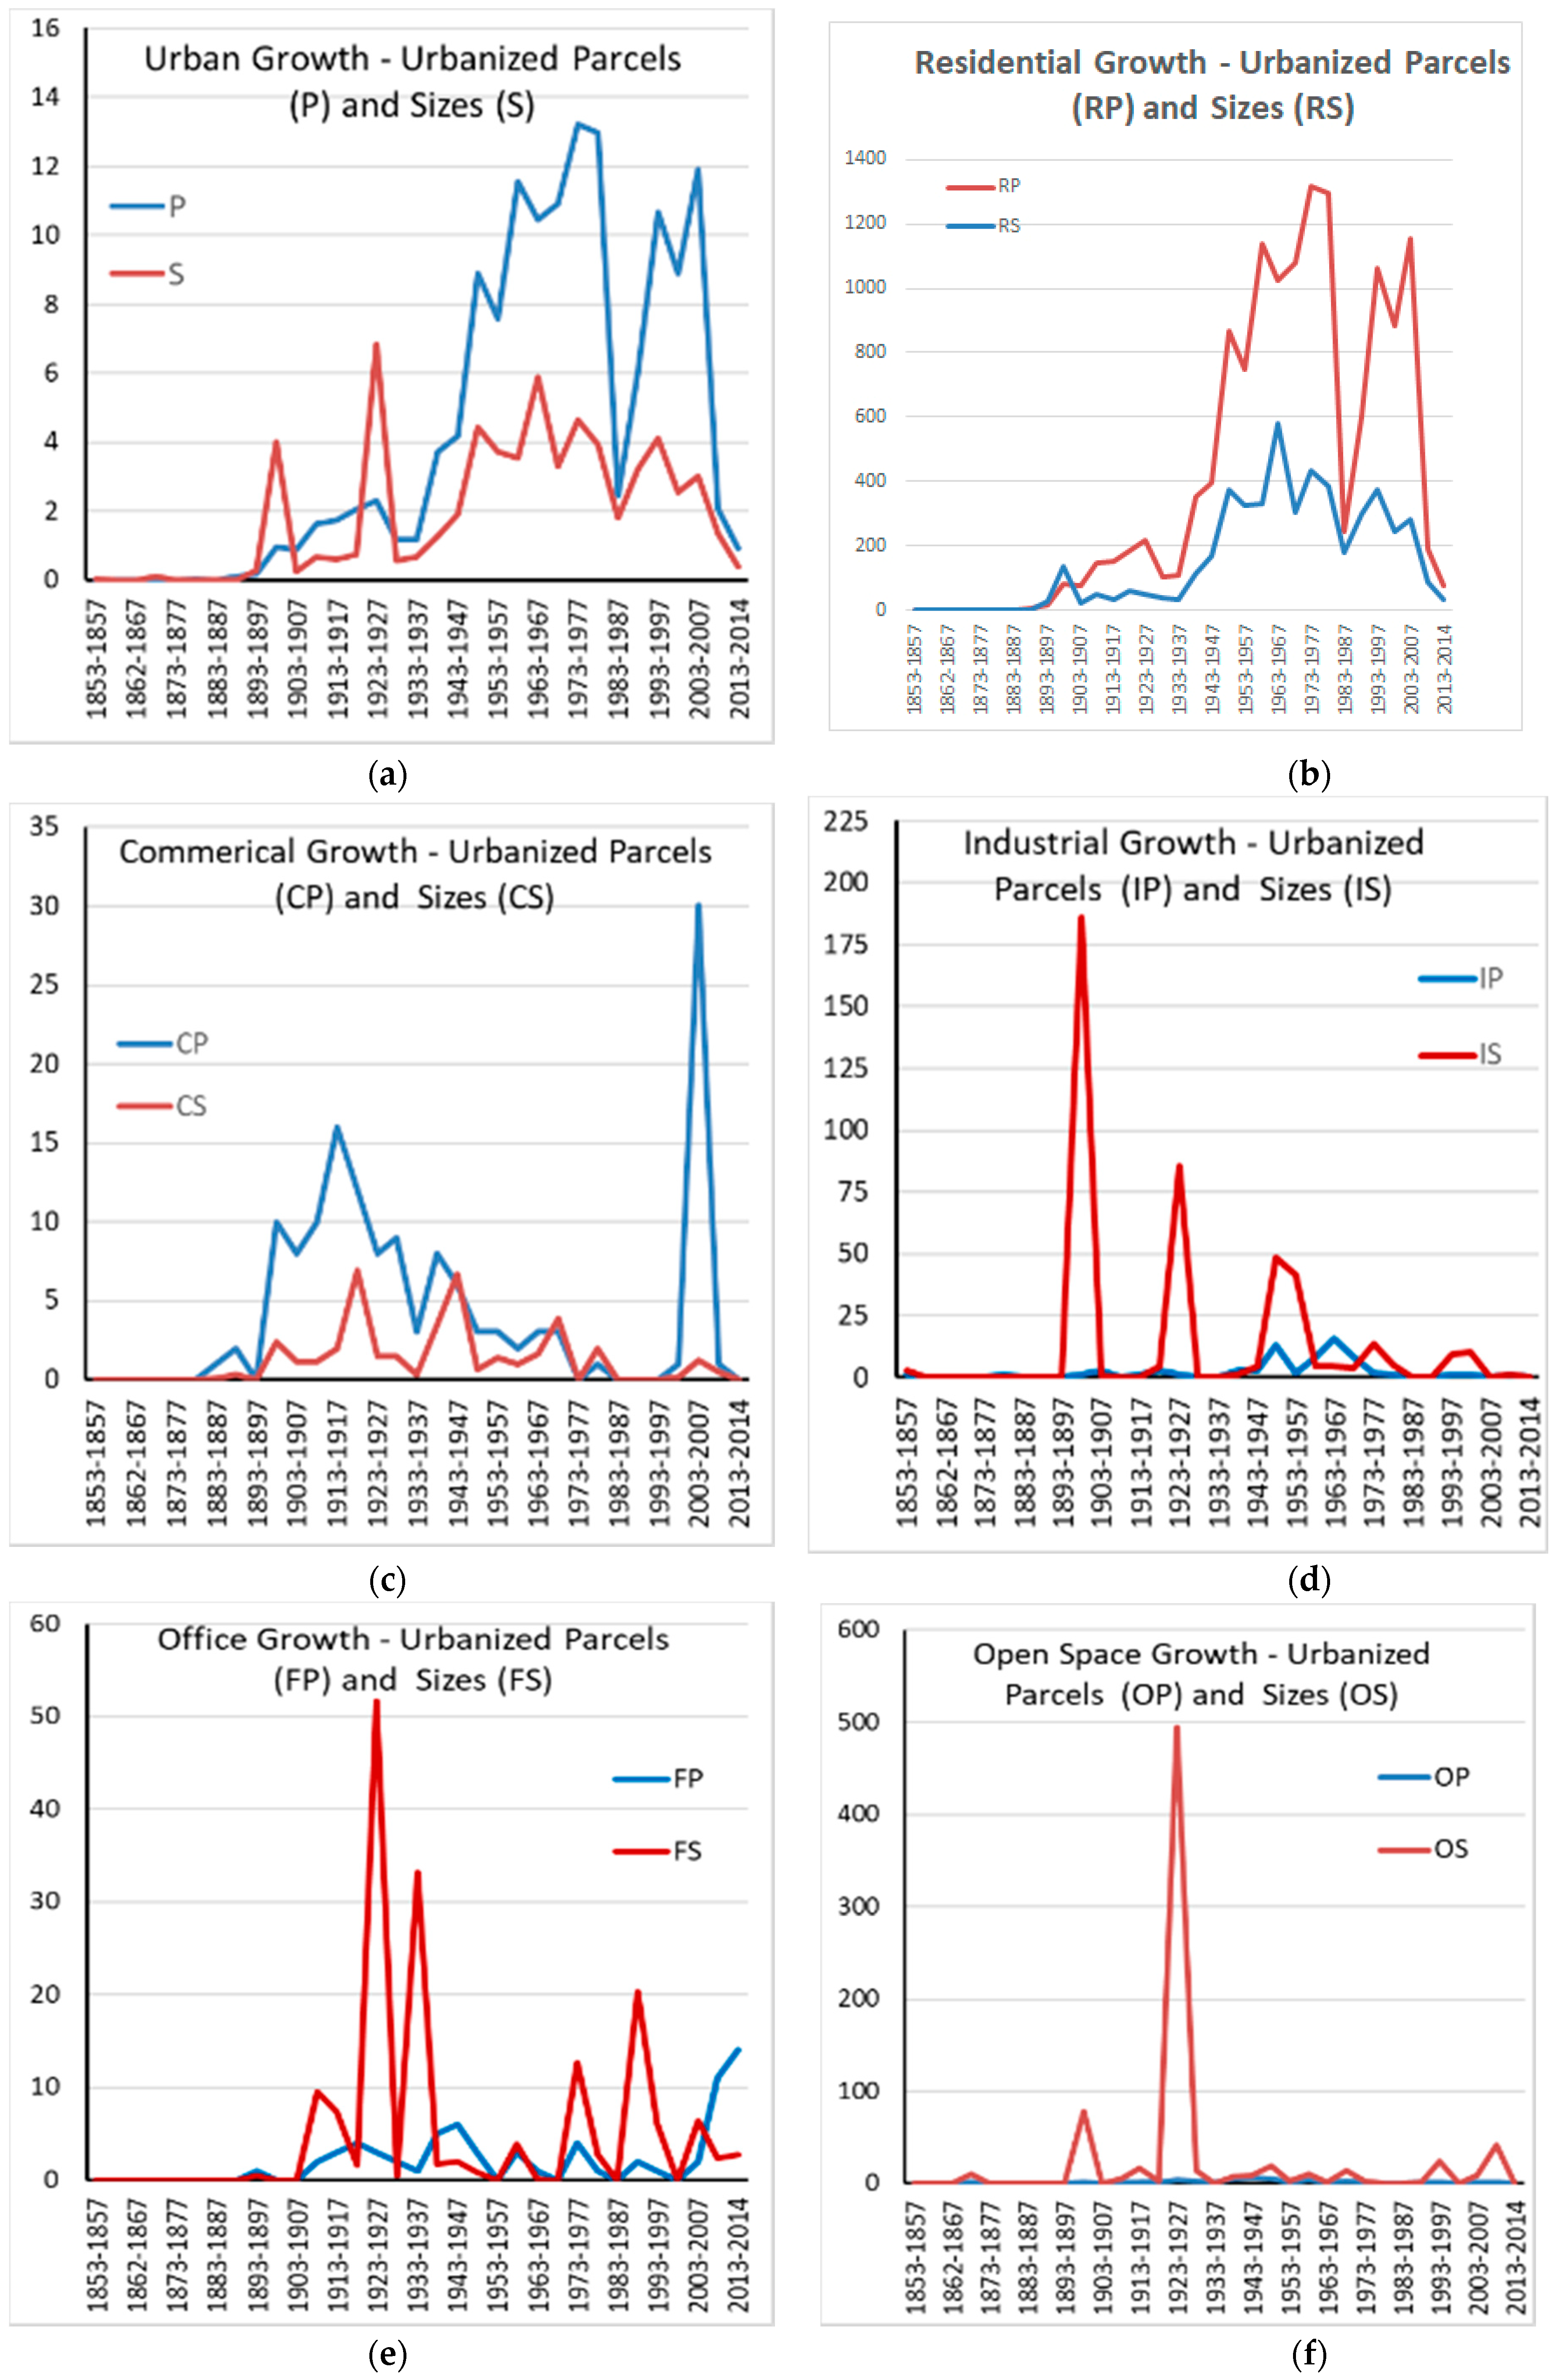
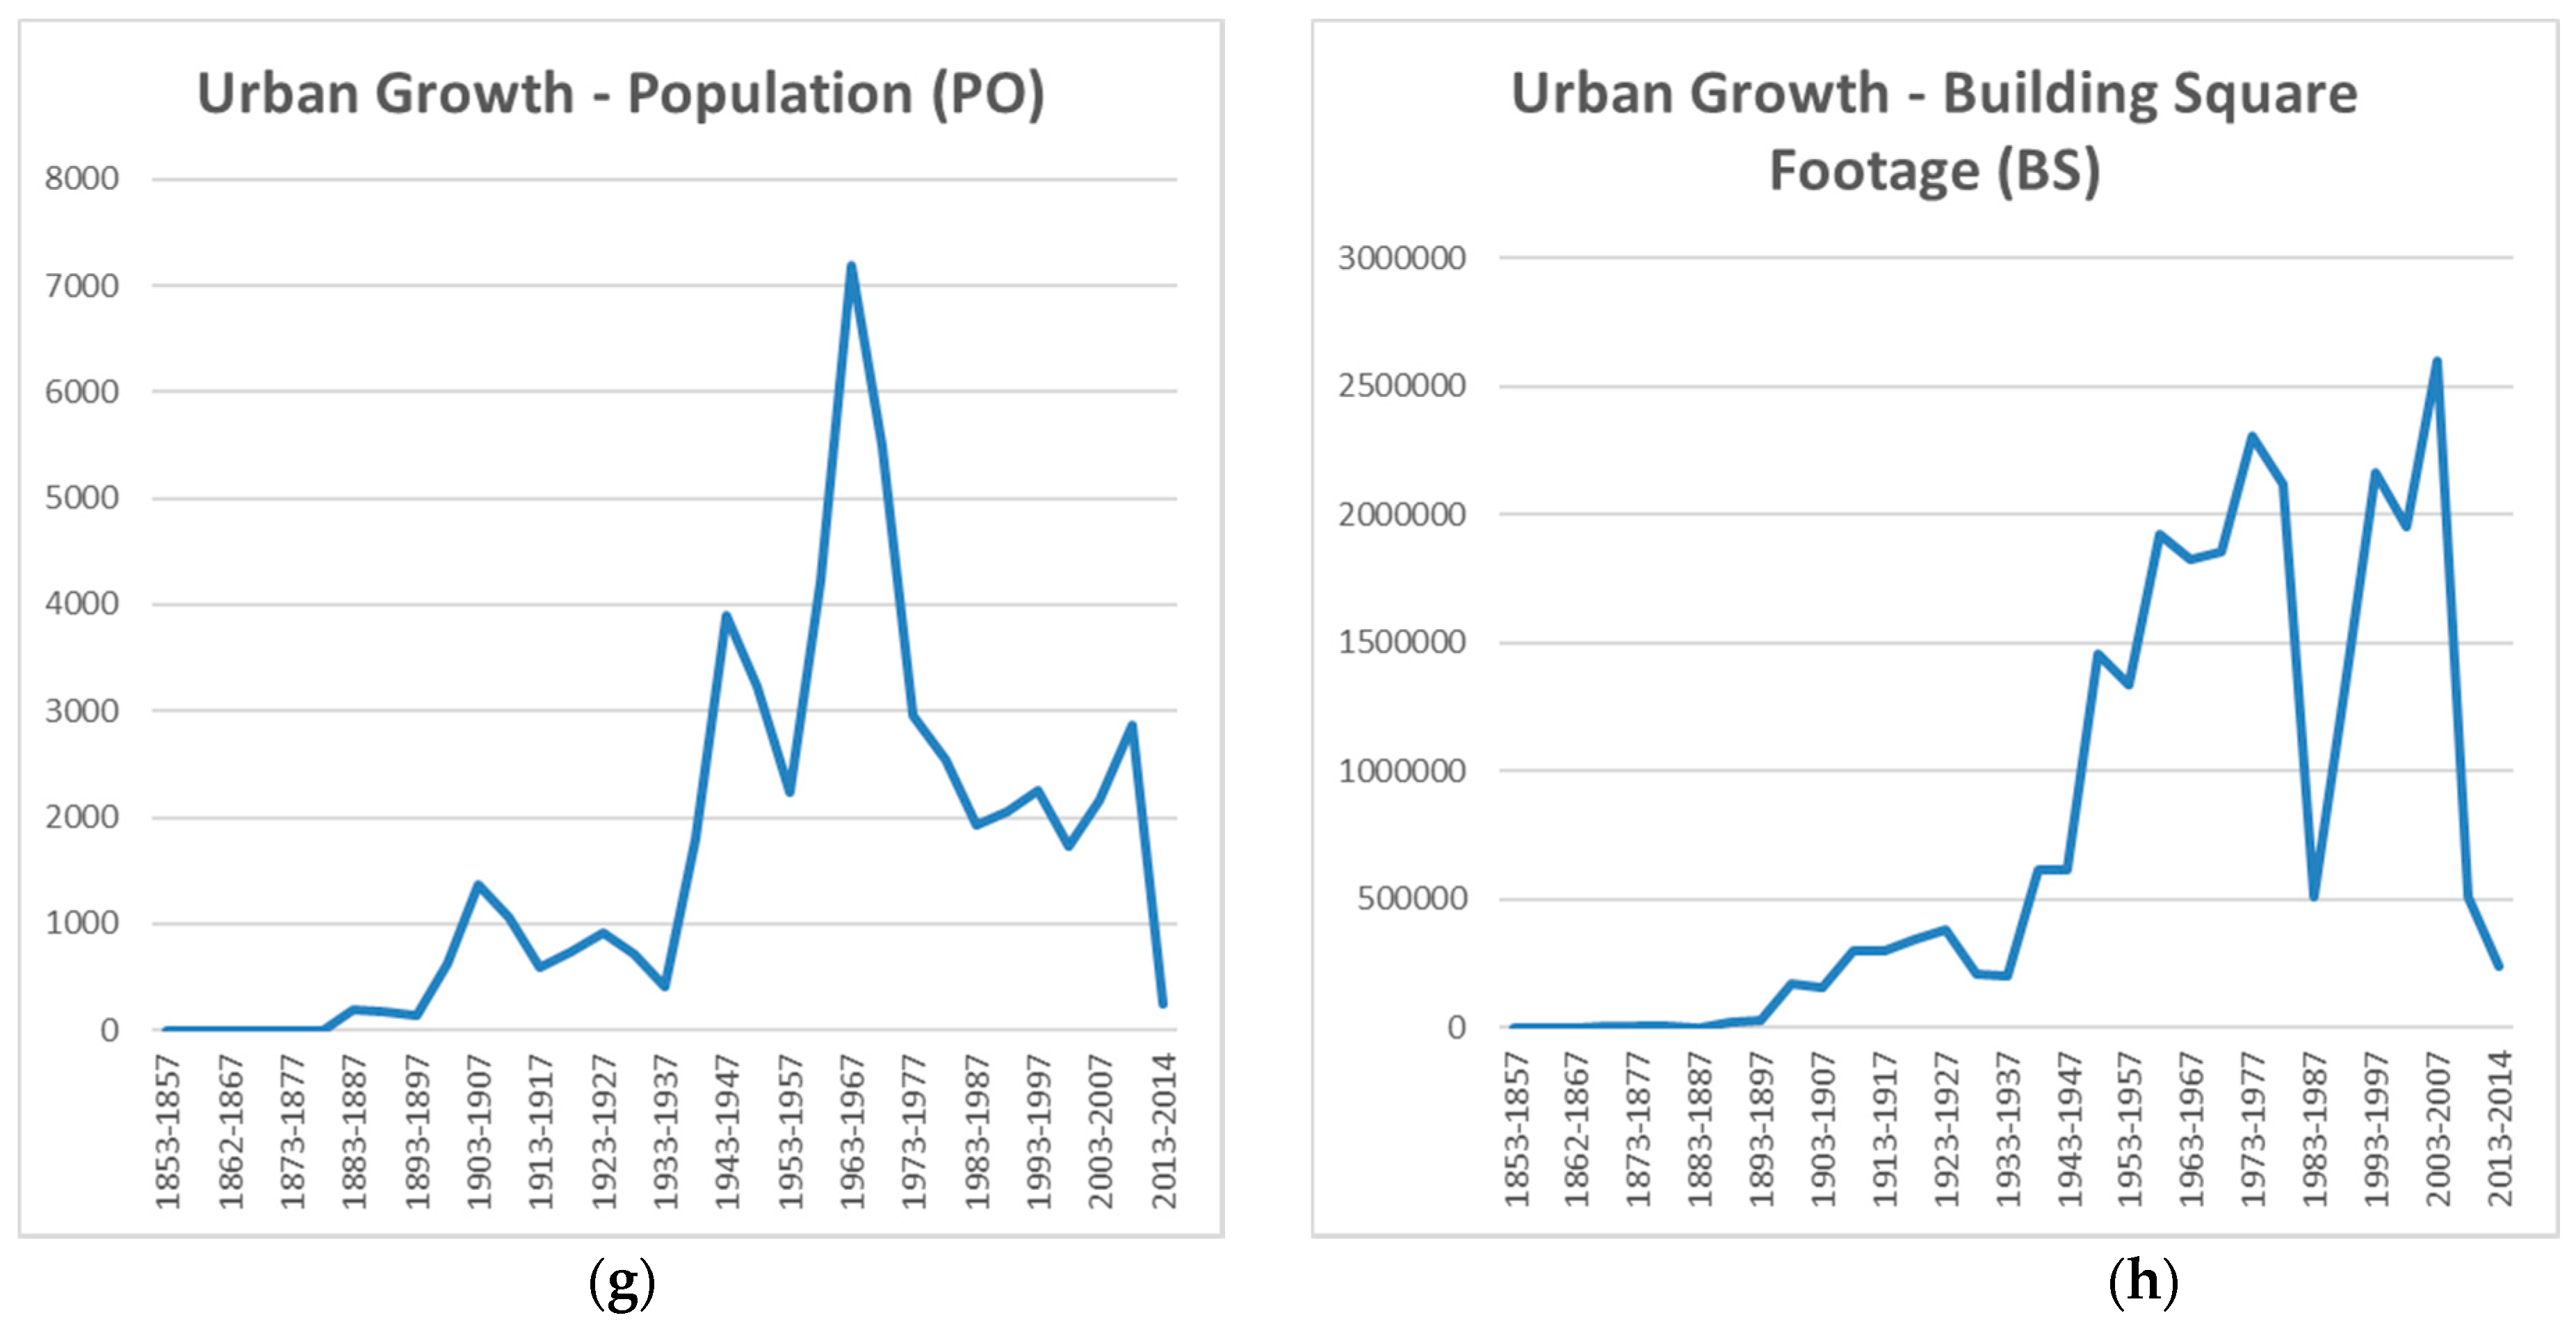
3.1. Urban Growth Patterns and Accessibility Changes
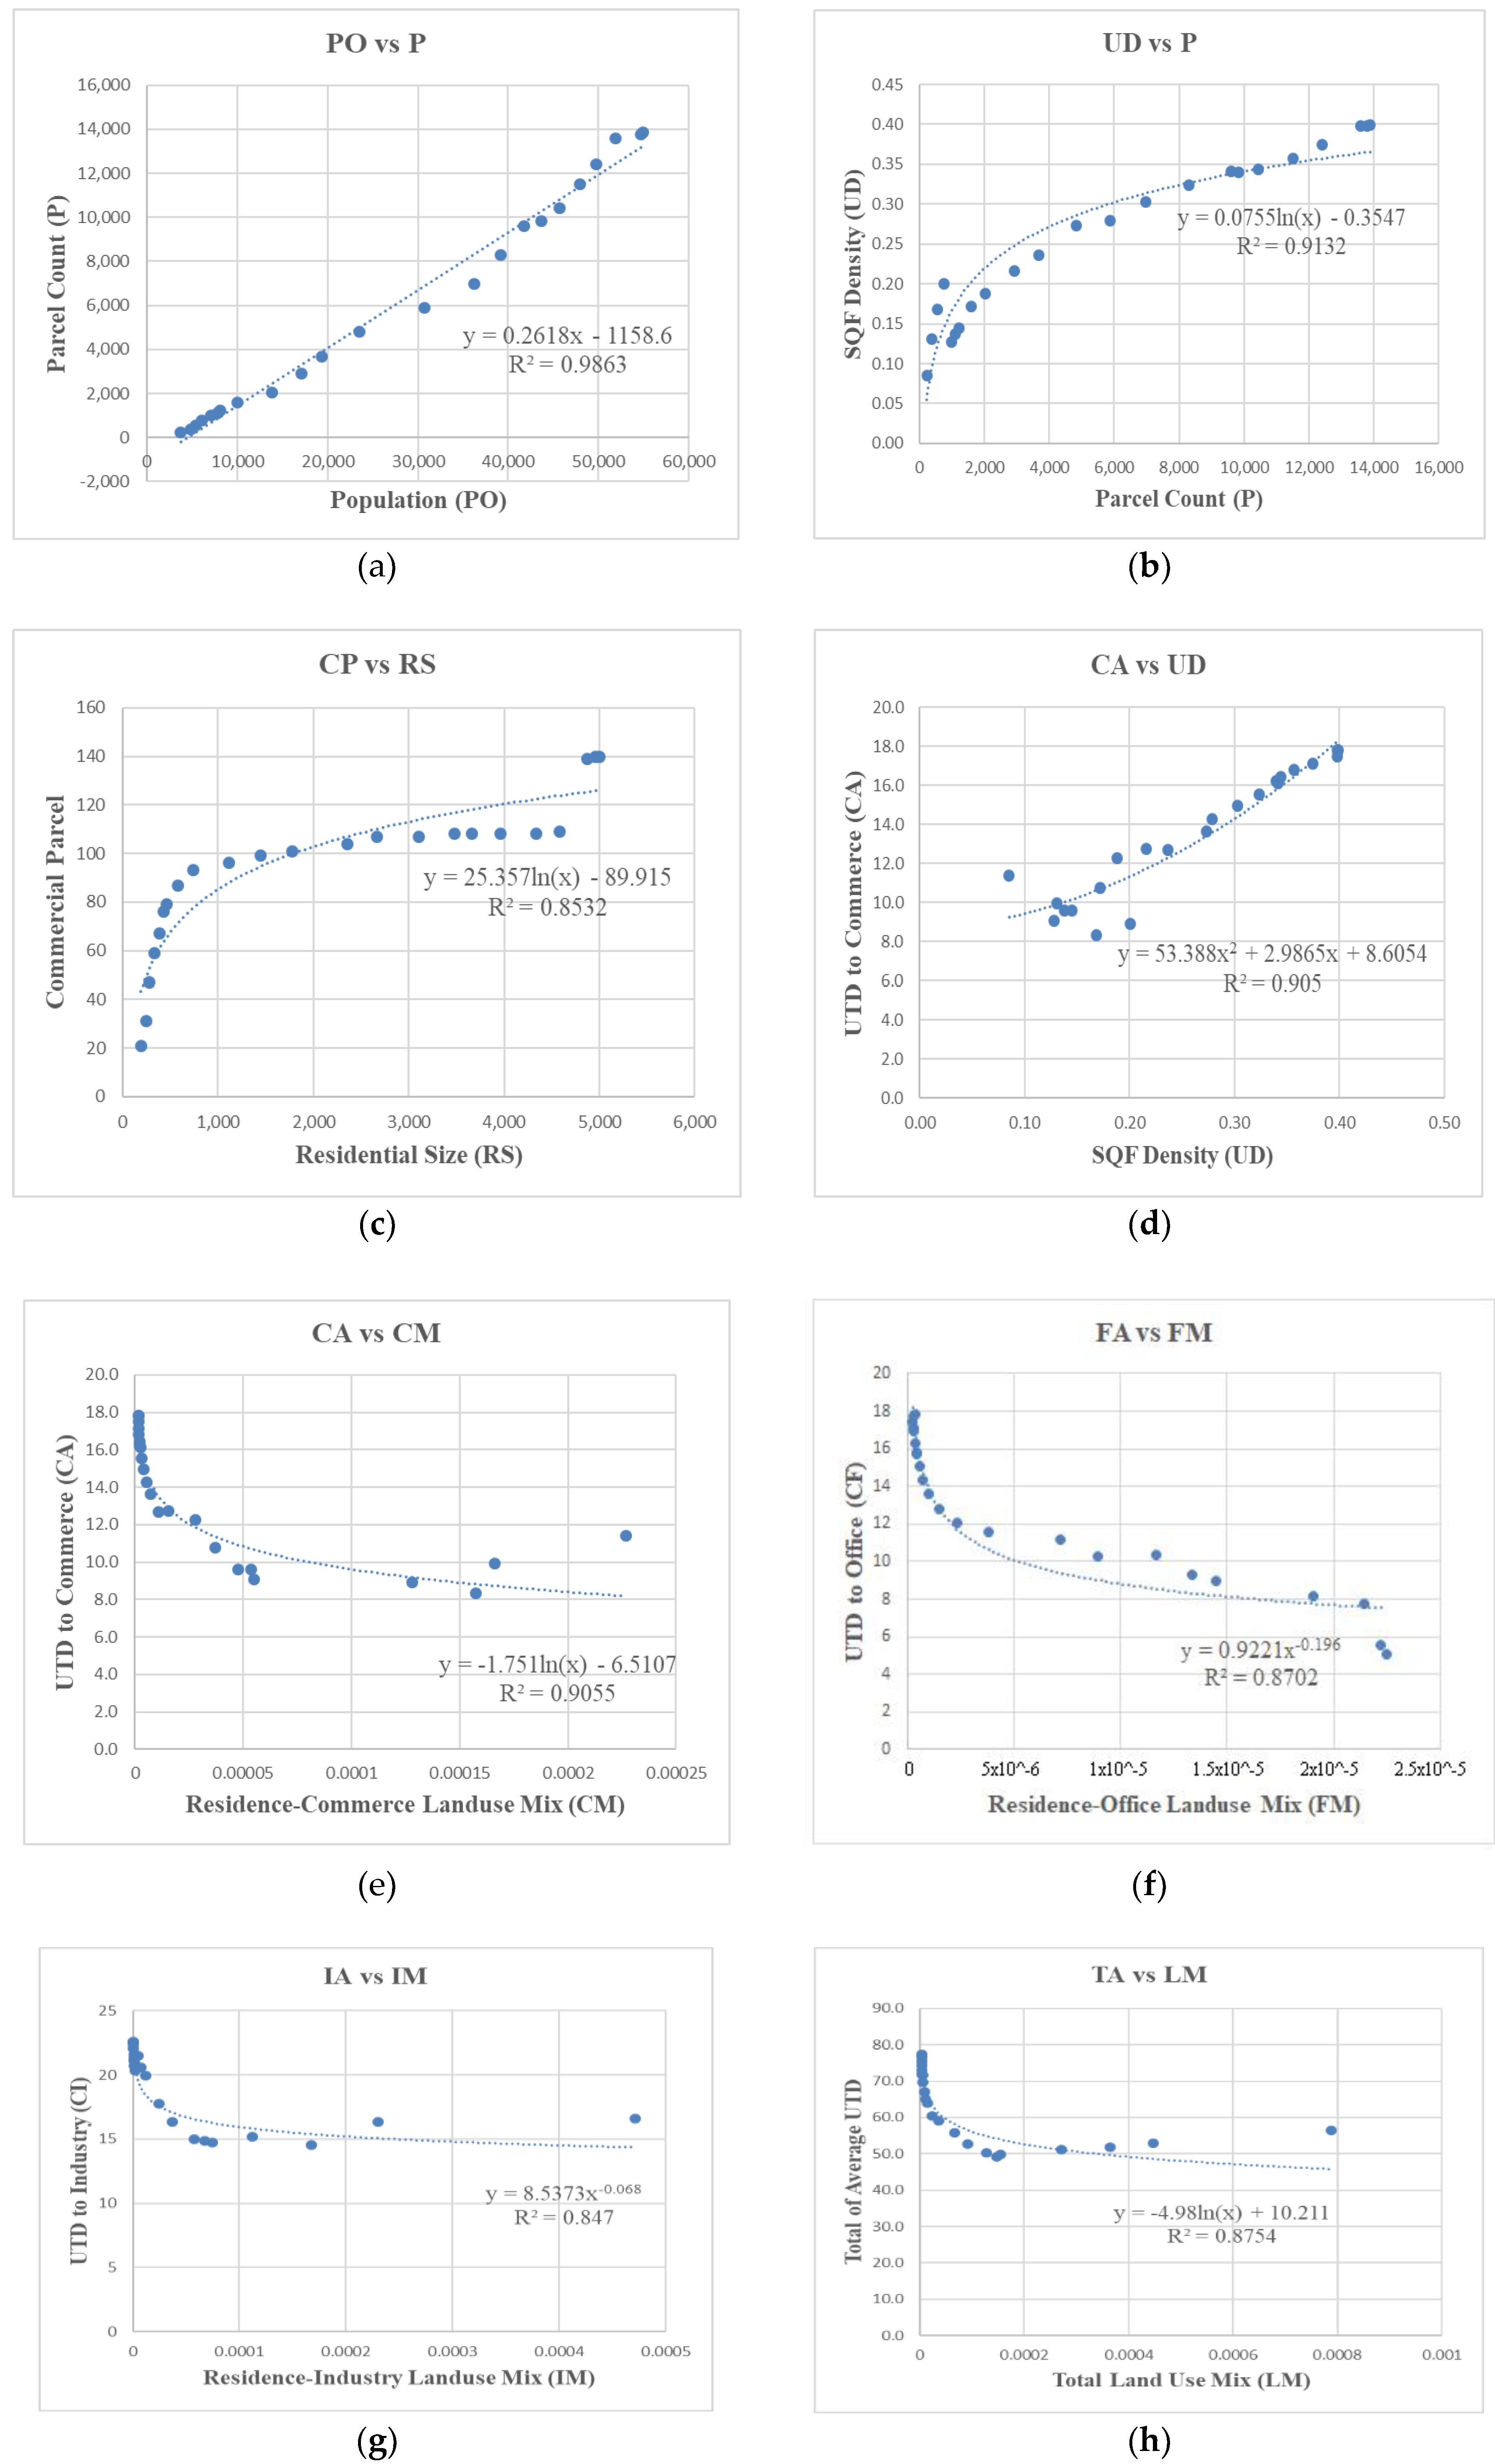
3.2. Relationships between Urban Growth, Accessibility and Form
- (1)
- (2)
- (3)
- (4)
- (5)
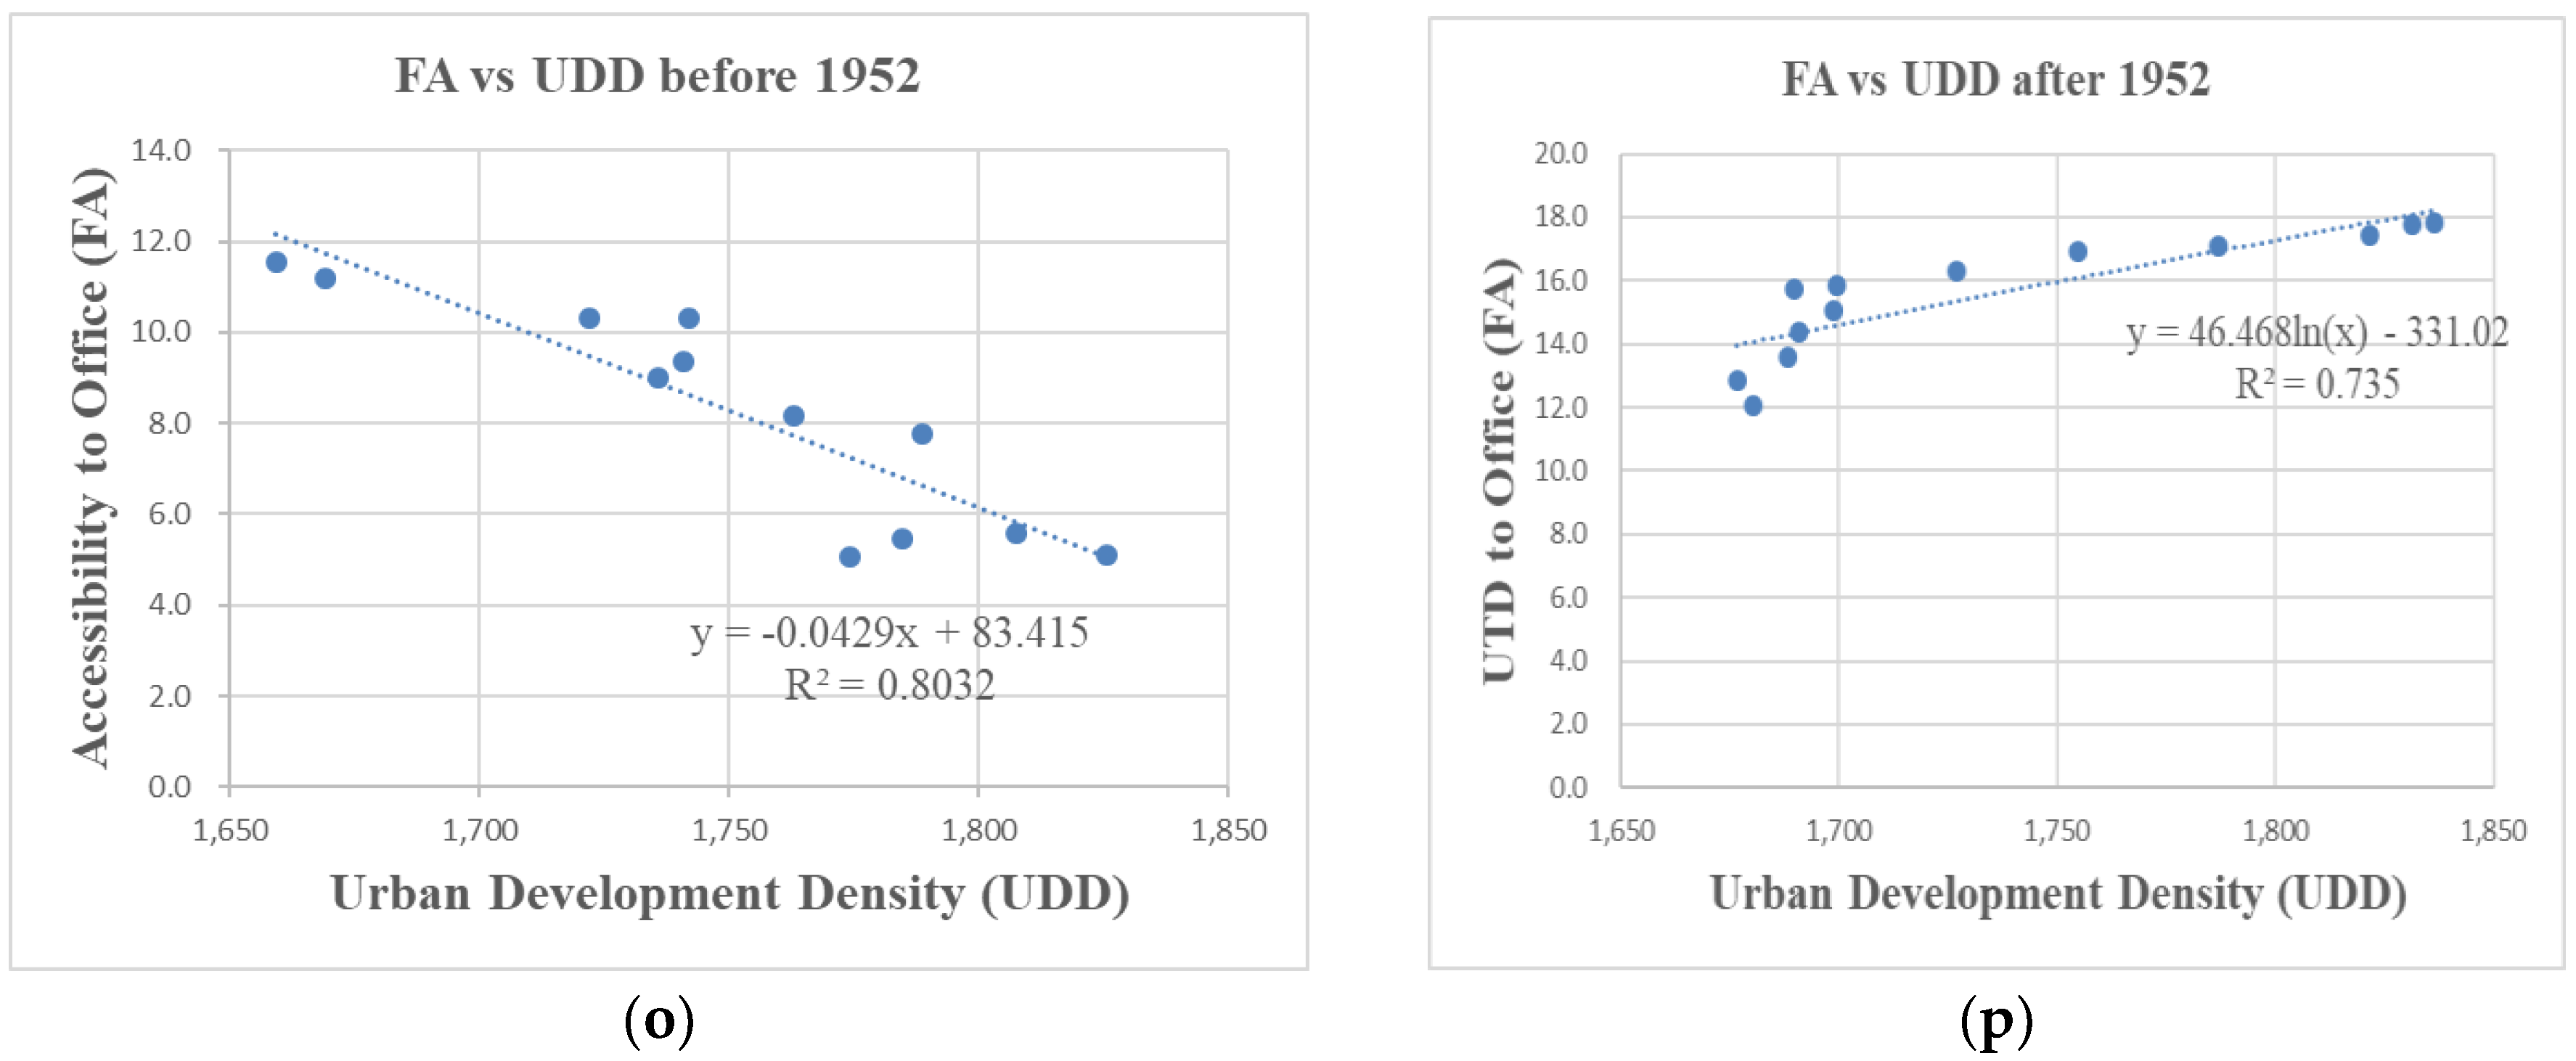
- no relationship (i.e., OS or PD vs. all other variables in Figure 7a and PD vs. UD, AS, CM, IM, FM, OM, LM, IA, FA, OA, and TA in Figure 7b). It is interesting to see that some correlations seem to be bi-modal (i.e., OS vs. all accessibility or IS or FS vs. some accessibility in Figure 7a and OS vs. parcels and OS vs. all values in Figure 7b). Some representative strong correlation patterns are illustrated as enlarged charts in Figure 8, labeled with linear or non-linear R-square values.
4. Conclusions
Author Contributions
Funding
Conflicts of Interest
Appendix A
| AS | Average Urbanized Parcel Size | IV | Improved Value |
| AV | Assessed Value | LM | Residential-Nonresidential Parcels Mix Degree |
| BS | Building Square Footage | LV | Land Value |
| CA | Accessibility of Residential Parcel to Commercial Parcels | MA | Mean Accessibility from Residential to Non-residential Parcels |
| CM | Residential-Commercial Parcels Mix Degree | MV | Market Value |
| CP | Commercial Parcel Number | OA | Accessibility of Residential Parcel to Open Space Parcels |
| CS | Commercial Parcel Size | OM | Residential-Open Space Parcels Mix Degree |
| FA | Accessibility of Residential Parcel to Office Parcels | OP | Open Space Parcel Number |
| FM | Residential-Office Parcels Mix Degree | OS | Open Space Parcel Size |
| FP | Office Parcel Number | P | Total Urbanized Parcels Numbers |
| FS | Office Parcel Size | PD | Population Density |
| IA | Accessibility of Residential Parcel to Industrial Parcels | PO | Population |
| IM | Residential-Industrial Parcels Mix Degree | RP | Residential Parcel Number |
| IP | Industrial Parcel Number | RS | Residential Parcel Size |
| IS | Industrial Parcel Size | S | Total Urbanized Parcels Sizes |
| IV | Improved Value | TA | Accessibility of Residential Parcel to Non-residential Parcels |
| LM | Residential-Nonresidential Parcels Mix Degree | UD | Floor Area Ratio |
References
- Lothrop, J.C.; Lowery, D.L.; Spiess, A.E.; Ellis, C.J. Early Human Settlement of Northeastern North America. PaleoAmerica 2016, 2, 192–251. [Google Scholar] [CrossRef]
- Livability. Top 100 Best Places to Live. 2018. Available online: https://livability.com/best-places/top-100-best-places-to-live/2018 (accessed on 16 April 2018).
- Shahraki, S.Z.; Sauri, D.; Serra, P.; Modugno, S.; Seifolddini, F.; Pourahmad, A. Urban sprawl pattern and land-use change detection in Yazd, Iran. Habitat Int. 2011, 35, 521–528. [Google Scholar] [CrossRef]
- Center for International Earth Science Information Network (CIESIN). Gridded Population of the World: Land and Water Area. 2010. Available online: https://doi.org/10.7927/H4Z03642 (accessed on 8 June 2018).
- UN Habitat. Planning and Design for Sustainable Urban Mobility: Global Report on Human Settlements 2013. 2013. Available online: https://unhabitat.org/planning-and-design-for-sustainable-urban-mobility-global-report-on-human-settlements-2013/ (accessed on 6 May 2018).
- Nam, K.; Lim, U.; Kim, B.H.S. ‘Compact’ or ‘Sprawl’ for sustainable urban form? Measuring the effect on travel behavior in Korea. Ann. Reg. Sci. 2012, 49, 157–173. [Google Scholar] [CrossRef]
- Zhao, P.J. Sustainable urban expansion and transportation in a growing megacity: Consequences of urban sprawl for mobility on the urban fringe of Beijing. Habitat Int. 2010, 34, 236–243. [Google Scholar] [CrossRef]
- Tana Kwan, M.P.; Chai, Y.W. Urban form, car ownership and activity space in inner suburbs: A comparison between Beijing (China) and Chicago (United States). Urban Stud. 2016, 53, 1784–1802. [Google Scholar] [CrossRef]
- Chen, Y.J.; Akar, G. Using trip chaining and joint travel as mediating variables to explore the relationships among travel behavior, socio-demographics, and urban form. J. Transp. Land Use 2017, 10, 573–588. [Google Scholar] [CrossRef]
- Scheiner, J. Social inequalities in travel behaviour: Trip distances in the context of residential self-selection and lifestyles. J. Transp. Geogr. 2010, 18, 679–690. [Google Scholar] [CrossRef]
- Steiner, J.F. Mitaka, from Village to Suburban City: A Study of Tokyo’s Urban Fringe: A Condensed English Version; Rural Welfare Research Institute: Tokyo, Japan, 1957; ASIN B0006D0LLO.
- Sykora, L.; Mulicek, O. Territorial arrangements of small and medium-sized towns from a functional-spatial perspective. Tijdschr. Econ. Soc. Geogr. 2017, 108, 438–455. [Google Scholar] [CrossRef]
- Cox, E.; Longlands, S. The Role of Small and Medium-Sized Towns and Cities in Growing the Northern Powerhouse. 2016. Available online: https://www.ippr.org/files/publications/pdf/city-systems_June2016.pdf (accessed on 16 July 2018).
- Wang, Y.; Jin, C.; Lu, M.Q.; Lu, Y.Q. Assessing the suitability of regional human settlements environment from a different preferences perspective: A case study of Zhejiang Province, China. Habitat Int. 2017, 70, 1–12. [Google Scholar] [CrossRef]
- Jacob, J. The Economy of Cities; Random House: New York, NY, USA, 1970; ISBN 9780525432869. [Google Scholar]
- Mumford, L. The natural history of urbanization. In Man’s Role in Changing the Face of the Earth; Thomas, E.L., Ed.; University of Chicago Press: Chicago, IL, USA, 1956; pp. 386–397. ISBN 9780758153319. [Google Scholar]
- Yue, W.Z.; Zhang, L.L.; Liu, Y. Measuring sprawl in large Chinese cities along the Yangtze River via combined single and multidimensional metrics. Habitat Int. 2016, 57, 43–52. [Google Scholar] [CrossRef]
- Lefebvre, H. Le Manifeste Différentialiste [Differentialist Manifesto]; Gallimard: Paris, France, 1970; ISBN 9782072419355. [Google Scholar]
- Ewing, R.; Cervero, R. Travel and the built environment. J. Am. Plan. Assoc. 2010, 76, 265–294. [Google Scholar] [CrossRef]
- Frank, L.D.; Engelke, P.O. The built environment and human activity patterns: Exploring the impacts of urban form on public health. J. Plan. Lit. 2001, 16, 202–218. [Google Scholar] [CrossRef]
- Hao, P.; Geertman, S.; Hooimeijer, P.; Sliuzas, R. The land-use diversity in urban villages in Shenzhen. Environ. Plan. A 2012, 44, 2742–2764. [Google Scholar] [CrossRef]
- Wu, J.S.; Ma, L.; Li, W.F.; Peng, J.; Liu, H. Dynamics of urban density in China: Estimations based on DMSP/OLS nighttime light data. J. Sel. Top. Appl. Earth Obs. Remote Sens. 2014, 7, 4226–4275. [Google Scholar] [CrossRef]
- Noland, R.B.; Karathodorou, N.; Graham, D. Estimating the effect of urban density on fuel demand. Energy Econ. 2010, 32, 86–92. [Google Scholar] [CrossRef]
- Coutts, A.M.; Beringer, J.; Tapper, N. Impact of increasing urban density on local climate: Spatial and temporal variations in the surface energy balance in Melbourne, Australia. J. Appl. Meteorol. Clim. 2007, 46, 477–493. [Google Scholar] [CrossRef]
- Titman, S.; Twite, G. Urban density, law and the duration of real estate leases. J. Urban Econ. 2013, 74, 99–112. [Google Scholar] [CrossRef]
- Song, Y.; Shao, G.F.; Song, X.D.; Liu, Y.; Pan, L.; Ye, H. The relationships between urban form and urban commuting: An empirical study in China. Sustainability 2017, 9, 17. [Google Scholar] [CrossRef]
- Naess, P. New urbanism or metropolitan-level centralization? A comparison of the influences of metropolitan-level and neighborhood-level urban form characteristics on travel behavior. J. Transp. Land Use 2011, 4, 25–44. [Google Scholar] [CrossRef]
- Gehrke, S.R.; Clifton, K.J. Operationalizing land use diversity at varying geographic scales and its connection to mode choice evidence from Portland, Oregon. Transp. Res. Rec. 2014, 2453, 128–136. [Google Scholar] [CrossRef]
- Bahadure, S.; Kotharkar, R. Assessing sustainability of mixed use neighborhoods through residents’ travel behavior and perception: The case of Nagpur, India. Sustainability 2015, 7, 12164–12189. [Google Scholar] [CrossRef]
- Lewis, S. Neighborhood density and travel mode: New survey findings for high densities. Int. J. Sustain. Dev. World 2018, 25, 152–165. [Google Scholar] [CrossRef]
- Zhou, L.; Shen, G.Q.; Woodfin, T.; Chen, T.; Song, K. Ecological and economic impacts of green roofs and permeable pavements at the city level: The case of Corvallis, Oregon. J. Environ. Plan. Manag. 2017, 61, 430–450. [Google Scholar] [CrossRef]
- Frank, L.D.; Pivo, G. Impact of Mixed Use and Density on Three Modes of Travel: Single-Occupant Vehicle, Transit, Walking. Available online: http://citeseerx.ist.psu.edu/viewdoc/download?doi=10.1.1.368.4497&rep=rep1&type=pdf (accessed on 22 November 2018).
- Sanchez, T.W. The connection between public transit and employment—The cases of Portland and Atlanta. J. Am. Plan. Assoc. 1999, 65, 284–296. [Google Scholar] [CrossRef]
- Levine, J. Rethinking accessibility and jobs-housing balance. J. Am. Plan. Assoc. 1998, 64, 133–149. [Google Scholar] [CrossRef]
- Anderson, W.P.; Kanaroglou, P.S.; Miller, E.J. Urban form, energy and the environment: A review of issues, evidence and policy. Urban Stud. 1996, 33, 7–35. [Google Scholar] [CrossRef]
- Bhat, C.; Handy, S.; Kockelman, K.; Mahmassani, H.; Chen, Q.L.; Weston, L. Urban Accessibility Index: Literature Review. 2000. Available online: http://ctr.utexas.edu/wp-content/uploads/pubs/4938_1.pdf (accessed on 16 November 2018).
- Niedzielski, M.A.; Boschmann, E. Travel Time and Distance as Relative Accessibility in the journey to work. Ann. Assoc. Am. Geogr. 2014, 104, 1156–1182. [Google Scholar] [CrossRef]
- Holz-Rau, C.; Scheiner, J.; Sicks, K. Travel distances in daily travel and long-distance travel: What role is played by urban form? Environ. Plan. A 2014, 46, 488–507. [Google Scholar] [CrossRef]
- Boussauw, K.; Witlox, F. Linking expected mobility production to sustainable residential location planning: Some evidence from Flanders. J. Transp. Geogr. 2011, 19, 936–942. [Google Scholar] [CrossRef]
- Zhou, L.; Wu, Y.; Woodfin, T.; Zhu, R.; Chen, T. An approach to evaluate comprehensive plan and identify priority lands for future land use development to conserve more ecological values. Sustainability 2018, 10, 126. [Google Scholar] [CrossRef]
- Maat, K.; Timmermans, J.P. A causal model relating urban form with daily travel distance through activity/travel decisions. Transp. Plan. Technol. 2009, 32, 115–134. [Google Scholar] [CrossRef]
- Pan, H.X.; Shen, Q.; Zhang, M. Influence of urban form on travel behaviour in four neighbourhoods of Shanghai. Urban Stud. 2009, 46, 275–294. [Google Scholar] [CrossRef]
- Schlossberg, M.; Greene, J.; Phillips, P.P.; Johnson, B.; Parker, B. School trips—Effects of urban form and distance on travel mode. J. Am. Plan. Assoc. 2006, 72, 337–346. [Google Scholar] [CrossRef]
- Grosse, J.; Olafsson, A.S.; Carstensen, T.A.; Fertner, C. Exploring the role of daily “modality styles” and urban structure in holidays and longer weekend trips: Travel behaviour of urban and peri-urban residents in Greater Copenhagen. J. Transp. Geogr. 2018, 69, 138–149. [Google Scholar] [CrossRef]
- Corvallis OR. Storm Water Master Plan. 2002. Available online: http://www.corvallisoregon.gov/index.aspx?page=128 (accessed on 2 May 2018).
- Dempsey, J.A.; Plantinga, A.J. How well do urban growth boundaries contain development? Results for Oregon using a difference-in-difference estimator. Reg. Sci. Urban Econ. 2013, 43, 996–1007. [Google Scholar] [CrossRef]
- U.S. Bureau of the Census. State and Country QuickFacts. 2017. Available online: https://www.census.gov/quickfacts/fact/table/US/PST045217 (accessed on 18 April 2018).
- Corvallis OR. City of Corvallis Land Development Code. 2006. Available online: http://www.corvallisoregon.gov/modules/showdocument.aspx?documentid=8772 (accessed on 18 May 2018).
- Corvallis OR. GIS Data—Download. 2014. Available online: https://www.corvallisoregon.gov/it/page/gis-data-download (accessed on 6 May 2018).
- McKenzie, B. Who Drives to Work? Commuting by Automobile in the United States: 2013. 2015. Available online: https://www.census.gov/content/dam/Census/library/publications/2015/acs/acs-32.pdf (accessed on 17 November 2018).
- ESRI. OD Cost Matrix Analysis. 2018. Available online: http://desktop.arcgis.com/en/arcmap/latest/extensions/network-analyst/od-cost-matrix.htm (accessed on 17 November 2018).
- Bayulken, B.; Huisingh, D. A literature review of historical trends and emerging theoretical approaches for developing sustainable cities (part 1). J. Clean. Prod. 2015, 109, 11–24. [Google Scholar] [CrossRef]
- Joyanna, M. Recent trends in unemployment and the labor force, 10 countries. 1985. Available online: https://www.bls.gov/opub/mlr/1985/08/art2full.pdf (accessed on 20 November 2018).
- Hodgson, G.M. The great crash of 2008 and the reform of economics. Camb. J. Econ. 2009, 33, 1205–1221. [Google Scholar] [CrossRef]
- Cervero, R. Mixed land-uses and commuting: Evidence from the American housing survey. Transp. Res. A 1996, 30, 361–377. [Google Scholar] [CrossRef]
- Szczygiel, B. “City beautiful” revisited—An analysis of nineteenth-century civic improvement efforts. J. Urban Hist. 2003, 29, 107–132. [Google Scholar] [CrossRef]
- Martinez-Fernandez, C.; Audirac, I.; Fol, S.; Cunningham-Sabot, E. Shrinking cities: Urban challenges of globalization. Int. J. Urban Reg. 2012, 36, 213–225. [Google Scholar] [CrossRef]
- Kim, S. Industrialization and urbanization: Did the steam engine contribute to the growth of cities in the United States? Explor. Econ. Hist. 2005, 42, 586–598. [Google Scholar] [CrossRef]
- Brown, J.R.; Morris, E.A.; Taylor, B.D. Planning for cars in cities: Planners, engineers, and freeways in the 20th Century. J. Am. Plan. Assoc. 2009, 75, 161–177. [Google Scholar] [CrossRef]
- Wei, Y.P.; Zhang, Z.Y. Assessing the fragmentation of construction land in urban areas: An index method and case study in Shunde, China. Land Use Policy 2012, 29, 417–428. [Google Scholar] [CrossRef]
- Veiga, L.; Magrini, A. Eco-industrial park development in Rio de Janeiro, Brazil: A tool for sustainable development. J. Clean. Prod. 2009, 17, 653–661. [Google Scholar] [CrossRef]
- Hersperger, A.M.; Franscini, M.P.G.; Kubler, D. Actors, Decisions and Policy Changes in Local Urbanization. Eur. Plan. Stud. 2014, 22, 1301–1319. [Google Scholar] [CrossRef]
- Talen, E. Traditional urbanism meets residential affluence—An analysis of the variability of suburban preference. J. Am. Plan. Assoc. 2001, 67, 199–216. [Google Scholar] [CrossRef]
- Chi, G.Q.; Ventura, S. Population change and its driving factors in rural, suburban, and urban areas of Wisconsin, USA, 1970–2000. Int. J. Popul. Res. 2011, 2011, 856534. [Google Scholar] [CrossRef]
- Hasan, S.; Wang, X.M.; Khoo, Y.B.; Foliente, G. Accessibility and socio-economic development of human settlements. PLoS ONE 2017, 12, e0179620. [Google Scholar] [CrossRef] [PubMed]
- Southworth, M.; Owens, P.M. The evolving metropolis-studies of community, neighborhood, and Street form at the urban edge. J. Am. Plan. Assoc. 1993, 59, 271–287. [Google Scholar] [CrossRef]
- U.S. EPA (Environmental Protection Agency). Travel and Environmental Implications of School Siting. 2003. Available online: https://www.epa.gov/sites/production/files/2014-04/documents/school_travel.pdf (accessed on 16 November 2018).
- Kempen, E.; Musterd, S. High-rise housing reconsidered: Some research and policy-implications. Hous. Stud. 1991, 6, 83–95. [Google Scholar] [CrossRef]
- Muresan, A. Who Lives Largest? The Growth of Urban American Homes in the Last 100 Years. Available online: https://www.propertyshark.com/Real-Estate-Reports/2016/09/08/the-growth-of-urban-american-homes-in-the-last-100-years/ (accessed on 20 November 2018).
- Green, S.B. How many subjects does it take to do a regression analysis. Multivar. Behav. Res. 1991, 26, 499–510. [Google Scholar] [CrossRef] [PubMed]


| t | P | S | RP | CP | IP | FP | OP | RS | CS | IS | FS | OS | BS | PO | PD | UD | BS/P | BS/PO | S/PO | P/PO | P/P | S/S | BS/BS | RS/RS | CS/CS | IS/IS | FS/FS | OS/OS |
|---|---|---|---|---|---|---|---|---|---|---|---|---|---|---|---|---|---|---|---|---|---|---|---|---|---|---|---|---|
| 1853–1857 | 2 | 3.27 | 1 | 0 | 1 | 0 | 0 | 0.49 | 0.00 | 2.78 | 0.00 | 0.00 | 5483 | NA | NA | 1672 | 2728 | NA | NA | NA | 0.01% | 0.05% | 0.02% | 0.01% | 0.00% | 0.65% | 0.00% | 0.00% |
| 1858–1862 | 1 | 0.10 | 1 | 0 | 0 | 0 | 0 | 0.10 | 0.00 | 0.00 | 0.00 | 0.00 | 1602 | NA | NA | 14,564 | 1586 | NA | NA | NA | 0.01% | 0.00% | 0.01% | 0.00% | 0.00% | 0.00% | 0.00% | 0.00% |
| 1862–1867 | 0 | 0.00 | 0 | 0 | 0 | 0 | 0 | 0.00 | 0.00 | 0.00 | 0.00 | 0.00 | 0 | NA | NA | 0 | 0 | NA | NA | NA | 0.00% | 0.00% | 0.00% | 0.00% | 0.00% | 0.00% | 0.00% | 0.00% |
| 1868–1872 | 2 | 10.31 | 1 | 0 | 0 | 0 | 1 | 0.31 | 0.00 | 0.00 | 0.00 | 10.00 | 5334 | NA | NA | 517 | 2654 | NA | NA | NA | 0.01% | 0.16% | 0.02% | 0.01% | 0.00% | 0.00% | 0.00% | 1.31% |
| 1873–1877 | 2 | 0.85 | 2 | 0 | 0 | 0 | 0 | 0.85 | 0.00 | 0.00 | 0.00 | 0.00 | 4341 | NA | NA | 5048 | 2160 | NA | NA | NA | 0.01% | 0.01% | 0.02% | 0.02% | 0.00% | 0.00% | 0.00% | 0.00% |
| 1878–1882 | 4 | 0.60 | 3 | 0 | 1 | 0 | 0 | 0.49 | 0.00 | 0.11 | 0.00 | 0.00 | 6214 | NA | NA | 10,187 | 1550 | NA | NA | NA | 0.03% | 0.01% | 0.02% | 0.01% | 0.00% | 0.03% | 0.00% | 0.00% |
| 1883–1887 | 1 | 0.08 | 0 | 1 | 0 | 0 | 0 | 0.00 | 0.08 | 0.00 | 0.00 | 0.00 | 1280 | 199 | 2487.50 | 14,222 | 1267 | 6 | 0.00 | 0.01 | 0.01% | 0.00% | 0.01% | 0.00% | 0.20% | 0.00% | 0.00% | 0.00% |
| 1888–1892 | 11 | 2.00 | 9 | 2 | 0 | 0 | 0 | 1.73 | 0.27 | 0.00 | 0.00 | 0.00 | 18,943 | 178 | 89.00 | 9424 | 1721 | 106 | 0.01 | 0.06 | 0.08% | 0.03% | 0.07% | 0.03% | 0.68% | 0.00% | 0.00% | 0.00% |
| 1893–1897 | 18 | 29.49 | 17 | 0 | 0 | 1 | 0 | 29.09 | 0.00 | 0.00 | 0.40 | 0.00 | 31,659 | 146 | 4.95 | 1073 | 1758 | 217 | 0.20 | 0.12 | 0.13% | 0.46% | 0.12% | 0.58% | 0.00% | 0.00% | 0.24% | 0.00% |
| 1898–1902 | 96 | 401.90 | 83 | 10 | 1 | 0 | 2 | 135.20 | 2.38 | 186.01 | 0.00 | 78.31 | 169,675 | 635 | 1.58 | 422 | 1767 | 267 | 0.63 | 0.15 | 0.69% | 6.29% | 0.67% | 2.71% | 6.03% | 43.54% | 0.00% | 10.29% |
| 1903–1907 | 90 | 23.88 | 79 | 8 | 3 | 0 | 0 | 22.02 | 1.15 | 0.71 | 0.00 | 0.00 | 158,264 | 1366 | 57.20 | 6625 | 1758 | 116 | 0.02 | 0.07 | 0.65% | 0.37% | 0.62% | 0.44% | 2.91% | 0.17% | 0.00% | 0.00% |
| 1908–1912 | 163 | 67.04 | 150 | 10 | 0 | 2 | 1 | 51.31 | 1.17 | 0.00 | 9.56 | 5.00 | 302,132 | 1060 | 15.81 | 4506 | 1853 | 285 | 0.06 | 0.15 | 1.17% | 1.05% | 1.19% | 1.03% | 2.96% | 0.00% | 5.76% | 0.66% |
| 1913–1917 | 173 | 60.56 | 152 | 16 | 1 | 3 | 1 | 34.62 | 1.94 | 0.11 | 7.42 | 16.47 | 302,168 | 598 | 9.87 | 4989 | 1747 | 505 | 0.10 | 0.29 | 1.25% | 0.95% | 1.19% | 0.69% | 4.91% | 0.03% | 4.47% | 2.16% |
| 1918–1922 | 205 | 75.31 | 185 | 12 | 3 | 4 | 1 | 59.26 | 6.89 | 4.25 | 1.64 | 3.27 | 346,814 | 729 | 9.68 | 4605 | 1692 | 476 | 0.10 | 0.28 | 1.48% | 1.18% | 1.36% | 1.19% | 17.45% | 0.99% | 0.99% | 0.43% |
| 1923–1927 | 232 | 683.30 | 216 | 8 | 1 | 3 | 4 | 50.91 | 1.45 | 85.43 | 51.61 | 493.90 | 382,044 | 916 | 1.34 | 559 | 1647 | 417 | 0.75 | 0.25 | 1.67% | 10.70% | 1.50% | 1.02% | 3.67% | 20.00% | 31.10% | 64.88% |
| 1928–1932 | 118 | 55.72 | 104 | 9 | 0 | 2 | 3 | 40.42 | 1.43 | 0.00 | 0.46 | 13.41 | 210,204 | 711 | 12.76 | 3772 | 1781 | 296 | 0.08 | 0.17 | 0.85% | 0.87% | 0.82% | 0.81% | 3.62% | 0.00% | 0.28% | 1.76% |
| 1933–1937 | 116 | 67.76 | 111 | 3 | 0 | 1 | 1 | 33.73 | 0.32 | 0.00 | 33.12 | 0.59 | 203,651 | 404 | 5.96 | 3005 | 1755 | 504 | 0.17 | 0.29 | 0.84% | 1.06% | 0.80% | 0.68% | 0.81% | 0.00% | 19.96% | 0.08% |
| 1938–1942 | 373 | 126.76 | 352 | 8 | 3 | 5 | 5 | 112.53 | 3.45 | 1.32 | 1.76 | 7.70 | 617,630 | 1805 | 14.24 | 4872 | 1656 | 342 | 0.07 | 0.21 | 2.69% | 1.98% | 2.42% | 2.25% | 8.74% | 0.31% | 1.06% | 1.01% |
| 1943–1947 | 419 | 191.78 | 397 | 6 | 3 | 6 | 7 | 170.01 | 6.66 | 4.33 | 1.93 | 8.85 | 614,020 | 3908 | 20.38 | 3202 | 1465 | 157 | 0.05 | 0.11 | 3.02% | 3.00% | 2.41% | 3.40% | 16.87% | 1.01% | 1.16% | 1.16% |
| 1948–1952 | 890 | 442.74 | 866 | 3 | 13 | 3 | 5 | 373.77 | 0.68 | 48.58 | 0.85 | 18.86 | 1,457,062 | 3236 | 7.31 | 3291 | 1637 | 450 | 0.14 | 0.28 | 6.41% | 6.93% | 5.72% | 7.48% | 1.72% | 11.37% | 0.51% | 2.48% |
| 1953–1957 | 757 | 372.08 | 751 | 3 | 2 | 0 | 1 | 327.19 | 1.42 | 41.38 | 0.00 | 2.09 | 1,333,219 | 2231 | 6.00 | 3583 | 1761 | 598 | 0.17 | 0.34 | 5.45% | 5.82% | 5.23% | 6.55% | 3.60% | 9.69% | 0.00% | 0.27% |
| 1958–1962 | 1156 | 353.28 | 1139 | 2 | 8 | 3 | 4 | 333.58 | 1.00 | 4.49 | 3.88 | 10.33 | 1,924,598 | 4216 | 11.93 | 5448 | 1665 | 456 | 0.08 | 0.27 | 8.33% | 5.53% | 7.55% | 6.68% | 2.53% | 1.05% | 2.34% | 1.36% |
| 1963–1967 | 1045 | 588.69 | 1023 | 3 | 16 | 1 | 2 | 581.68 | 1.64 | 4.43 | 0.11 | 0.83 | 1,821,600 | 7194 | 12.22 | 3094 | 1743 | 253 | 0.08 | 0.15 | 7.53% | 9.21% | 7.15% | 11.65% | 4.15% | 1.04% | 0.07% | 0.11% |
| 1968–1972 | 1091 | 328.42 | 1077 | 3 | 8 | 0 | 3 | 306.86 | 3.86 | 3.88 | 0.00 | 13.82 | 1,857,830 | 5497 | 16.74 | 5657 | 1703 | 338 | 0.06 | 0.20 | 7.86% | 5.14% | 7.29% | 6.14% | 9.77% | 0.91% | 0.00% | 1.82% |
| 1973–1977 | 1323 | 462.77 | 1316 | 0 | 2 | 4 | 1 | 434.11 | 0.00 | 13.62 | 12.62 | 2.42 | 2,302,500 | 2952 | 6.38 | 4975 | 1740 | 780 | 0.16 | 0.45 | 9.53% | 7.24% | 9.03% | 8.69% | 0.00% | 3.19% | 7.60% | 0.32% |
| 1978–1982 | 1298 | 392.80 | 1295 | 1 | 1 | 1 | 0 | 383.15 | 1.94 | 4.99 | 2.72 | 0.00 | 2,121,095 | 2540 | 6.47 | 5400 | 1634 | 835 | 0.15 | 0.51 | 9.35% | 6.15% | 8.32% | 7.67% | 4.91% | 1.17% | 1.64% | 0.00% |
| 1983–1987 | 245 | 181.35 | 245 | 0 | 0 | 0 | 0 | 181.35 | 0.00 | 0.00 | 0.00 | 0.00 | 507,445 | 1922 | 10.60 | 2798 | 2071 | 264 | 0.09 | 0.13 | 1.77% | 2.84% | 1.99% | 3.63% | 0.00% | 0.00% | 0.00% | 0.00% |
| 1988–1992 | 606 | 321.04 | 602 | 0 | 0 | 2 | 2 | 299.34 | 0.00 | 0.00 | 20.31 | 1.39 | 1,317,994 | 2055 | 6.40 | 4105 | 2175 | 641 | 0.16 | 0.29 | 4.37% | 5.02% | 5.17% | 5.99% | 0.00% | 0.00% | 12.24% | 0.18% |
| 1993–1997 | 1066 | 411.97 | 1063 | 0 | 1 | 1 | 1 | 372.59 | 0.00 | 9.54 | 6.15 | 23.69 | 2,161,783 | 2254 | 5.47 | 5247 | 2028 | 959 | 0.18 | 0.47 | 7.68% | 6.45% | 8.48% | 7.46% | 0.00% | 2.23% | 3.71% | 3.11% |
| 1998–2002 | 888 | 257.16 | 886 | 1 | 1 | 0 | 0 | 246.77 | 0.11 | 10.28 | 0.00 | 0.00 | 1,955,827 | 1728 | 6.72 | 7605 | 2202 | 1132 | 0.15 | 0.51 | 6.40% | 4.03% | 7.67% | 4.94% | 0.28% | 2.41% | 0.00% | 0.00% |
| 2003–2007 | 1189 | 301.54 | 1155 | 30 | 0 | 2 | 2 | 285.36 | 1.19 | 0.00 | 6.37 | 8.62 | 2,594,679 | 2159 | 7.16 | 8604 | 2182 | 1202 | 0.14 | 0.55 | 8.57% | 4.72% | 10.18% | 5.71% | 3.01% | 0.00% | 3.84% | 1.13% |
| 2008–2012 | 207 | 135.26 | 193 | 1 | 1 | 11 | 1 | 89.76 | 0.46 | 1.00 | 2.31 | 41.73 | 511,014 | 2861 | 21.15 | 3778 | 2469 | 179 | 0.05 | 0.07 | 1.49% | 2.12% | 2.00% | 1.80% | 1.16% | 0.23% | 1.39% | 5.48% |
| 2013–2014 | 93 | 39.09 | 79 | 0 | 0 | 14 | 0 | 36.34 | 0.00 | 0.00 | 2.75 | 0.00 | 240,975 | 245 | 6.27 | 6163 | 2591 | 984 | 0.16 | 0.38 | 0.67% | 0.61% | 0.95% | 0.73% | 0.00% | 0.00% | 1.66% | 0.00% |
| Total | 13,880 | 6388.90 | 13,553 | 140 | 70 | 69 | 48 | 4994.92 | 39.49 | 427.24 | 165.97 | 761.28 | 25,489,079 | 53,745 | 8.41 | 3990 | 1836 | 474 | 0.12 | 0.26 | 100% | 100% | 100% | 100% | 100% | 100% | 100% | 100% |
| Urban Land Uses and Growth | Social Economics Features | Urban Form Characteristics | Urban Accessibility Measure | ||||||||||||||||||||||||||||
|---|---|---|---|---|---|---|---|---|---|---|---|---|---|---|---|---|---|---|---|---|---|---|---|---|---|---|---|---|---|---|---|
| Period | Parcel | Size | Land Use Parcel No. | Land Use Parcel Size | Value | Bldg | Population | Density | Land Use Mix | Urban Travel Distance (UTD) | |||||||||||||||||||||
| t | P | S | RP | CP | IP | FP | OP | RS | CS | IS | FS | OS | LV | IV | AV | MV | BS | PO | PD | UD | AS | CM | IM | FM | OM | LM | CA | IA | FA | OA | TA |
| 1853–1897 | 41 | 47 | 34 | 3 | 2 | 1 | 1 | 33 | 0.4 | 2.9 | 0.4 | 10.0 | 6 | 5 | 7 | 10 | 7 | 1,731 | 37.07 | 0.16 | 1.14 | 1.9 × 10⁻³ | 2.2 × 10⁻³ | 7.2 × 10⁻⁴ | 7.2 × 10⁻⁴ | 5.5 × 10⁻³ | 6.2 | 16.2 | 5.1 | 37.4 | 65.0 |
| 1853–1902 | 137 | 449 | 117 | 13 | 3 | 1 | 3 | 168 | 2.7 | 188.9 | 0.4 | 88.3 | 22 | 15 | 26 | 37 | 24 | 2366 | 5.27 | 0.05 | 3.27 | 2.5 × 10⁻⁴ | 8.1 × 10⁻⁴ | 6.2 × 10⁻⁵ | 1.9 × 10⁻⁴ | 1.3 × 10⁻³ | 13.0 | 19.0 | 5.5 | 23.6 | 61.0 |
| 1853–1907 | 227 | 472 | 196 | 21 | 6 | 1 | 3 | 190 | 3.9 | 189.6 | 0.4 | 88.3 | 34 | 24 | 39 | 58 | 40 | 3732 | 7.90 | 0.09 | 2.08 | 2.3 × 10⁻⁴ | 4.7 × 10⁻⁴ | 2.2 × 10⁻⁵ | 6.7 × 10⁻⁵ | 7.9 × 10⁻⁴ | 11.4 | 16.6 | 5.1 | 23.5 | 56.5 |
| 1853–1912 | 390 | 540 | 346 | 31 | 6 | 3 | 4 | 242 | 5.1 | 189.6 | 10.0 | 93.3 | 61 | 51 | 80 | 112 | 70 | 4792 | 8.88 | 0.13 | 1.38 | 1.7 × 10⁻⁴ | 2.3 × 10⁻⁴ | 2.2 × 10⁻⁵ | 3.0 × 10⁻⁵ | 4.5 × 10⁻⁴ | 9.9 | 16.4 | 5.6 | 21.1 | 53.0 |
| 1853–1917 | 563 | 600 | 498 | 47 | 7 | 6 | 5 | 276 | 7.0 | 189.7 | 17.4 | 109.8 | 86 | 75 | 111 | 161 | 101 | 5390 | 8.98 | 0.17 | 1.07 | 1.6 × 10⁻⁴ | 1.6 × 10⁻⁴ | 2.1 × 10⁻⁵ | 1.8 × 10⁻⁵ | 3.6 × 10⁻⁴ | 8.3 | 14.6 | 7.8 | 21.2 | 51.8 |
| 1853–1922 | 768 | 675 | 683 | 59 | 10 | 10 | 6 | 335 | 13.9 | 194.0 | 19.0 | 113.1 | 116 | 97 | 144 | 214 | 135 | 6119 | 9.06 | 0.20 | 0.88 | 1.3 × 10⁻⁴ | 1.1 × 10⁻⁴ | 1.9 × 10⁻⁵ | 1.1 × 10⁻⁵ | 2.7 × 10⁻⁴ | 8.9 | 15.2 | 8.2 | 19.0 | 51.2 |
| 1853–1927 | 1000 | 1359 | 899 | 67 | 11 | 13 | 10 | 386 | 15.3 | 279.4 | 70.6 | 607.0 | 238 | 124 | 249 | 361 | 174 | 7035 | 5.18 | 0.13 | 1.36 | 5.5 × 10⁻⁵ | 7.5 × 10⁻⁵ | 1.4 × 10⁻⁵ | 1.1 × 10⁻⁵ | 1.5 × 10⁻⁴ | 9.1 | 14.7 | 9.0 | 17.0 | 49.9 |
| 1853–1932 | 1118 | 1414 | 1003 | 76 | 11 | 15 | 13 | 427 | 16.8 | 279.4 | 71.1 | 620.4 | 254 | 137 | 269 | 391 | 195 | 7746 | 5.48 | 0.14 | 1.27 | 5.4 × 10⁻⁵ | 6.8 × 10⁻⁵ | 1.3 × 10⁻⁵ | 1.2 × 10⁻⁵ | 1.5 × 10⁻⁴ | 9.6 | 14.9 | 9.3 | 15.3 | 49.1 |
| 1853–1937 | 1234 | 1482 | 1114 | 79 | 11 | 16 | 14 | 461 | 17.1 | 279.4 | 104.2 | 621.0 | 270 | 154 | 292 | 424 | 215 | 8150 | 5.50 | 0.15 | 1.20 | 4.8 × 10⁻⁵ | 5.7 × 10⁻⁵ | 1.2 × 10⁻⁵ | 1.0 × 10⁻⁵ | 1.3 × 10⁻⁴ | 9.6 | 15.0 | 10.3 | 15.3 | 50.2 |
| 1853–1942 | 1607 | 1609 | 1466 | 87 | 14 | 21 | 19 | 573 | 20.5 | 280.7 | 106.0 | 628.7 | 322 | 192 | 355 | 514 | 277 | 9955 | 6.19 | 0.17 | 1.00 | 3.7 × 10⁻⁵ | 3.7 × 10⁻⁵ | 8.9 × 10⁻⁶ | 8.1 × 10⁻⁶ | 9.1 × 10⁻⁵ | 10.7 | 16.4 | 10.3 | 15.2 | 52.6 |
| 1853–1947 | 2026 | 1801 | 1863 | 93 | 17 | 27 | 26 | 743 | 27.2 | 285.1 | 107.9 | 637.5 | 378 | 228 | 422 | 607 | 338 | 13,863 | 7.70 | 0.19 | 0.89 | 2.8 × 10⁻⁵ | 2.5 × 10⁻⁵ | 7.2 × 10⁻⁶ | 6.9 × 10⁻⁶ | 6.6 × 10⁻⁵ | 12.3 | 17.8 | 11.2 | 14.5 | 55.7 |
| 1853–1952 | 2916 | 2243 | 2729 | 96 | 30 | 30 | 31 | 1117 | 27.9 | 333.6 | 108.8 | 656.4 | 499 | 319 | 582 | 818 | 484 | 17,099 | 7.62 | 0.22 | 0.77 | 1.6 × 10⁻⁵ | 1.2 × 10⁻⁵ | 3.8 × 10⁻⁶ | 3.9 × 10⁻⁶ | 3.5 × 10⁻⁵ | 12.7 | 20.0 | 11.6 | 14.9 | 59.2 |
| 1853–1957 | 3673 | 2616 | 3480 | 99 | 32 | 30 | 32 | 1444 | 29.3 | 375.0 | 108.8 | 658.5 | 606 | 407 | 737 | 1012 | 617 | 19,330 | 7.39 | 0.24 | 0.71 | 1.1 × 10⁻⁵ | 7.7 × 10⁻⁶ | 2.3 × 10⁻⁶ | 2.5 × 10⁻⁶ | 2.3 × 10⁻⁵ | 12.7 | 20.6 | 12.1 | 15.0 | 60.4 |
| 1853–1962 | 4829 | 2969 | 4619 | 101 | 40 | 33 | 36 | 1778 | 30.3 | 379.5 | 112.6 | 668.8 | 761 | 528 | 962 | 1289 | 810 | 23,546 | 7.93 | 0.27 | 0.61 | 7.4 × 10⁻⁶ | 4.5 × 10⁻⁶ | 1.5 × 10⁻⁶ | 1.6 × 10⁻⁶ | 1.5 × 10⁻⁵ | 13.6 | 21.5 | 12.8 | 16.0 | 64.0 |
| 1853–1967 | 5874 | 3558 | 5642 | 104 | 56 | 34 | 38 | 2359 | 31.9 | 383.9 | 112.7 | 669.6 | 903 | 647 | 1180 | 1550 | 992 | 30,740 | 8.64 | 0.28 | 0.61 | 5.2 × 10⁻⁶ | 3.1 × 10⁻⁶ | 1.0 × 10⁻⁶ | 1.1 × 10⁻⁶ | 1.0 × 10⁻⁵ | 14.3 | 20.6 | 13.6 | 16.6 | 65.1 |
| 1853–1972 | 6965 | 3886 | 6719 | 107 | 64 | 34 | 41 | 2666 | 35.8 | 387.8 | 112.7 | 683.4 | 1040 | 769 | 1395 | 1809 | 1178 | 36,237 | 9.33 | 0.30 | 0.56 | 4.1 × 10⁻⁶ | 2.3 × 10⁻⁶ | 7.3 × 10⁻⁷ | 8.8 × 10⁻⁷ | 8.0 × 10⁻⁶ | 15.0 | 20.3 | 14.4 | 17.4 | 67.1 |
| 1853–1977 | 8288 | 4349 | 8035 | 107 | 66 | 38 | 42 | 3100 | 35.8 | 401.4 | 125.4 | 685.9 | 1215 | 926 | 1681 | 2141 | 1408 | 39,189 | 9.01 | 0.32 | 0.52 | 3.1 × 10⁻⁶ | 1.6 × 10⁻⁶ | 5.7 × 10⁻⁷ | 6.3 × 10⁻⁷ | 5.9 × 10⁻⁶ | 15.5 | 20.7 | 15.1 | 18.3 | 69.6 |
| 1853–1982 | 9586 | 4741 | 9330 | 108 | 67 | 39 | 42 | 3483 | 37.7 | 406.4 | 128.1 | 685.9 | 1359 | 1087 | 1943 | 2446 | 1620 | 41,729 | 8.80 | 0.34 | 0.49 | 2.4 × 10⁻⁶ | 1.2 × 10⁻⁶ | 4.4 × 10⁻⁷ | 4.7 × 10⁻⁷ | 4.6 × 10⁻⁶ | 16.1 | 21.1 | 15.7 | 18.6 | 71.6 |
| 1853–1987 | 9831 | 4923 | 9575 | 108 | 67 | 39 | 42 | 3665 | 37.7 | 406.4 | 128.1 | 685.9 | 1396 | 1125 | 2009 | 2521 | 1671 | 43,651 | 8.87 | 0.34 | 0.50 | 2.3 × 10⁻⁶ | 1.1 × 10⁻⁶ | 4.1 × 10⁻⁷ | 4.5 × 10⁻⁷ | 4.3 × 10⁻⁶ | 16.2 | 21.2 | 15.8 | 18.7 | 71.9 |
| 1853–1992 | 10,437 | 5244 | 10,177 | 108 | 67 | 41 | 44 | 3964 | 37.7 | 406.4 | 148.4 | 687.2 | 1488 | 1229 | 2183 | 2717 | 1802 | 45,706 | 8.72 | 0.34 | 0.50 | 2.0 × 10⁻⁶ | 1.0 × 10⁻⁶ | 3.9 × 10⁻⁷ | 4.1 × 10⁻⁷ | 3.8 × 10⁻⁶ | 16.4 | 21.4 | 16.3 | 18.8 | 72.9 |
| 1853–1997 | 11,503 | 5656 | 11,240 | 108 | 68 | 42 | 45 | 4337 | 37.7 | 416.0 | 154.5 | 710.9 | 1641 | 1399 | 2465 | 3040 | 2019 | 47,960 | 8.48 | 0.36 | 0.49 | 1.7 × 10⁻⁶ | 8.4 × 10⁻⁷ | 3.2 × 10⁻⁷ | 3.5 × 10⁻⁷ | 3.2 × 10⁻⁶ | 16.8 | 21.6 | 16.9 | 19.0 | 74.3 |
| 1853–2002 | 12,391 | 5913 | 12,126 | 109 | 69 | 42 | 45 | 4583 | 37.8 | 426.2 | 154.5 | 710.9 | 1773 | 1570 | 2730 | 3343 | 2214 | 49,688 | 8.40 | 0.37 | 0.48 | 1.5 × 10⁻⁶ | 7.3 × 10⁻⁷ | 2.8 × 10⁻⁷ | 3.0 × 10⁻⁷ | 2.8 × 10⁻⁶ | 17.1 | 22.1 | 17.1 | 19.2 | 75.4 |
| 1853–2007 | 13,580 | 6215 | 13,281 | 139 | 69 | 44 | 47 | 4869 | 39.0 | 426.2 | 160.9 | 719.6 | 1928 | 1826 | 3063 | 3754 | 2474 | 51,847 | 8.34 | 0.40 | 0.46 | 1.7 × 10⁻⁶ | 7.7 × 10⁻⁷ | 2.4 × 10⁻⁷ | 2.6 × 10⁻⁷ | 3.0 × 10⁻⁶ | 17.5 | 22.4 | 17.4 | 19.1 | 76.4 |
| 1853–2012 | 13,787 | 6350 | 13,474 | 140 | 70 | 55 | 48 | 4959 | 39.5 | 427.2 | 163.2 | 761.3 | 1957 | 1875 | 3127 | 3833 | 2525 | 54,708 | 8.62 | 0.40 | 0.46 | 1.6 × 10⁻⁶ | 7.5 × 10⁻⁷ | 3.0 × 10⁻⁷ | 2.6 × 10⁻⁷ | 2.9 × 10⁻⁶ | 17.8 | 22.6 | 17.7 | 19.1 | 77.3 |
| 1853–2014 | 13,880 | 6389 | 13,553 | 140 | 70 | 69 | 48 | 4995 | 39.5 | 427.2 | 166.0 | 761.3 | 1969 | 1885 | 3144 | 3854 | 2549 | 54,953 | 8.60 | 0.40 | 0.46 | 1.6 × 10⁻⁶ | 7.4 × 10⁻⁷ | 3.7 × 10⁻⁷ | 2.6 × 10⁻⁷ | 3.0 × 10⁻⁶ | 17.8 | 22.6 | 17.8 | 19.1 | 77.4 |
© 2018 by the authors. Licensee MDPI, Basel, Switzerland. This article is an open access article distributed under the terms and conditions of the Creative Commons Attribution (CC BY) license (http://creativecommons.org/licenses/by/4.0/).
Share and Cite
Zhou, L.; Shen, G.; Wu, Y.; Brown, R.; Chen, T.; Wang, C. Urban Form, Growth, and Accessibility in Space and Time: Anatomy of Land Use at the Parcel-Level in a Small to Medium-Sized American City. Sustainability 2018, 10, 4572. https://doi.org/10.3390/su10124572
Zhou L, Shen G, Wu Y, Brown R, Chen T, Wang C. Urban Form, Growth, and Accessibility in Space and Time: Anatomy of Land Use at the Parcel-Level in a Small to Medium-Sized American City. Sustainability. 2018; 10(12):4572. https://doi.org/10.3390/su10124572
Chicago/Turabian StyleZhou, Long, Guoqiang Shen, Yao Wu, Robert Brown, Tian Chen, and Chenyu Wang. 2018. "Urban Form, Growth, and Accessibility in Space and Time: Anatomy of Land Use at the Parcel-Level in a Small to Medium-Sized American City" Sustainability 10, no. 12: 4572. https://doi.org/10.3390/su10124572
APA StyleZhou, L., Shen, G., Wu, Y., Brown, R., Chen, T., & Wang, C. (2018). Urban Form, Growth, and Accessibility in Space and Time: Anatomy of Land Use at the Parcel-Level in a Small to Medium-Sized American City. Sustainability, 10(12), 4572. https://doi.org/10.3390/su10124572