Article

Exploring the Influence of Urban Form on Urban Vibrancy in Shenzhen Based on Mobile Phone Data

1
Key Laboratory of Urban Land Resources Monitoring and Simulation, Ministry of Land and Resources, Shenzhen 518034, China
2
Shenzhen Municipal Planning & Land Real Estate Information Centre, Shenzhen 518034, China
3
School of Resources and Environmental Sciences, Wuhan University, 129 Luoyu Road, Wuhan 430079, China
4
Hubei Institute of Land Surveying and Mapping, 199 Aomen Road, Wuhan 430010, China
5
Key Laboratory of GIS, Ministry of Education, Wuhan University, 129 Luoyu Road, Wuhan 430079, China
6
Key Laboratory of Digital Mapping and Land Information Application Engineering, National Administration of Surveying, Mapping and Geoinformation, Wuhan University, 129 Luoyu Road, Wuhan 430079, China
7
School of Geographic and Biologic Information, Nanjing University of Posts and Telecommunications, Nanjing 210023, China
8
Smart Health Big Data Analysis and Location Services Engineering Lab of Jiangsu Province, Nanjing University of Posts and Telecommunications, Nanjing 210023, China
*
Authors to whom correspondence should be addressed.
Sustainability 2018, 10(12), 4565; https://doi.org/10.3390/su10124565
Submission received: 25 October 2018 / Revised: 20 November 2018 / Accepted: 22 November 2018 / Published: 3 December 2018

Abstract

:
Urban vibrancy is an important indicator of the attractiveness of a city and its potential for comprehensive, healthy and sustainable development in all aspects. With the development of big data, an increasing number of datasets can be used to analyse urban vibrancy on fine spatial and temporal scales from the perspective of human perception. In this study, we applied mobile phone data as a proxy for local vibrancy in Shenzhen and constructed a comprehensive framework for the factors that influence urban vibrancy, especially in terms of urban morphology and space syntax. In addition, the popular geographically and temporally weighted regression (GTWR) method was used to explore the spatiotemporal relationships between vibrancy and its influencing factors. The spatial and temporal coefficients are presented through maps. The conclusions of this attempt to study urban vibrancy with urban big data have significant implications for helping urban planners and policy makers optimize the spatial layouts of urban functional zones and perform high-quality city planning.

1. Introduction

Cities are the main places where humans live and where development occurs. Depending on the differences among urban function areas, urban spaces are highly social and change dynamically as people engage in different activities. To scientifically, visually, and intuitively describe the state of urban development, an increasing amount of people are referencing urban vibrancy as an important indicator to judge whether a city possesses a certain attractiveness and the potential for comprehensive, healthy and sustainable development in all aspects [1,2,3,4,5,6,7,8]. In addition, increasing numbers of researchers have postulated that vibrancy constitutes one of the essential elements of a successful city [2,9,10,11]. Vibrancy encompasses many aspects, including the economy, society and culture in addition to the ecological environment, all of which have profound impacts on urban development. With the rapid development of society, people continue to pursue a high quality of life, and, thus, they are drawn to places characterized by a high vibrancy. Urban vibrancy was first proposed from a conceptual perspective by Jacobs [3,4], who started with urban streets and believed that urban vibrancy is generated by the interactions between people and the functions of places. Subsequently, Montgomery [2] clearly elaborated that one of the most striking characteristics of urban vibrancy is the dynamic changes in the spatial and temporal dimensions. In urban economics, urban vibrancy is used to measure whether a region’s development can operate sustainably and stably. According to Lynch [10], vibrancy is defined as the ability of a city to meet the needs of its residents in a safe environment. The theories regarding urban vibrancy in the abovementioned studies are offered from a sociological perspective based on experience and investigation rather than through quantitative study. Urban vibrancy should accurately reflect the number of people or the cumulative number of people at different times and places. Since then, many studies have investigated urban vibrancy using a quantitative approach with the main objectives of measuring urban vibrancy and exploring its influencing factors.
Urban vibrancy, which is considered to reflect a new source of urban competitiveness, can be measured from multiple different perspectives [12]. To date, however, no widely recognized definition of urban vibrancy has been accepted. The existing research on urban vibrancy is based mostly on sociological terms with the idea that urban vibrancy includes mainly economic vibrancy, social vibrancy and cultural vibrancy [13]. For example, Djankov et al. [14] proposed that the consumption growth brought by urban facilities is the embodiment of urban growth. Many relevant studies have comprehensively evaluated urban vibrancy by selecting the gross domestic product (GDP), tertiary industry share, real estate price and other single or multiple factors [15,16,17]. Furthermore, Ying and Yin [18] constructed a quantitative evaluation index system of street-based vibrancy that can provide great reference significance for the establishment of an indicator system. In addition, many scholars have measured urban vibrancy based on its characteristics, including the population density [19,20], accessibility of roads or neighbourhoods [6,7], liveability of blocks [21], sustainability and presence of mixed land use [22,23] and extent of human or pedestrian activity [24]. However, vibrancy measurements in previous studies exhibit three main limitations: (1) they ignore the important functions of people in the city; (2) they employ static statistical datasets; and (3) they lack research on the sspatiotemporal characteristics of urban vibrancy at relatively fine scales. Based on the aforementioned studies, our work, which does not consider economic vibrancy, is in accordance with Jacobs’s theory: a successful city street must exhibit different flows of people in different time periods.
Mobile phone data possess a multitude of advantages. For example, mobile phone data exhibit a vast spatial coverage; in addition, the individuals who use mobile phones provide a vast number of samples, and it is relatively inexpensive to acquire the corresponding data. As a result, mobile phone data have been widely applied to reflect regional features, study the connections and radiation of urban spaces, explore the relationships between residents’ activities and both time and space, etc. Hence, these data can provide a new research method and data source in addition to a new perspective on geography, urban planning and public participation. Mobile phone data contain detailed spatiotemporal information and thus can effectively reveal changes in human activity patterns; accordingly, this data source is superior to traditional and static statistical data sources. In particular, mobile phone data have two prominent advantages for research on urban vibrancy: (1) georeferenced mobile phone data can indicate well-timed population distributions at microscopic temporal (e.g., by hours, by weekdays and by weekends) and spatial scales (e.g., in traffic analysis zones (TAZs)); and (2) mobile phone data cover the entire user group. Therefore, these data can be utilized to reflect the temporal and spatial changes in urban vibrancy. For example, Jacobs-Crisioni et al. [25] measured the extent of mixed land use and its effects on vibrancy based on mobile phone data, while Ying and Yin [18] constructed a framework of influencing factors of street vibrancy based on mobile phone data. Moreover, by analysing mobile signal data, Yue et al. [8] illustrated a generalizable relationship between point of interest (POI)-based mixed land use and vibrancy. In general, the previous studies all applied ordinary linear regression to explore the relationships between local vibrancy and its influencing factors without addressing their daily temporal variations, including the differences between weekdays and weekends and those between the daytime and the night-time. Considering the prominent characteristic of urban vibrancy reflecting the number of people in a given place at different times [2,3] and the advantages of mobile phone data, this study uses the number of mobile phone users in each day (24 h) as a proxy for urban vibrancy.
Although numerous measurements of vibrancy can be found, as mentioned previously, many studies have instead emphasized the most important impacts of urban form, especially the functions of streets and their relationship with local vibrancy [26,27,28]. If a city wants to achieve prosperity and vibrancy, it must possess four elements: a mixed display of functions, a network of short streets with a sufficient number of intersections, a diversity of building designs and a sufficiently dense population [3]. Implicitly, the idea is that increases in the walkability and connectivity can lead to the aggregation of more people in a given neighbourhood. Overall, urban form comprehensively reflects the emergence, growth, and development of urban agglomeration, including its form, structure, and function. The study of urban form generally includes the plan shape of the built-up area, the internal functions of structures and the form of the road system. Therefore, this study focused on integrating various influencing factors from an urban form perspective, developing an indicator system, and conducting quantitative research on urban vibrancy and its influencing factors.
As mentioned before, many researchers have explored the relationships between urban vibrancy and its influencing factors. For example, Mehta [29] integrated multivariate and factor analyses to explore the effects of eleven street characteristics on the liveliness index. Yue et al. [8] constructed a complete system to analyse the effects of mixed land use on vibrancy using mobile phone data. Jacobs-Crisioni et al. [25] also applied multiple linear regression to explore the relationship between mixed land use and vibrancy. Sung et al. [30] verified Jacobs’s theory of urban design on physical diversity and vibrancy in New York City using regression analysis. Nevertheless, all of these studies ignore the spatial and temporal heterogeneities in the urban vibrancy variation, which is important for spatiotemporal analysis and modelling. In 2010, Huang et al. [31] produced a geographically and temporally weighted regression (GTWR) model to account for and address spatiotemporal nonstationarity; subsequently, this GTWR model has been widely used to study housing prices [32] and the air quality [33] in addition to carbon dioxide emissions [34]. Therefore, GTWR is applicable for revealing and exploring the relationships between vibrancy and its influencing factors, and it can be used to find some potential information at finer temporal and spatial resolutions [7]. An in-depth study of the temporal and spatial changes in urban vibrancy and its influencing factors is important for reasonably planning and designing city spaces, optimizing urban morphology and enhancing urban vibrancy.
Using Shenzhen as the study area, this study applied mobile phone signal data to quantitatively evaluate urban vibrancy at high temporal and spatial resolutions. In addition, from an urban form perspective, we built an urban vibrancy index system of influencing factors and further explore the relationships between urban vibrancy and its influencing factors based on the spatial and temporal dimensions using GTWR [31]. This work is superior to the existing literature for the following reasons. (1) We further constructed a complete and diverse framework for the factors that influence urban vibrancy that encompasses the concepts of space and place syntax, the distribution of amenities, and areas of mixed land use. (2) This study distinguished vibrancy between weekdays and weekends, thereby revealing the different life-styles of the residents of Shenzhen. (3) The GTWR model can reveal the spatiotemporal heterogeneity of urban vibrancy and explore the relationships at a finer resolution based on mobile phone data. The remainder of this paper is organized as follows. Section 2 presents the method and materials with a detailed description of the spatial autoregressive model, study area and dataset sources. Section 3 discusses the empirical results of the model and illustrates the potential mechanisms. Finally, Section 4 outlines the conclusion and proposes some suggestions.

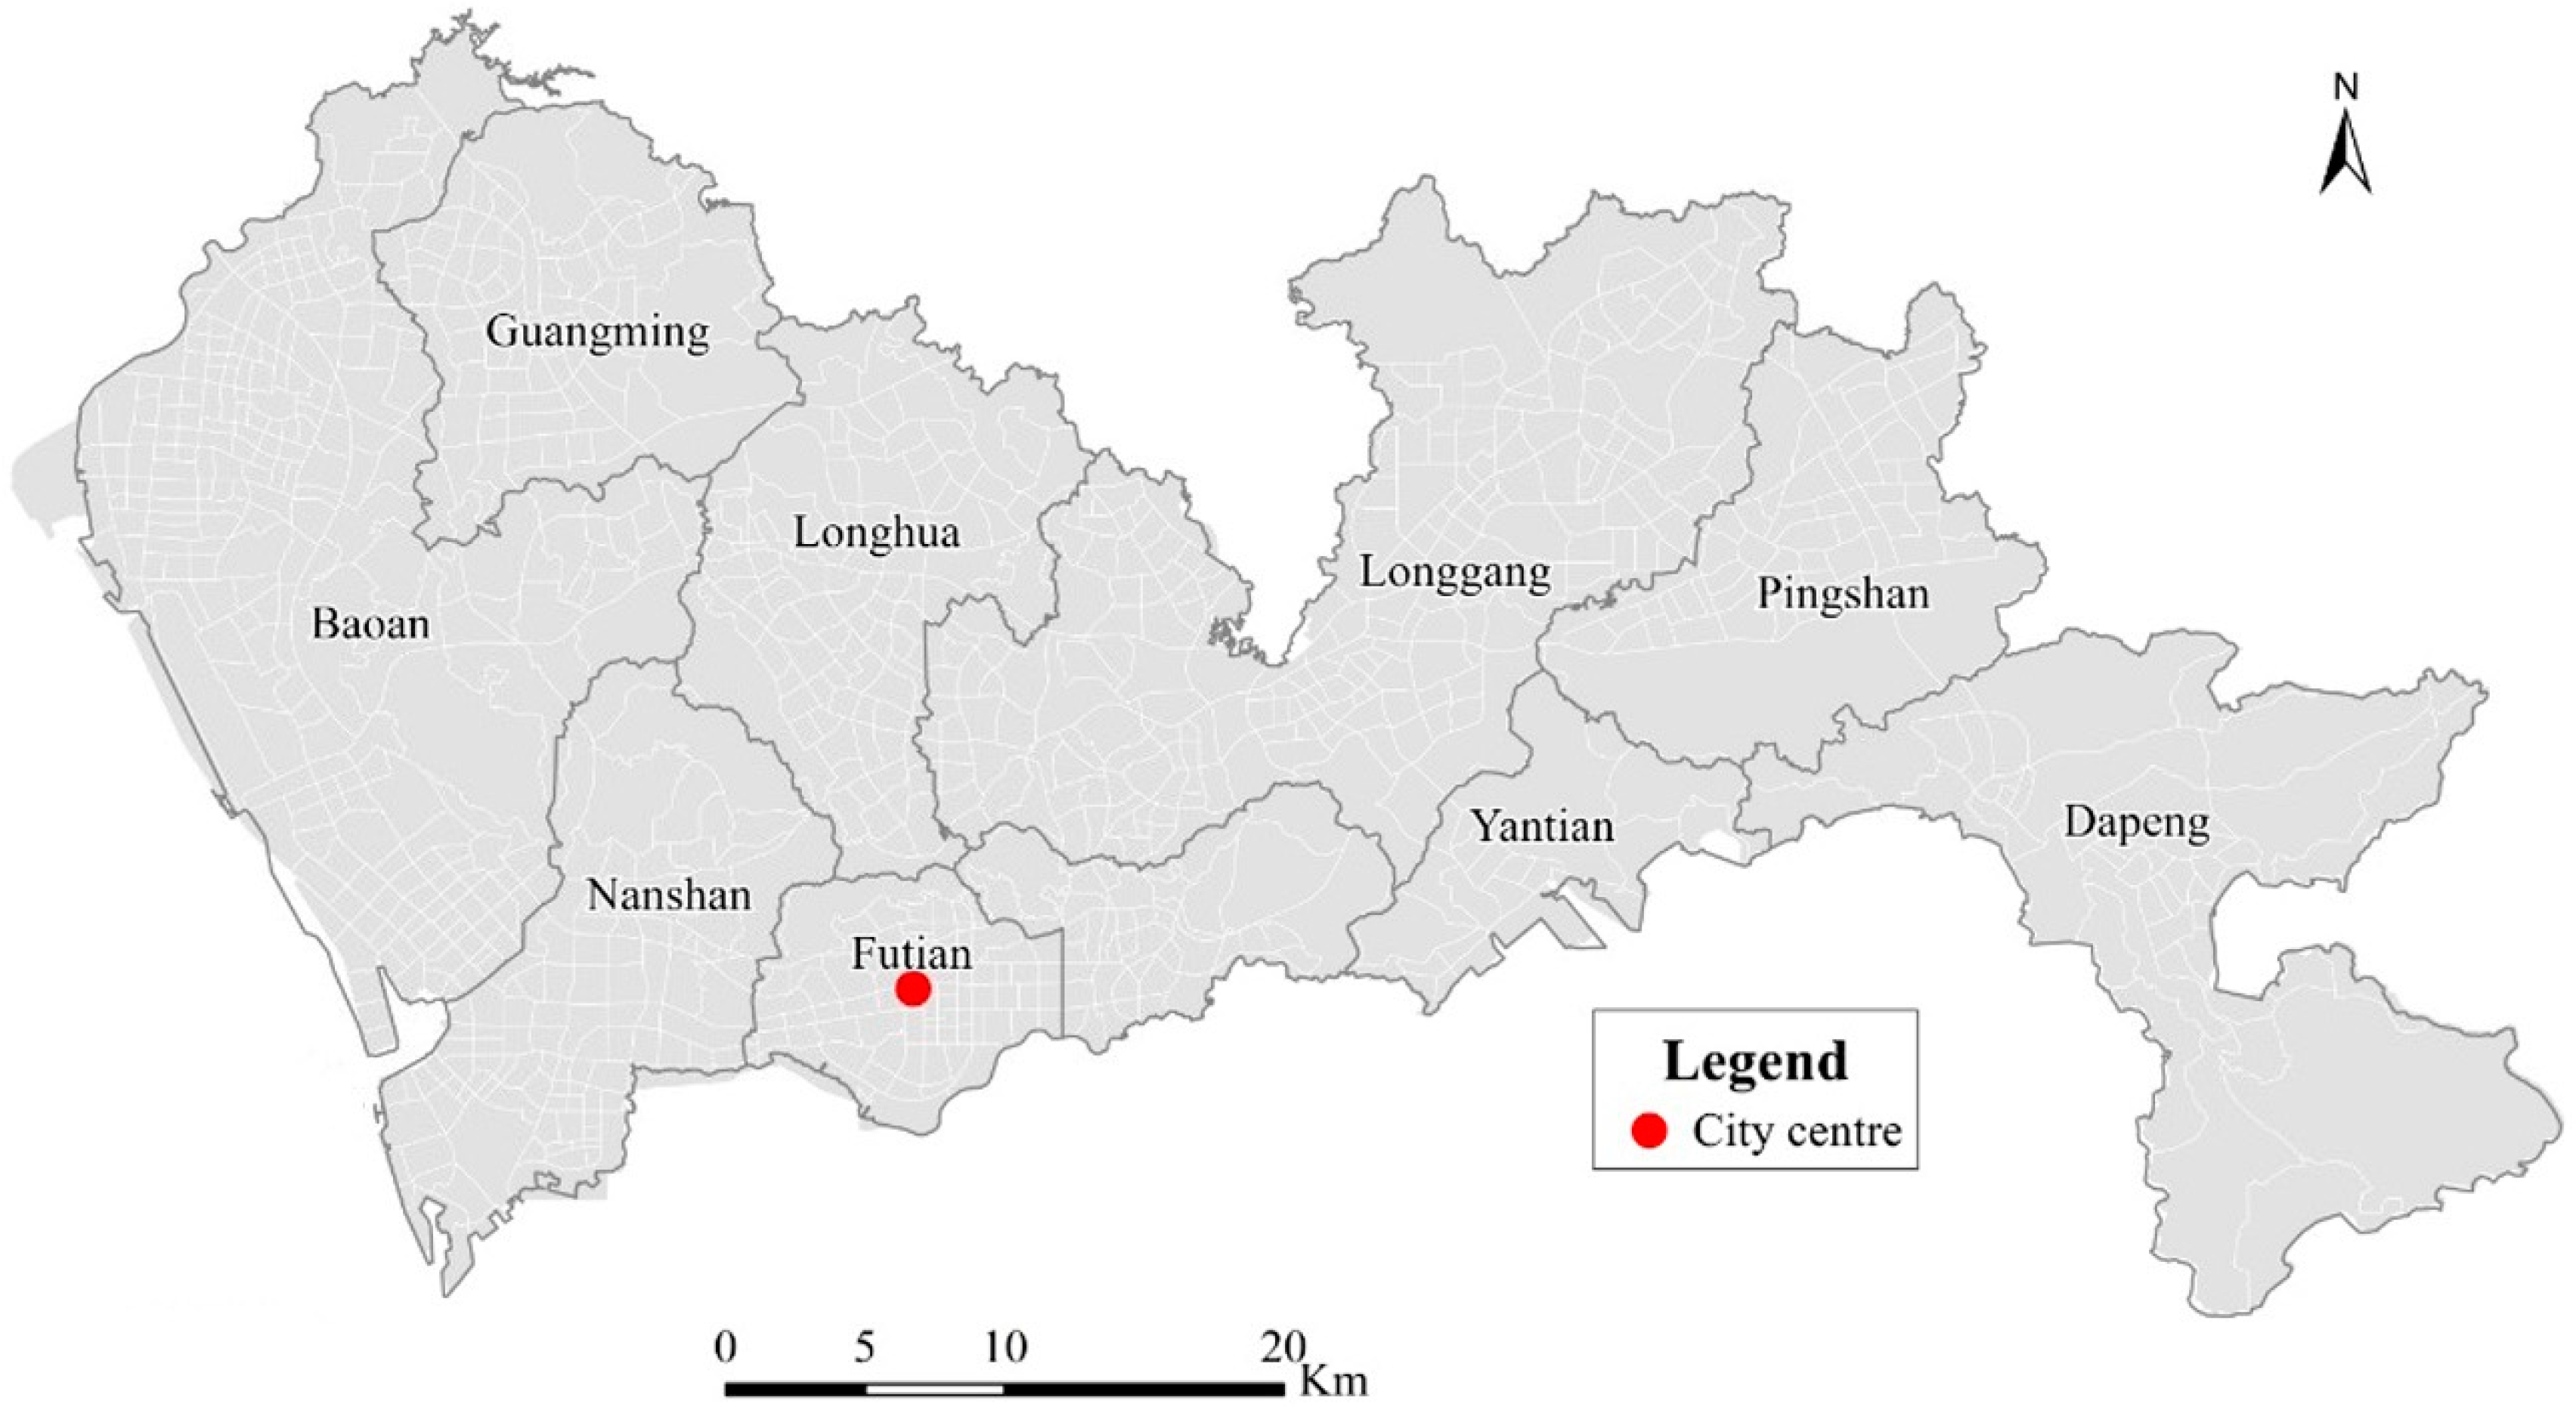
2. Study Area and Datasets

This study used Shenzhen as the case study to explore the spatiotemporal changes in urban vibrancy and its influencing factors based on mobile phone data. Shenzhen, one of the first-tier cities in China, is located in the southeastern coastal area of Guangdong Province; the city covers a total area of 1997.27 km2, including eight administrative districts and two new districts. By the end of 2016, the population in Shenzhen had reached 10.84 million, including 3.85 million registered permanent residents. Shenzhen is the first special economic zone in China and represents a high-tech innovation centre, as it connects the mainland to Hong Kong. Accordingly, Shenzhen is an important transport hub and is one of the most dynamic cities in China. Shenzhen contains 981 TAZs, which were taken as the basic research unit. To preserve the connectivity of the study area, we deleted only island TAZs in Shenzhen; subsequently, a total of 977 TAZs were considered in the analysis (Figure 1). Shenzhen is a dynamic city that embraces inclusiveness and openness. Figure 2 shows photographs of some famous places in Shenzhen that represent real-life situations related to urban vibrancy throughout the city. Evidently, people prefer different places at different times, which constitutes the practical issue related to the focus of our work.
Based on mobile signal data, the activities of mobile phone users within the mobile communication network can be directly measured. Combined with the geographical location information of the base station, the changes in the positions of mobile phone users in the real geographical space can be obtained. The period of mobile signal data employed in this survey was from 1 May 2016 to 30 June 2016, spanning a total of 42 working days. The time interval of mobile phone data collection was 15 min, and an average of 426 million records were collected every day. The survey scope covered 7993 mobile phone base stations with an average of four cell towers in each TAZ covering an average of 90 m. In addition, road data and POI data were provided by the Urban Planning, Land & Resources Commission of Shenzhen municipality (Municipality Oceanic Administration of Shenzhen). To explore the differences between weekdays and weekends, we calculated the average records for both weekdays and weekends.

3. System of Influencing Factors

Urban vibrancy and its influencing factors were studied. Thus, it was necessary to construct a framework of influencing factors. According to previous studies and the conditions of Shenzhen, we built this framework mainly from the urban form perspective, and we included nine factors encompassing three aspects: the road traffic pattern, urban functional form and locational conditions. These nine factors are described in Table 1.
Specifically, the factors related to the road traffic pattern were quantitatively measured by space syntax, a system proposed primarily to study urban design and architecture [35]. Space syntax was employed because it is helpful for understanding the impact of the spatial configuration of urban areas and buildings on peoples’ movements. Essentially, space syntax is fundamentally associated with the street network, but it is also related to various functional aspects of urban form [36]. Space syntax can be utilized to model the spatial configurations of urban spaces based on a connectivity graph representation [37]. The spatial configurations extracted by space syntax can be employed to identify spatial patterns to reflect and explore urban structures, landscape design and human behaviours [38,39,40]. Many researchers have noted that the indicators extracted from space syntax have important effects on urban vibrancy [16,41,42,43,44] and are able to promote urban vibrancy and improve living environments. By physically and functionally representing pedestrian connections and accessibility [45], space syntax also contributes greatly to the design of urban streets and neighbourhoods; thus, space syntax also has profound effects on urban vibrancy and intra-city migration [46,47].
This study chose two road traffic pattern indicators, namely, integration and choice, which are important and widely used concepts of space syntax [46,48,49,50]. In a previous study, Shen and Karimi [16] reported that the integration and choice indicators of space syntax have significant effects on housing prices. Integration is used to represent the accessibility within a network and to determine whether pedestrians can travel to a given space quickly. In line segment analysis mode, the integration indicator refers to the distance from each street segment to other street segments within a specific radius; here, the distance is not the length of the line segment but the sum of the segments connecting all of the angles turned. Therefore, integration describes the centrality of a road section, thereby indicating the difference between its radiation and control range, and it reflects the potential of the road section to represent a destination along which movement occurs. The choice indicator measures the probability that a spatial element is located along the shortest path between any two elements in the system. Axwoman 6.3 [51] was used to generate the axis map of the traffic network, and DepthMapX [52] was used to calculate the relevant indexes based on the axis map. The highest degree of integration is concentrated in the central area of Shenzhen, while the highest degree of choice is concentrated mainly near the main roads. Because these indexes take the value of each segment, converting them into each TAZ was necessary. Therefore, the kernel density estimation approach based on the study by Carlos et al. [53] was used to obtain the value of factors on a grid scale. Then, grid cell areal weighting interpolation was used to convert the values of integration and choice to the TAZ scale.
The urban functional form is usually measured by land use data, which reflect the function of a city in a certain area. However, the patch size of land use data is large; hence, these data do not reflect mixed functions effectively. Therefore, POIs with a higher resolution were used instead of land use data; this study considered 14 types of POIs. The degree of functional mixing and the densities of four important functional categories, namely, residence, traffic, commerce and leisure, were considered. We used the theory of information entropy to measure the degree of urban functional mixing [54]. The concept of information entropy, which describes mainly the uncertainty in a source of information, was originally proposed by Shannon, who used the physical concept of thermal entropy to solve the problem of the quantitative measurement of information. In general, the more orderly a system is, the lower the entropy is; similarly, the more disordered the system is, the higher the entropy is. Information entropy theory is used in geographical applications mainly to measure the degree of urban functionality, that is, the higher the entropy value is, the higher the degree of functionality is, and vice versa [55,56]. The degree of functional mixing can be calculated as follows:
Mixing = i = 1 n ( p i × ln p i )
where n denotes the total number of the types of POIs ( n = 14), and p i represents the proportion of the i th type of POI in the total number of POIs in each TAZ. As mentioned in the Athens charter [57], the main functions of city life include recreation, work, recreation and travel. Therefore, this study considered the relationships between urban vibrancy and traffic, commerce, leisure and residence based on the POI data. Within the varying areas of the TAZs, the density of each POI was more effective. In addition, the distance to the city centre and the distance to the airport were measured to represent the locational conditions. All distances were measured based on the network distance in ArcGIS.

4. Geographically and Temporally Weighted Regression

As one of the most important models in spatial statistics, GTWR is widely used in many fields for scientific research and theoretical practice [31]. Compared with the traditional multiple regression model, GTWR considers the existence of spatiotemporal heterogeneity, which enables the regression process to be more detailed; in addition, GTWR can also clarify the degree of interaction between different samples. GTWR can be calculated as follows:
y i = β 0 ( u i , v i , t i ) + k = 1 d β k ( u i , v i , t i ) x i k + ε i , i = 1 , 2 , n
where y is the dependent variable calculated by the hourly population based on mobile phone data, X is an independent variable representing urban form, ε i denotes the error term, β k ( u i , v i , t i ) is the estimated coefficient of variable k for sample i , β 0 is the intercept item, and ( u i , v i , t i ) represents the temporal and spatial coordinates of sample i . We used the centre of each TAZ as the spatial location.
The calibration approach for GTWR is the weighted least squares method. Either the corrected Akaike information criterion (AICc) or cross-validation (CV) can be used to choose the optimal spatiotemporal bandwidth. Simply put, the closer the sample point is to the original point of the regression, the greater is the weight of the sample. In contrast, an observation far from the original point should be given a small weight. W ( u i , v i , t i ) represents the weights of other observations for sample i . The estimated coefficients can be calculated as follows:
β ^ ( u i , v i , t i ) = [ X T W ( u i , v i , t i ) X ] 1 X T W ( u i , v i , t i ) Y

5. Results and Discussion

5.1. Results of Ordinary Linear Regression

To assess the relationships between the influencing factors and vibrancy in each of the TAZs, a series of linear regressions was conducted. The population per hour on weekdays, weekends and holidays in each TAZ constituted the dependent variable Y , which was tested to conform to a normal distribution. All independent variables and dependent variables were standardized. However, it was necessary to perform collinearity diagnostics before constructing multiple linear regression models. Multicollinearity refers to the distortion of a model estimation due to the existence of an exact correlation or a high correlation between explanatory variables within the linear regression model; these correlations can be caused by lag variables and incorrect model settings in addition to a limited number of samples. The collinearity of the indicators was determined through the tolerance and the variance inflation factor (VIF). When the tolerance is less than 0.1 or the VIF is greater than 10, the indicator can be considered to possess severe collinearity. The spatial distributions of integration and choice are consistent; therefore, a high level of collinearity exists between integration and choice. Based on the t values and VIF values of these two variables, we deleted the variable of choice. The results of the diagnostic information are listed in Table 2. Ultimately, eight factors were used to construct the regression models. Then, we separated weekdays from weekends and used the number of people per hour over 24 h as the dependent variable. To observe the overall temporal effects of various influencing factors, ordinary linear regression (OLR) models were established for each hour. The OLR results are shown in Table 3 and Table 4.
Table 3 shows that, on weekdays, the commerce density and road integration are significantly positively correlated with vibrancy throughout the day. The residence density, leisure density, distance to airport and mixing degree are not statistically significant for urban vibrancy during the day but have significant effects at night. In contrast, the relationship between the distance to the city centre and urban vibrancy is negative during the daytime, that is, the greater the distance is to the city centre, the lower the vibrancy is; however, this relationship at night is not significant. These phenomena occur because the motivation for the daily activities of urban residents is relatively singular, i.e., work is the main driving force of a diversity of activities. Therefore, during the daytime, the majority of people are gathered in the city centre, while the influences of leisure, residence and mixing are relatively small. At night, when people return to their residential areas after work, the influences of the two locational factors are weakened, while the influences of the four density functions, especially the functions of residence and leisure, on urban vibrancy increase [7,58].
Table 4 shows that, on weekends, the largest difference from weekdays lies in that the residence and leisure density have a significant positive linear correlation to vibrancy on all days. The distance to the city centre only has significant negative effects from 15:00 to 19:00. The causes of these phenomena are that many people have no work requirements in the city centre, locational factors are reduced, and the diversity of urban function enables people to meet the needs of leisure, entertainment, and social aspects, significantly increasing city vigour on days off. In addition, on rest days, the degree of road integration, as an indicator of the potential of regional travel destinations, is still significantly positively correlated with urban vibrancy.

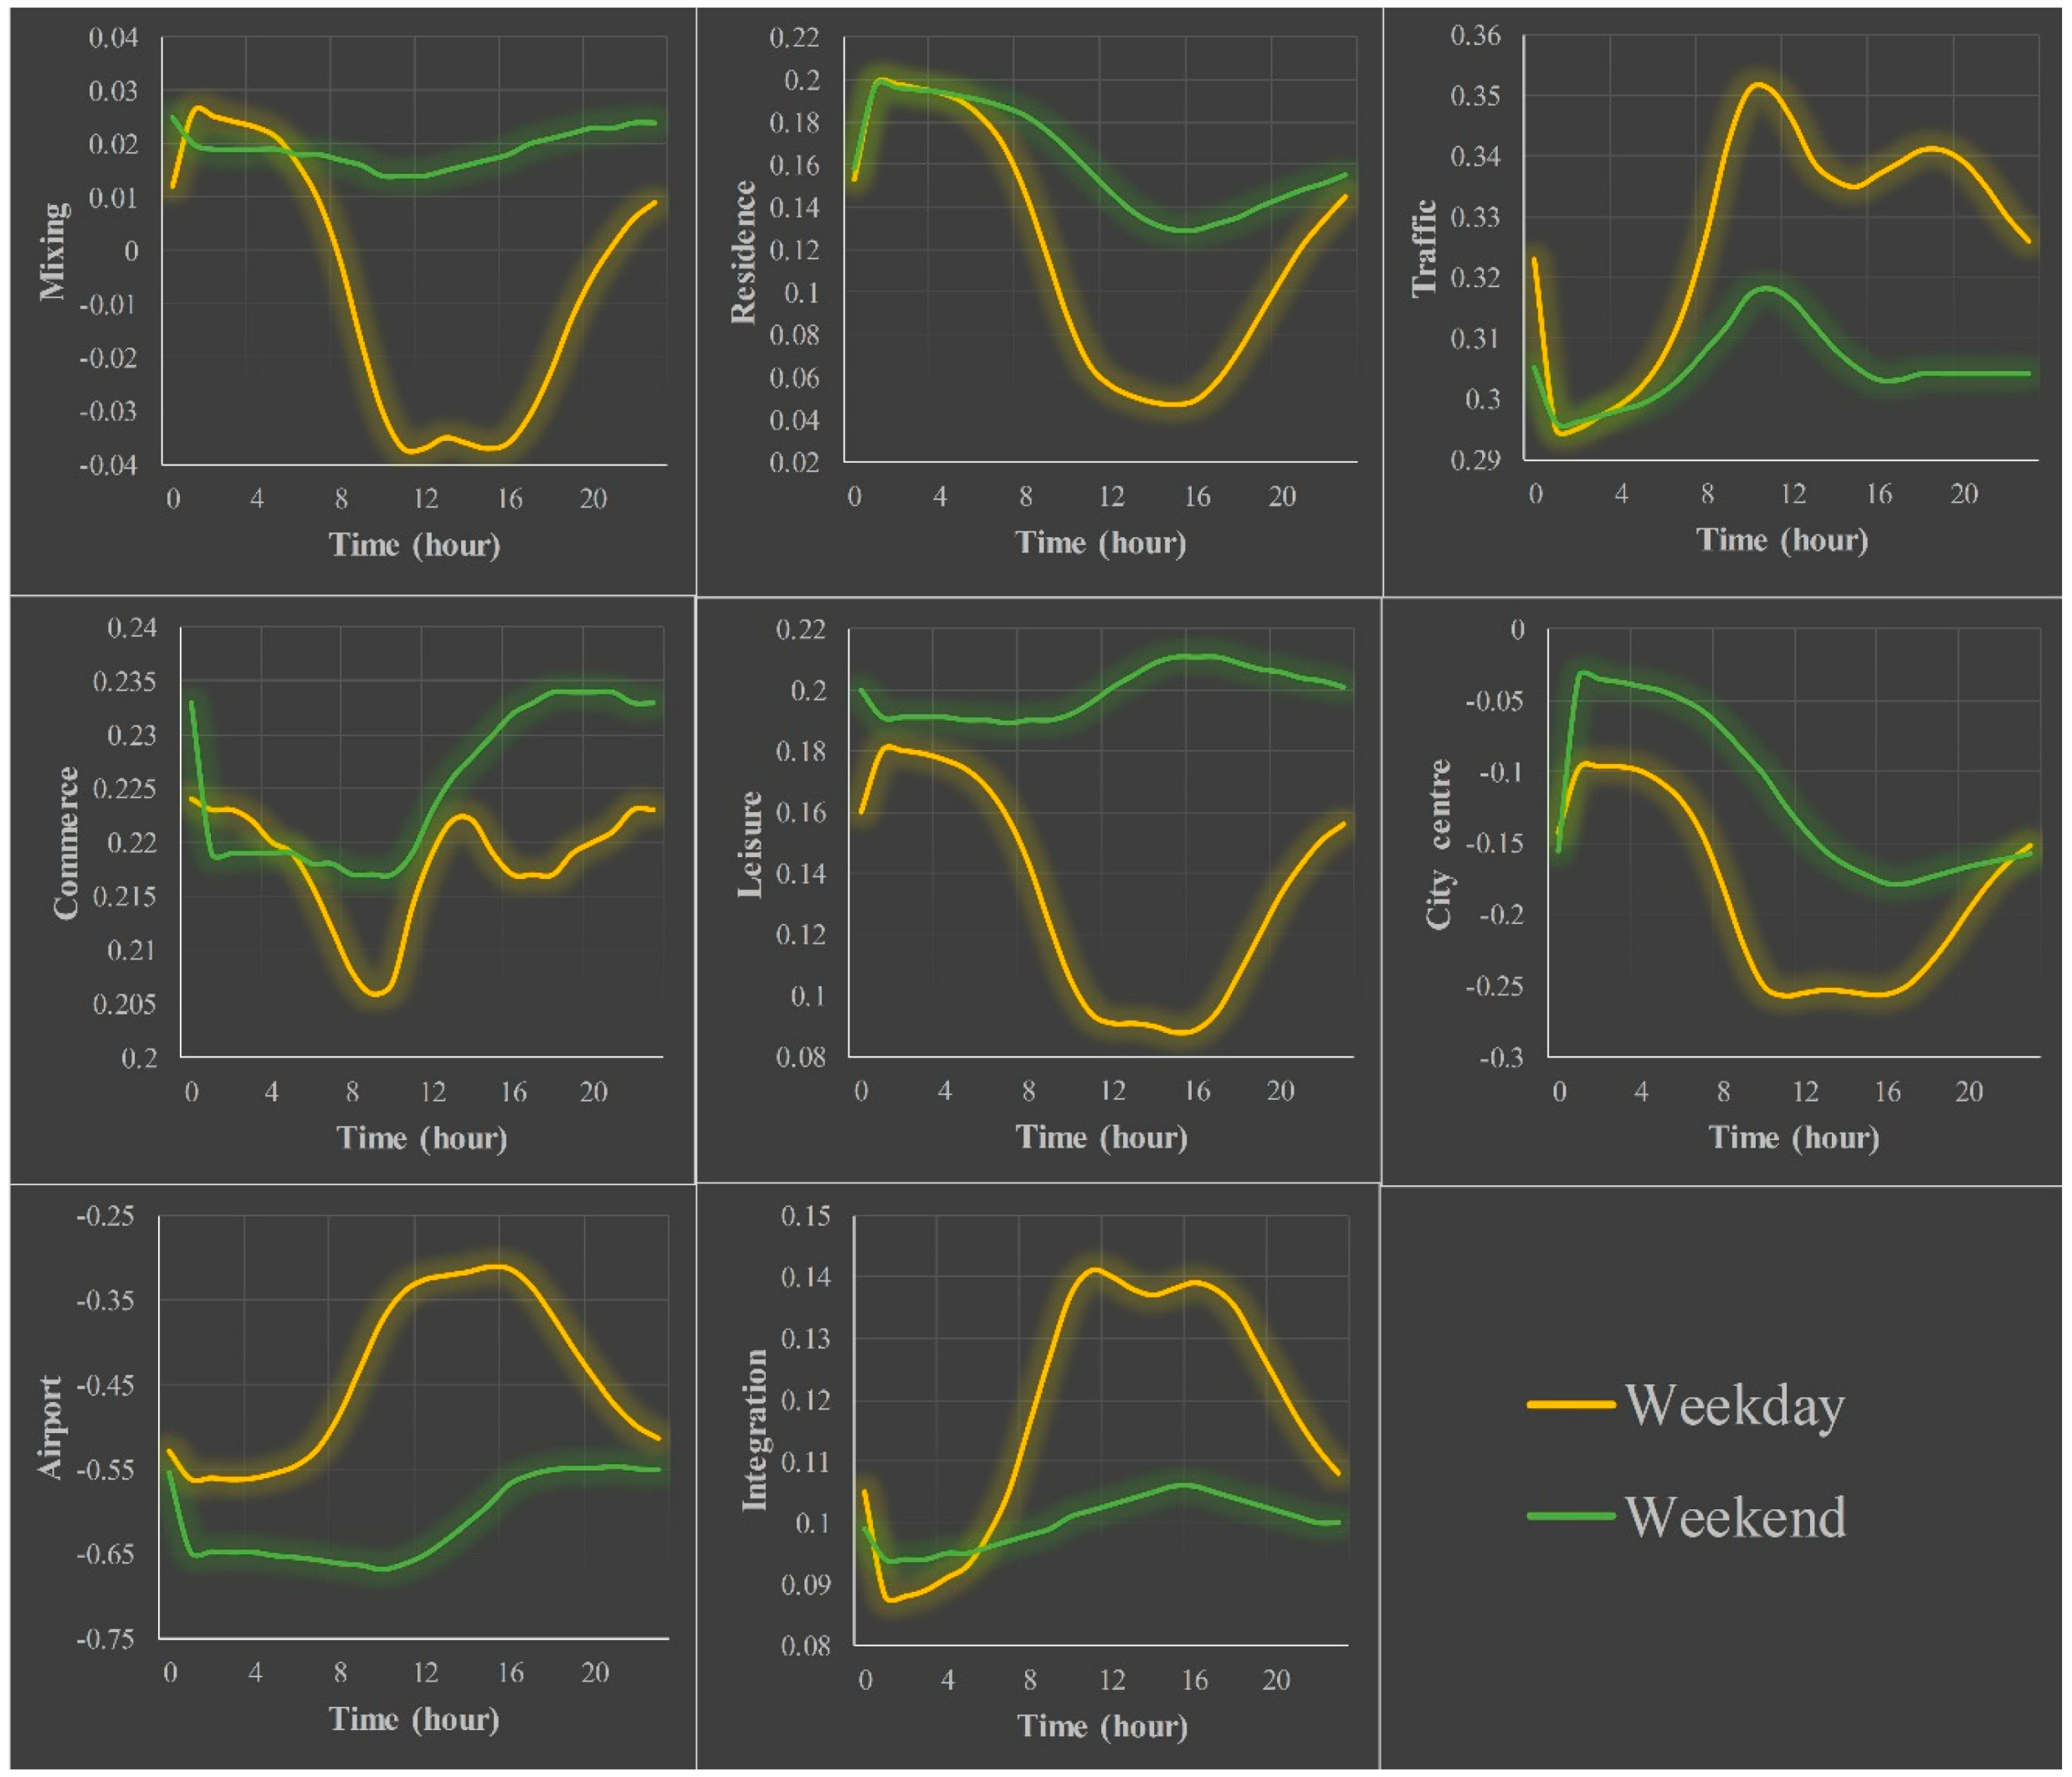
5.2. Results of GTWR

The above conclusions, which were based on an analysis of the OLR results, show that the effects of each variable are quite different in different time periods. Therefore, comprehensively and scientifically capturing these relationships by using OLR is difficult. In addition, through the R 2 metric, these OLR models can explain only 60% of the variation at most, which is obviously insufficient for modelling. In consideration of spatiotemporal nonstationarity, the GTWR model was adopted to investigate the local relationships. The GTWR results on weekdays and weekends are shown in Table 5 and Table 6, respectively. For the varying estimated coefficients of GTWR, it is wise to show the coefficients as the sequence of the minimum (Min), first quartile (Q1), median (Q2), third quartile (Q3) and maximum (Max). In addition, the mean value (Mean) and standard deviation (SD) are also used to reflect the variations in the estimated coefficients. According to the results shown in Table 5 and Table 6, the weekdays and weekends can explain 86.98% and 86.51%, respectively, of the variations in local vibrancy. Clearly, these results are superior to the OLR results, thereby demonstrating the advantages of GTWR. Moreover, the statistical results show that the estimated coefficients obtained from using GTWR in the different TAZs, over different time periods throughout the day and for different times of the week (weekdays and weekends) are different. Moreover, these differences are reflected not only in the values but also by the positive and negative effects. For example, the degree of functional mixing on average is negative during the weekdays, while it is positive on the weekends. The effects of the explained variables on vibrancy should not be treated as the same; thus, separating them into the temporal dimension and spatial dimension in detail is necessary.

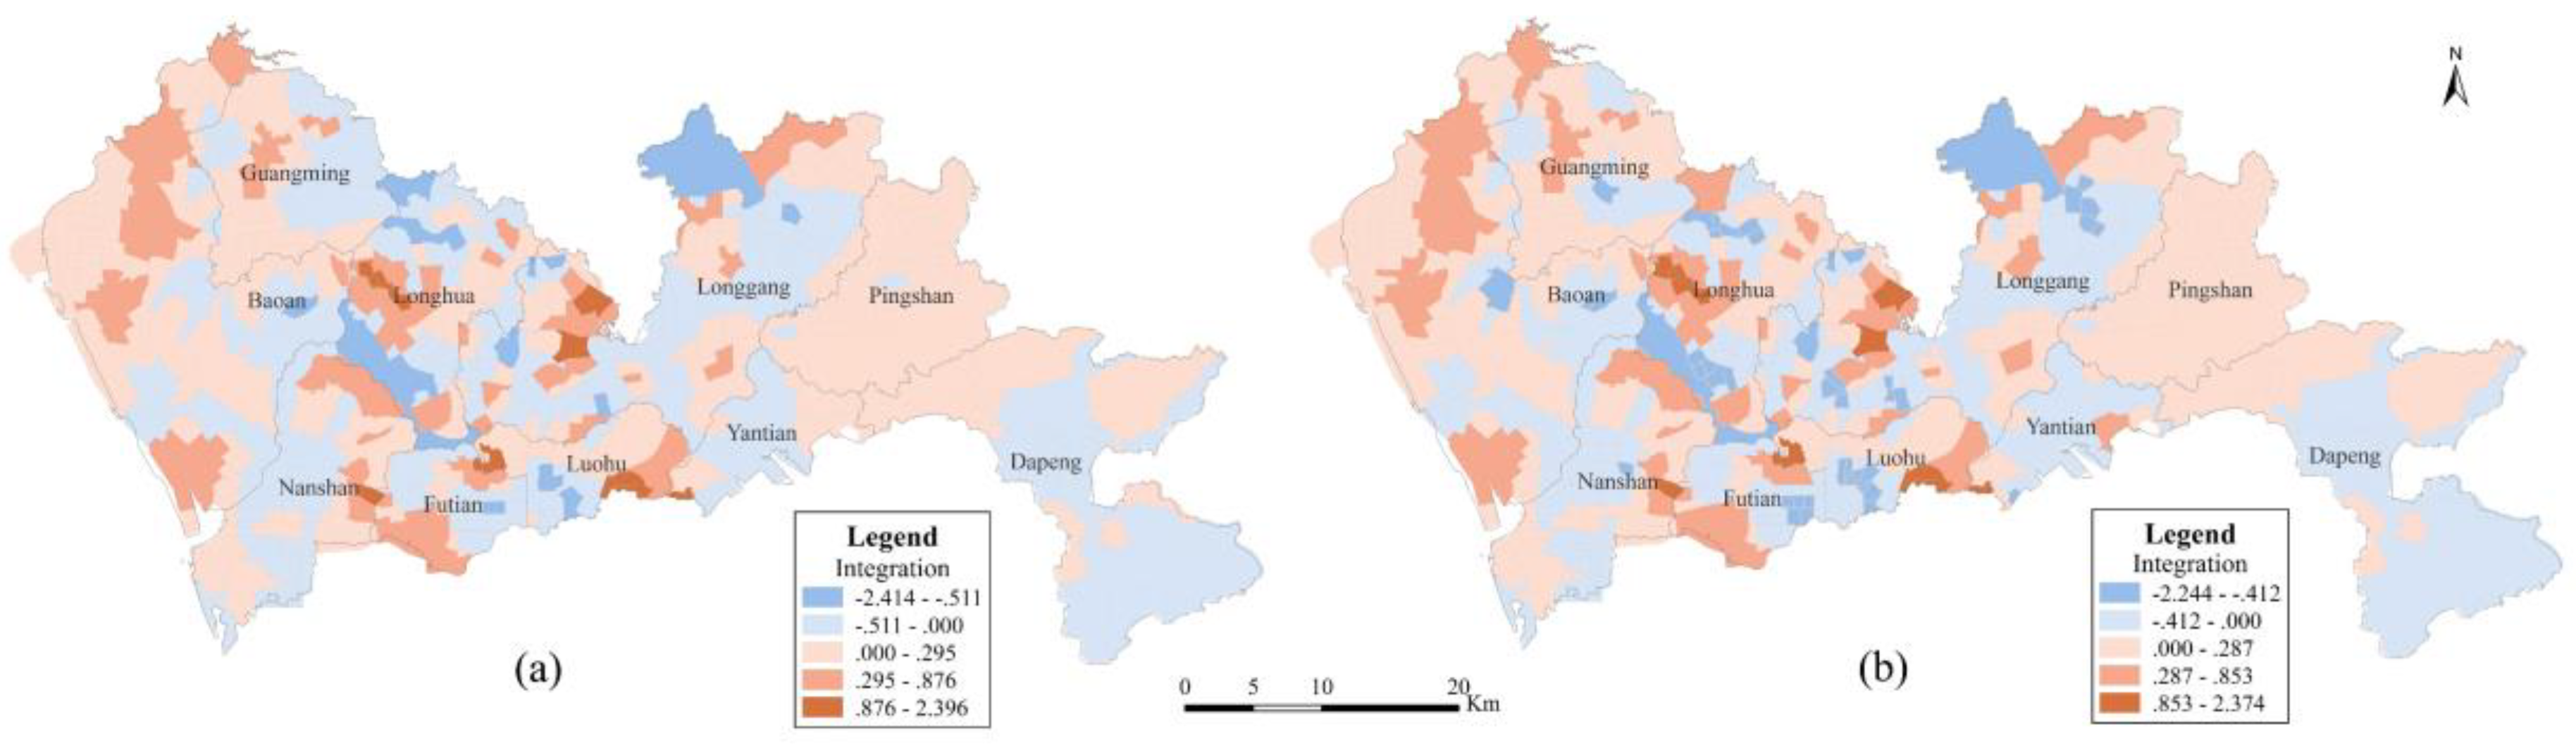
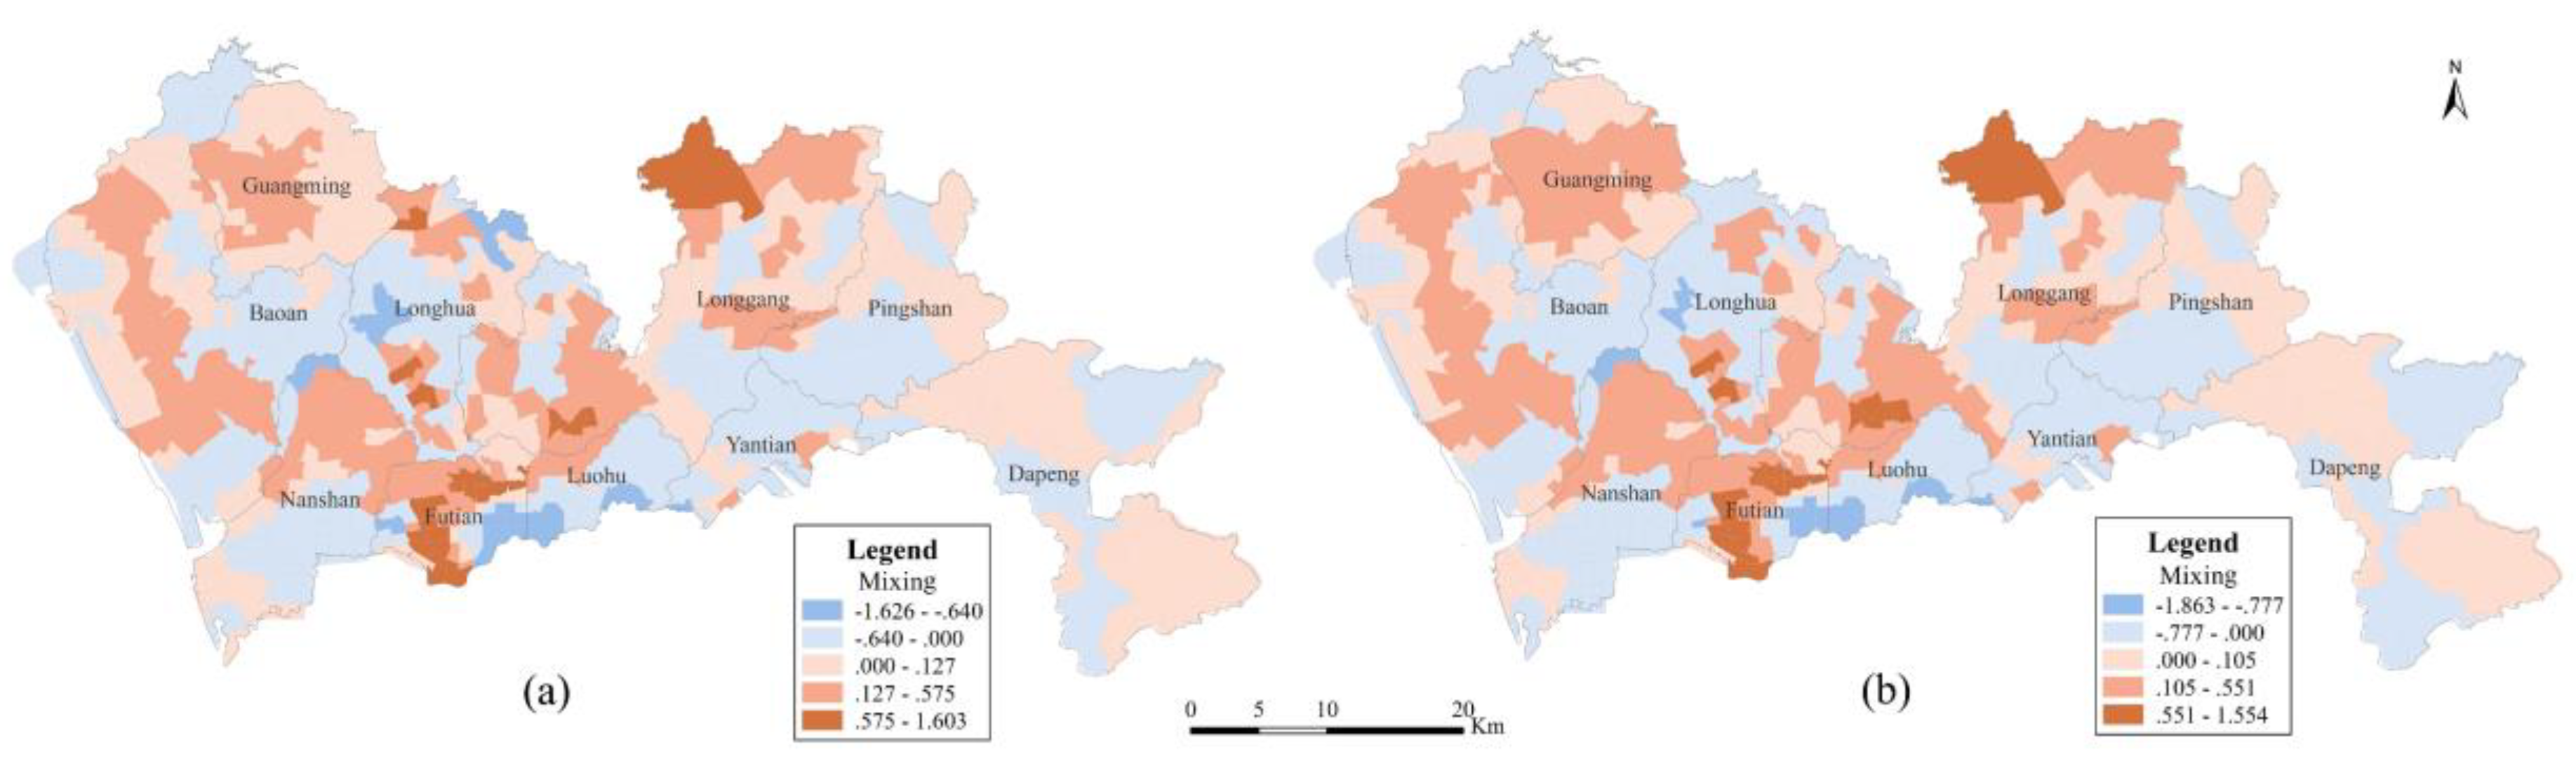
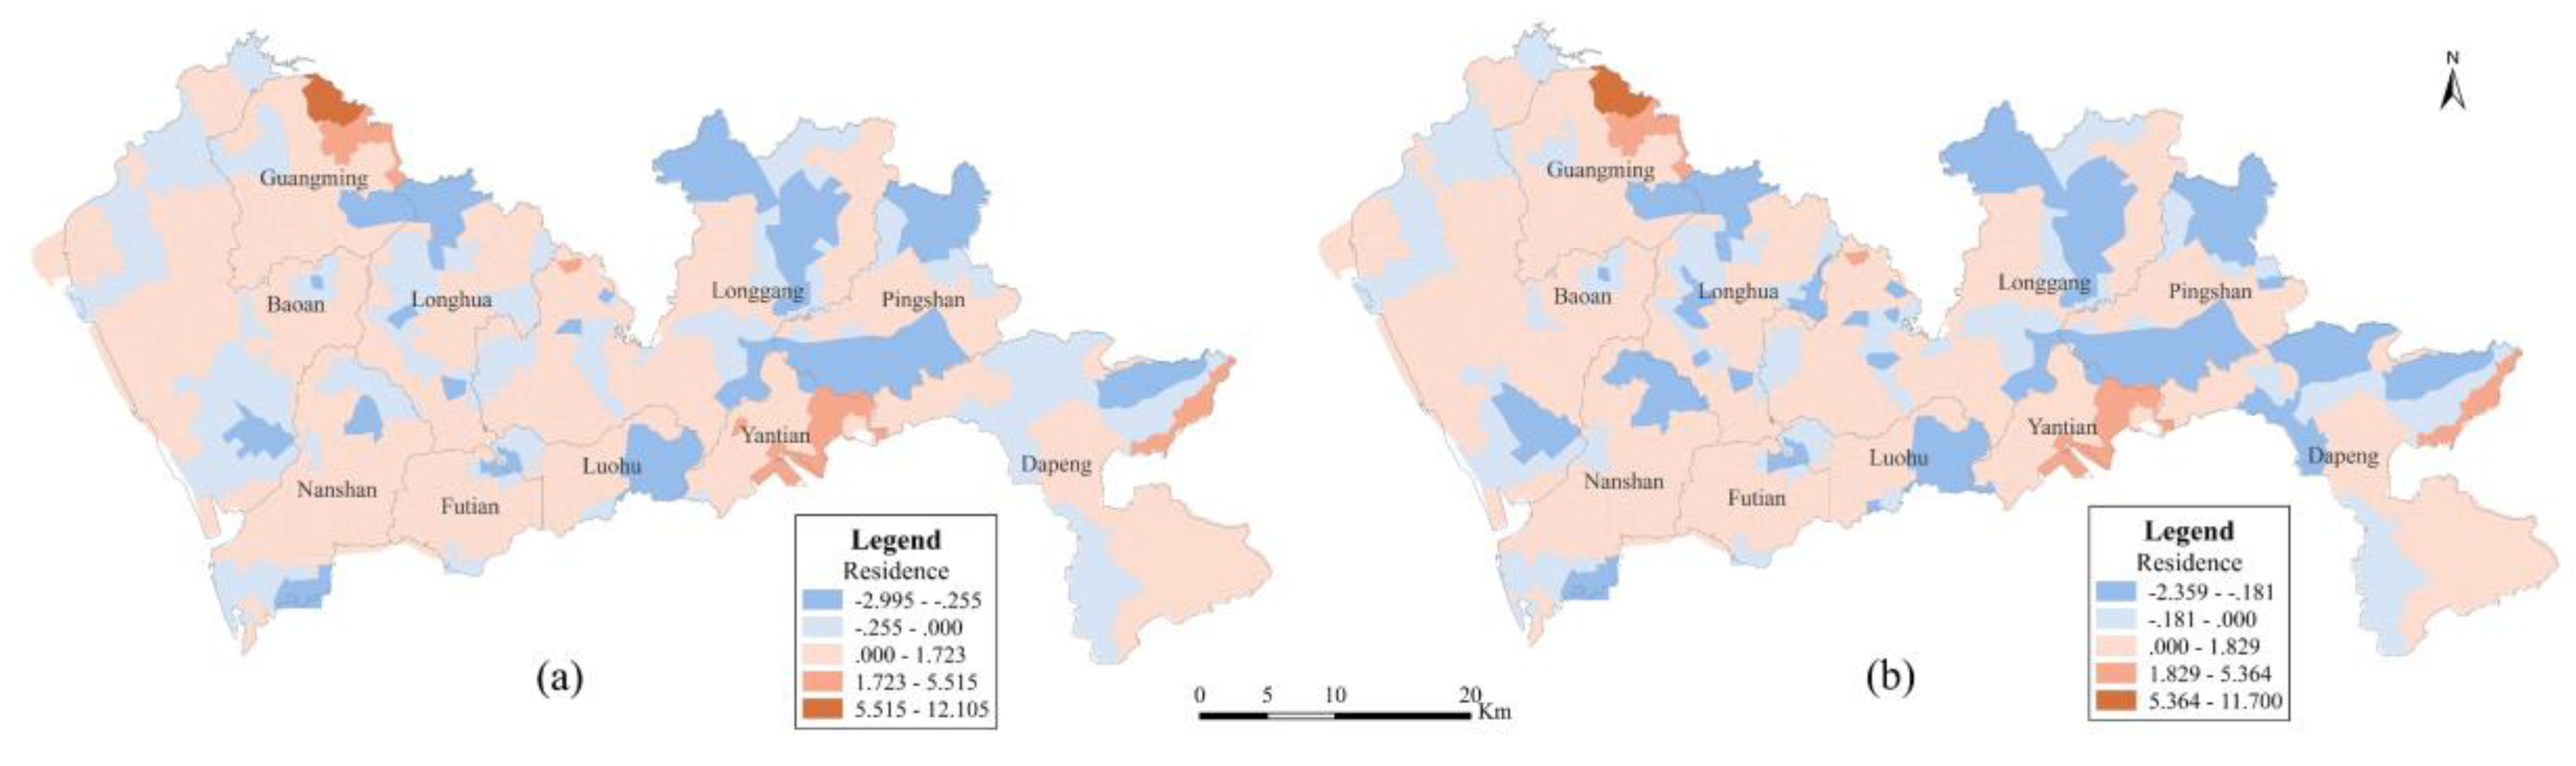
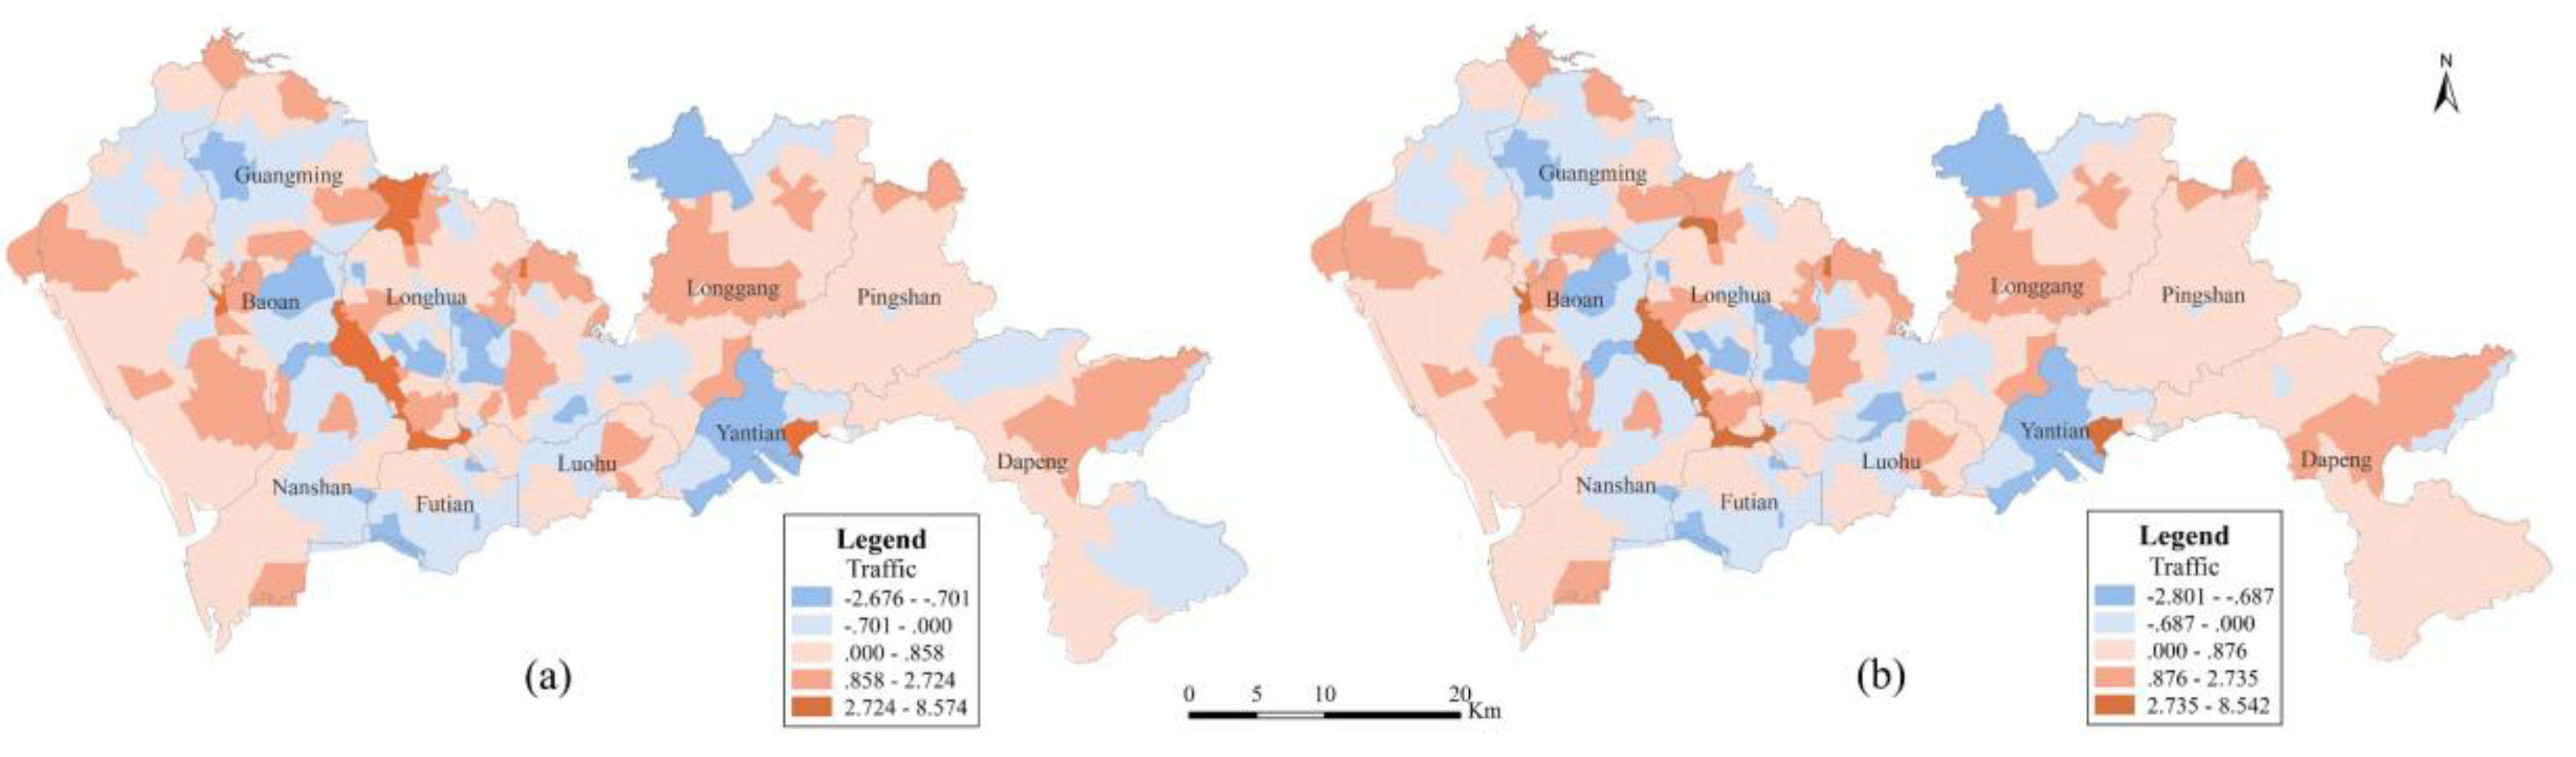
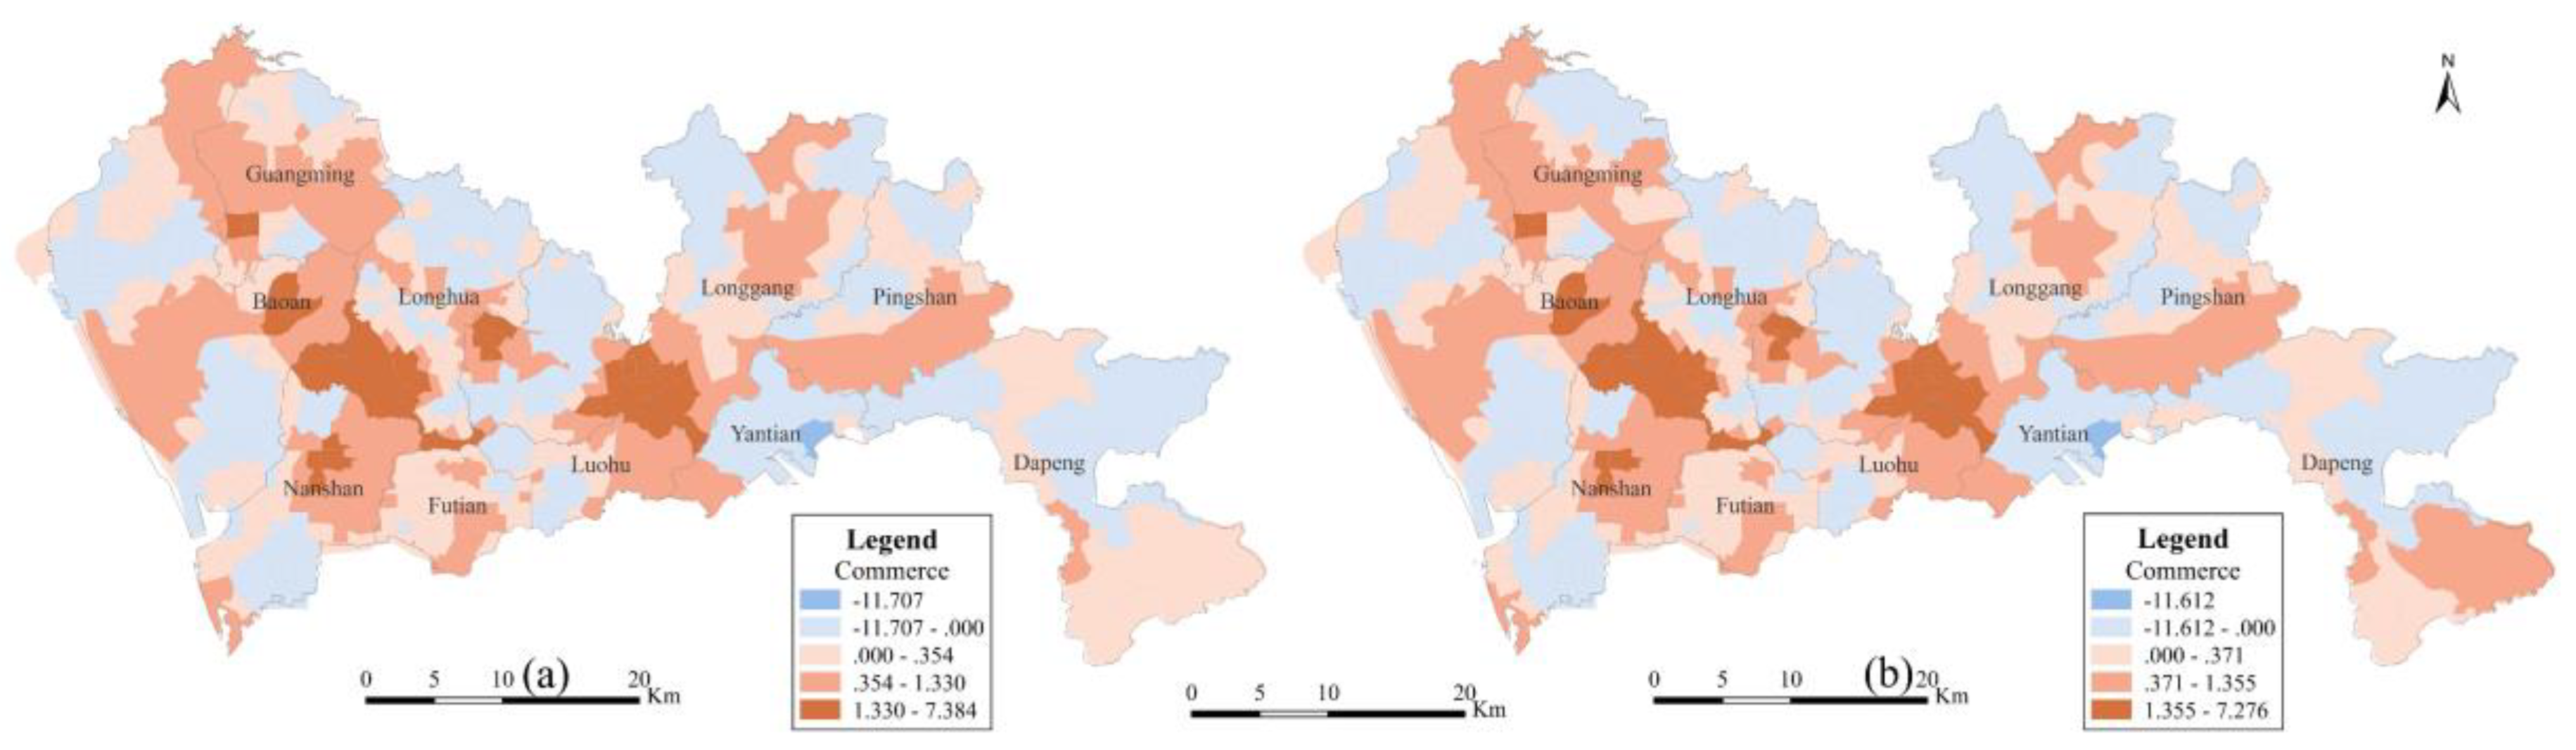
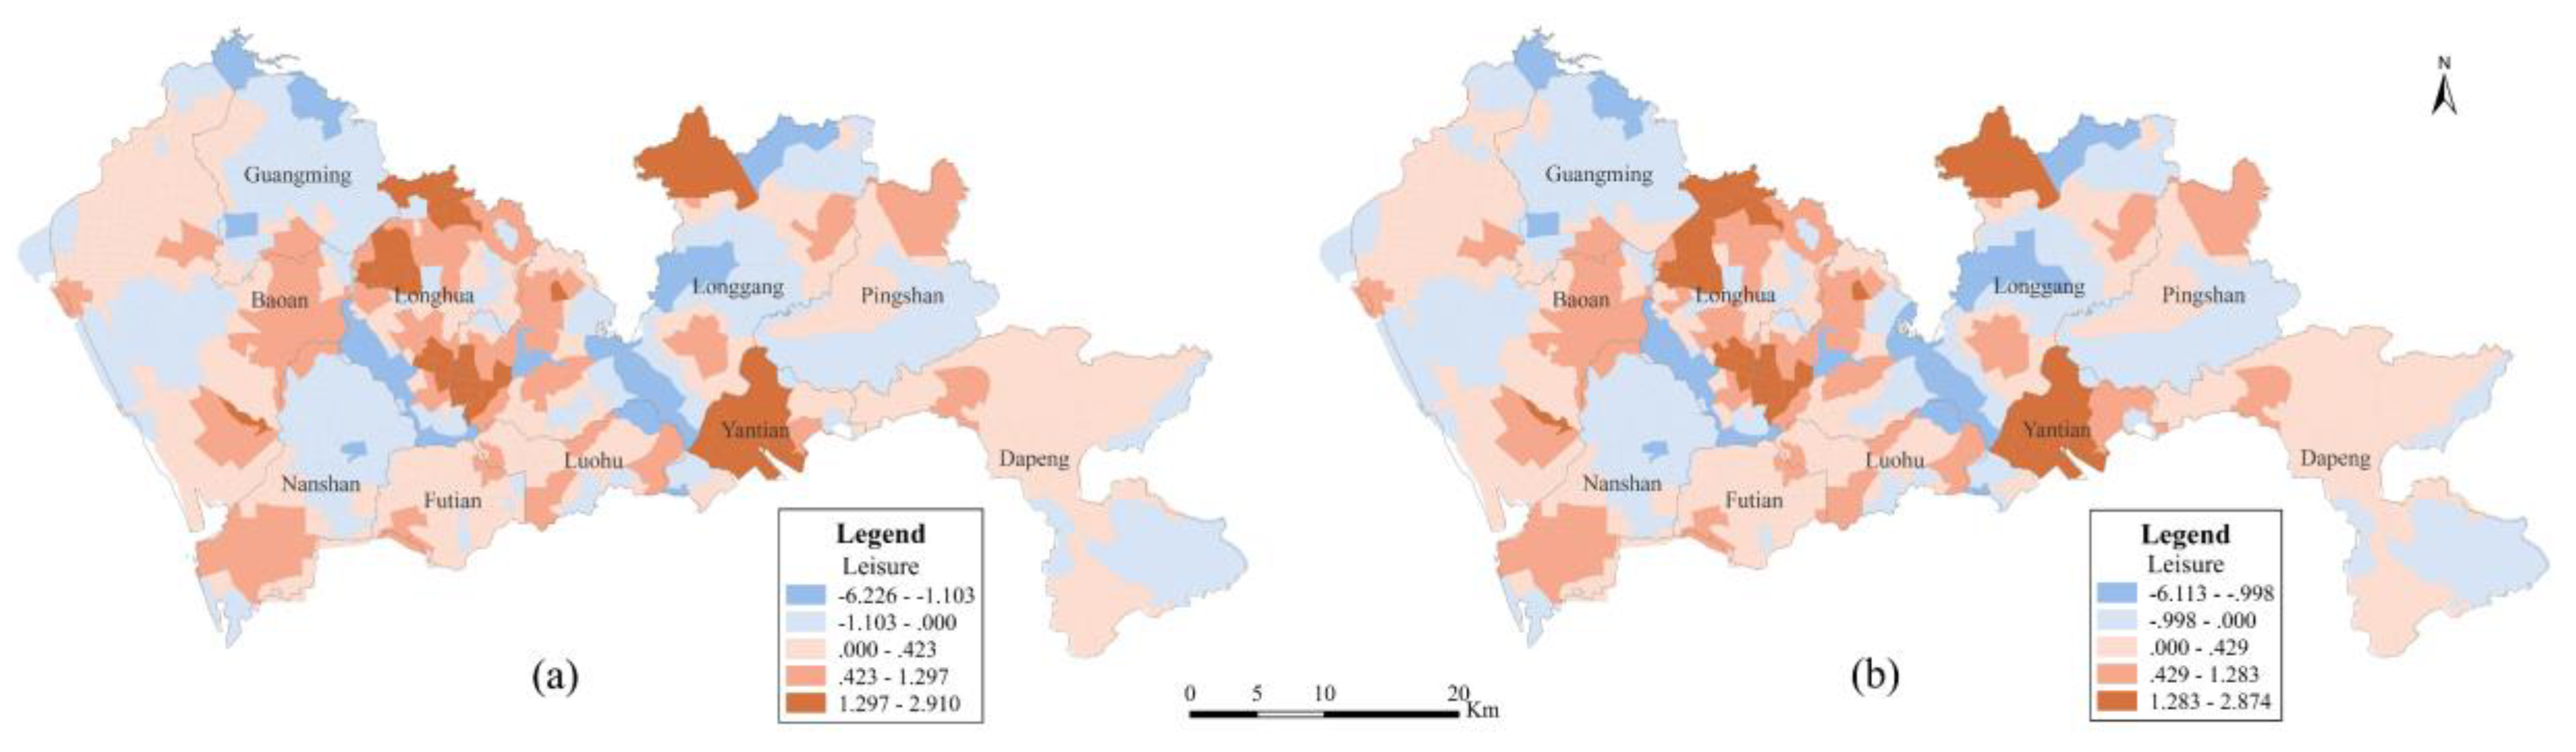
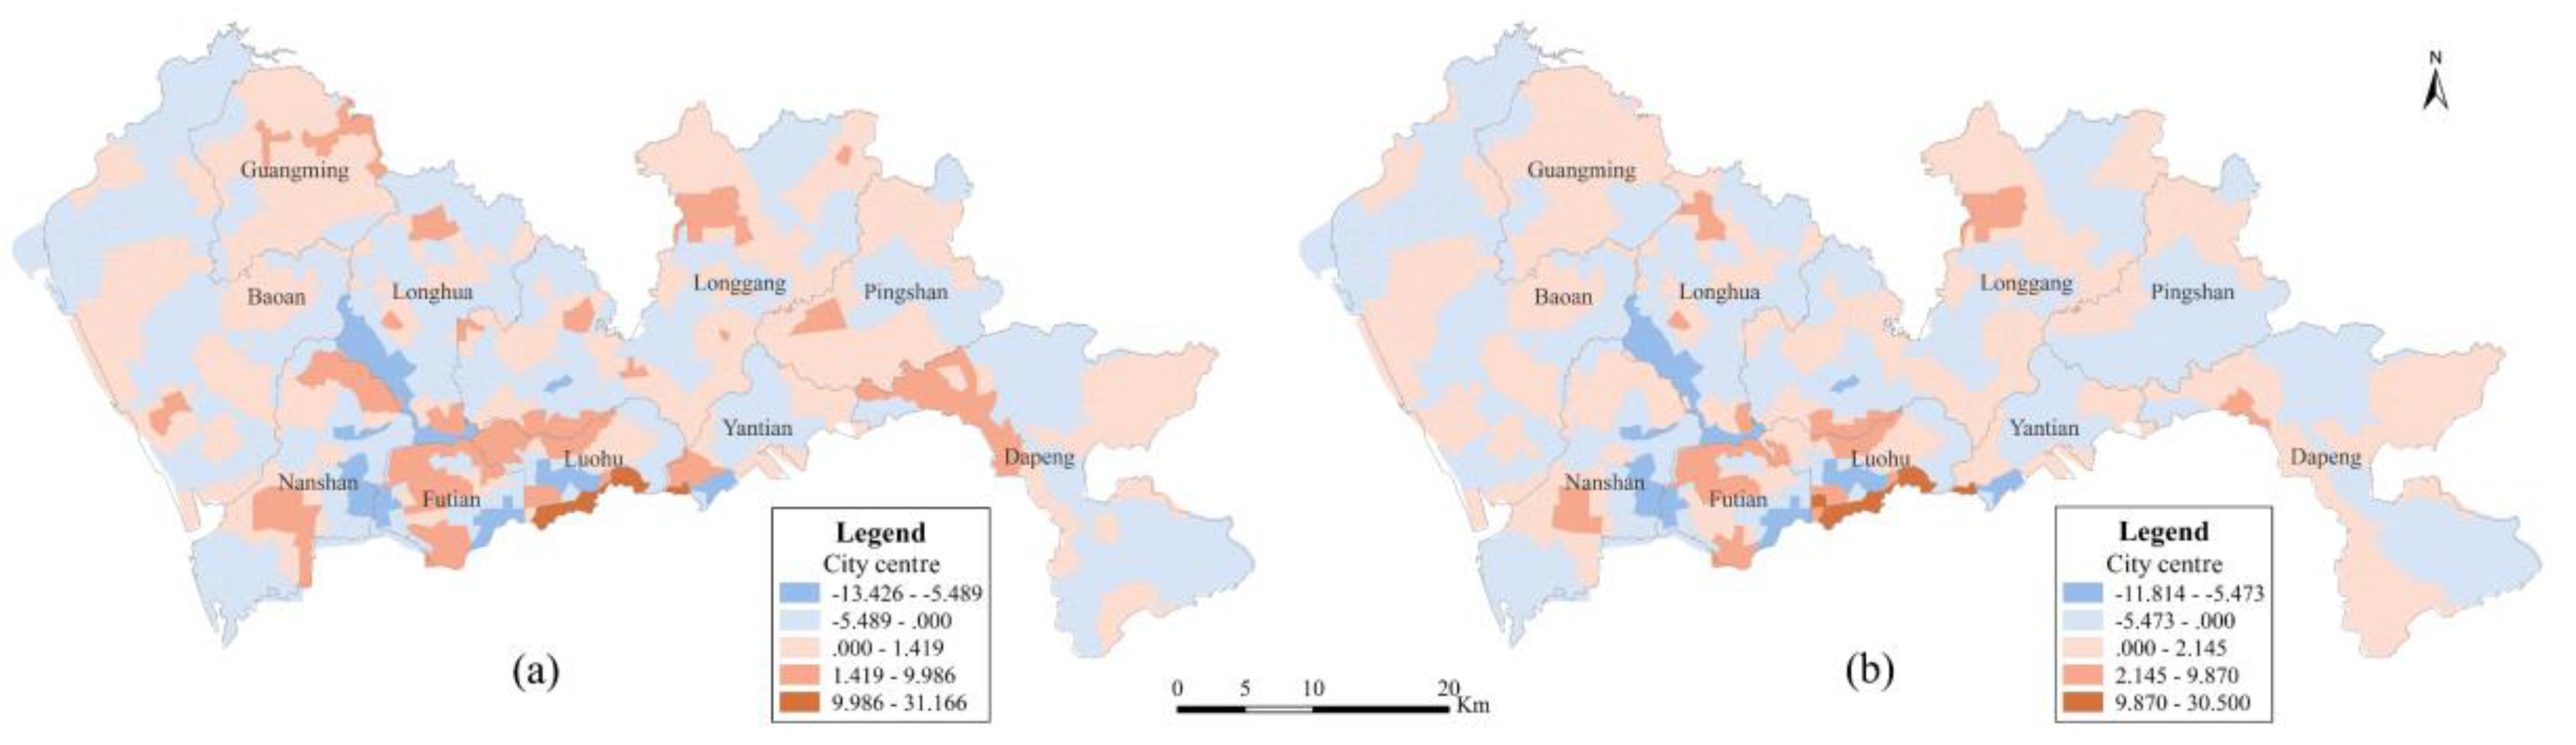
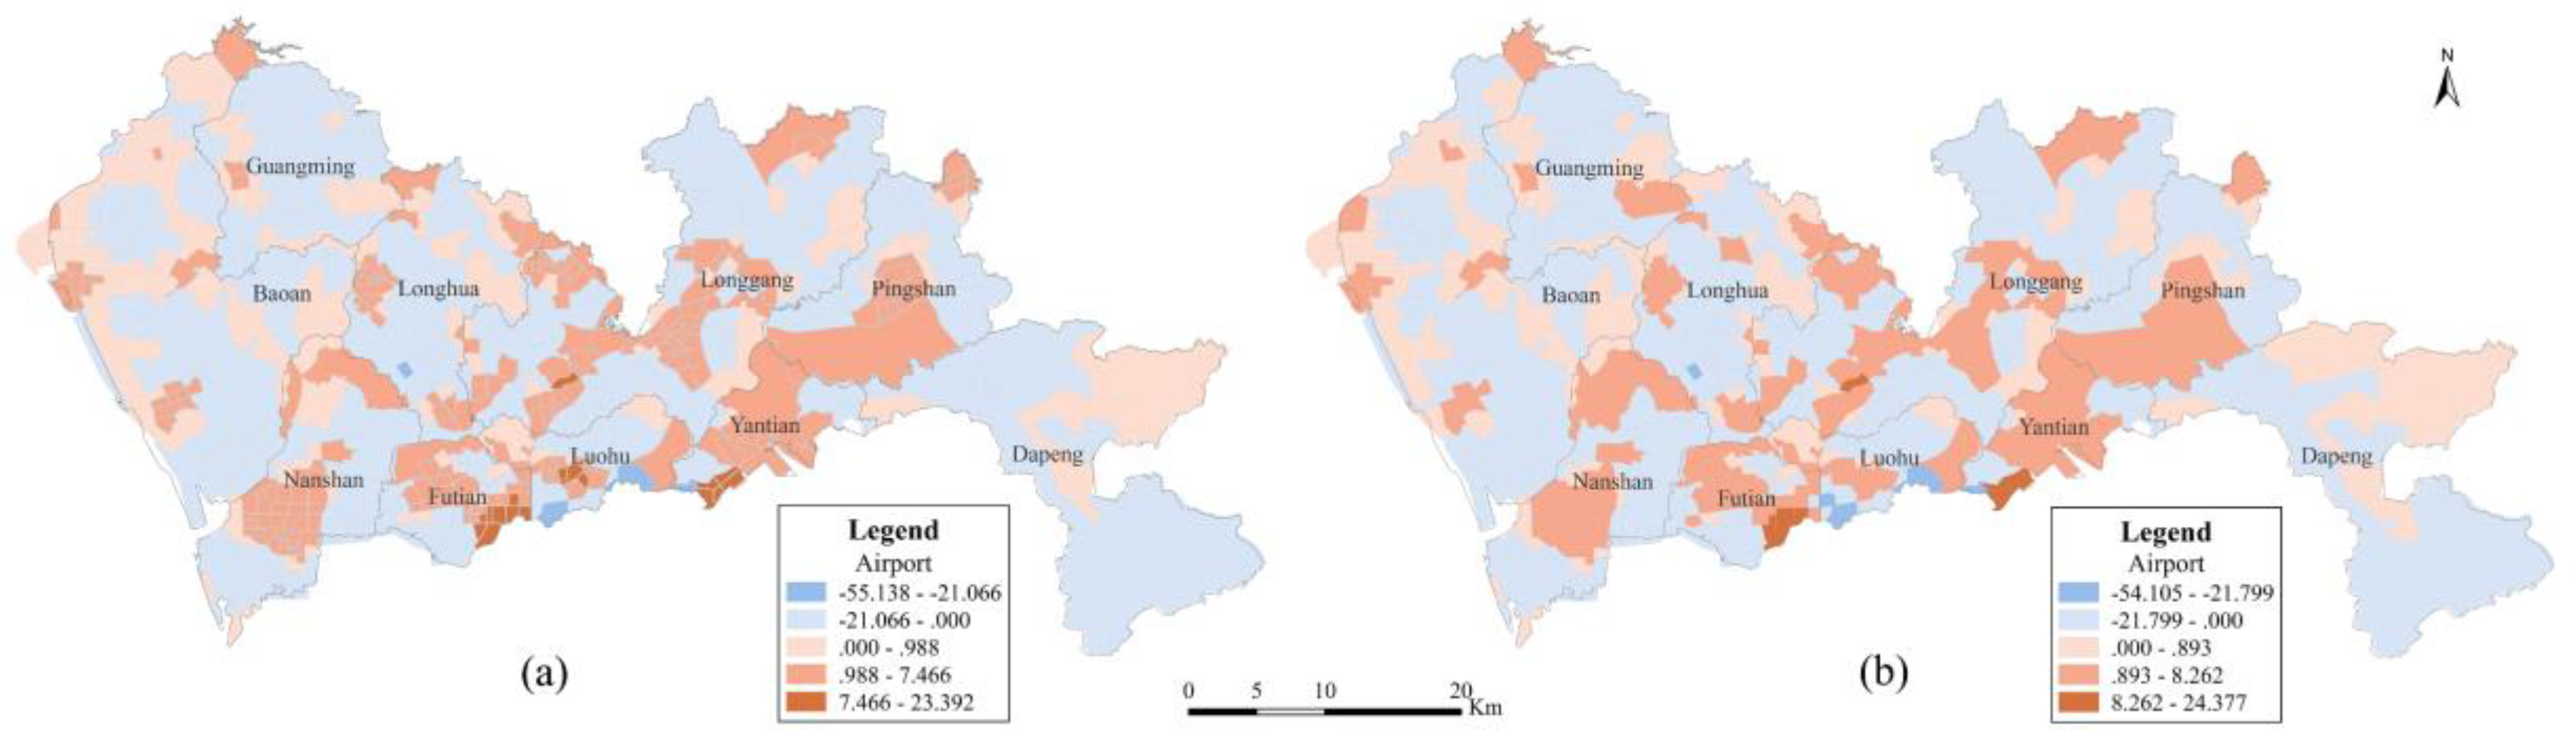
5.3. Visual Analysis of the GTWR Results

To better show the effects of the explanatory variables on vibrancy in the spatial and temporal dimensions, the results for each index on the weekdays and weekends were statistically analysed and plotted separately. In this way, the temporal differences and spatial differences are visualized.
1. Temporal differences
Using the hour as the statistical unit, we calculated and visualized the average coefficients in each TAZ at each time unit for both the weekdays and the weekends. The yellow and green curves in Figure 3 show the variations in the regression coefficients on the weekdays and weekends, respectively. The coefficients of integration, which is positively correlated with urban vibrancy, are positive on weekdays and weekends. The degree of integration reflects the centrality of road traffic and the potential of a given segment as a destination. Therefore, improving the degree of road integration is conducive to enhancing the vibrancy of a city in general. According to the changes in the curve, the effects of integration reach a peak during the working hours on the weekdays and are relatively low at night. The reason for this is potentially because the degree of network integration is higher in work areas, and residents need to agglomerate in areas with good network development. In contrast, the changes in the estimated coefficients are relatively stable on the weekends without work.
The degree of functional mixing is used to express the functional diversity of a TAZ. Many theoretical studies have mentioned that the degree of functional mixing is an important element for improving local vibrancy [7,8]. In this study, the estimated coefficients of the functional mixing degree are negative during the working hours of a day, which may have an inhibitory effect on urban vibrancy; this finding is different from the results of many previous theoretical studies in addition to common sense. These results are explained as follows. During the daytime on weekdays, the demand of residents for urban function is relatively singular because they place work as their first priority; thus, a high degree of functional mixing does not attract people, while the work function occupies a relatively small portion and inhibits the vibrancy of the city. Meanwhile, on the weekends, the estimated coefficients are positive; people are affected by factors such as entertainment, leisure and social contact, and the demand for diversified functions increases. Therefore, a high degree of functional mixing is conducive to enhancing urban vibrancy.
Residence, traffic, commerce and leisure all positively affect urban vibrancy on the weekdays and weekends. The general trend of the influence of the residential density on vibrancy is greater during the night than during the day, and the influence on the weekends is greater than that on the weekdays, thereby reflecting the living habits of Shenzhen residents to some extent. The traffic density during the workday has larger effects on the vibrancy of the city than that during the weekends. There are two peaks at approximately 10:00 and approximately 19:00; these peaks are apparently associated with commuting peaks. With the formation of Shenzhen’s polycentric structure, urban residential areas and urban working areas are spatially separated; accordingly, the demand to travel to work increases the effect of traffic on vibrancy. During the weekends, especially in the evening, residents tend to rest and participate in recreational activities either at home or in their neighbourhood, while they avoid places with heavy traffic. Therefore, the influence of traffic is reduced. The effects of commerce are larger during the weekends than during the weekdays in general, while the changes in the trend are larger during the weekdays. Two low values exist at 9:00 and 18:00, which are also affected by the working hours. These two time periods are more dependent on the traffic density, and the business spending ability is weakened at these times. The influence of the leisure function on the vibrancy of Shenzhen is relatively stable during both the daytime and the night-time; to some extent, this finding indicates that Shenzhen, a bustling city, provides an abundant nightlife for its residents.
The coefficients of the distance to the city centre on working days are negative; hence, the farther the distance is, the weaker the vibrancy of the city. In addition, the effects of the city centre reach a peak during the daytime on weekdays; this is possibly because the central region of Shenzhen is a comprehensive area that encompasses enterprise, business and political functions. These places close to the central region are relatively prosperous; here, the vibrancy of the city increases. In contrast, the coefficients of the distance to the airport on weekdays and weekends are all negative, indicating that the city vibrancy improves with the attenuation of the distance from the airport. More importantly, the magnitude of the improvement in the vibrancy on weekends is greater than that during the daytime on weekdays, suggesting that peoples’ demands for travel to locations outside the city and the demands of people arriving from outside the city are higher during non-working hours.
2. Spatial differences
Taking the TAZ as the statistical unit, we calculated the average values of the regression coefficients over a period of 24 h both on weekdays and on weekends and used the natural breaks (Jenks) method to visualize the grading of categories, in which the differences between categories are significant, while the differences within classes are small [59,60]. The boundary of the classification of each factor was manually set to zero to distinguish positive and negative differences, which can intuitively reflect the enhancement or the restraint of various effects on the city’s vibrancy. The spatial distributions of the estimated coefficients of the indicators are shown from Figure 4, Figure 5, Figure 6, Figure 7, Figure 8, Figure 9, Figure 10 and Figure 11. These figures show that the average value of the regression coefficient of the same index may have positive or negative differences to varying degrees among the different TAZs. In addition, these figures indicate that the effects of the same factors exhibit significant spatial variations that cannot be generalized in this research. Moreover, the influences of the same index on the weekdays and weekends are different, but the same indicators on weekdays and weekends for each TAZ have a similar trend overall. Hence, the reasons for the spatial differences in the variables depend much more on the characteristics of each TAZ.
In terms of the form of the urban transportation network, the regions that are positively correlated with urban vibrancy are focused mainly in central Shenzhen. In the process of urban construction, Shenzhen has always emphasized the construction of multi-centre urban development structures, which are the main clusters of urban functions. A good road network is needed as a skeleton to support the flow of the population to these places. The degree of integration mainly measures the development of the urban road network, describes the centrality of roads, and indicates the potential of roads as destinations. Figure 4 demonstrates that a region with a high degree of integration exhibits a high accessibility. For multiple central regions undertaking important urban functions, enhancing the degree of integration of the road network can significantly improve the urban vibrancy in those regions. In contrast, the places that display negative effects of integration on vibrancy are mostly ecological control areas, which usually have fewer people and facilities.
For the degree of functional mixing (Figure 5), the weekends have larger values than the weekdays, which is consistent with the results of the temporal dimensional analysis. With the exception of passive–active weekdays, improving the functional diversity can achieve better urban vibrancy. The mixing degree is significantly positively correlated with urban vibrancy in some regions, such as the Futian Central Business District (CBD). In the downtown areas of Nanshan and Luohu, the degree of functional mixing has negative impacts. This finding is inconsistent with the scenario mentioned in many studies in which an increase in the mixing degree of core functions can effectively improve the urban vibrancy. One of the main reasons for this is that there are some key functions of planning in these areas, and crowd gathering is mainly attributed to these key functions rather than other functions.
As shown in Figure 6, the positive and negative influences of the living (residence) function on different local areas are not identical. For the living function, the number of TAZs with positive effects on weekends is higher than that on weekdays, which is in accordance with the results of the change in the trend of the temporal dimension coefficient. In addition, the negative effects of the living function on urban vibrancy are focused in the ecological control areas of Shenzhen that contain important sources of water, mountains, green space and ecological environments; in these areas, excessive development is prohibited, and few residential areas and urban residents exist. In contrast, the positive effects of residence throughout Shenzhen are similar; this finding reveals that the residential land use is basically distributed for citizens of Shenzhen.
From the spatial distribution of the traffic function shown in Figure 7, the influence of traffic is very obvious; the effects in the city centre and sub-centres are negative, and those outside the downtown areas are positive. This is because centres usually contain more companies, businesses and other important functional areas that are spatially separated from the surrounding main living areas. The main function of the city centre to attract a gathering population is the demand to work, especially on weekdays. The demand to travel to areas in the city centre relies more on transportation to reach these areas. Hence, the relationship between traffic and vibrancy in these areas is positive. In contrast, for each core region, the facilities are relatively complete in the vicinity of residential areas; as a result, the residents have no need to spend excessive amounts of money on transportation to travel to other places. Moreover, traffic facilities can introduce congestion and noise. Therefore, the traffic function in these areas has a negative impact.
The influence of the commerce function on urban vibrancy is positive in most areas of Shenzhen, particularly in the central regions (Figure 8). This finding shows that the commerce function plays an important role in enhancing urban vibrancy in prosperous and important areas. However, fewer crowds gather in remote areas, that is, less accessible and less developed areas or ecologically controlled areas; thus, the effect of the commerce function on the vibrancy of these areas is negative. The spatial distribution of the influence of commerce suggests that the spatial heterogeneity of POIs coincide with the supply for commerce and business that would lead to differential facilities to attract and retain human activity.
The influence of the leisure function on urban vibrancy contrasts with that of the commerce function in many areas except major central districts (Figure 9). The reason is that commercial consumption is not well developed in relatively remote regions. However, as a result of the natural ecological environment, these places have many famous tourist attractions. Therefore, the leisure function attracts the flow of the population and enhances urban vibrancy. The most apparent places in Shenzhen are some areas in Yantian, Longhua, southwestern Nanshan and Dapeng, which have many famous tourist attractions.
With regard to the influences of the geographical conditions on urban vibrancy, the distance to the city centre shows a negative correlation with vibrancy in many TAZs (Figure 10). This correlation shows that the vibrancy is higher closer to the city centre, that is, the greater the distance is from the city centre, the lower the vibrancy is. However, in some areas, the distance to the city centre is still positively correlated with the vibrancy. Most of these areas are ecological control areas, where the determinants of vibrancy are natural conditions more than geographical location factors.
The influence of the distance to the airport on vibrancy is mostly negative, indicating that a smaller distance to the airport correlates to a higher city vibrancy (Figure 11). In general, the areas with negative effects are focused mainly in multiple core regions, suggesting that the residents in these areas have a higher demand for foreign travel. Yantian suffers from an ageing problem; hence, the residents have few opportunities and demand to travel outside the city. The greater is the distance from the airport, the more positive is the vibrancy of the city. Notably, in the city centre, the effect of the distance from the airport is positive because the distance from the airport is not the most important or significant factor of vibrancy.

5.4. Planning Implications

By modelling the spatiotemporal relationships between urban vibrancy and its relevant influencing factors based on mobile phone data and GTWR, this study quantitatively expressed the influences of various factors on urban vibrancy at high spatial and temporal resolutions. According to the empirical results, this article provides certain insights into urban form planning and urban vibrancy improvement; these insights mainly include the following points:
(1)
The foundation of urban planning is people oriented. The underlying reasons for urban dynamics are the activities of people in a city, and the effects of many factors on urban vibrancy depend on the related functions and activities of city residents regardless of whether those residents exert an active or passive demand. Therefore, learning the rules of human activity is necessary and constitutes the foundation for improving urban life. This article proposes the use of data from the perspective of human perception, which can provide effective support for other fields of urban study and planning.
(2)
Improvements to urban vibrancy should be adapted to the local conditions. According to the results obtained by GTWR, the impacts of the same index on the urban vibrancy framework vary in different local areas and time periods and cannot be generalized. Investigating the local conditions is therefore important to formulate relevant planning schemes.
(3)
Overall, a good traffic network is positively correlated with urban vibrancy, especially during the daytime on weekdays. Therefore, urban vibrancy can be enhanced by reasonably planning the traffic network, improving the integration of roads and the travel degree, and increasing the potential of a region to become an activity destination and movement channel. The functional form of a city also possesses a very important influence on the vibrancy of the city. Specific measures to improve the vibrancy of the city include increasing the functions related to “the third type of places” [61], such as business consumption, tourism and leisure, improving the degree of regional functional mixing and enhancing the diversity of functions. Many facilities outside the city centre provide a wide range of personal items to urban consumers, making life in the suburbs more active by retaining social engagement activities according to the time and location. Our results shed lights on the importance of the new Chinese government programme in 2016 that aims to construct open communities, thereby easing land use and increasing the degree of functional mixing. Therefore, promoting spatial restructuring to adapt the city to industrial upgrading and linkage development for office buildings and service industries can ensure the efficient utilization of regional urban functions.
(4)
In general, the city centre can exhibit better vibrancy if it exhibits a diversity of functional combinations and a dynamic sustainable development. In addition, constructing a polycentric urban structure is a powerful way to improve the vibrancy of downtown areas that are far from the city centre. On the one hand, unified planning with attention to detail and optimizing the internal structure in the Futian CBD is important, as this approach can consolidate the position of the city centre area and enhance the ontological vibrancy of the CBD. On the other hand, constructing a multi-axis, multi-centre urban development frame with a strong network is also important. The geographical location conditions of each region should be evaluated according to the locations of important urban facilities, and the layout should be planned accordingly.

6. Conclusions

Urban vibrancy has long constituted a popular research topic; accordingly, accurately and effectively measuring urban vibrancy and exploring the factors that influence urban vibrancy have always been key points in urban study and planning [7]. With the development of big data-related theories and technologies, the study of urban vibrancy has gradually changed from qualitative summaries to quantitative calculations. Thus, this study used mobile phone data to extract the hourly population distribution on weekdays and weekends in each TAZ to represent the local vibrancy. Based on the kernel density analysis method, real-time population data are visualized, and the evolutionary characteristics of the spatial and temporal distributions of the city’s vibrancy on different characteristic days and different time periods are presented. With regard to the spatiotemporal nonstationarity of the data, GTWR was used to explore the influences of various factors on urban vibrancy with high temporal and spatial resolutions, and the urban vibrancy and influencing factor equations were quantitatively obtained. The estimated coefficients with different temporal and spatial dimensions are visualized to illustrate how multiple factors affect urban vibrancy differently in local areas at different times. By assessing and measuring urban vibrancy, urban designers and planners may be able to address the quality of the pedestrian environment, which may facilitate progress towards more integrated, appealing, inclusive and walking-conducive cities.
Generally speaking, this paper can beneficially fit into the wide framework composed of geographic information systems (GIS), space syntax and urban study and planning. The achievements and innovations in this paper include the following:
(1)
Quantitative calculations and visualizations display the dynamic changes of the population of Shenzhen at different times with different characteristics. This article emphasizes the importance of human activities throughout the city and measures the local vibrancy at a fine scale. More importantly, mobile phone signal data have numerous advantages; for example, they are collected in real time with a small sample deviation and differences among many groups.
(2)
A framework of the factors that influence urban vibrancy was constructed. In addition, from an urban morphological perspective, an indicator system of urban vibrancy influencing factors was constructed from three aspects: the traffic network morphology, urban function morphology, and urban geographical location. The value of each indicator was quantitatively calculated through theories and methods such as space syntax and information entropy; furthermore, a regression model was constructed as an explanatory variable, and urban vibrancy was represented by the number of people per hour. The descriptions of phenomena based on observations and experience were transformed into calculations of urban vibrancy based on theories and methods.
(3)
A regression model of urban vibrancy and its various influencing factors was established, and the influence of each factor on urban vibrancy was expressed quantitatively. GTWR was adopted to delve into the influencing factors of time and the effects of their changes. In addition, the higher degree of fitting can more effectively explain the vibrancy of Shenzhen and the influencing factors of the factors in different situations.
This study has several limitations that deserve further research. With regard to the spatial accuracy, at present, mobile phone data are obscured by a series of confidentiality requirements; consequently, the accuracy is not allowed to be smaller than the spatial TAZ unit. Under the permissions of future objective conditions, a grid unit on a more detailed scale can be used to replace the TAZ for higher-resolution experimental research [7]. In addition, from the perspective of urban morphology, the current indexes of the proposed framework are not sufficient due to data limitations. Many other factors play important roles in urban form, including the building density and plot ratio. In the future, under the conditions of data availability, we will continue to enrich the framework of research indicators and study urban vibrancy from a more complete perspective.

Author Contributions

Data curation, S.L. (Sheng Li); Funding acquisition, F.R.; Investigation, S.L. (Sheng Li); Methodology, L.T. and C.W.; Project administration, F.R.; Resources, L.T.; Software, Y.L. and C.W.; Visualization, S.L. (Sijia Li) and J.L.; Writing—original draft, C.W.; and Writing—review and editing, F.R and C.W. All authors read and approved the final manuscript.

Funding

This research was funded by the Open Fund of the Key Laboratory of Urban Land Resources Monitoring and Simulation Ministry of Land and Resources [No. KF-2016-02-028] and the National Natural Science Foundation of China [Project No. 41571438].

Conflicts of Interest

The authors declare no conflicts of interest.

References

  1. Delclòs-Alió, X.; Miralles-Guasch, C. Looking at Barcelona through Jane Jacobs’s eyes: Mapping the basic conditions for urban vitality in a Mediterranean conurbation. Land Use Pol. 2018, 75, 505–517. [Google Scholar] [CrossRef]
  2. Montgomery, J. Making a city: Urbanity, vitality and urban design. J. Urban Des. 1998, 3, 93–116. [Google Scholar] [CrossRef]
  3. Jacobs, J. The Death and Life of Great American Cities; Random House: New York, NY, USA, 1961. [Google Scholar]
  4. Jacobs, J. The Life of Cities; Random House: New York, NY, USA, 1969. [Google Scholar]
  5. Sulis, P.; Manley, E.; Zhong, C.; Batty, M. Using mobility data as proxy for measuring urban vitality. J. Spat. Inf. Sci. 2018, 16, 137–162. [Google Scholar] [CrossRef]
  6. Sung, H.; Lee, S. Residential built environment and walking activity: Empirical evidence of Jane Jacobs’ urban vitality. Transp. Res. Part D Transp. Environ. 2015, 41, 318–329. [Google Scholar] [CrossRef]
  7. Wu, C.; Ye, X.; Ren, F.; Du, Q. Check-in behaviour and spatio-temporal vibrancy: An exploratory analysis in shenzhen, china. Cities 2018, 77, 104–116. [Google Scholar] [CrossRef]
  8. Yue, Y.; Zhuang, Y.; Yeh, A.G.; Xie, J.-Y.; Ma, C.-L.; Li, Q.-Q. Measurements of POI-based mixed use and their relationships with neighbourhood vibrancy. Int. J. Geogr. Inf. Sci. 2017, 31, 658–675. [Google Scholar] [CrossRef]
  9. Alexander, C. The Timeless Way of Building; Oxford University Press: New York, NY, USA, 1979; Volume 1. [Google Scholar]
  10. Lynch, K. Good City Form; MIT Press: Cambridge, MA, USA, 1984. [Google Scholar]
  11. Gehl, J. A changing street life in a changing society. Places 1989, 6, 8–17. [Google Scholar]
  12. Landry, C. Urban vitality: A new source of urban competitiveness. Archis 2000, 12, 8–13. [Google Scholar]
  13. Jiang, D. The Theory of City form Vitality; Southeast University Press: Nanjing, China, 2007. (In Chinese) [Google Scholar]
  14. Djankov, S.; Glaeser, E.; La Porta, R.; Lopez-de-Silanes, F.; Shleifer, A. The new comparative economics. J. Comp. Econ. 2003, 31, 595–619. [Google Scholar] [CrossRef] [Green Version]
  15. Shen, L.-Y.; Ochoa, J.J.; Shah, M.N.; Zhang, X. The application of urban sustainability indicators—A comparison between various practices. Habitat Int. 2011, 35, 17–29. [Google Scholar] [CrossRef]
  16. Shen, Y.; Karimi, K. The economic value of streets: Mix-scale spatio-functional interaction and housing price patterns. Appl. Geogr. 2017, 79, 187–202. [Google Scholar] [CrossRef]
  17. Shen, Y.; Karimi, K. Urban function connectivity: Characterisation of functional urban streets with social media check-in data. Cities 2016, 55, 9–21. [Google Scholar] [CrossRef] [Green Version]
  18. Ying, L.; Yin, Z. Quantitative evaluation on street vibrancy and its impact factors: A case study of Chengdu. New Architect. 2016, 1, 52–57. (In Chinese) [Google Scholar]
  19. Buyantuyev, A.; Wu, J.; Gries, C.J.L.; Planning, U. Multiscale analysis of the urbanization pattern of the Phoenix metropolitan landscape of USA: Time, space and thematic resolution. Landsc. Urban Plan. 2010, 94, 206–217. [Google Scholar] [CrossRef]
  20. Dovey, K.; Pafka, E. The urban density assemblage: Modelling multiple measures. Urban Des. Int. 2014, 19, 66–76. [Google Scholar] [CrossRef]
  21. Deng, C.; Ma, J.J.L.; Planning, U. Viewing urban decay from the sky: A multi-scale analysis of residential vacancy in a shrinking US city. Landsc. Urban Plan. 2015, 141, 88–99. [Google Scholar] [CrossRef]
  22. Turkoglu, H.J.P.-S.; Sciences, B. Sustainable development and quality of urban life. Procedia Soc. Behav. Sci. 2015, 202, 10–14. [Google Scholar] [CrossRef]
  23. Apparicio, P.; Landry, S.; Lewnard, J.J.L.; Planning, U. Disentangling the effects of urban form and socio-demographic context on street tree cover: A multi-level analysis from Montréal. Landsc. Urban Plan. 2017, 157, 422–433. [Google Scholar]
  24. Forsyth, A. What is a walkable place? The walkability debate in urban design. Urban Des. Int. 2015, 20, 274–292. [Google Scholar] [CrossRef] [Green Version]
  25. Jacobs-Crisioni, C.; Rietveld, P.; Koomen, E.; Tranos, E. Evaluating the impact of land-use density and mix on spatiotemporal urban activity patterns: An exploratory study using mobile phone data. Environ. Plan. A 2014, 46, 2769–2785. [Google Scholar] [CrossRef]
  26. De Nadai, M.; Staiano, J.; Larcher, R.; Sebe, N.; Quercia, D.; Lepri, B. The death and life of great Italian cities: A mobile phone data perspective. In Proceedings of the 25th International Conference on World Wide Web, Montreal, QC, Canada, 11–15 April 2016; pp. 413–423. [Google Scholar]
  27. Gehl, J. Life between Buildings: Using Public Space; Island Press: Washington, DC, USA, 2011. [Google Scholar]
  28. Trancik, R. Finding Lost Space: Theories of Urban Design; John Wiley & Sons: Hoboken, NJ, USA, 1986. [Google Scholar]
  29. Mehta, V. Lively streets: Determining environmental characteristics to support social behavior. J. Plan. Educ. Res. 2007, 27, 165–187. [Google Scholar] [CrossRef]
  30. Sung, H.-G.; Go, D.-H.; Choi, C.G. Evidence of Jacobs’s street life in the great Seoul city: Identifying the association of physical environment with walking activity on streets. Cities 2013, 35, 164–173. [Google Scholar] [CrossRef]
  31. Huang, B.; Wu, B.; Barry, M. Geographically and temporally weighted regression for modeling spatio-temporal variation in house prices. Int. J. Geogr. Inf. Sci. 2010, 24, 383–401. [Google Scholar] [CrossRef]
  32. Wu, B.; Li, R.; Huang, B. A geographically and temporally weighted autoregressive model with application to housing prices. Int. J. Geogr. Inf. Sci. 2014, 28, 1186–1204. [Google Scholar] [CrossRef]
  33. Chu, H.-J.; Huang, B.; Lin, C.-Y. Modeling the spatio-temporal heterogeneity in the PM10–PM2.5 relationship. Atmos. Environ. 2015, 102, 176–182. [Google Scholar] [CrossRef]
  34. Liu, Y.; Chen, Z.-M.; Xiao, H.; Yang, W.; Liu, D.; Chen, B. Driving factors of carbon dioxide emissions in China: An empirical study using 2006–2010 provincial data. Front. Earth Sci. 2017, 11, 156–161. [Google Scholar] [CrossRef]
  35. Koohsari, M.J.; Sugiyama, T.; Mavoa, S.; Villanueva, K.; Badland, H.; Giles-Corti, B.; Owen, N. Street network measures and adults’ walking for transport: Application of space syntax. Health Place 2016, 38, 89–95. [Google Scholar] [CrossRef]
  36. Karimi, K. Space Syntax: Consolidation and Transformation of an Urban Research Field; Taylor & Francis: Abingdon, UK, 2018. [Google Scholar]
  37. Jiang, B.; Claramunt, C.; Klarqvist, B. Integration of space syntax into GIS for modelling urban spaces. Int. J. Appl. Earth Obs. Geoinf. 2000, 2, 161–171. [Google Scholar] [CrossRef] [Green Version]
  38. Hillier, B. Space and spatiality: What the built environment needs from social theory. Build. Res. Informat. 2008, 36, 216–230. [Google Scholar] [CrossRef]
  39. Karimi, K. A configurational approach to analytical urban design: ‘Space syntax’methodology. Urban Des. Int. 2012, 17, 297–318. [Google Scholar] [CrossRef]
  40. Mahmoud, A.H.; Omar, R. Planting design for urban parks: Space syntax as a landscape design assessment tool. Front. Archit. Res. 2015, 4, 35–45. [Google Scholar] [CrossRef]
  41. Li, X.; Lv, Z.; Zheng, Z.; Zhong, C.; Hijazi, I.H.; Cheng, S. Assessment of lively street network based on geographic information system and space syntax. Multimed. Tools Appl. 2017, 76, 17801–17819. [Google Scholar] [CrossRef]
  42. Sharmin, S.; Kamruzzaman, M. Meta-analysis of the relationships between space syntax measures and pedestrian movement. Transp. Rev. 2018, 38, 524–550. [Google Scholar] [CrossRef]
  43. Seamon, D. A lived hermetic of people and place: Phenomenology and space syntax. In Proceedings of the 6th International Space Syntax Symposium, Istanbul, Turkey, 12–15 June 2007; pp. iii-1–iii-16. [Google Scholar]
  44. Ye, Y.; Van Nes, A. Quantitative tools in urban morphology: Combining space syntax, spacematrix and mixed-use index in a GIS framework. Urban Morphol. 2014, 18, 97–118. [Google Scholar]
  45. Lerman, Y.; Rofè, Y.; Omer, I. Using space syntax to model pedestrian movement in urban transportation planning. Geogr. Anal. 2014, 46, 392–410. [Google Scholar] [CrossRef]
  46. Omer, I.; Kaplan, N. Using space syntax and agent-based approaches for modeling pedestrian volume at the urban scale. Comput. Environ. Urban Syst. 2017, 64, 57–67. [Google Scholar] [CrossRef]
  47. Omer, I.; Kaplan, N. Structural properties of the angular and metric street network’s centralities and their implications for movement flows. Env. Plan. B Urban Anal. CIty Sci. 2018. [Google Scholar] [CrossRef]
  48. Hillier, B. Studying cities to learn about minds: Some possible implications of space syntax for spatial cognition. Environ. Plan. B Plan. Des. 2012, 39, 12–32. [Google Scholar] [CrossRef]
  49. Hillier, W.; Yang, T.; Turner, A. Advancing DepthMap to advance our understanding of cities: Comparing streets and cities and streets with cities. In Proceedings of the Eighth International Space Syntax Symposium, Santiago de Chile, Chile, 3–6 January 2002. [Google Scholar]
  50. Hillier, B.; Iida, S. Network and psychological effects in urban movement. In Proceedings of the International Conference on Spatial Information Theory, Ellicottville, NY, USA, 14–18 September 2005; pp. 475–490. [Google Scholar]
  51. Jiang, B. Axwoman 6.0: An ArcGIS Extension for Urban Morphological Analysis; University of Gävle: Gävle, Sweden, 2012. [Google Scholar]
  52. Varoudis, T. DepthmapX Multi-Platform Spatial Network Analysis Software. 2012. Available online: http://varoudis.github. io/depthmapX (accessed on 9 July 2017).
  53. Carlos, H.A.; Shi, X.; Sargent, J.; Tanski, S.; Berke, E. Density estimation and adaptive bandwidths: A primer for public health practitioners. Int. J. Health Geogr. 2010, 9, 39. [Google Scholar] [CrossRef] [PubMed] [Green Version]
  54. Shannon, C.; Weaver, W. Biodiversity Measurements; Urbana University Press: Urbana, IL, USA, 1948; pp. 117–127. [Google Scholar]
  55. Xing, H.; Meng, Y.; Shi, Y. A dynamic human activity-driven model for mixed land use evaluation using social media data. Trans. GIS 2018, 22, 1130–1151. [Google Scholar] [CrossRef]
  56. Liu, X.; Long, Y.J.E.; Planning, P. Automated identification and characterization of parcels with OpenStreetMap and points of interest. Environ. Plan. B Plan. Des. 2016, 43, 341–360. [Google Scholar] [CrossRef]
  57. Corbusier, L.; Eardley, A. The Athens Charter; Grossman Publishers: New York, NY, USA, 1973. [Google Scholar]
  58. Li, C.; Wang, M.; Wang, J.; Wu, W. The Geography of City Liveliness and Land Use Configurations: Evidence from Location-Based Big Data in Beijing; Spatial Economics Research Centre (LSE): London, UK, 2016. [Google Scholar]
  59. McMaster, R. In Memoriam: George F. Jenks (1916–1996). Cartogr. Geogr. Inf. Syst. 1997, 24, 56–59. [Google Scholar] [CrossRef]
  60. Jenks, G. The data model concept in statistical mapping. Int. Yearb. Cartogr. 1967, 7, 186–190. [Google Scholar]
  61. Oldenburg, R. The Great Good Place: Café, Coffee Shops, Community Centers, Beauty Parlors, General Stores, Bars, Hangouts, and How They Get You through the Day; Paragon House Publishers: St Paul, MN, USA, 1989. [Google Scholar]
Figure 1. The TAZs in the city of Shenzhen.
Sustainability 10 04565 g001
Figure 2. The real-life situations related to urban vibrancy in Shenzhen: (a) Windows of The World; (b) Dongmen Pedestrian Street; (c) Mangrove Forest Nature Reserve; and (d) Lotus Hill Park. (Source: https://image.baidu.com/).
Sustainability 10 04565 g002
Figure 3. The 24-h changes in the estimated coefficients based on GTWR.
Sustainability 10 04565 g003
Figure 4. Spatial distribution of the estimated coefficients of integration: (a) weekdays; and (b) weekends.
Sustainability 10 04565 g004
Figure 5. Spatial distribution of the estimated coefficients of the degree of functional mixing: (a) weekdays; and (b) weekends.
Sustainability 10 04565 g005
Figure 6. Spatial distribution of the estimated coefficients of residence: (a) weekdays; and (b) weekends.
Sustainability 10 04565 g006
Figure 7. Spatial distribution of the estimated coefficients of traffic: (a) weekdays; and (b) weekends.
Sustainability 10 04565 g007
Figure 8. Spatial distribution of the estimated coefficients of commerce: (a) weekdays; and (b) weekends.
Sustainability 10 04565 g008
Figure 9. Spatial distribution of the estimated coefficients of leisure: (a) weekdays; and (b) weekends.
Sustainability 10 04565 g009
Figure 10. Spatial distribution of the estimated coefficients of the distance to the city centre: (a) weekdays; and (b) weekends
Sustainability 10 04565 g010
Figure 11. Spatial distribution of the estimated coefficients of the distance to the airport: (a) weekdays; and (b) weekends.
Sustainability 10 04565 g011
Table 1. The descriptions of the influencing factors.
AspectsIndicator Abbreviations
Road traffic patternIntegration of roadIntegration
Choice of roadChoice
Urban functional formDegree of mixingMixing
Density of residenceResidence
Density of trafficTraffic
Density of commerceCommerce
Density of leisureLeisure
Locational conditionDistance to city centreCity centre
Distance to airportAirport
Table 2. Results of the diagnostic information.
VariableTolerance_before VIF_beforeTolerance_afterVIF_after
Mixing0.7691.3010.7811.280
Residence0.6271.5950.6301.586
Traffic0.2304.3490.2304.344
Commerce0.2384.2100.2384.204
Leisure0.2663.7590.2673.745
City centre0.7221.3850.7821.279
Airport0.5331.8760.6181.617
Integration0.04124.4120.4262.349
Choice0.05020.007
Table 3. The OLR results on weekdays.
TimeConstant MixingResidenceTrafficCommerceLeisureCity CentreAirportIntegration R 2
H1−2.584×10(−15)0.110 **0.235 **0.097 *0.221 **0.149 **−0.031−0.071 **0.112 **0.573
H2−4.769×10(−16)0.111 **0.238 **0.097 *0.218 **0.147 **−0.030−0.071 **0.112 **0.570
H3−2.505×10(−16)0.112 **0.241 **0.098 *0.216 **0.147 **−0.029−0.072 **0.111 **0.570
H4−4.633×10(−16)0.112 **0.241 **0.096 *0.217 **0.145 **−0.029−0.072 **0.112 **0.569
H5−5.589×10(−16)0.112 **0.243 **0.095 *0.215 **0.146 **−0.029−0.071 **0.113 **0.568
H66.993×10(−17)0.113 **0.243 **0.094 *0.215 **0.145 **−0.030−0.071 **0.114 **0.568
H7−4.133×10(−16)0.111 **0.238 **0.098 *0.210 **0.148 **−0.035−0.069 **0.117 **0.571
H8−2.278×10(−15)0.093 **0.199 **0.141 **0.183 **0.156 **−0.056 *−0.057 *0.136 **0.580
H95.316×10(−16)0.0410.098 **0.238 **0.186 **0.141 **−0.085 **−0.0320.167 **0.609
H107.005×10(−16)0.0140.0340.304 **0.253 **0.093 *−0.082 **−0.0230.164 **0.643
H111.220×10(−15)0.0030.0050.315 **0.297 **0.076 *−0.081 **−0.0200.156 **0.655
H12−1.624×10(−15)−0.004−0.0040.321 **0.320 **0.068−0.078 **−0.0210.147 **0.662
H138.436×10(−16)−0.002−0.0060.308 **0.323 **0.091 *−0.073 **−0.0230.138 **0.663
H148.791×10(−16)−0.005−0.0100.320 **0.332 **0.072 *−0.076 **−0.0220.137 **0.663
H15−9.614×10(−16)−0.010−0.0210.331 **0.336 **0.064−0.078 **−0.0190.136 **0.661
H16−2.460×10(−16)−0.012−0.0260.334 **0.343 **0.060−0.078 **−0.0200.132 **0.661
H17−1.925×10(−16)−0.009−0.0200.332 **0.337 **0.062−0.077 **−0.0210.133 **0.659
H18−7.035×10(−16)0.000−0.0040.316 **0.326 **0.073 *−0.077 **−0.0240.135 **0.657
H19−1.187×10(−15)0.0300.047 *0.264 **0.290 **0.116 **−0.072 **−0.0340.133 **0.649
H20−1.082×10(−15)0.057 **0.106 **0.218 **0.262 **0.142 **−0.057 *−0.050 *0.124 **0.635
H21−1.811×10(−15)0.075 **0.143 **0.180 **0.252 **0.151 **−0.050 *−0.058 **0.122 **0.624
H22−1.151×10(−15)0.088 **0.178 **0.150 **0.239 **0.153 **−0.047 *−0.062 **0.118 **0.609
H239.486×10(−16)0.099 **0.209 **0.131 **0.229 **0.143 **−0.041−0.066 **0.115 **0.590
H24−2.844×10(−15)0.104 **0.224 **0.115 **0.230 **0.141 **−0.036−0.070 **0.109 **0.580
Table 4. The OLR regression results on weekends.
TimeConstantMixingResidenceTrafficCommerceLeisureCity CentreAirportIntegration R 2
H1−1.445×10(−15)0.108 **0.226 **0.097 *0.228 **0.156 **−0.030−0.070 **0.111 **0.576
H23.427×10(−16)0.109 **0.232 **0.095 *0.227 **0.151 **−0.029−0.071 **0.110 **0.572
H3−5.611×10(−16)0.111 **0.235 **0.093 *0.226 **0.149 **−0.028−0.071 **0.109 **0.569
H4−7.938×10(−16)0.112 **0.237 **0.092 *0.225 **0.148 **−0.027−0.072 **0.109 **0.568
H52.253×10(−16)0.112 **0.238 **0.091 *0.223 **0.149 **−0.027−0.072 **0.110 **0.567
H6−7.168×10(−17)0.113 **0.238 **0.091 *0.223 **0.148 **−0.028−0.072 **0.110 **0.567
H77.686×10(−16)0.112 **0.236 **0.092 *0.219 **0.151 **−0.031−0.070 **0.113 **0.568
H88.425×10(−16)0.107 **0.227 **0.104 *0.210 **0.154 **−0.037−0.066 **0.120 **0.574
H9−1.315×10(−15)0.099 **0.207 **0.129 **0.209 **0.156 **−0.042−0.060 **0.125 **0.586
H103.862×10(−17)0.092 **0.180 **0.148 **0.215 **0.166 **−0.044−0.056 *0.127 **0.603
H111.547×10(−15)0.082 **0.149 **0.160 **0.234 **0.180 **−0.047−0.054 *0.124 **0.620
H12−6.127×10(−16)0.072 **0.123 **0.164 **0.254 **0.194 **−0.048−0.052 *0.116 **0.630
H13−6.100×10(−16)0.066 **0.104 **0.162 **0.271 **0.206 **−0.045−0.052 *0.109 **0.635
H141.427×10(−15)0.063 **0.094 **0.170 **0.278 **0.203 **−0.047−0.050 *0.109 **0.638
H157.112×10(−17)0.061 **0.090 **0.174 **0.281 **0.199 **−0.048 *−0.049 *0.111 **0.642
H161.352×10(−15)0.060 **0.088 **0.177 **0.286 **0.193 **−0.050 *−0.049 *0.112 **0.642
H17−1.652×10(−15)0.063 **0.088 **0.179 **0.289 **0.186 **−0.050 *−0.050 *0.111 **0.642
H189.812×10(−17)0.065 **0.097 **0.160 **0.284 **0.191 **−0.053 *−0.049 *0.114 **0.632
H19−6.596×10(−16)0.072 **0.111 **0.141 **0.277 **0.204 **−0.049 *−0.052 *0.111 **0.626
H20−7.319×10(−16)0.080 **0.131 **0.129 **0.269 **0.202 **−0.044−0.056 *0.112 **0.621
H213.432×10(−16)0.090 **0.156 **0.117 **0.255 **0.194 **−0.044−0.059 **0.117 **0.615
H22−6.661×10(−17)0.098 **0.188 **0.116 **0.235 **0.176 **−0.042−0.063 **0.119 **0.604
H23−1.041×10(−15)0.106 **0.217 **0.111 **0.223 **0.156 **−0.038−0.067 **0.115 **0.588
H248.507×10(−16)0.109 **0.230 **0.098 *0.225 **0.151 **−0.034−0.070 **0.111 **0.575
Table 5. Statistical results of the estimated coefficients based on GTWR on weekdays.
VariableMinQ1Q2Q3MaxMeanSD
Constant−40.068−1.401−0.2710.72860.269−0.4585.705
Mixing−2.069−0.0900.0160.1211.603−0.0070.310
Residence−3.159−0.0940.0470.25712.1050.1200.644
Traffic−3.789−0.1390.2950.7048.6560.3270.823
Commerce−11.707−0.0950.1360.4897.3840.2180.732
Leisure−6.226−0.0990.1100.4052.9510.1330.637
City centre−23.227−0.834−0.0740.65031.197−0.1873.258
Airport−55.138−1.326−0.170.87732.772−0.4444.941
Integration−2.467−0.0540.0990.2712.4090.1180.345
Bandwidth: 0.199   R 2 : 0.870
Table 6. Statistical results of the estimated coefficients based on GTWR on weekends.
VariableMinQ1Q2Q3MaxMeanSD
Constant−30.355−1.279−0.1690.81859.111−0.3095.402
Mixing−1.863−0.0670.0240.1381.5540.0190.320
Residence−2.737−0.0650.0760.28911.8040.1610.688
Traffic−3.630−0.1710.2650.6938.9430.3050.836
Commerce−11.975−0.0920.1550.4867.2760.2250.737
Leisure−6.113−0.0600.1610.4992.8740.1990.650
City centre−16.584−0.741−0.0420.66230.500−0.1183.096
Airport−54.105−1.297−0.1890.83727.900−0.6114.824
Integration−2.297−0.0670.0870.2532.3770.1000.344
Bandwidth: 0.255   R 2 : 0.865

