Tourist Intensity in the World, 1995–2015: Two Measurement Proposals

Abstract
1. Introduction
2. Tourism, an Industry in Expansion
3. Presentation of the Indices: Methodology and Results
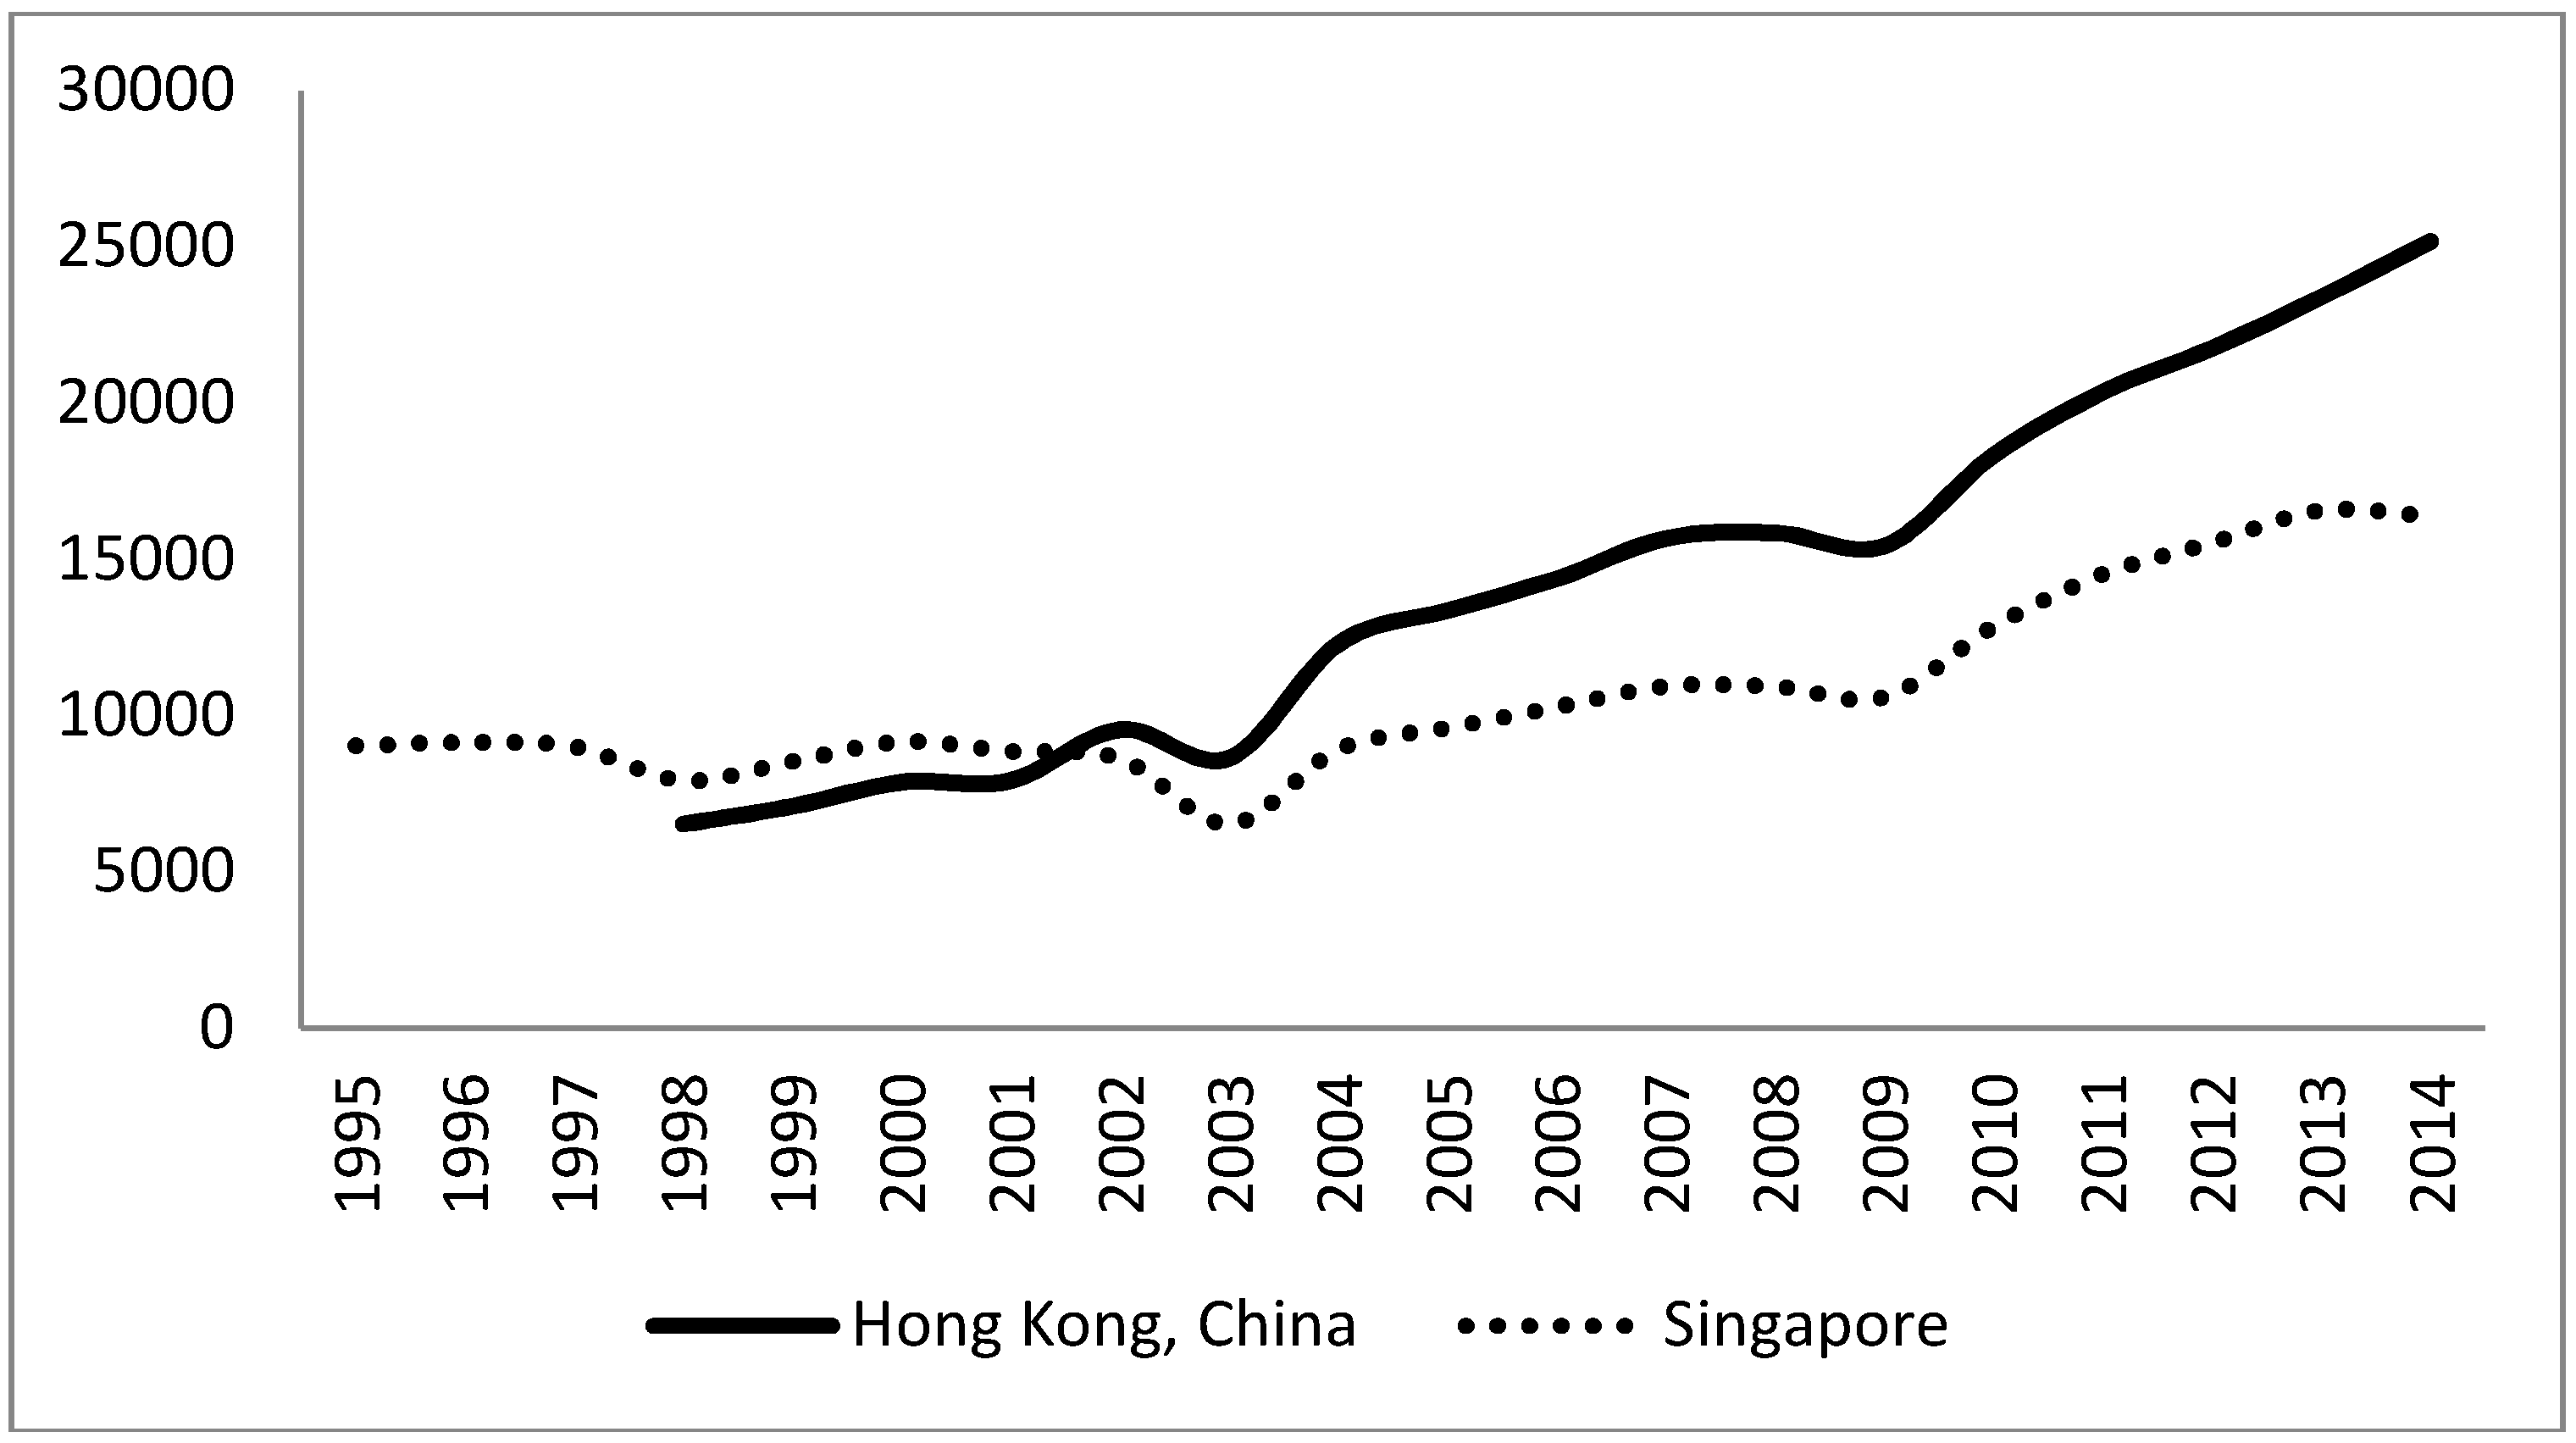
3.1. Countries with a Very High Tourism Intensity Index
3.2. Countries with a High Tourism Intensity Index
3.3. Countries with a Medium Tourism Intensity Index
3.4. Countries with a Low Tourism Intensity Index
4. Conclusions
Author Contributions
Funding
Conflicts of Interest
References
- Milano, C.; Novelli, M.; Eastbourne, U.K.; Cheer, J.M. Tourism Planning and Development Journal Special Issue on: Overtourism and Tourismphobia: A Journey through Four Decades’ of Tourism Development, Planning and Local Concerns. Available online: https://www.researchgate.net/publication/321873167_CALL_FOR_PAPERS_Overtourism_and_Tourismphobia_A_journey_through_four_decades’_of_tourism_development_planning_and_local_concerns/citations (accessed on 22 November 2018).
- Getz, D. Tourism planning and destination life cycle. Ann. Tour. Res. 1992, 19, 752–770. [Google Scholar] [CrossRef]
- Gonçalves, V.; Aguas, P. The concept of life cycle: An application to the tourist product. J. Travel Res. 1997, 35, 12–22. [Google Scholar] [CrossRef]
- Tokarchuk, O.; Gabriele, R.; Maurer, O. Tourism intensity impact on satisfaction with life of German residents. Tour. Econ. 2016, 22, 1315–1331. [Google Scholar] [CrossRef]
- Spinalis, I.; Kizos, T.; Karampela, S.; Vayanni, H. A tourism tipology of the Greek Islands. In Proceedings of the International Conference of Trends, Impacts and Policies on Tourism Development, Heraklion, Greece, 15–18 June 2006; Hellenic Open University: Patras, Greece, 2006. [Google Scholar]
- Albalate, D.; Bel, G. Tourism and urban public transport: Holding demand pressure under supply constraints. Tour. Manag. 2010, 31, 425–433. [Google Scholar] [CrossRef]
- Butler, R.W. The concept of tourism area cycle of evolution: Implications for management of resources. Can. Geogr. 1980, 24, 5–12. [Google Scholar] [CrossRef]
- Ioannides, D. Strengthening the ties between tourism and economic geography: A theoretical agenda. Prof. Geogr. 1995, 47, 49–60. [Google Scholar] [CrossRef]
- Agarwal, S. The resort cycle and seaside tourism: An assessment of its applicability and validity. Tour. Manag. 1997, 18, 65–73. [Google Scholar] [CrossRef]
- Agarwal, S. Restructuring seaside tourism. The resort lifecycle. Ann. Tour. Res. 2002, 29, 25–55. [Google Scholar] [CrossRef]
- Berry, E.N. An Application of Butler’s Tourism Area Life Cycle to the Cairns Region, Australia (1876–1998). Ph.D. Thesis, School of Tropical Environment Studies and Geography, James Cook University of North Queensland, Cairns, Australia, 2001. [Google Scholar]
- Hovinen, G. Revisiting the destination life cycle model. Ann. Tour. Res. 2002, 29, 209–230. [Google Scholar] [CrossRef]
- Garay Tamajón, L. El Ciclo de Evolución del Destino Turístico. Una Aproximación al Desarrollo Histórico del Turismo en Cataluña. Ph.D. Thesis, Universitat Autònoma de Barcelona, Barcelona, Spain, 2007. [Google Scholar]
- Gross, S.; Weber, F.; Stettler, J.; Priskin, J.; Rosenberg-Taufer, B.; Ponnapureddy, S.; Fux, S.; Camp, M.A.; Barth, M. Tourism Destinations under Pressure. Challenges and Innovative Solutions; Working Paper; Lucerne University of Applied Sciences and Arts Institute of Tourism: Lucerne, Switzerland, 2017. [Google Scholar]
- Sharpley, R. Tourism and Sustainable Development: Exploring the Theoretical Divide. J. Sustain. Tour. 2000, 8, 1–19. [Google Scholar] [CrossRef]
- Liu, Z. Sustainable Tourism Development: A Critique. J. Sustain. Tour. 2003, 11, 459–475. [Google Scholar] [CrossRef]
- OMT. Indicators of Sustainable Development for Tourism Destinations: A Guidebook; OMT: Madrid, Spain, 2004. [Google Scholar]
- Weaver, D. Can sustainable tourism survive climate change? J. Sustain. Tour. 2011, 19, 5–15. [Google Scholar] [CrossRef]
- Burghelea, C.; Uzlău, C.; Ene, C.M. Comparative indicators of Sustainable Tourism. Available online: http://managementjournal.usamv.ro/pdf/vol.16_3/Art9.pdf (accessed on 22 November 2018).
- Zientara, P.; Zamojska, A. Green organitzational climates and employee pro-environmental behavior in the hotel industry. J. Sustain. Tour. 2016, 26, 1142–1159. [Google Scholar] [CrossRef]
- De Jong, A.; Varley, P. Foraging tourism: Critical moments in sustainable consumption. J. Sustain. Tour. 2018, 26, 685–701. [Google Scholar] [CrossRef]
- Moyle, C.L.J.; Moyle, B.D.; Chai, A.; Hales, R.; Banhalmi-Zakar, Z.; Bec, A. Have Australia’s tourism strategies incorporated climate change? J. Sustain. Tour. 2018, 26, 703–721. [Google Scholar] [CrossRef]
- Bramwell, B.; Lane, B. Sustainable Tourism: An Evolving Global Approach. J. Sustain. Tour. 1993, 1, 1–5. [Google Scholar] [CrossRef]
- Butler, R.W. Sustainable tourism: A state-of-the-art review. Tour. Geogr. 1999, 1, 7–25. [Google Scholar] [CrossRef]
- Pulido-Fernández, J.I.; Cárdenas-García, P.J.; Villanueva-Álvaro, J.J. The role of environmental sustainability in the transformation of tourism growth into economic development. Environ. Eng. Manag. J. 2013, 12, 2009–2018. [Google Scholar] [CrossRef]
- Boluk, K.; Cavaliere, C.T.; Higgins-Desbiolles, F. Critical thinking to realize sustainability in tourism systems: Reflecting on the 2030 sustainable development goals. J. Sustain. Tour. 2017, 25, 1201–1204. [Google Scholar] [CrossRef]
- Pulido-Fernández, J.I.; López-Sánchez, Y. Are Tourists Really Willing to Pay More for Sustainable Destinations? Available online: https://www.mdpi.com/2071-1050/8/12/1240/htm (accessed on 22 November 2018).
- Pulido-Fernández, J.I.; Pulido-Fernández, M.C. Proposal for an indicators system of governance in tourism destinations. Soc. Indic. Res. 2018, 137, 695–743. [Google Scholar] [CrossRef]
- Font, X.; McCabe, S. Sustainability and marketing in tourism: Its contexts, paradoxes, approaches, challenges and potential. J. Sustain. Tour. 2018, 25, 869–883. [Google Scholar] [CrossRef]
- Higham, J.; Miller, G. Transforming societies and transforming tourism: Sustainable tourism in times of change. J. Sustain. Tour. 2018, 26, 1–8. [Google Scholar] [CrossRef]
- European Environment Agency. Indicator Fact Sheet Signals. Chapter Tourism; European Environment Agency: København, Denmark, 2001. [Google Scholar]
- INTERREG IIIC. Intensity of Tourism; European Union: Brussels, Belgium, 2005. [Google Scholar]
- INTERREG IVC. Sustain. Measuring Coastal Sustainability; European Union: Brussels, Belgium, 2012. [Google Scholar]
- Gauche, M. Tourism Intensity at a Local Level: Environmental Pressure of Preservation Factor? Datalab, The Monitoring and Statistics Directorate: Gobierno de Francia, France, 2017. [Google Scholar]
- Gauche, M. Measuring tourism intensity and its environmental impact. In Proceedings of the 6th UNWTO International Conference of Tourism Statistics Measuring Sustainable Tourism, Manila, Philippines, 19–24 June 2017. [Google Scholar]
- Manera, C.; Navinés, F. La Indústria Invisible, 1950–2016. El Desenvolupament del Turisme a L’economia Balear; Lleonard Muntaner Editor: Palma, Spain, 2018. [Google Scholar]
- Pérez-Dacal, D.; Pena-Boquete, Y.; Fernández, M. A Measuring Tourism Specialization: A Composite Indicator for the Spanish Regions. Alma Tour. 2014, 5, 35–73. [Google Scholar]
- Pérez, C. Revoluciones Tecnológicas y Capital Financiero. Las Dinámicas de las Grandes Burbujas y las Épocas de Bonanza; Siglo XXI: Madrid, Spain, 2004. [Google Scholar]
- Morley, C.L. A microeconomic theroy of international tourism demand. Ann. Tour. Res. 1992, 19, 250–267. [Google Scholar] [CrossRef]
- Apostolopoulos, Y.; Loukissas, P.; Leontidou, L. Mediterranean Tourism. Facets If Socioeconomic Development and Cultural Change; Roudlege: London, UK, 2001. [Google Scholar]
- Segreto, L.; Manera, C.; Pohl, M. (Eds.) Europe at the Seaside. The Economic History of Mass Tourism in the Mediterranean; Berghan Books: New York, NY, USA; Oxford, UK, 2009. [Google Scholar]
- Papatheodorou, A.; Song, H. International tourism forecasts: Time-series analysis of world and regional data. Tour. Econ. 2005, 11, 11–23. [Google Scholar] [CrossRef]
- Agarwal, S.; Ball, R.; Shaw, G.; Williams, A. The geography of tourism production: Uneven disciplinary development. Tour. Geogr. 2000, 2, 241–263. [Google Scholar] [CrossRef]
- Pulido-Fernández, J.I.; Cárdenas-García, P.J. Tourism as a tool of economic development in por countries. Tour. Intediscip. J. 2014, 62, 309–322. [Google Scholar]
- OMT. Panorama OMT del Turismo Internacional; OMT: Madrid, Spain, 2017. [Google Scholar]
- Garau, J. Tourist Satisfaction, Dissatisfaction and Place Attachment at Sun and Sand Mass Tourism Destinations; Ph.D. Thesis, Universitat de les Illes Balears, Palma, Spain, 2010. [Google Scholar]
- OMT. Tourism Towards 2030. Global Overview; OMT: Madrid, Spain, 2011. [Google Scholar]
- Alegre, J.; Pou, L.L. The Determinants of the Probability of Tourism Consumption: An Analysis with a Family Expenditure Survey; Working Papers; Departamento de Economía Aplicada de la Universitat de les Illes Balears: Palma, Spain, 2002. [Google Scholar]
- Alegre, J.; Pou, L.L. La reducción del tiempo de estancia en los destinos vacacionales: Implicaciones sobre el gasto turístico y la estacionalidad en las Islas Baleares. G. López Casasnovas (Dir.). In Islas Baleares. Serie Estudios Regionales; Fundación BBVA: Madrid, Spain, 2003. [Google Scholar]
- Britton, S. Tourism, Capital and Place: Towards a Critical Geography of Tourism. Available online: https://journals.sagepub.com/doi/10.1068/d090451 (accessed on 22 November 2018).
- Britton, S. La economía política del turismo en el Tercer Mundo. In Los Mitos del Turismo; Jurdao, F., Ed.; Endymion: Madrid, Spain, 1992. [Google Scholar]
- Poon, A. Tourism, Technology and Competitive Strategies; CAB International: Wallingford, UK, 1993. [Google Scholar]
- Turner, L.; Ash, J. La Horda Dorada. El Turismo Internacional y la Periferia del Placer; Endymion: Madrid, Spain, 1991. [Google Scholar]
- Gormsen, E. The impact of tourism on coastal areas. Geojournal 1997, 42, 39–54. [Google Scholar] [CrossRef]
- Wilkinson, P.F. Strategies for tourism in island microstates. Ann. Tour. Res. 1989, 16, 153–177. [Google Scholar] [CrossRef]
- O’Reilly, A.M. Tourism carrying-capacity: Concept and issues. Tour. Manag. 1986, 7, 254–258. [Google Scholar] [CrossRef]
- Pearce, D. Tourism Development; Longman: Harlow, UK, 1989. [Google Scholar]
- Mowforth, M.; Munt, I. Tourism and Sustainability: New Tourism in the Third World; Routledge: London, UK, 1998. [Google Scholar]
- Sindinga, I. Alternative tourism and sustainable development in Kenya. J. Sustain. Tour. 1999, 7, 108–127. [Google Scholar] [CrossRef]
- Twining-Ward, L.; Butler, R. Implementing sustainable tourism development on a small island: Development and the use of sustainable tourism development indicators in Samoa. J. Sustain. Tour. 2002, 19, 363–387. [Google Scholar] [CrossRef]
- Gössling, S.; Hanssonb, C.B.; Hörstmeierc, O.; Sagge, S. Ecological footprint analysis as a tool to assess tourism sustainability. Ecol. Econ. 2002, 43, 2–3. [Google Scholar] [CrossRef]
- Hall, M.C. Tourism urbanisation and global environmental change. In Tourism and Global Environmental Change. Ecological, Social, Economic and Political Interrelationships; Gössling, S., Hall, M., Eds.; Routledge: New York, NY, USA, 2006. [Google Scholar]
- Pulido-Fernández, J.I.; Sánchez-Rivero, M. Measuring Tourism Sustainability. Proposal of a Composite Index. Tour. Econ. 2009, 15, 277–296. [Google Scholar] [CrossRef]


| COUNTRY | TII |
|---|---|
| Mean Value 1995–2015 | |
| Macao, China | 6.656 |
| Aruba | 3.720 |
| Anguilla | 2.654 |
| Bahamas | 2.164 |
| Maldives | 2.077 |
| Antigua and Barbuda | 1.944 |
| (Tourism/Population) (Ti/Pi) | Tourism Revenue/GDP (TRi/GDPi)—% | |
|---|---|---|
| COUNTRY | 2014 | 2014 |
| Macao, China | 25.20 | 92.9 |
| Aruba | 10.36 | 61.0 |
| Anguilla | 4.91 | 41.8 |
| Bahamas | 3.73 | 27.0 |
| Maldives | 3.37 | 91.7 |
| COUNTRY | TII | COUNTRY | TII |
|---|---|---|---|
| Mean Value 1995–2015 | Mean Value 1995–2015 | ||
| Seychelles | 1.501 | Hungary | 697 |
| Bahrain | 1.419 | Belize | 690 |
| Saint Lucia | 1.419 | Fiji | 677 |
| Croatia | 1.413 | Czech Republic | 677 |
| Barbados | 1.360 | Saint Vincent and the Grenadines | 671 |
| Cyprus | 1.203 | Ireland | 667 |
| Saint Kitts and Nevis | 1.157 | Greece | 659 |
| Montenegro | 982 | Cambodia | 619 |
| Montserrat | 969 | Mauritius | 608 |
| Australia | 925 | Finland | 603 |
| Grenada | 866 | Uruguay | 598 |
| New Zealand | 866 | Singapore | 589 |
| Hong Kong, China | 852 | Slovenia | 586 |
| Spain | 847 | Jamaica | 584 |
| Estonia | 813 | France | 580 |
| Austria | 811 | Vanuatu | 579 |
| Dominica | 809 | Samoa | 578 |
| Taiwan Province of China | 804 | United States of America | 513 |
| Malaysia | 789 | Iceland | 509 |
| Luxembourg | 758 | Norway | 501 |
| Thailand | 711 |
| COUNTRY | 1995 | 2000 | 2005 | 2010 | 2015 |
|---|---|---|---|---|---|
| Seychelles | 1.895 | 1.508 | 1.175 | 1.588 | |
| Bahrain | 1.473 | 1.468 | 1.548 | 1.725 | |
| Saint Lucia | 1.809 | 1.554 | 1.596 | 1.258 | |
| Croatia | 1.316 | 1.515 | |||
| Barbados | 1.703 | 1.361 | 1.342 | 1.305 | |
| Cyprus | 1.269 | ||||
| Saint Kitts and Nevis | 1.616 | 930 | 1.440 | 948 | |
| Montenegro | 1.097 | ||||
| Montserrat | 1.592 | 1.425 | 1.101 | 690 | |
| Australia | 966 | 960 | |||
| Grenada | 1.236 | 941 | 564 | 751 | |
| New Zealand | 831 | ||||
| Hong Kong, China | 492 | 724 | 1.124 | 1.259 | |
| Spain | 1.008 | 819 | 775 | 837 | |
| Estonia | 818 | 1.065 | |||
| Austria | 829 | 826 | |||
| Dominica | 909 | 748 | 748 | 873 | |
| Taiwan Province of China | 694 | 914 | |||
| Malaysia | 800 | 810 | |||
| Luxembourg | 736 | 745 | |||
| Thailand | 697 | ||||
| Hungary | 717 | 737 | |||
| Belize | 641 | 642 | 722 | 725 | |
| Fiji | 634 | 494 | 722 | 845 | |
| Czech Republic | 681 | 705 | 624 | ||
| Saint Vincent and the Grenadines | 756 | 739 | 735 | 554 | |
| Ireland | 658 | 753 | |||
| Greece | 667 | 558 | 826 | ||
| Cambodia | 621 | ||||
| Mauritius | 543 | 582 | 608 | 672 | 644 |
| Finland | 547 | 561 | 694 | ||
| Uruguay | 629 | 543 | |||
| Singapore | 884 | 568 | 498 | 631 | |
| Slovenia | 576 | 544 | 629 | 637 | |
| Jamaica | 660 | 591 | 533 | 641 | 637 |
| France | 597 | 583 | 548 | ||
| Vanuatu | 506 | 587 | 503 | 724 | |
| Samoa | 606 | 591 | |||
| United States of America | 520 | 550 | |||
| Iceland | 402 | 426 | 393 | 491 | 1081 |
| Norway | 512 | 494 |
| (Tourism/Population) (Ti/Pi) | Tourism Revenue/GDP (TRi/GDPi)—% | (Tourism/Population) (Ti/Pi) | Tourism Revenue/GDP (TRi/GDPi)—% | ||
|---|---|---|---|---|---|
| COUNTRY | 2014 | 2014 | COUNTRY | 2014 | 2014 |
| Seychelles | 2.43 | 31.8 | Hungary | 2.73 | 5.4 |
| Bahrain | 7.67 | 5.7 | Belize | 0.91 | 22.1 |
| Saint Lucia | 1.84 | 28.6 | Fiji | 0.78 | 22.8 |
| Croatia | 4.00 | 17.6 | Czech Republic | 3.58 | 3.7 |
| Cyprus | 3.24 | 12.5 | Saint Vincent and the Grenadines | 0.65 | 12.8 |
| Saint Kitts and Nevis | 2.06 | 15.1 | Ireland | 3.81 | 4.4 |
| Montenegro | 2.16 | 20.8 | Greece | 2.34 | 8.2 |
| Montserrat | 1.73 | 13.0 | Cambodia | 0.88 | 19.2 |
| Australia | 10.70 | 2.4 | Mauritius | 0.82 | 13.6 |
| Grenada | 1.26 | 15.8 | Uruguay | 2.33 | 3.5 |
| Hong Kong, China | 3.84 | 15.8 | Singapore | 2.15 | 6.2 |
| Spain | 4.42 | 4.6 | Slovenia | 2.08 | 5.9 |
| Estonia | 4.17 | 8.6 | Jamaica | 0.75 | 16.2 |
| Austria | 4.32 | 4.8 | France | 4.37 | 2.3 |
| Dominica | 1.13 | 23.6 | United States of America | 6.84 | 1.4 |
| Taiwan Province of China | 7.09 | 3.3 | Iceland | 3.05 | 8.0 |
| Malaysia | 3.32 | 6.7 | Norway | 5.73 | 1.3 |
| Luxembourg | 2.05 | 9.6 |
| COUNTRY | TII | COUNTRY | TII |
|---|---|---|---|
| Mean Value 1995–2015 | Mean Value 1995–2015 | ||
| Jordan | 491 | Philippines | 243 |
| Switzerland | 470 | Japan | 225 |
| Republic of Korea | 465 | Kyrgyzstan | 205 |
| Cabo Verde | 456 | South Africa | 205 |
| Slovakia | 444 | Vietnam | 202 |
| Turkey | 444 | Indonesia | 199 |
| Tunisia | 422 | China | 198 |
| Lebanon | 407 | Guyana | 189 |
| Italy | 389 | Israel | 175 |
| United Kingdom | 386 | Ukraine | 163 |
| Dominican Republic | 368 | Oman | 163 |
| Lithuania | 364 | Ecuador | 162 |
| Canada | 360 | Gambia | 160 |
| Armenia | 353 | Suriname | 154 |
| Colombia | 337 | Brunei Darussalam | 141 |
| Belgium | 332 | Mongolia | 138 |
| Albania | 331 | El Salvador | 135 |
| Botswana | 331 | Nicaragua | 124 |
| Romania | 322 | India | 111 |
| Poland | 318 | Honduras | 111 |
| Costa Rica | 308 | Mexico | 106 |
| Tonga | 276 | Bosnia and Herzegovina | 105 |
| Saudi Arabia | 271 | ||
| Panama | 267 | ||
| Qatar | 264 |
| COUNTRY | 1995 | 2000 | 2005 | 2010 | 2015 |
|---|---|---|---|---|---|
| Jordan | 431 | 378 | 504 | 617 | |
| Switzerland | 466 | 420 | |||
| Republic of Korea | 418 | 467 | |||
| Cabo Verde | 148 | 348 | 497 | 767 | |
| Slovakia | 437 | 430 | |||
| Turkey | 428 | 467 | |||
| Tunisia | 489 | 461 | 422 | 463 | |
| Lebanon | 196 | 507 | 621 | ||
| Italy | 447 | 377 | 374 | 336 | |
| United Kingdom | 382 | 404 | |||
| Dominican Republic | 345 | 405 | 369 | 348 | 390 |
| Lithuania | 383 | 348 | 347 | ||
| Canada | 371 | 342 | |||
| Armenia | 342 | 442 | |||
| Colombia | 339 | 395 | |||
| Belgium | 322 | 353 | |||
| Albania | 44 | 66 | 645 | 733 | |
| Botswana | 252 | 316 | 381 | 450 | |
| Romania | 295 | 344 | |||
| Poland | 319 | 308 | 321 | ||
| Costa Rica | 274 | 316 | 341 | 320 | |
| Tonga | 275 | 227 | 277 | 355 | |
| Saudi Arabia | 266 | 252 | 333 | ||
| Panama | 167 | 184 | 222 | 350 | 441 |
| Qatar | 134 | 246 | |||
| Philippines | 208 | 308 | |||
| Japan | 228 | ||||
| Kyrgyzstan | 45 | 160 | 344 | ||
| South Africa | 209 | 188 | |||
| Vietnam | 173 | 230 | |||
| Indonesia | 193 | 213 | |||
| China | 180 | 185 | 200 | 213 | |
| Guyana | 200 | 249 | 147 | 162 | |
| Israel | 274 | 234 | 150 | 186 | 150 |
| Ukraine | 44 | 96 | 220 | 243 | 126 |
| Oman | 138 | 152 | 181 | ||
| Ecuador | 186 | 203 | |||
| Gambia | 152 | 129 | |||
| Suriname | 193 | 143 | 238 | 152 | |
| Brunei Darussalam | 150 | ||||
| Mongolia | 78 | 89 | 187 | 169 | |
| El Salvador | 59 | 133 | 154 | 146 | 183 |
| Nicaragua | 71 | 111 | 135 | 153 | |
| India | 72 | 80 | 101 | 139 | 187 |
| Honduras | 73 | 104 | 123 | 130 | |
| Mexico | 163 | 111 | 98 | 93 | 113 |
| Bosnia and Herzegovina | 93 | 94 | 115 |
| (Tourism/Population) (Ti/Pi) | Tourism Revenue/GDP (TRi/GDPi)—% | (Tourism/Population) (Ti/Pi) | Tourism Revenue/GDP (TRi/GDPi)—% | ||
|---|---|---|---|---|---|
| COUNTRY | 2014 | 2014 | COUNTRY | 2014 | 2014 |
| Jordan | 0.54 | 15.4 | Saudi Arabia | 1.79 | 1.2 |
| Switzerland | 1.91 | 3.0 | Panama | 0.45 | 11.7 |
| Republic of Korea | 4.82 | 1.6 | Qatar | 1.30 | 5.0 |
| Turkey | 1.43 | 4.9 | Philippines | 1.13 | 2.1 |
| Tunisia | 0.64 | 6.4 | Japan | 4.80 | 0.4 |
| Italy | 1.65 | 2.1 | Kyrgyzstan | 0.49 | 6.3 |
| United Kingdom | 2.28 | 2.0 | South Africa | 0.40 | 3.0 |
| Dominican Republic | 0.49 | 8.8 | Indonesia | 1.02 | 1.3 |
| Lithuania | 1.62 | 2.9 | China | 2.68 | 1.0 |
| Canada | 3.52 | 1.2 | Israel | 0.37 | 2.1 |
| Armenia | 0.69 | 8.6 | Ukraine | 0.28 | 1.7 |
| Colombia | 2.73 | 1.3 | Oman | 0.38 | 2.4 |
| Belgium | 1.3 | 2.8 | Brunei Darussalam | 0.48 | 0.5 |
| Albania | 1.16 | 14.0 | El Salvador | 0.22 | 5.1 |
| Botswana | 0.89 | 6.2 | Nicaragua | 0.22 | 3.8 |
| Romania | 2.98 | 1.1 | India | 1.00 | 1.0 |
| Poland | 1.41 | 2.2 | Mexico | 0.23 | 1.3 |
| Costa Rica | 0.53 | 6.4 | Bosnia And Herzegovina | 0.14 | 4.0 |
| COUNTRY | TII | COUNTRY | TII |
|---|---|---|---|
| Mean Value 1995–2015 | Mean Value 1995–2015 | ||
| Comoros | 98 | Kuwait | 39 |
| The Former Yugoslav Republic of Macedonia | 97 | Malawi | 38 |
| Syrian Arab Republic | 95 | Togo | 38 |
| Lesotho | 93 | Madagascar | 37 |
| Guatemala | 92 | Yemen | 33 |
| Azerbaijan | 86 | Mali | 30 |
| Senegal | 85 | Cameroon | 28 |
| Rwanda | 84 | Guinea-Bissau | 24 |
| Russian Federation | 83 | Timor-Leste | 23 |
| Kenya | 81 | Burkina Faso | 23 |
| Serbia | 70 | Ethiopia | 21 |
| Solomon Islands | 69 | Sierra Leone | 21 |
| Zambia | 69 | Côte D’Ivoire | 17 |
| Bolivarian Republic of Venezuela | 67 | Algeria | 16 |
| Bhutan | 66 | Chad | 15 |
| Plurinational State of Bolivia | 64 | Congo | 14 |
| Republic of Moldova | 60 | Niger | 14 |
| Haiti | 57 | Pakistan | 11 |
| Peru | 57 | Papua New Guinea | 10 |
| Belarus | 56 | Angola | 9 |
| Paraguay | 54 | Burundi | 8 |
| Sri Lanka | 53 | Sudan | 8 |
| Nepal | 48 | Central African Republic | 8 |
| Uganda | 47 | Myanmar | 4 |
| Ghana | 46 | Bangladesh | 2 |
| Benin | 45 | Democratic Republic of the Congo | 1 |
| Djibouti | 41 |
| COUNTRY | 1995 | 2000 | 2005 | 2010 | 2015 |
|---|---|---|---|---|---|
| Comoros | 156 | 112 | 93 | 74 | |
| The Former Yugoslav Republic of Macedonia | 101 | 78 | 100 | 140 | |
| Syrian Arab Republic | 85 | 82 | 98 | 201 | |
| Lesotho | 89 | 89 | |||
| Guatemala | 97 | 84 | |||
| Azerbaijan | 45 | 88 | |||
| Senegal | 76 | 71 | 92 | 96 | |
| Rwanda | 28 | 82 | 119 | ||
| Russian Federation | 70 | 86 | 71 | 70 | 85 |
| Kenya | 123 | 67 | 81 | 82 | |
| Serbia | 43 | 82 | 121 | ||
| Solomon Islands | 89 | 24 | 31 | 103 | |
| Zambia | 59 | 103 | 78 | ||
| Bolivarian Republic of Venezuela | 61 | ||||
| Bhutan | 28 | 35 | 41 | 93 | |
| Plurinational State of Bolivia | 52 | 42 | 82 | 66 | 79 |
| Republic of Moldova | 56 | 64 | |||
| Haiti | 61 | 47 | 27 | 73 | |
| Peru | 32 | 44 | 60 | 69 | |
| Belarus | 34 | 60 | 77 | ||
| Paraguay | 92 | 48 | 46 | 58 | 99 |
| Sri Lanka | 57 | 44 | 52 | 50 | |
| Nepal | 69 | 56 | 30 | 44 | |
| Uganda | 23 | 30 | 48 | 73 | |
| Ghana | 20 | 56 | |||
| Benin | 68 | 42 | 42 | 42 | |
| Djibouti | 42 | 41 | 35 | ||
| Kuwait | 51 | 41 | 28 | 35 | |
| Malawi | 40 | 36 | 38 | 35 | |
| Togo | 23 | 20 | 24 | 60 | |
| Madagascar | 31 | 39 | 43 | 35 | |
| Yemen | 9 | 10 | 22 | 82 | |
| Mali | 34 | ||||
| Cameroon | 18 | 31 | 21 | 27 | |
| Guinea-Bissau | 5 | 28 | |||
| Timor-Leste | 28 | ||||
| Burkina Faso | 19 | 22 | 28 | ||
| Ethiopia | 17 | 14 | 20 | 33 | |
| Sierra Leone | 35 | 15 | 32 | 16 | |
| Côte D’Ivoire | 20 | ||||
| Algeria | 8 | 14 | 25 | 21 | |
| Chad | 20 | 14 | |||
| Congo | 22 | 10 | 15 | 0 | |
| Niger | 8 | 15 | 13 | 18 | |
| Pakistan | 13 | 11 | 11 | 11 | |
| Papua New Guinea | 15 | 9 | |||
| Angola | 7 | 11 | |||
| Burundi | 8 | 6 | 10 | 8 | 6 |
| Sudan | 2 | 1 | 9 | 8 | |
| Central African Republic | 12 | 8 | 7 | ||
| Myanmar | 6 | 4 | |||
| Bangladesh | 2 | 3 | 3 | 3 | |
| Democratic Republic of the Congo | 1 | 1 |
| (Tourism/Population) (Ti/Pi) | Tourism Revenue/GDP (TRi/GDPi)—% | (Tourism/Population) (Ti/Pi) | Tourism Revenue/GDP (TRi/GDPi)—% | ||
|---|---|---|---|---|---|
| COUNTRY | 2014 | 2014 | COUNTRY | 2014 | 2014 |
| The Former Yugoslav Republic of Macedonia | 0.20 | 2.6 | Belarus | 0.11 | 1.6 |
| Guatemala | 0.09 | 2.7 | Paraguay | 0.10 | 0.1 |
| Azerbaijan | 0.22 | 3.6 | Sri Lanka | 0.07 | 4.4 |
| Senegal | 0.07 | 3.1 | Nepal | 0.03 | 2.6 |
| Rwanda | 0.08 | 3.7 | Benin | 0.02 | 1.7 |
| Russian Federation | 0.23 | 1.0 | Kuwait | 0.05 | 0.4 |
| Kenya | 0.03 | 3.0 | Malawi | 0.05 | 0.6 |
| Serbia | 0.12 | 3.1 | Togo | 0.04 | 5.1 |
| Solomon Islands | 0.04 | 6.2 | Mali | 0.01 | 1.8 |
| Zambia | 0.06 | 2.4 | Burkina Faso | 0.01 | 1.5 |
| Bolivarian Republic of Venezuela | 0.51 | 0.1 | Sierra Leone | 0.01 | 0.7 |
| Bhutan | 0.18 | 6.1 | Algeria | 0.06 | 0.2 |
| Plurinational State of Bolivia | 0.08 | 2.2 | Burundi | 0.02 | 0.2 |
| Republic of Moldova | 0.03 | 3.9 | Bangladesh | 0.00 | 0.1 |
| Peru | 0.10 | 1.9 |
| COUNTRY | 1995 | 2000 | 2005 | 2010 | 2014 | Average (1995–2014) |
|---|---|---|---|---|---|---|
| United Kingdom | 607 | 605 | 627 | |||
| Antigua and Barbuda | 500 | 470 | 557 | 523 | 538 | |
| France | 537 | 509 | 527 | 530 | ||
| Czech Republic | 437 | 458 | 477 | 461 | ||
| Saint Lucia | 373 | 435 | 513 | 494 | 545 | 455 |
| Belgium | 424 | 480 | 445 | |||
| Spain | 380 | 419 | 392 | 406 | 399 | |
| Cyprus | 390 | 404 | 393 | |||
| Italy | 384 | 410 | 410 | 333 | 389 | |
| Saint Kitts and Nevis | 304 | 281 | 542 | 377 | 435 | 383 |
| Switzerland | 368 | 379 | 383 | |||
| Luxembourg | 329 | 441 | 378 | |||
| Mauritius | 206 | 322 | 375 | 459 | 506 | 372 |
| Grenada | 318 | 379 | 291 | 324 | 394 | 355 |
| Seychelles | 258 | 283 | 262 | 367 | 483 | 319 |
| COUNTRY | Tourism Density | Initial Year Considered | Final Year Considered | Initial Tourism Density | Final Tourism Density | Growth |
|---|---|---|---|---|---|---|
| India | Low | 1995 | 2014 | 42 | 393 | 830.0 |
| Qatar | Low | 1999 | 2014 | 31 | 243 | 691.6 |
| China | Low | 1995 | 2014 | 67 | 382 | 473.5 |
| Maldives | High | 1995 | 2014 | 1.054 | 4.506 | 327.6 |
| Bahrain | High | 1995 | 2014 | 3.255 | 13.556 | 316.5 |
| Hong Kong, China | Very High | 1998 | 2014 | 6.532 | 25.183 | 285.5 |
| Mauritius | Medium | 1995 | 2014 | 206 | 506 | 146.1 |
| Macao, China | Very High | 1995 | 2014 | 210.100 | 480.726 | 128.8 |
| Lebanon | Low | 1997 | 2013 | 53 | 122 | 128.3 |
| Philippines | Low | 2009 | 2014 | 174 | 374 | 114.8 |
| Malaysia | Low | 2008 | 2014 | 155 | 300 | 92.8 |
| Seychelles | Medium | 1995 | 2014 | 258 | 483 | 86.9 |
| Singapore | Very High | 1995 | 2014 | 9.034 | 16.390 | 81.4 |
| Jamaica | Low | 1995 | 2014 | 104 | 189 | 81.3 |
| Aruba | High | 1995 | 2014 | 3.439 | 5.956 | 73.2 |
| Thailand | Low | 2006 | 2013 | 186 | 297 | 60.1 |
| Saint Lucia | Medium | 1995 | 2014 | 373 | 545 | 46.3 |
| Saint Kitts and Nevis | Medium | 1995 | 2014 | 304 | 435 | 43.0 |
| Israel | Low | 1995 | 2014 | 104 | 137 | 31.5 |
| Colombia | Low | 2009 | 2014 | 89 | 114 | 27.9 |
| Spain | Medium | 1999 | 2014 | 318 | 406 | 27.8 |
| Slovenia | Low | 2000 | 2014 | 167 | 212 | 26.5 |
| Indonesia | Low | 2006 | 2014 | 110 | 136 | 24.5 |
| Grenada | Medium | 1995 | 2014 | 318 | 394 | 24.1 |
| Turkey | Low | 2009 | 2014 | 116 | 141 | 21.6 |
| Barbados | High | 1995 | 2012 | 1.028 | 1.247 | 21.3 |
| Belgium | Medium | 2009 | 2014 | 399 | 480 | 20.3 |
| Saint Vincent and The Grenadines | Low | 1995 | 2014 | 154 | 182 | 18.3 |
| Luxembourg | Medium | 2007 | 2014 | 381 | 441 | 15.5 |
| Ireland | Low | 2006 | 2014 | 217 | 250 | 15.4 |
| Austria | Medium | 2008 | 2014 | 385 | 440 | 14.2 |
| Cyprus | Medium | 2003 | 2014 | 355 | 404 | 13.9 |
| Croatia | Low | 2008 | 2014 | 265 | 300 | 13.1 |
| Antigua and Barbuda | Medium | 1995 | 2013 | 500 | 552 | 10.5 |
| Italy | Medium | 1997 | 2014 | 310 | 333 | 7.4 |
| Republic of Korea | High | 2009 | 2014 | 2.294 | 2.423 | 5.6 |
| Poland | Low | 2005 | 2014 | 162 | 171 | 5.4 |
| Greece | Low | 2004 | 2014 | 184 | 193 | 4.8 |
| United States of America | Low | 2007 | 2014 | 214 | 222 | 3.8 |
| Czech Republic | Medium | 2003 | 2014 | 464 | 477 | 2.8 |
| France | Medium | 2005 | 2014 | 537 | 527 | −1.9 |
| Slovakia | Low | 2005 | 2013 | 246 | 236 | −4.2 |
| United Kingdom | Medium | 2009 | 2014 | 634 | 605 | −4.4 |
| Switzerland | Medium | 1998 | 2014 | 423 | 379 | −10.5 |
| Bahamas | Low | 1995 | 2014 | 115 | 103 | −10.7 |
| Hungary | Low | 2008 | 2014 | 328 | 289 | −11.8 |
| Japan | High | 2008 | 2014 | 1.977 | 1.615 | −18.3 |
| COUNTRY | 1995 | 2000 | 2005 | 2010 | 2014 | Average (1995–2014) |
|---|---|---|---|---|---|---|
| Croatia | 263 | 300 | 280 | |||
| Philippines | 211 | 374 | 270 | |||
| Slovakia | 246 | 209 | 237 | |||
| Thailand | 229 | 230 | ||||
| Malaysia | 207 | 300 | 226 | |||
| Ireland | 203 | 250 | 224 | |||
| United States of America | 205 | 222 | 210 | |||
| Saint Vincent and the Grenadines | 154 | 187 | 246 | 185 | 182 | 194 |
| Greece | 211 | 152 | 193 | 191 | ||
| Slovenia | 167 | 173 | 190 | 212 | 185 | |
| China | 67 | 81 | 131 | 225 | 382 | 161 |
| Poland | 162 | 146 | 171 | 159 | ||
| India | 42 | 68 | 120 | 229 | 393 | 152 |
| Jamaica | 104 | 120 | 135 | 175 | 189 | 141 |
| Turkey | 127 | 141 | 129 | |||
| Indonesia | 126 | 136 | 126 | |||
| Lebanon | 71 | 109 | 207 | 110 | ||
| Bahamas | 115 | 111 | 116 | 99 | 103 | 108 |
| Qatar | 33 | 79 | 243 | 105 | ||
| Colombia | 105 | 114 | 105 | |||
| Israel | 104 | 115 | 90 | 130 | 137 | 100 |
© 2018 by the authors. Licensee MDPI, Basel, Switzerland. This article is an open access article distributed under the terms and conditions of the Creative Commons Attribution (CC BY) license (http://creativecommons.org/licenses/by/4.0/).
Share and Cite
Manera, C.; Valle, E. Tourist Intensity in the World, 1995–2015: Two Measurement Proposals. Sustainability 2018, 10, 4546. https://doi.org/10.3390/su10124546
Manera C, Valle E. Tourist Intensity in the World, 1995–2015: Two Measurement Proposals. Sustainability. 2018; 10(12):4546. https://doi.org/10.3390/su10124546
Chicago/Turabian StyleManera, Carles, and Elisabeth Valle. 2018. "Tourist Intensity in the World, 1995–2015: Two Measurement Proposals" Sustainability 10, no. 12: 4546. https://doi.org/10.3390/su10124546
APA StyleManera, C., & Valle, E. (2018). Tourist Intensity in the World, 1995–2015: Two Measurement Proposals. Sustainability, 10(12), 4546. https://doi.org/10.3390/su10124546