Analysing the Relationship between Price and Online Reputation by Lodging Category

 ,
,
Abstract
1. Introduction
2. Literature Review
3. Research Methodology
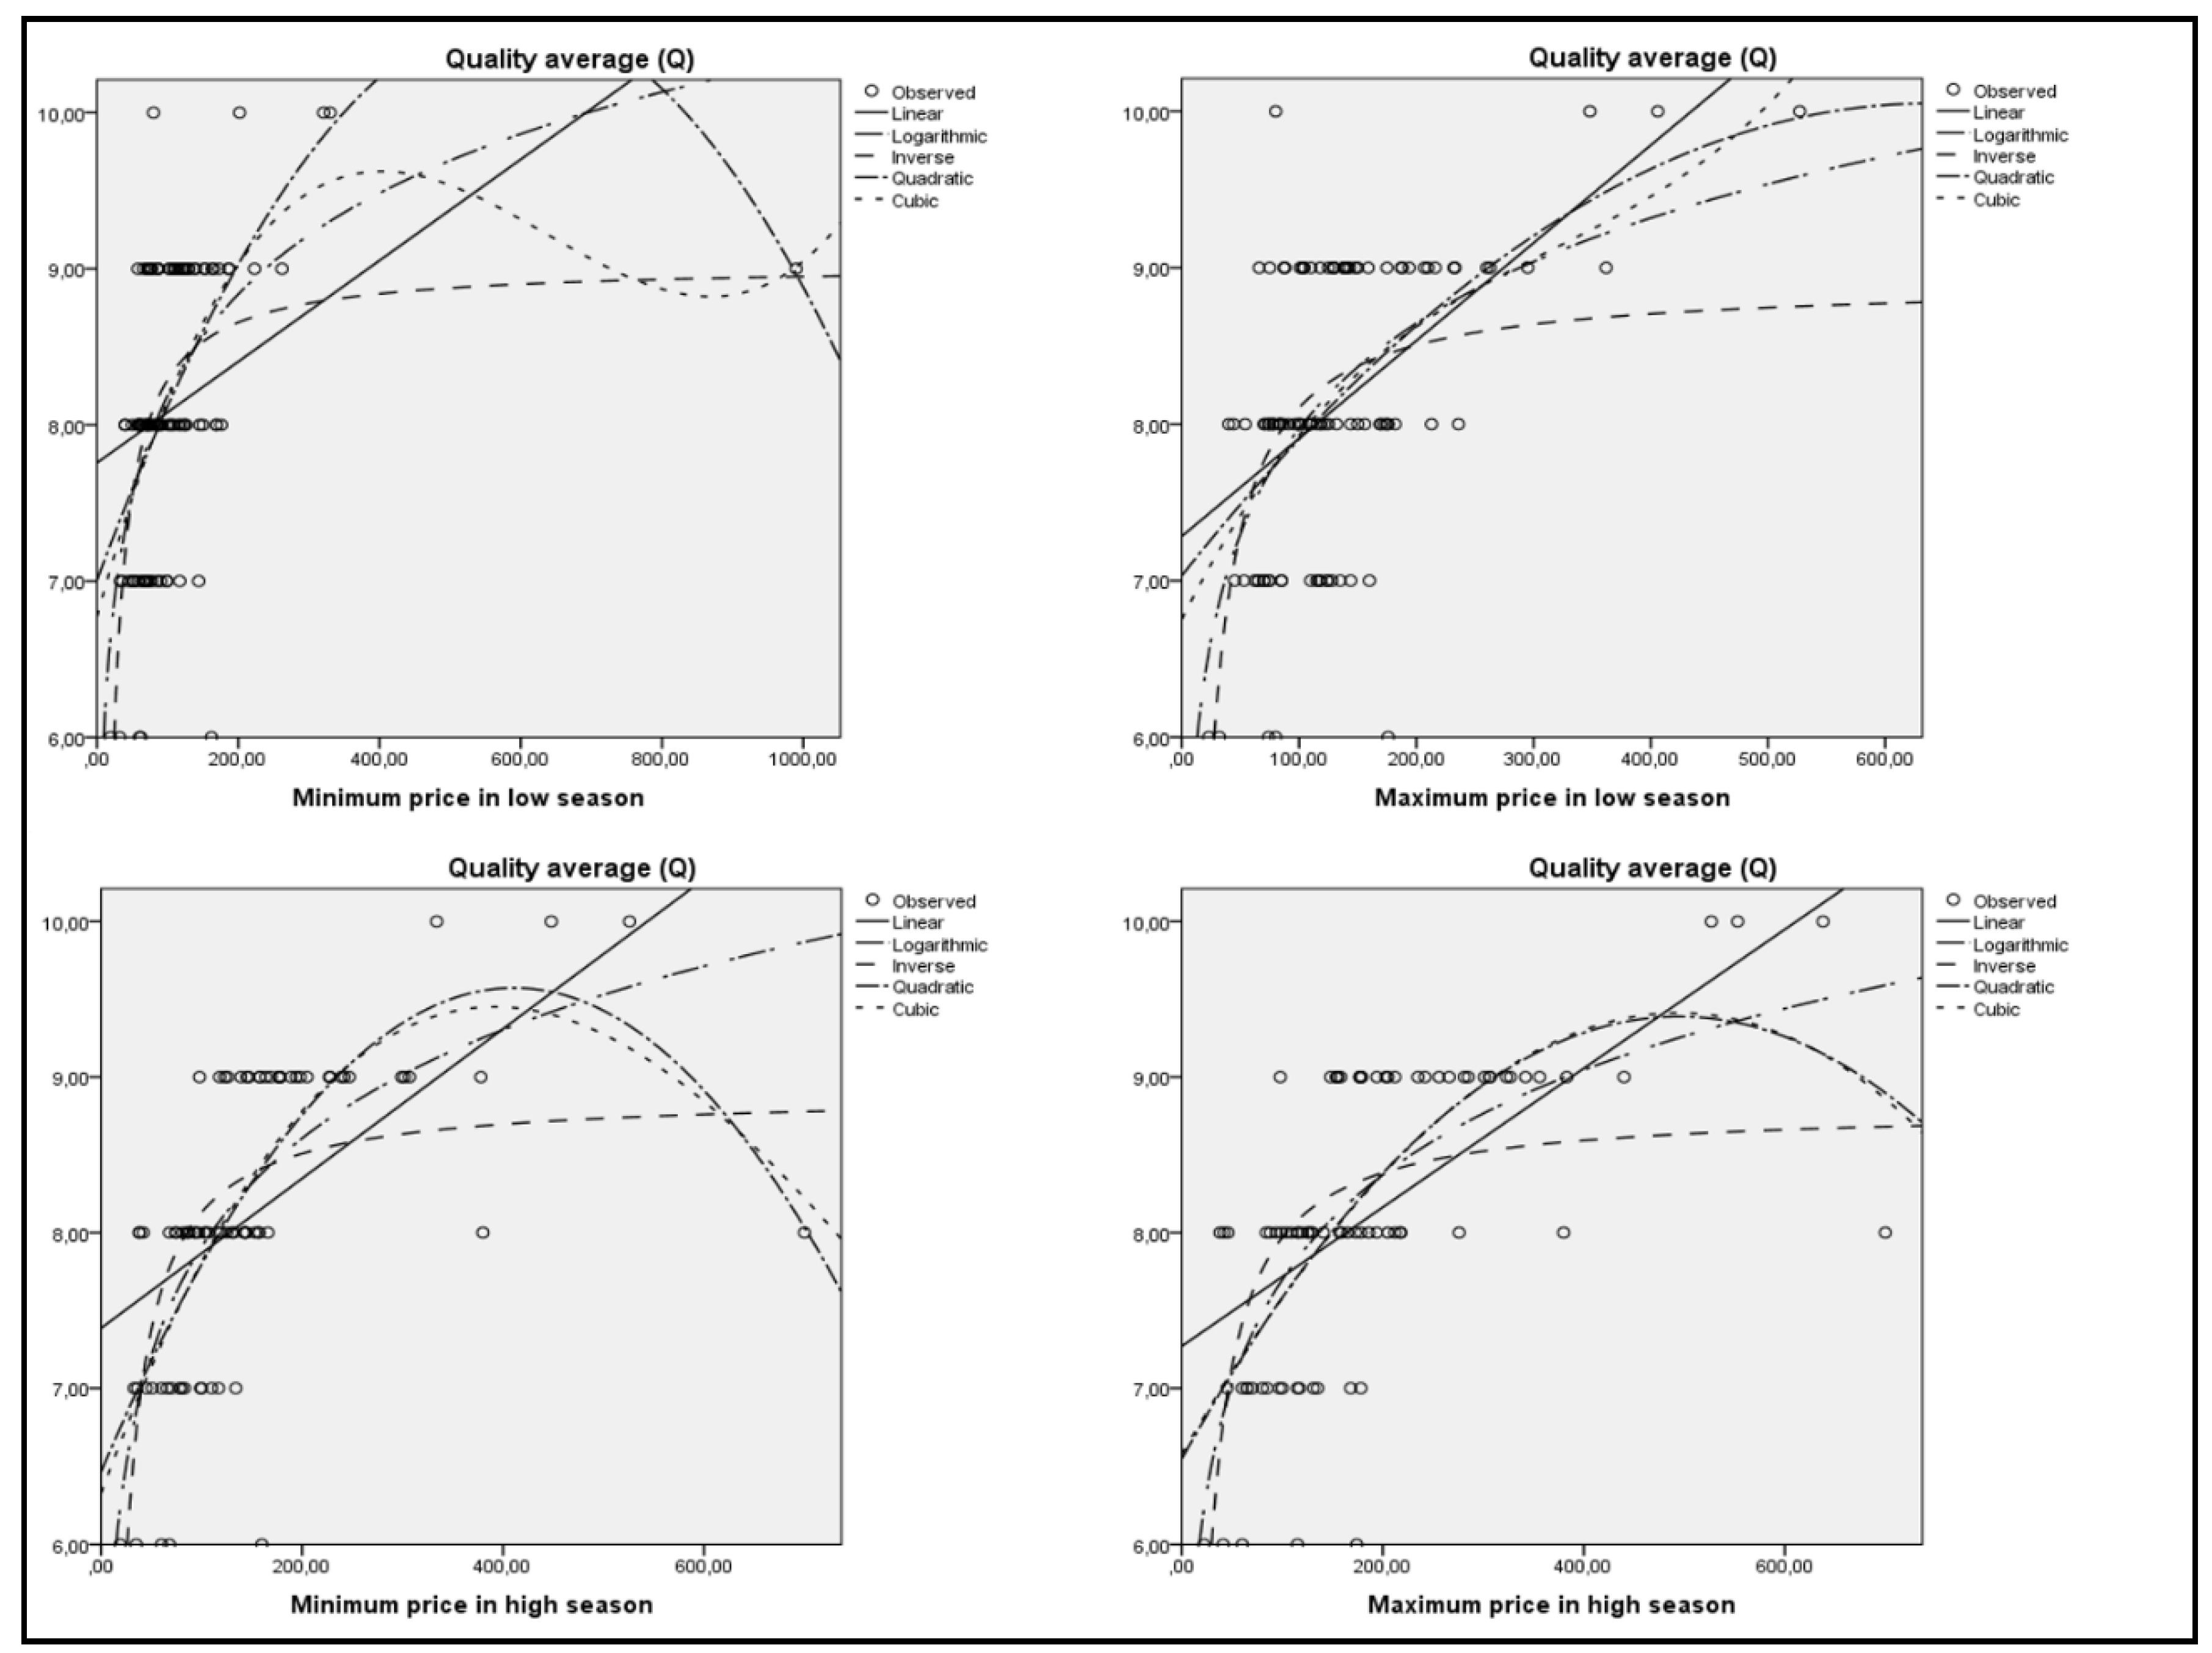
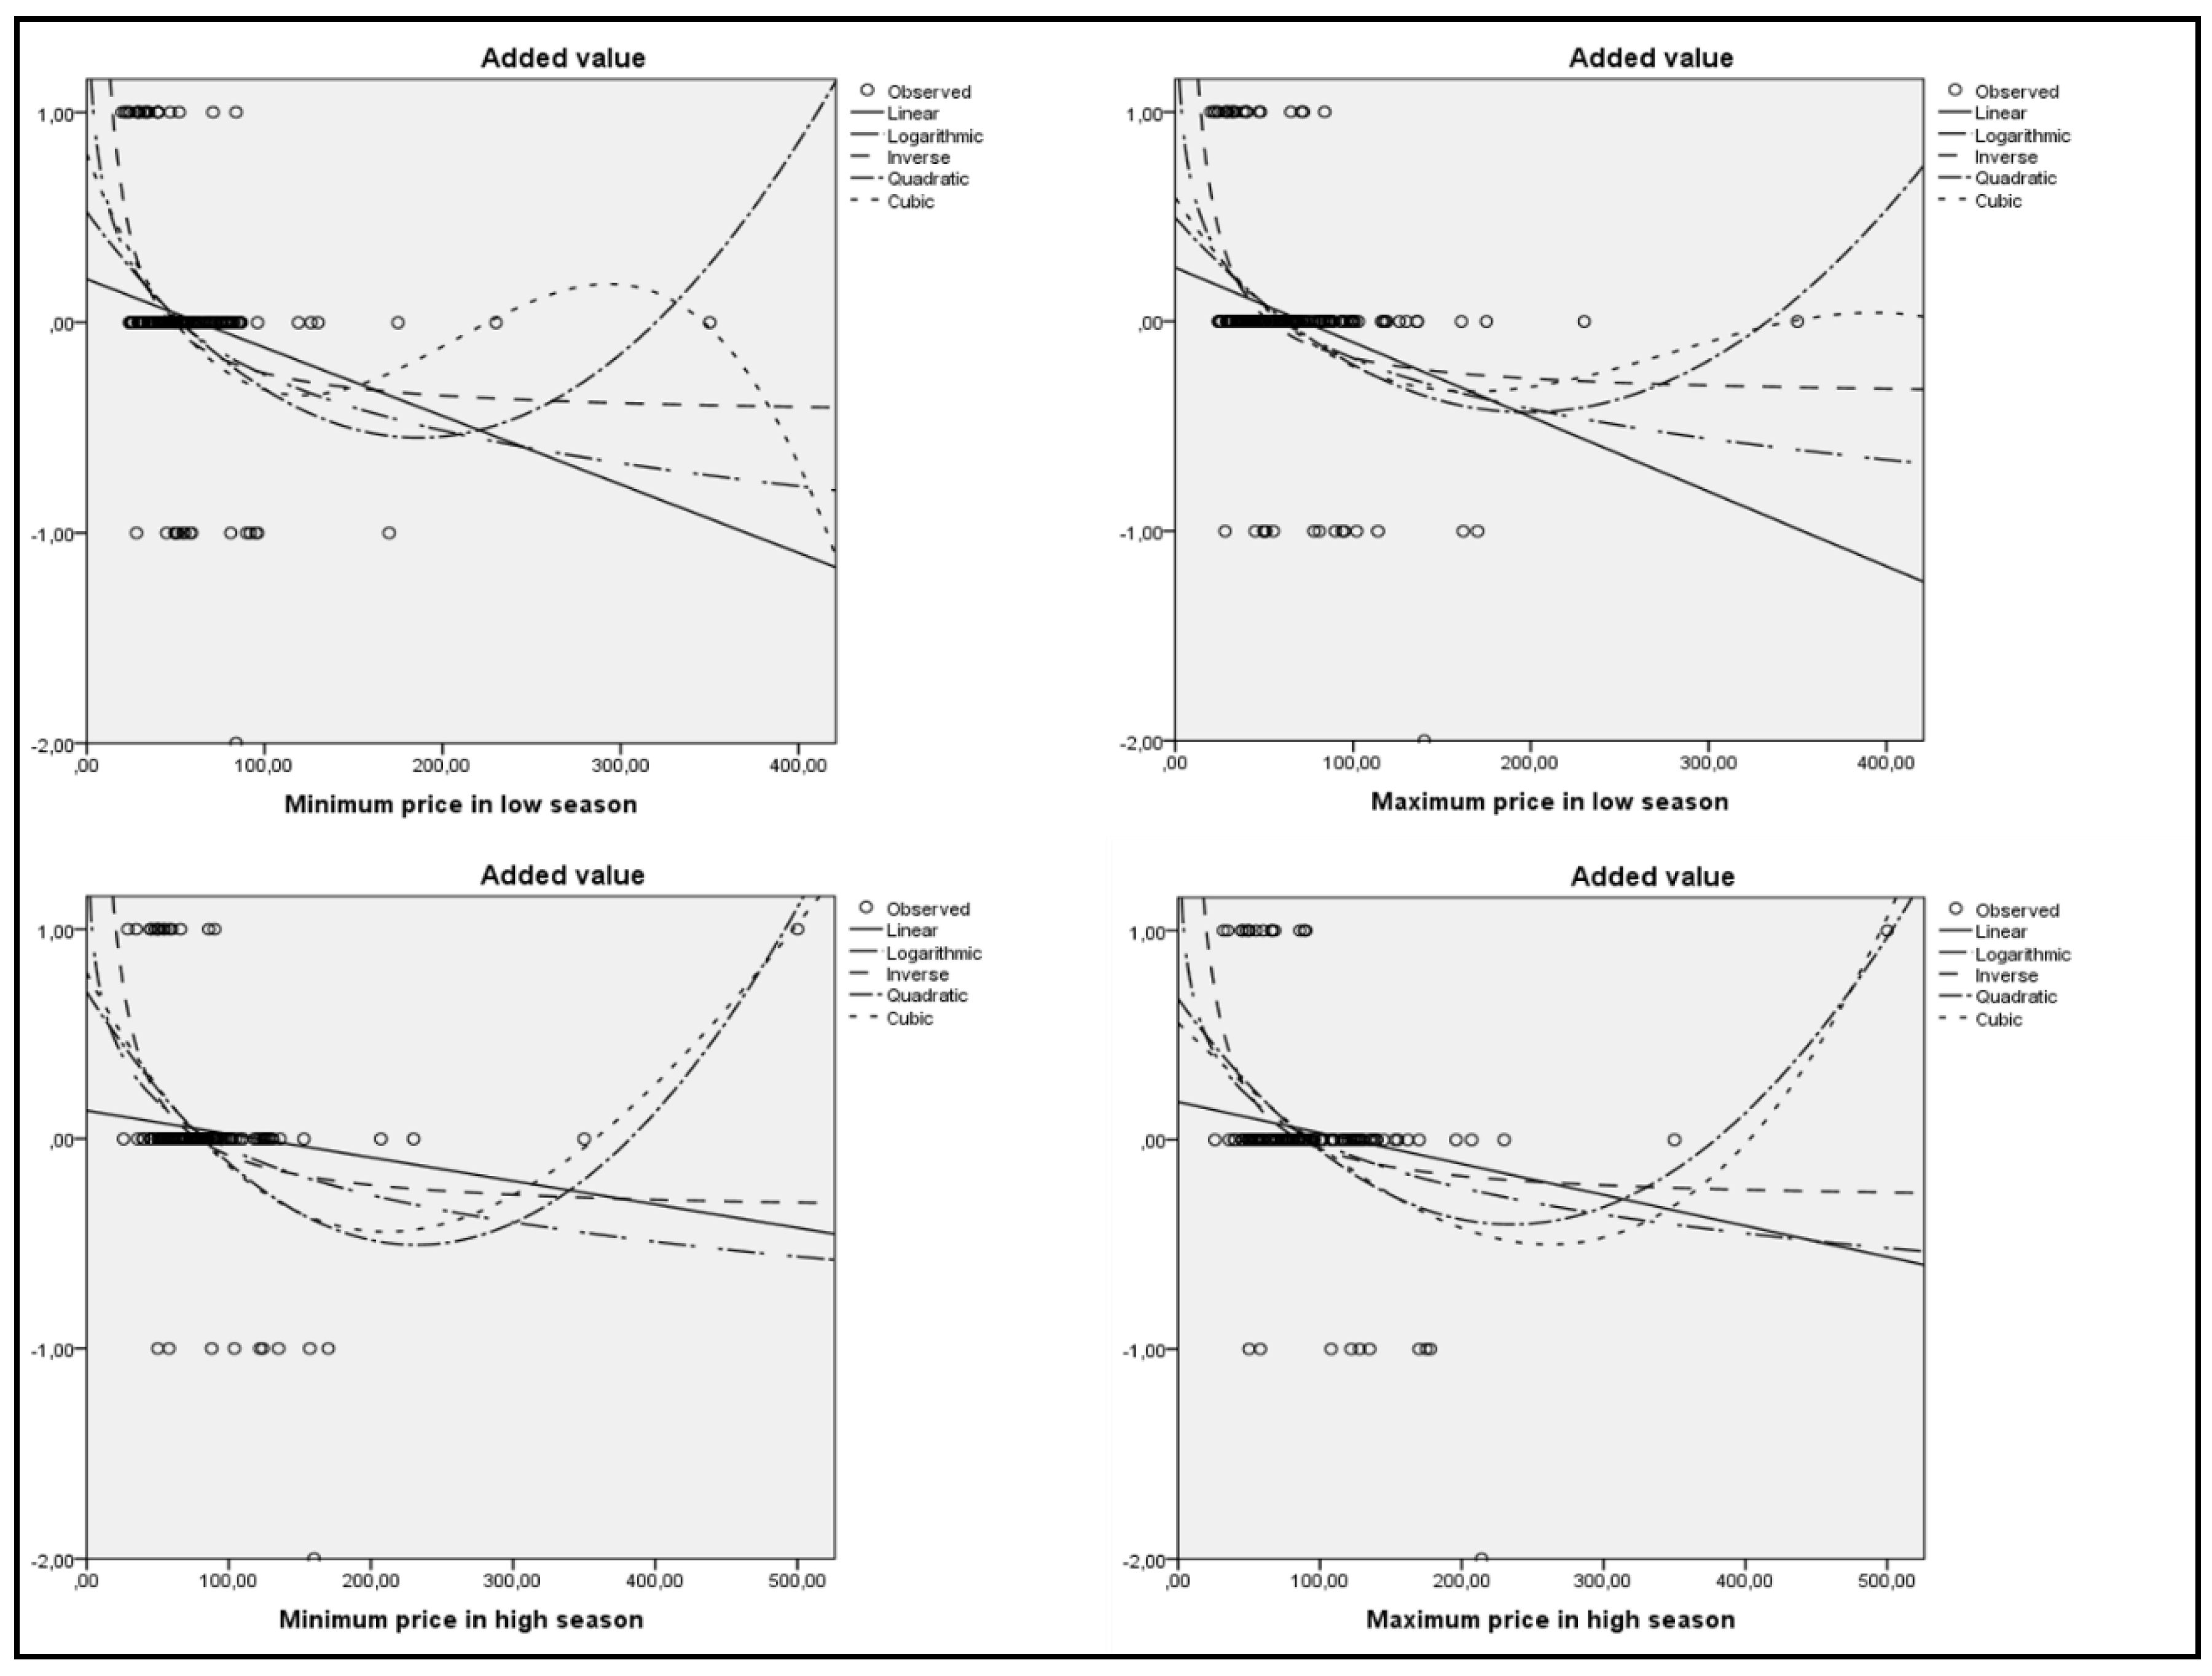
- Linear: The equation is y = a + b1 ∗ x.
- Logarithmic: The equation is y = a + b ∗ ln(x).
- Inverse: The equation is y = a + (b/x).
- Quadratic: The equation is y = a + b ∗ x + c ∗ x2.
- Cubic: The equation is y = a + b ∗ x + c ∗ x2 + d ∗ x3.
4. Analysis of Results
4.1. Lodgings with 4 and 5 Stars
4.2. Lodgings with 3 Stars or Less
5. Discussion and Conclusions
5.1. Discussion
5.2. Conclusions
Author Contributions
Funding
Conflicts of Interest
References
- Abrate, G.; Viglia, G. Strategic and tactical decisions in hotel revenue management. Tour. Manag. 2016, 55, 123–132. [Google Scholar] [CrossRef]
- Kim, W.G.; Park, S.A. Social media review rating versus traditional customer satisfaction: Which one has more incremental predictive power in explaining hotel performance? Int. J. Contemp. Hosp. Manag. 2017, 29, 784–802. [Google Scholar] [CrossRef]
- Govers, R.; Go, F.M.; Kumar, K. Promoting Tourism Destination Image. J. Travel Res. 2007, 46, 15–23. [Google Scholar] [CrossRef]
- Lai, K.; Li, X. Tourism destination image: Conceptual problems and definitional solutions. J. Travel Res. 2016, 55, 1065–1080. [Google Scholar] [CrossRef]
- Sancho Esper, F.; Álvarez Rateike, J. Tourism destination image and motivations: The Spanish perspective of Mexico. J. Travel Tour. Mark. 2010, 27, 349–360. [Google Scholar] [CrossRef]
- Ye, Q.; Li, H.; Wang, Z.; Law, R. The influence of hotel price on perceived service quality and value in e-tourism: An empirical investigation based on online traveller reviews. J. Hosp. Tour. Res. 2014, 38, 23–39. [Google Scholar] [CrossRef]
- Therkelsen, A. Imagining places: Image formation of tourists and its consequences for destination promotion. Scand. J. Hosp. Tour. 2003, 3, 134–150. [Google Scholar] [CrossRef]
- Yacouel, N.; Fleischer, A. The role of cybermediaries in reputation building and price premiums in the online hotel market. J. Travel Res. 2012, 51, 219–226. [Google Scholar] [CrossRef]
- Chun, R. Corporate reputation: Meaning and measurement. Int. J. Manag. Rev. 2005, 7, 91–109. [Google Scholar] [CrossRef]
- Hernández Estárico, E.; Fuentes Medina, M.; Morini Marrero, S. Una aproximación a la reputación en línea de los establecimientos hoteleros españoles. Pap. Tur. 2012, 52, 63–88. [Google Scholar]
- Rodríguez-Díaz, M.; Rodríguez-Díaz, R.; Rodríguez-Voltes, A.C.; Rodríguez-Voltes, C.I. A model of market positioning of destinations based on online customer reviews of lodgings. Sustainability 2018, 10, 78. [Google Scholar]
- Rodríguez-Díaz, M.; Rodríguez-Díaz, R.; Espino-Rodríguez, T.F. Analysis of the online reputation based on customer ratings of lodgings in tourism destinations. Adm. Sci. 2018, 8, 51. [Google Scholar] [CrossRef]
- Rodríguez Díaz, M.; Espino Rodríguez, T.F.; Rodríguez Díaz, R. A model of market positioning based on value creation and service quality in the lodging industry: An empirical application of online customer reviews. Tour. Econ. 2015, 21, 1273–1294. [Google Scholar] [CrossRef]
- Torres, E.N. Deconstructing service quality and customer satisfaction: Challenges and directions for future research. J. Hosp. Mark. Manag. 2014, 23, 652–677. [Google Scholar] [CrossRef]
- Hooley, G.; Broderick, A.; Möller, K. Competitive positioning and the resource-based view of the firm. J. Strateg. Mark. 1998, 6, 97–116. [Google Scholar] [CrossRef]
- Lovelock, C. Services Marketing; Prentice Hall: Englewood Cliffs, NJ, USA, 1991. [Google Scholar]
- Hung, W.T.; Shang, J.K.; Wang, F.C. Pricing determinants in the hotel industry: Quantile regression analysis. Int. J. Hosp. Manag. 2010, 29, 378–384. [Google Scholar] [CrossRef]
- Masiero, L.; Nicolau, J. Tourism market segmentation based on Price sensitivity: Finding similar price preferences on tourism activities. J. Travel Res. 2012, 51, 426–435. [Google Scholar] [CrossRef]
- Israeli, A.A. Star rating and corporate affiliation: Their influence on room price and performance of hotels in Israel. Int. J. Hosp. Manag. 2002, 21, 405–424. [Google Scholar] [CrossRef]
- Tanford, S.; Baloglu, S.; Erdem, M. Travel packaging on the Internet: The impact of pricing information and perceived value on consumer choice. J. Travel Res. 2012, 5, 68–80. [Google Scholar] [CrossRef]
- Rhee, H.T.; Yang, S.B. Does hotel attribute importance differ by hotel? Focusing on hotel-classifications and customers’ overall ratings. Computers in Human Behavior. 2015, 50, 576–587. [Google Scholar] [CrossRef]
- Wang, X.L. Relationship or revenue: Potential management conflicts between customer relationship management and hotel revenue management. Int. J. Hosp. Manag. 2012, 12, 864–874. [Google Scholar] [CrossRef]
- López Fernández, M.C.; Serrano Bedia, A.M. Is the hotel classification system a good indicator of hotel quality? An application in Spain. Tour. Manag. 2004, 25, 771–775. [Google Scholar] [CrossRef]
- O’Connor, P. Managing a hotel’s image on TripAdvisor. J. Hosp. Mark. Manag. 2010, 19, 754–772. [Google Scholar] [CrossRef]
- Gallarza, M.G.; Saura, I.G. Value dimensions, perceived value, satisfaction and loyalty: An investigation of university students’ travel behaviour. Tour. Manag. 2006, 27, 437–452. [Google Scholar] [CrossRef]
- Gallarza, M.G.; Gil-Saura, I.; Holbrook, M.B. The value of value: Further excursions on the meaning and role of customer value. J. Consum. Behav. 2011, 10, 179–191. [Google Scholar] [CrossRef]
- Rodríguez-Díaz, M.; Espino-Rodríguez, T.F. A methodology for a comparative analysis of the lodging tourism destinations based on online customer review. J. Destin. Mark. Manag. 2018, 8, 147–160. [Google Scholar] [CrossRef]
- Rodríguez-Díaz, M.; Espino-Rodríguez, T.F. Determining the reliability and validity of online reputation databases for lodging: Booking.com, TripAdvisror, and HolidayCheck. J. Vacat. Mark. 2018, 24, 261–274. [Google Scholar] [CrossRef]
- Luca, M. Reviews, Reputation, and Revenue: The Case of Yelp.com; Harvard Business School NOM Unit, Working Paper; Harvard Business School: Boston, MA, USA, 2011; pp. 12–16. [Google Scholar]
- Noone, B.M.; McGuire, K.A.; Rohlfs, K.V. Social media meets hotel revenue management: Opportunities, issues and unanswered questions. J. Revenues Pricing Manag. 2011, 10, 293–305. [Google Scholar] [CrossRef]
- Ye, Q.; Law, R.; Gu, B. The impact of online e user reviews on hotel room sales. J. Hosp. Manag. 2009, 28, 180–182. [Google Scholar] [CrossRef]
- Noone, B.M.; Mattila, A.S. Hotel revenue management and the Internet: The effect of price presentation strategies on customers’ willingness to book. Int. J. Hosp. Manag. 2009, 28, 272–279. [Google Scholar] [CrossRef]
- Mattila, A.; O’Neill, J. Relationship between hotel room pricing, occupancy and guest satisfaction: A longitudinal case of a midscale hotel. J. Tour. Hosp. Res. 2003, 27, 328–341. [Google Scholar] [CrossRef]
- Von Martens, T.; Hilbert, A. Customer-value-based revenue management. J. Revenue Pricing Manag. 2011, 10, 87–98. [Google Scholar] [CrossRef]
- Conti, T. Planning for competitive customer value. TQM J. 2013, 25, 224–243. [Google Scholar] [CrossRef]
- Jena, S.K.; Jog, D. Price competition in a tourism supply chain. Tour. Econ. 2017, 23, 1235–1254. [Google Scholar] [CrossRef]
- Oh, H. Service quality, customer satisfaction, and customer value: A holistic perspective. Int. J. Hosp. Manag. 1999, 18, 67–82. [Google Scholar] [CrossRef]
- Kim, K.; Oh, H. Customer satisfaction, service quality, and customer value: Years 2000–2015. Int. J. Contemp. Hosp. Manag. 2017, 29, 2–29. [Google Scholar]
- Cross, R.G.; Higbie, J.A.; Cross, D.Q. Revenue management’s renaissance: A rebirth of the art and science of profitable revenue generation. Cornell Hosp. Q. 2009, 50, 56–81. [Google Scholar] [CrossRef]
- Guillet, B.D.; Mohammed, I. Revenue management research in hospitality and tourism: A critical review of current literature and suggestions for future research. Int. J. Contemp. Hosp. Manag. 2015, 27, 526–560. [Google Scholar] [CrossRef]
- Li, H.; Ye, Q.; Law, R. Determinants of customer satisfaction in the hotel industry: An application of online review analysis. Asia Pac. J. Tour. Res. 2013, 18, 784–802. [Google Scholar] [CrossRef]
- Parasuraman, A.; Zeithaml, V.; Berry, L.L. SERVQUAL: A multiple-item scale for measuring customer perceptions of service quality. J. Retail. 1988, 64, 12–40. [Google Scholar]
- Oliver, R.L. Satisfaction: A Behavioural Perspective on the Consumer; McGraw-Hill: New York, NY, USA, 1997. [Google Scholar]
- Oh, H. The effect of brand class, brand awareness, and price on customer value and behavioral intentions. J. Hosp. Tour. Res. 2000, 24, 136–162. [Google Scholar] [CrossRef]
- Nasution, H.N.; Mavondo, F.T. Customer value in the hotel industry: What managers believe they deliver and what customer experience. Int. J. Hosp. Manag. 2008, 27, 204–213. [Google Scholar] [CrossRef]
- Xie, K.L.; Zhang, Z.; Zhang, Z. The business value of online consumer reviews and management response to hotel performance. Int. J. Hosp. Manag. 2014, 43, 1–12. [Google Scholar] [CrossRef]
- Sparks, B.; Butcher, K.; Bradley, G. Dimensions and correlates of consumer value: An application to the timeshare industry. Int. J. Hosp. Manag. 2008, 27, 98–108. [Google Scholar] [CrossRef]
- Núñez-Serrano, J.A.; Turrion, J.; Velázquez, F.J. Are stars a good indicator of hotel quality? Assymetric information and regulatory heterogeneity in Spain. Tour. Manag. 2014, 42, 77–87. [Google Scholar] [CrossRef]
- Lee, C.G. The determinants of hotel room rates: Another visit with Singapore’s data. Int. J. Hosp. Manag. 2011, 30, 756–758. [Google Scholar] [CrossRef]
- Lee, S.K.; Jang, S. Asymmetry of price competition in the lodging market. J. Travel Res. 2013, 52, 56–67. [Google Scholar] [CrossRef]
- Croes, R.; Semrad, K.J. Does discounting work in the lodging industry? J. Travel Res. 2012, 51, 617–631. [Google Scholar] [CrossRef]
- Blal, I.; Graf, N.S. The discount effect of non-normative physical characteristics on the price of lodging properties. Int. J. Hosp. Manag. 2013, 34, 413–422. [Google Scholar] [CrossRef]
- Chen, C.M.; Lin, Y.C.; Tsai, Y.C. How does advertising affect the price elasticity of lodging demand? Evidence from Taiwan. Tour. Econ. 2015, 21, 1035–1045. [Google Scholar] [CrossRef]
- Divisekera, S.; Kulendran, N. Economic effects of advertising on tourism demand: A case study. Tour. Econ. 2006, 12, 187–205. [Google Scholar] [CrossRef]
- Kleinsasser, S.; Wagner, U. Price ending and tourism consumers’ price perceptions. J. Retail. Consum. Serv. 2011, 18, 58–63. [Google Scholar] [CrossRef]
- Masiero, L.; Nicolau, J. Price sensitivity to tourism activities: Looking for determinant factors. Tour. Econ. 2012, 18, 675–689. [Google Scholar] [CrossRef]
- Espinet, J.M.; Saez, M.; Coenders, G.; Fluiva, M. Effect on prices of the attributes of holiday hotels: A hedonic price approach. Tour. Econ. 2003, 9, 165–177. [Google Scholar] [CrossRef]
- Zhang, H.; Zhang, J.; Shaojing, L.; Cheng, S.; Zhang, J. Modeling hotel room price with geographically weighted regression. Int. J. Hosp. Manag. 2011, 30, 1036–1043. [Google Scholar] [CrossRef]
- Lennox, J. Impacts of high oil prices on tourism in New Zealand. Tour. Econ. 2012, 18, 781–800. [Google Scholar] [CrossRef]
- Qu, H.; Xu, P.; Tan, A. A simultaneous equations model of the hotel room supply and demand in Hong Kong. Int. J. Hosp. Manag. 2002, 21, 455–462. [Google Scholar] [CrossRef]
- Enz, C.; Canina, L.; Lomanno, M. Competitive pricing decisions in uncertain times. Cornell Hosp. Q. 2009, 50, 325–341. [Google Scholar] [CrossRef]
- Chen, Y.; Fay, S.; Wang, Q. The role of marketing in social media: How online consumer reviews evolve. J. Interact. Mark. 2011, 25, 85–94. [Google Scholar] [CrossRef]
- Chen, C.M.; Chang, K.L. Effect of price instability on hotel profitability. Tour. Econ. 2012, 18, 1351–1360. [Google Scholar] [CrossRef]
- Mauri, A.G.; Minazzi, R. Web reviews influence on expectations and purchasing intentions of hotel potential customers. Int. J. Hosp. Manag. 2013, 34, 99–107. [Google Scholar] [CrossRef]
- Litvin, S.W.; Goldsmith, R.E.; Pan, B. Electronic word-of-mouth in hospitality and tourism management. Tour. Manag. 2008, 29, 458–468. [Google Scholar] [CrossRef]
- Mudambi, S.M.; Schuff, D. What makes a helpful review? A study of customer reviews on Amazon.com. MIS Q. 2010, 34, 185–200. [Google Scholar] [CrossRef]
- Vermeulen, I.E.; Seegers, D. Tried and tested: The impact of online hotel reviews on consumer consideration. Tour. Manag. 2009, 30, 123–127. [Google Scholar] [CrossRef]
- Pantelidis, I.S. Electronic meal experience: A content analysis of online restaurant comments. Cornell Hosp. Q. 2010, 51, 483–491. [Google Scholar] [CrossRef]
- Ryu, K.; Han, H. Influence of the quality of food, service, and physical environment on customer satisfaction and behavioural intention in quick-casual restaurants: Moderating role of perceived price. J. Hosp. Tour. Res. 2010, 34, 310–329. [Google Scholar] [CrossRef]
- Zhang, Z.Q.; Ye, Q.; Law, R.; Li, Y.J. The impact of e-word-of-mouth on the online popularity of restaurant: A comparison of consumer reviews and editor reviews. Int. J. Hosp. Manag. 2010, 29, 694–700. [Google Scholar] [CrossRef]
- Gössling, S.; Hall, C.M.; Anderson, A.C. The manager’s dilemma: A conceptualization of online review manipulation strategies. Available online: http://www.tandfonline.com/doi/full/10.1080/13683500. 2015.1127337 (accessed on 15 September 2018).
- Hu, N.; Liu, L.; Zhang, J.J. Do online reviews affect product sales? The role of reviewer characteristics and temporal effects. Inf. Technol. Manag. 2008, 9, 201–214. [Google Scholar] [CrossRef]
- Porter, M.E. Competitive Strategy; Free Press: New York, NY, USA, 1980. [Google Scholar]
- Grönroos, C. Service Management and Marketing: Customer Management in Service Competition; Willey & Sons: Hoboken, NJ, USA, 2007. [Google Scholar]
- Payne, A.; Frow, P. A strategic framework for customer relationship management. J. Mark. 2005, 69, 167–176. [Google Scholar] [CrossRef]
- Payne, A.; Holt, S. Diagnosing customer value: Integrating the value process and relationship marketing. Br. J. Manag. 2001, 12, 159–182. [Google Scholar] [CrossRef]
- Zeithaml, V.A. Consumer perceptions of price, quality, and value: A means-end model and synthesis of evidence. J. Mark. 1988, 52, 2–22. [Google Scholar] [CrossRef]
- Anderson, J.C.; Narus, J.A. Business marketing understand what customer value. Harv. Bus. Rev. 1998, 76, 53–65. [Google Scholar] [PubMed]
- Holbrook, M.B. The nature of customer value: An axiology of services in the consumption experience. In Service Quality: New Directions in Theory and Practice; Rust, R.T., Oliver, R.L., Eds.; Sage Publications: Thousand Oaks, CA, USA, 1994; pp. 21–71. [Google Scholar]
- Rust, R.T.; Oliver, R.L. Service quality: Insights and managerial implications from the frontier. In Service Quality: New Directions in Theory and Practice; Rust, R.T., Oliver, R.L., Eds.; Sage Publications: Thousand Oaks, CA, USA, 1994; pp. 1–19. [Google Scholar]
- Prebensen, N.K.; Woo, E.; Chen, J.S.; Uysal, M. Motivation and involvement as antecedents of the perceived value of the destination experience. J. Travel Res. 2012, 52, 253–264. [Google Scholar] [CrossRef]
- Jeong, M. Evaluating value-added lodging web sites from customers’ perspectives. Int. J. Hosp. Tour. Adm. 2002, 3, 49–60. [Google Scholar] [CrossRef]
- ISTAC. Demanda Turística: Turistas y Pasajeros. 2015. Available online: http://www.gobiernodecanarias.org/istac/temas_estadisticos/sectorservicios/hosteleriayturismo/demanda/ (accessed on 23 April 2017).
- ICCEX. El Sector del Turismo en Marruecos. 2011. Available online: http://www.think-med.es/wp-content/uploads/group-documents/5/1357554892-ICEX2011TurismoMarruecos.pdf (accessed on 20 April 2017).
- Mellinas, J.P.; Martínez María-Dolores, S.M.; Bernal García, J.J. Booking.com: The unexpected scoring system. Tour. Manag. 2015, 49, 72–74. [Google Scholar] [CrossRef]
- Yu, G.; Schwartz, Z. Forecasting short time-series tourism demand with artificial intelligence models. J. Travel Res. 2006, 45, 194–203. [Google Scholar] [CrossRef]
- Gretzel, U. Intelligent systems in tourism: A social science perspective. Ann. Tour. Res. 2011, 38, 757–779. [Google Scholar] [CrossRef]
- Borràs, J.; Moreno, A.; Valls, A. Intelligent tourism recommender systems: A survey. Expert Syst. Appl. 2014, 41, 7370–7389. [Google Scholar] [CrossRef]


| Season: Low | |||||||
|---|---|---|---|---|---|---|---|
| Independent variable: Minimum price | |||||||
| Functions | R2 | F-test | Signif. | K | a | b | c |
| Linear | 0.0346 | 37.298 | 0.0561 | 72.860 | 0.0015 | ||
| Logarithmic | 0.0747 | 84.044 | 0.0045 | 55.435 | 0.4220 | ||
| Inverse | 0.0799 | 90.415 | 0.0033 | 78.788 | −344.059 | ||
| Quadratic | 0.0690 | 38.186 | 0.0251 | 69.774 | 0.0051 | −4.23 × 10⁻³ | |
| Cubic | 0.0721 | 26.451 | 0.0531 | 68.060 | 0.0085 | −1.89 × 10⁻² | 1.16 × 10⁻⁵ |
| Independent variable: Maximum price | |||||||
| Functions | R2 | F-test | Signif. | K | a | b | c |
| Linear | 0.0695 | 77.681 | 0.0063 | 70.803 | 0.0028 | ||
| Logarithmic | 0.0714 | 79.978 | 0.0056 | 54.294 | 0.4258 | ||
| Inverse | 0.0640 | 71.174 | 0.0088 | 78.090 | −359.920 | ||
| Quadratic | 0.0713 | 39.542 | 0.0221 | 69.816 | 0.0040 | −2.91 × 10⁻³ | |
| Cubic | 0.0720 | 26.390 | 0.0535 | 70.837 | 0.0020 | 7.32 × 10⁻³ | −1.37 × 10⁻⁵ |
| Season: High | |||||||
| Independent variable: Minimum price | |||||||
| Functions | R2 | F-test | Signif. | K | a | b | c |
| Linear | 0.1276 | 118.521 | 0.0009 | 70.786 | 0.0025 | ||
| Logarithmic | 0.1789 | 176.581 | 0.0000 | 49.975 | 0.5133 | ||
| Inverse | 0.1426 | 134.739 | 0.0004 | 78.557 | −381.228 | ||
| Quadratic | 0.1856 | 91.215 | 0.0002 | 66.801 | 0.0070 | −7.98 × 10⁻³ | |
| Cubic | 0.1926 | 62.840 | 0.0007 | 64.847 | 0.0104 | −2.24 × 10⁻² | 1.49 × 10⁻⁵ |
| Independent variable: Maximum price | |||||||
| Functions | R2 | F-test | Signif. | K | a | b | c |
| Linear | 0.1535 | 146.982 | 0.0002 | 70.116 | 0.0024 | ||
| Logarithmic | 0.1772 | 174.486 | 0.0000 | 49.230 | 0.5052 | ||
| Inverse | 0.1276 | 118.478 | 0.0009 | 78.165 | −423.641 | ||
| Quadratic | 0.1841 | 90.263 | 0.0002 | 66.889 | 0.0055 | −5.20 × 10⁻³ | |
| Cubic | 0.1841 | 59.430 | 0.0010 | 66.774 | 0.0057 | −5.94 × 10⁻³ | 7.42 × 10⁻⁷ |
| Season: Low | |||||||
|---|---|---|---|---|---|---|---|
| Independent variable: Minimum price | |||||||
| Functions | R2 | F-test | Signif. | K | a | b | c |
| Linear | 0.1256 | 149.486 | 0.0001 | 77.573 | 0.0032 | ||
| Logarithmic | 0.2919 | 428.912 | 2.25 × 10⁻⁶ | 38.876 | 0.9341 | ||
| Inverse | 0.2912 | 427.317 | 2.38 × 10⁻⁶ | 90.236 | −735.271 | ||
| Quadratic | 0.2879 | 208.294 | 2.53 × 10⁻⁵ | 70.066 | 0.0121 | −1.03 × 10⁻² | |
| Cubic | 0.2926 | 140.677 | 9.62 × 10⁻⁵ | 67.726 | 0.0167 | −3.03 × 10⁻² | 1.59 × 10⁻⁵ |
| Independent variable: Maximum price | |||||||
| Functions | R2 | F-test | Signif. | K | a | b | c |
| Linear | 0.2746 | 393.837 | 8.14 × 10⁻⁶ | 72.839 | 0.0062 | ||
| Logarithmic | 0.2962 | 437.721 | 1.64 × 10⁻⁶ | 34.979 | 0.9713 | ||
| Inverse | 0.2524 | 351.286 | 4.05 × 10⁻⁵ | 89.053 | −800.313 | ||
| Quadratic | 0.2840 | 204.319 | 3.36 × 10⁻⁵ | 70.320 | 0.0094 | −7.43 × 10⁻³ | |
| Cubic | 0.2883 | 137.759 | 1.30 × 10⁻⁴ | 67.530 | 0.0149 | −3.54 × 10⁻² | 3.74 × 10⁻⁵ |
| Season: High | |||||||
| Independent variable: Minimum price | |||||||
| Functions | R2 | F-test | Signif. | K | a | b | c |
| Linear | 0.3169 | 375.928 | 3.02 × 10⁻⁵ | 73.857 | 0.0048 | ||
| Logarithmic | 0.4851 | 763.286 | 2.64 × 10⁻¹⁰ | 32.700 | 10.070 | ||
| Inverse | 0.3947 | 528.210 | 2.04 × 10⁻⁷ | 88.854 | −755.736 | ||
| Quadratic | 0.5341 | 458.708 | 5.35 × 10⁻¹¹ | 64.673 | 0.0151 | −1.84 × 10⁻² | |
| Cubic | 0.5366 | 304.979 | 3.37 × 10⁻¹⁰ | 63.290 | 0.0175 | −2.86 × 10⁻² | 1.06 × 10⁻⁵ |
| Independent variable: Maximum price | |||||||
| Functions | R2 | F-test | Signif. | K | a | b | c |
| Linear | 0.3722 | 480.355 | 9.17 × 10⁻⁷ | 72.703 | 0.0044 | ||
| Logarithmic | 0.4622 | 696.399 | 1.57 × 10⁻⁹ | 32.191 | 0.9724 | ||
| Inverse | 0.3450 | 426.806 | 5.29 × 10⁻⁶ | 87.997 | −830.166 | ||
| Quadratic | 0.4791 | 367.926 | 4.67 × 10⁻⁹ | 65.509 | 0.0114 | −1.16 × 10⁻² | |
| Cubic | 0.4792 | 242.302 | 3.23 × 10⁻⁸ | 65.811 | 0.0109 | −9.69 × 10⁻³ | −1.94 × 10⁻⁶ |
| Season: Low | |||||||
|---|---|---|---|---|---|---|---|
| Independent variable: Minimum price | |||||||
| Functions | R2 | F-test | Signif. | K | a | b | c |
| Linear | 0.0811 | 91.855 | 0.0030 | −0.4556 | −0.0015 | ||
| Logarithmic | 0.2234 | 299.300 | 3.11 × 10⁻⁴ | 15.359 | −0.4771 | ||
| Inverse | 0.2143 | 283.719 | 5.82 × 10⁻⁴ | −10.786 | 368.329 | ||
| Quadratic | 0.2123 | 138.813 | 4.59 × 10⁻³ | −0.0616 | −0.0062 | 5.40 × 10⁻³ | |
| Cubic | 0.2609 | 120.051 | 8.54 × 10⁻⁴ | 0.3786 | −0.0147 | 4.31 × 10⁻² | −2.99 × 10⁻⁵ |
| Independent variable: Maximum price | |||||||
| Functions | R2 | F-test | Signif. | K | a | b | c |
| Linear | 0.1919 | 246.971 | 2.65 × 10⁻³ | −0.2178 | −0.0030 | ||
| Logarithmic | 0.2626 | 370.530 | 1.95 × 10⁻⁵ | 19.152 | −0.5341 | ||
| Inverse | 0.2154 | 285.666 | 5.38 × 10⁻⁴ | −10.499 | 431.722 | ||
| Quadratic | 0.2763 | 196.686 | 5.82 × 10⁻⁵ | 0.2236 | −0.0086 | 1.30 × 10⁻² | |
| Cubic | 0.2840 | 134.866 | 1.76 × 10⁻⁴ | 0.4408 | −0.0129 | 3.48 × 10⁻² | −2.91 × 10⁻⁵ |
| Season: High | |||||||
| Independent variable: Minimum price | |||||||
| Functions | R2 | F-test | Signif. | K | a | b | c |
| Linear | 0.0943 | 84.370 | 0.0047 | −0.4155 | −0.0014 | ||
| Logarithmic | 0.2258 | 236.280 | 5.64 × 10⁻³ | 12.027 | −0.3823 | ||
| Inverse | 0.2196 | 228.048 | 7.86 × 10⁻³ | −0.9560 | 313.714 | ||
| Quadratic | 0.3177 | 186.295 | 2.28 × 10⁻⁴ | 0.1027 | −0.0072 | 1.04 × 10⁻² | |
| Cubic | 0.3246 | 126.562 | 7.74 × 10⁻⁴ | 0.2312 | −0.0095 | 1.99 × 10⁻² | −9.82 × 10⁻⁹ |
| Independent variable: Maximum price | |||||||
| Functions | R2 | F-test | Signif. | K | a | b | c |
| Linear | 0.1190 | 109.482 | 0.0013 | −0.3710 | −0.0014 | ||
| Logarithmic | 0.2286 | 240.040 | 4.85 × 10⁻³ | 12.792 | −0.3804 | ||
| Inverse | 0.2049 | 208.811 | 0.0000 | −0.9298 | 355.984 | ||
| Quadratic | 0.3029 | 173.829 | 5.38 × 10⁻⁴ | 0.1540 | −0.0065 | 8.47 × 10⁻³ | |
| Cubic | 0.3048 | 115.476 | 2.35 × 10⁻³ | 0.2329 | −0.0077 | 1.35 × 10⁻² | −5.07 × 10⁻⁶ |
| Season: Low | |||||||
|---|---|---|---|---|---|---|---|
| Independent variable: Minimum price | |||||||
| Functions | R2 | F-test | Signif. | K | a | b | c |
| Linear | 5.10 × 10⁻² | 0.0088 | 0.9250 | 76.569 | 0.0001 | ||
| Logarithmic | 0.0016 | 0.2863 | 0.5932 | 74.165 | 0.0639 | ||
| Inverse | 0.0049 | 0.8726 | 0.3515 | 77.907 | −55.748 | ||
| Quadratic | 8.92 × 10⁻² | 0.0077 | 0.9923 | 76.462 | 0.0004 | −1.03 × 10⁻³ | |
| Cubic | 0.0238 | 13.979 | 0.2451 | 72.051 | 0.0171 | −0.0001 | 3.30 × 10⁻⁴ |
| Independent variable: Maximum price | |||||||
| Functions | R2 | F-test | Signif. | K | a | b | c |
| Linear | 0.0002 | 0.0403 | 0.8410 | 76.820 | −0.0002 | ||
| Logarithmic | 0.0006 | 0.1128 | 0.7373 | 75.229 | 0.0352 | ||
| Inverse | 0.0047 | 0.8334 | 0.3625 | 77.680 | −50.848 | ||
| Quadratic | 0.0002 | 0.0241 | 0.9761 | 76.715 | −1.13 × 10⁻² | −1.05 × 10⁻³ | |
| Cubic | 0.0380 | 22.689 | 0.0822 | 71.054 | 0.0206 | −0.0001 | 3.84 × 10⁻⁴ |
| Season: High | |||||||
| Independent variable: Minimum price | |||||||
| Functions | R2 | F-test | Signif. | K | a | b | c |
| Linear | 9.90 × 10⁻³ | 0.0012 | 0.9716 | 76.579 | 4.13 × 10⁻² | ||
| Logarithmic | 0.0042 | 0.5505 | 0.4594 | 71.954 | 0.1073 | ||
| Inverse | 0.0111 | 14.450 | 0.2315 | 78.488 | −132.101 | ||
| Quadratic | 0.0141 | 0.9098 | 0.4051 | 74.252 | 0.0038 | −9.22 × 10⁻³ | |
| Cubic | 0.0148 | 0.6326 | 0.5952 | 73.393 | 0.0059 | −2.27 × 10⁻² | 1.97 × 10⁻⁵ |
| Independent variable: Maximum price | |||||||
| Functions | R2 | F-test | Signif. | K | a | b | c |
| Linear | 0.0008 | 0.1035 | 0.7481 | 76.953 | −0.0003 | ||
| Logarithmic | 0.0008 | 0.1122 | 0.7381 | 74.599 | 0.0453 | ||
| Inverse | 0.0062 | 0.8000 | 0.3727 | 77.867 | −95.891 | ||
| Quadratic | 0.0091 | 0.5848 | 0.5586 | 75.285 | 0.0022 | −6.62 × 10⁻² | |
| Cubic | 0.0131 | 0.5614 | 0.6414 | 73.143 | 0.0074 | −3.80 × 10⁻² | 4.53 × 10⁻⁵ |
| Season: Low | |||||||
|---|---|---|---|---|---|---|---|
| Independent variable: Minimum price | |||||||
| Functions | R2 | F-test | Signif. | K | a | b | c |
| Linear | 0.0127 | 22.384 | 0.1364 | 74.738 | 0.0024 | ||
| Logarithmic | 0.0625 | 116.047 | 0.0008 | 59.391 | 0.4300 | ||
| Inverse | 0.1026 | 198.940 | 1.46 × 10⁻² | 82.304 | −275.463 | ||
| Quadratic | 0.0789 | 74.184 | 0.0008 | 69.887 | 0.0149 | −4.68 × 10⁻² | |
| Cubic | 0.1197 | 78.010 | 6.51 × 10⁻² | 63.584 | 0.0389 | −0.0002 | 4.72 × 10⁻⁴ |
| Independent variable: Maximum price | |||||||
| Functions | R2 | F-test | Signif. | K | a | b | c |
| Linear | 0.0175 | 31.161 | 0.0792 | 74.436 | 0.0025 | ||
| Logarithmic | 0.0575 | 106.273 | 0.0013 | 61.520 | 0.3622 | ||
| Inverse | 0.0915 | 175.432 | 4.46 × 10⁻² | 81.013 | −2.428.766 | ||
| Quadratic | 0.0682 | 63.378 | 0.0022 | 70.670 | 0.0117 | −3.76 × 10⁻² | |
| Cubic | 0.0948 | 60.066 | 0.0006 | 65.499 | 0.0306 | −0.0002 | 3.51 × 10⁻⁴ |
| Season: High | |||||||
| Independent variable: Minimum price | |||||||
| Functions | R2 | F-test | Signif. | K | a | b | c |
| Linear | 0.0005 | 0.0711 | 0.7901 | 76.171 | 0.0003 | ||
| Logarithmic | 0.0432 | 57.904 | 0.0175 | 60.314 | 0.3718 | ||
| Inverse | 0.0903 | 127.099 | 0.0005 | 82.268 | −409.564 | ||
| Quadratic | 0.1458 | 108.454 | 4.48 × 10⁻² | 68.031 | 0.0136 | −3.22 × 10⁻² | |
| Cubic | 0.1720 | 87.290 | 2.64 × 10⁻² | 62.357 | 0.0278 | −0.0001 | 1.30 × 10⁻⁴ |
| Independent variable: Maximum price | |||||||
| Functions | R2 | F-test | Signif. | K | a | b | c |
| Linear | 0.0013 | 0.1730 | 0.6780 | 75.985 | 0.0004 | ||
| Logarithmic | 0.0354 | 47.021 | 0.0319 | 62.491 | 0.3145 | ||
| Inverse | 0.0697 | 95.919 | 0.0024 | 81.034 | −35.0146ç | ||
| Quadratic | 0.1211 | 87.539 | 0.0002 | 69.087 | 0.0112 | −2.74 × 10⁻² | |
| Cubic | 0.1329 | 64.403 | 0.0004 | 65.110 | 0.0208 | −8.56 × 10⁻² | 8.40 × 10⁻⁵ |
| Season: Low | |||||||
|---|---|---|---|---|---|---|---|
| Independent variable: Minimum price | |||||||
| Functions | R2 | F-test | Signif. | K | a | b | c |
| Linear | 0.0551 | 101.514 | 0.0017 | 0.2061 | −0.0032 | ||
| Logarithmic | 0.1219 | 241.742 | 2.02 × 10⁻³ | 15.109 | −0.3820 | ||
| Inverse | 0.1522 | 312.601 | 8.59 × 10⁻⁵ | −0.4539 | 213.449 | ||
| Quadratic | 0.1260 | 124.763 | 8.68 × 10⁻³ | 0.5252 | −0.0114 | 3.08 × 10⁻² | |
| Cubic | 0.1453 | 97.476 | 5.65 × 10⁻³ | 0.8007 | −0.0219 | 0.0001 | −2.06 × 10⁻⁴ |
| Independent variable: Maximum price | |||||||
| Functions | R2 | F-test | Signif. | K | a | b | c |
| Linear | 0.0840 | 159.709 | 9.49 × 10⁻² | 0.2568 | −0.0035 | ||
| Logarithmic | 0.1317 | 263.987 | 7.40 × 10⁻⁴ | 14.291 | −0.3485 | ||
| Inverse | 0.1484 | 303.328 | 1.29 × 10⁻⁴ | −0.3710 | 196.661 | ||
| Quadratic | 0.1336 | 133.411 | 4.09 × 10⁻³ | 0.4936 | −0.0093 | 2.37 × 10⁻² | |
| Cubic | 0.1359 | 90.175 | 1.40 × 10⁻² | 0.5900 | −0.0128 | 5.50 × 10⁻² | −6.54 × 10⁻⁵ |
| Season: High | |||||||
| Independent variable: Minimum price | |||||||
| Functions | R2 | F-test | Signif. | K | a | b | c |
| Linear | 0.0169 | 22.111 | 0.1394 | 0.1349 | −0.0011 | ||
| Logarithmic | 0.0891 | 125.315 | 0.0005 | 14.317 | −0.3208 | ||
| Inverse | 0.1182 | 171.599 | 6.20 × 10⁻² | −0.3608 | 281.650 | ||
| Quadratic | 0.2113 | 170.208 | 2.82 × 10⁻⁴ | 0.7008 | −0.0104 | 2.24 × 10⁻² | |
| Cubic | 0.2132 | 113.835 | 1.17 × 10⁻² | 0.7916 | −0.0126 | 3.66 × 10⁻² | −2.08 × 10⁻⁵ |
| Independent variable: Maximum price | |||||||
| Functions | R2 | F-test | Signif. | K | a | b | c |
| Linear | 0.0331 | 43.941 | 0.0380 | 0.1802 | −0.0014 | ||
| Logarithmic | 0.0973 | 138.024 | 0.0003 | 14.303 | −0.3134 | ||
| Inverse | 0.1087 | 156.120 | 0.0001 | −0.3048 | 262.839 | ||
| Quadratic | 0.2019 | 160.716 | 6.00 × 10⁻⁴ | 0.6724 | −0.0091 | 1.95 × 10⁻² | |
| Cubic | 0.2047 | 108.111 | 2.27 × 10⁻³ | 0.5572 | −0.0064 | 2.68 × 10⁻³ | 2.43 × 10⁻⁵ |
© 2018 by the authors. Licensee MDPI, Basel, Switzerland. This article is an open access article distributed under the terms and conditions of the Creative Commons Attribution (CC BY) license (http://creativecommons.org/licenses/by/4.0/).
Share and Cite
Rodríguez-Díaz, M.; Rodríguez-Díaz, R.; Rodríguez-Voltes, A.C.; Rodríguez-Voltes, C.I. Analysing the Relationship between Price and Online Reputation by Lodging Category. Sustainability 2018, 10, 4474. https://doi.org/10.3390/su10124474
Rodríguez-Díaz M, Rodríguez-Díaz R, Rodríguez-Voltes AC, Rodríguez-Voltes CI. Analysing the Relationship between Price and Online Reputation by Lodging Category. Sustainability. 2018; 10(12):4474. https://doi.org/10.3390/su10124474
Chicago/Turabian StyleRodríguez-Díaz, Manuel, Rosa Rodríguez-Díaz, Ana Cristina Rodríguez-Voltes, and Crina Isabel Rodríguez-Voltes. 2018. "Analysing the Relationship between Price and Online Reputation by Lodging Category" Sustainability 10, no. 12: 4474. https://doi.org/10.3390/su10124474
APA StyleRodríguez-Díaz, M., Rodríguez-Díaz, R., Rodríguez-Voltes, A. C., & Rodríguez-Voltes, C. I. (2018). Analysing the Relationship between Price and Online Reputation by Lodging Category. Sustainability, 10(12), 4474. https://doi.org/10.3390/su10124474