Article

Study of the Spatiotemporal Variation Characteristics of Forest Landscape Patterns in Shanghai from 2004 to 2014 Based on Multisource Remote Sensing Data

1
Jiangsu Center for Collaborative Innovation in Geographical Information Resource Development and Application, Nanjing Normal University, Nanjing 210023, China
2
Key Laboratory of Virtual Geographic Environment, Nanjing Normal University, Ministry of Education, Nanjing 210046, China
3
School of Geographic Science, Nanjing Normal University, Nanjing 210046, China
4
Shanghai Forestry Station, Shanghai 200072, China
5
College of Geomatics Science and Technology, Nanjing Tech University, Nanjing 211816, China
*
Author to whom correspondence should be addressed.
Sustainability 2018, 10(12), 4397; https://doi.org/10.3390/su10124397
Submission received: 30 September 2018 / Revised: 11 November 2018 / Accepted: 20 November 2018 / Published: 24 November 2018

Abstract

:
The landscape patterns of urban forests not only reflect the influence of urbanization on urban forests, but also determines its function in urban ecosystem services. In the case of mastering the overall forest landscape pattern of a city, a study of the structure of urban forest landscapes at different scales and in urbanized regions is beneficial to a comprehensive understanding of the forest characteristics of a city. In the present study, an attempt was made to map and monitor the spatio-temporal dynamics of an urban forest in Shanghai from 2004 to 2014 using remote sensing techniques. Methods of landscape ecology analysis are followed to quantify the spatiotemporal patterns of an urban forest landscape by urban and rural gradient regionalization. The results show that the spatial structure of an urban forest landscape is essentially consistent with an urban landscape pattern. Due to strong interference from human activities, the ecological quality of forest landscapes is low. At the landscape level, the urban forest coverage rate increased from 11.43% in 2004 to 16.02% in 2014, however, the number of large patches decreased, there was a high degree of urban forest landscape fragmentation, landscape connectivity was poor, landscape patch boundaries were uniform, and weak links were present between ecological processes. Different urban and rural gradient division methods exhibit obvious gradient characteristics along the urban–rural gradient in Shanghai. The regional differences in the urban forest landscape ecological characteristics have further increased as a result of urban planning and zoning. The total amount of urban forest is located closer to the urban center, which has the smallest total amount of forest; however, in terms of urban forest coverage, the suburbs have more coverage than do the outer suburbs and the central urban areas. The urban forest landscape’s spatial distribution area is evidently different. Urbanization affects the areas closest to urban residential areas, which are markedly disturbed by humans, and the urban forest landscape has a high degree of fragmentation. The forest patches have become divided and unconnected, and the degree of natural connectivity has gradually decreased over the past 10 years. At the landscape class level, broadleaf forests are dominant in Shanghai, and their area exhibits an increasing trend; shrublands and needleleaf forests, however, show a decreasing trend. Compared with other forest types, the spatial distribution of broadleaf forest is concentrated in the suburbs, and the aggregation effect is relatively apparent. From the perspective of urban forest landscape pattern aggregation characteristics in Shanghai, the spatial distribution of urban forest landscape point patterns in the study area exhibit extremely uneven characteristics. The point density of urban forest patches larger than 1 ha in Shanghai increased from 2004 to 2014. However, the total number of patches with areas larger than 5 ha decreased, and this decrease plays an important role in the ecological environment. In the past 10 years, the concentration characteristics of urban forests with large patches has gradually decreased. In 2014, the urban forest landscapes decreased by 5 km compared to the intensity of aggregates in 2004, which also indicates that urban forests in Shanghai tend to be fragmented. The results of this study can be useful to help improve urban residents’ living environments and the sustainable development of the urban ecosystem, and they will also be vital to future management.

1. Introduction

Urban forests have attracted much attention because they can improve the living environment and environmental quality for residents. The concept of the forest city was first proposed by Erik Jorgensen from the University of Toronto, Canada. American scholars have disagreed about the concept of urban forests and formed different factions [1,2,3,4,5]. Combining the variety of definitions of urban forests proposed by many scholars, it is not difficult to determine that urban forests refer to trees and related vegetation within and around cities, including all vegetation areas that have a significant effect on the urban environment in urban, suburban and outer suburb areas [6]. China’s urban forest development began in the 1980s, beginning relatively late compared to similar efforts in Europe and the United States. However, many cities have achieved remarkable results in terms of their development under the impetus of their relevant state departments [7,8,9]. Urban forests are biologically and non-biologically complex, with obvious ecological and human landscape value. Urban forest landscape research recognizes and studies not only urban forests from the perspective of the landscape, but also the development of landscape ecology application research [10,11,12]. The urbanization process has created a large number of homogenized urban landscapes. Urbanization is considered by many scholars to be one of the most important drivers for changing the natural environment and causing the rapid reduction and extinction of many local species. Large-scale urbanization has changed the landscape pattern of cities and their surrounding areas, significantly affecting the structure, process and function of urban forest ecosystems [13,14,15,16]. Urban forest landscape patterns and processes represent the evolutionary process of urban forest landscape patterns and various ecological processes related to urban forests. They are an important part of the overall landscape of a region, and the landscape pattern formed by natural disturbance and human factors [17,18,19]. Urban forests play an important role in alleviating the ecological and environmental problems caused by urbanization. Urban forest landscape patterns and ecological process research on the landscape scale have become a popular research topic in urban forest science. Based on domestic and international research, the research content related to urban forest landscape patterns and processes primarily focuses on the landscape pattern distribution of urban forests, plant diversity and landscape patterns, urban forest landscape pattern evolution and driving mechanisms, urban forest landscape models, planning research related to urban forest landscapes, and other aspects [6].
Due to the limitations of basic research methods and research models, urban forest landscape correlation research remains in the exploration stage. In the study of urban forest landscape patterns, landscape pattern indices, remote sensing, ceography information systems and global positioning systems technical analysis methods are important means of identifying forest landscape patterns, and these analyses greatly enrich the research on forest landscapes. With the further development of remote sensing technology, landscape ecologists can quickly acquire remote sensing images with time series data. Remote sensing images and related GIS data can be directly used as initial data in the forest landscape model, and the entire target area can be simulated by pixels. The emergence of high-efficiency computers and the development of computer graphics technology have made large-scale image processing and complex operations faster. Remote sensing images and spatial analysis software can be used to simulate and predict landscape changes, and these sources have become methods used by researchers [20,21,22,23,24,25,26,27,28]. In the study of urban forest pattern evolution, more attention has been paid to the level of patches and the landscape mosaics, and the long-term and spatial scale data are used to reflect the large-scale historical processes of change [29,30]. These processes are closely related to land-use methods, such as urban development, timber demand, residential land, transportation and developed land. The 3S technology can quantify qualitative indicators, such as the analysis and measurement of urban forests, and the more intuitive analysis and evaluation of the spatial pattern of urban green space landscapes. However, based on the characteristics of landscape pattern, the landscape distribution pattern and its ecological processes and spatial combination laws have strong scale dependence characteristics. Because the urban forest landscape structure in the city center is becoming simplified, the landscape blocks are becoming fragmented, and the level connection between blocks is declining [31,32,33,34,35]. The traditional method cannot fully interpret the scale information of the landscape pattern. Multi-scale spatial analysis is the basis of the scale effect analysis. The spatial point pattern analysis method, which originated from plant ecology, is an effective means to analyze multi-scale spatial features. This method is the primary method for discovering and identifying landscape hierarchy and feature scales [36,37,38]. Compared with the traditional landscape pattern analysis method, the spatial point pattern analysis method reveals greater advantages and effectively supplements the landscape index method.
As a typical high-density human accumulation area, Shanghai’s forest vegetation has long been subject to frequent disturbances from human activities. The types of forest vegetation are complex, the patches are broken, and the vegetation has been poorly protected. In the long term, the spatial pattern of forest landscapes is complex, and there is a significant gap between the lack of ecological green space resources and the ecological needs of urban residents during the process of rapid urbanization. In recent years, many scholars have studied the rapid urbanization process in Shanghai and the evolution of the urban land expansion and forest landscape patterns [39,40,41,42,43]. However, research on the spatial evolution of forest landscape patterns under the background of rapid urbanization in Shanghai still requires more attention. In this study, our objectives were to quantify the spatiotemporal patterns of urban forest in Shanghai from 2004 to 2014. To accomplish this, we first extracted forest from 2004 to 2014 based on multi-source remote sensing data. Then, we analyzed the dynamics of the urban forest landscape using a multi-scale landscape pattern analysis method. Finally, we discuss the characteristics of the evolution of the urban forest pattern in Shanghai and different sub-districts, and further analyze the problems of urban forest development in Shanghai.

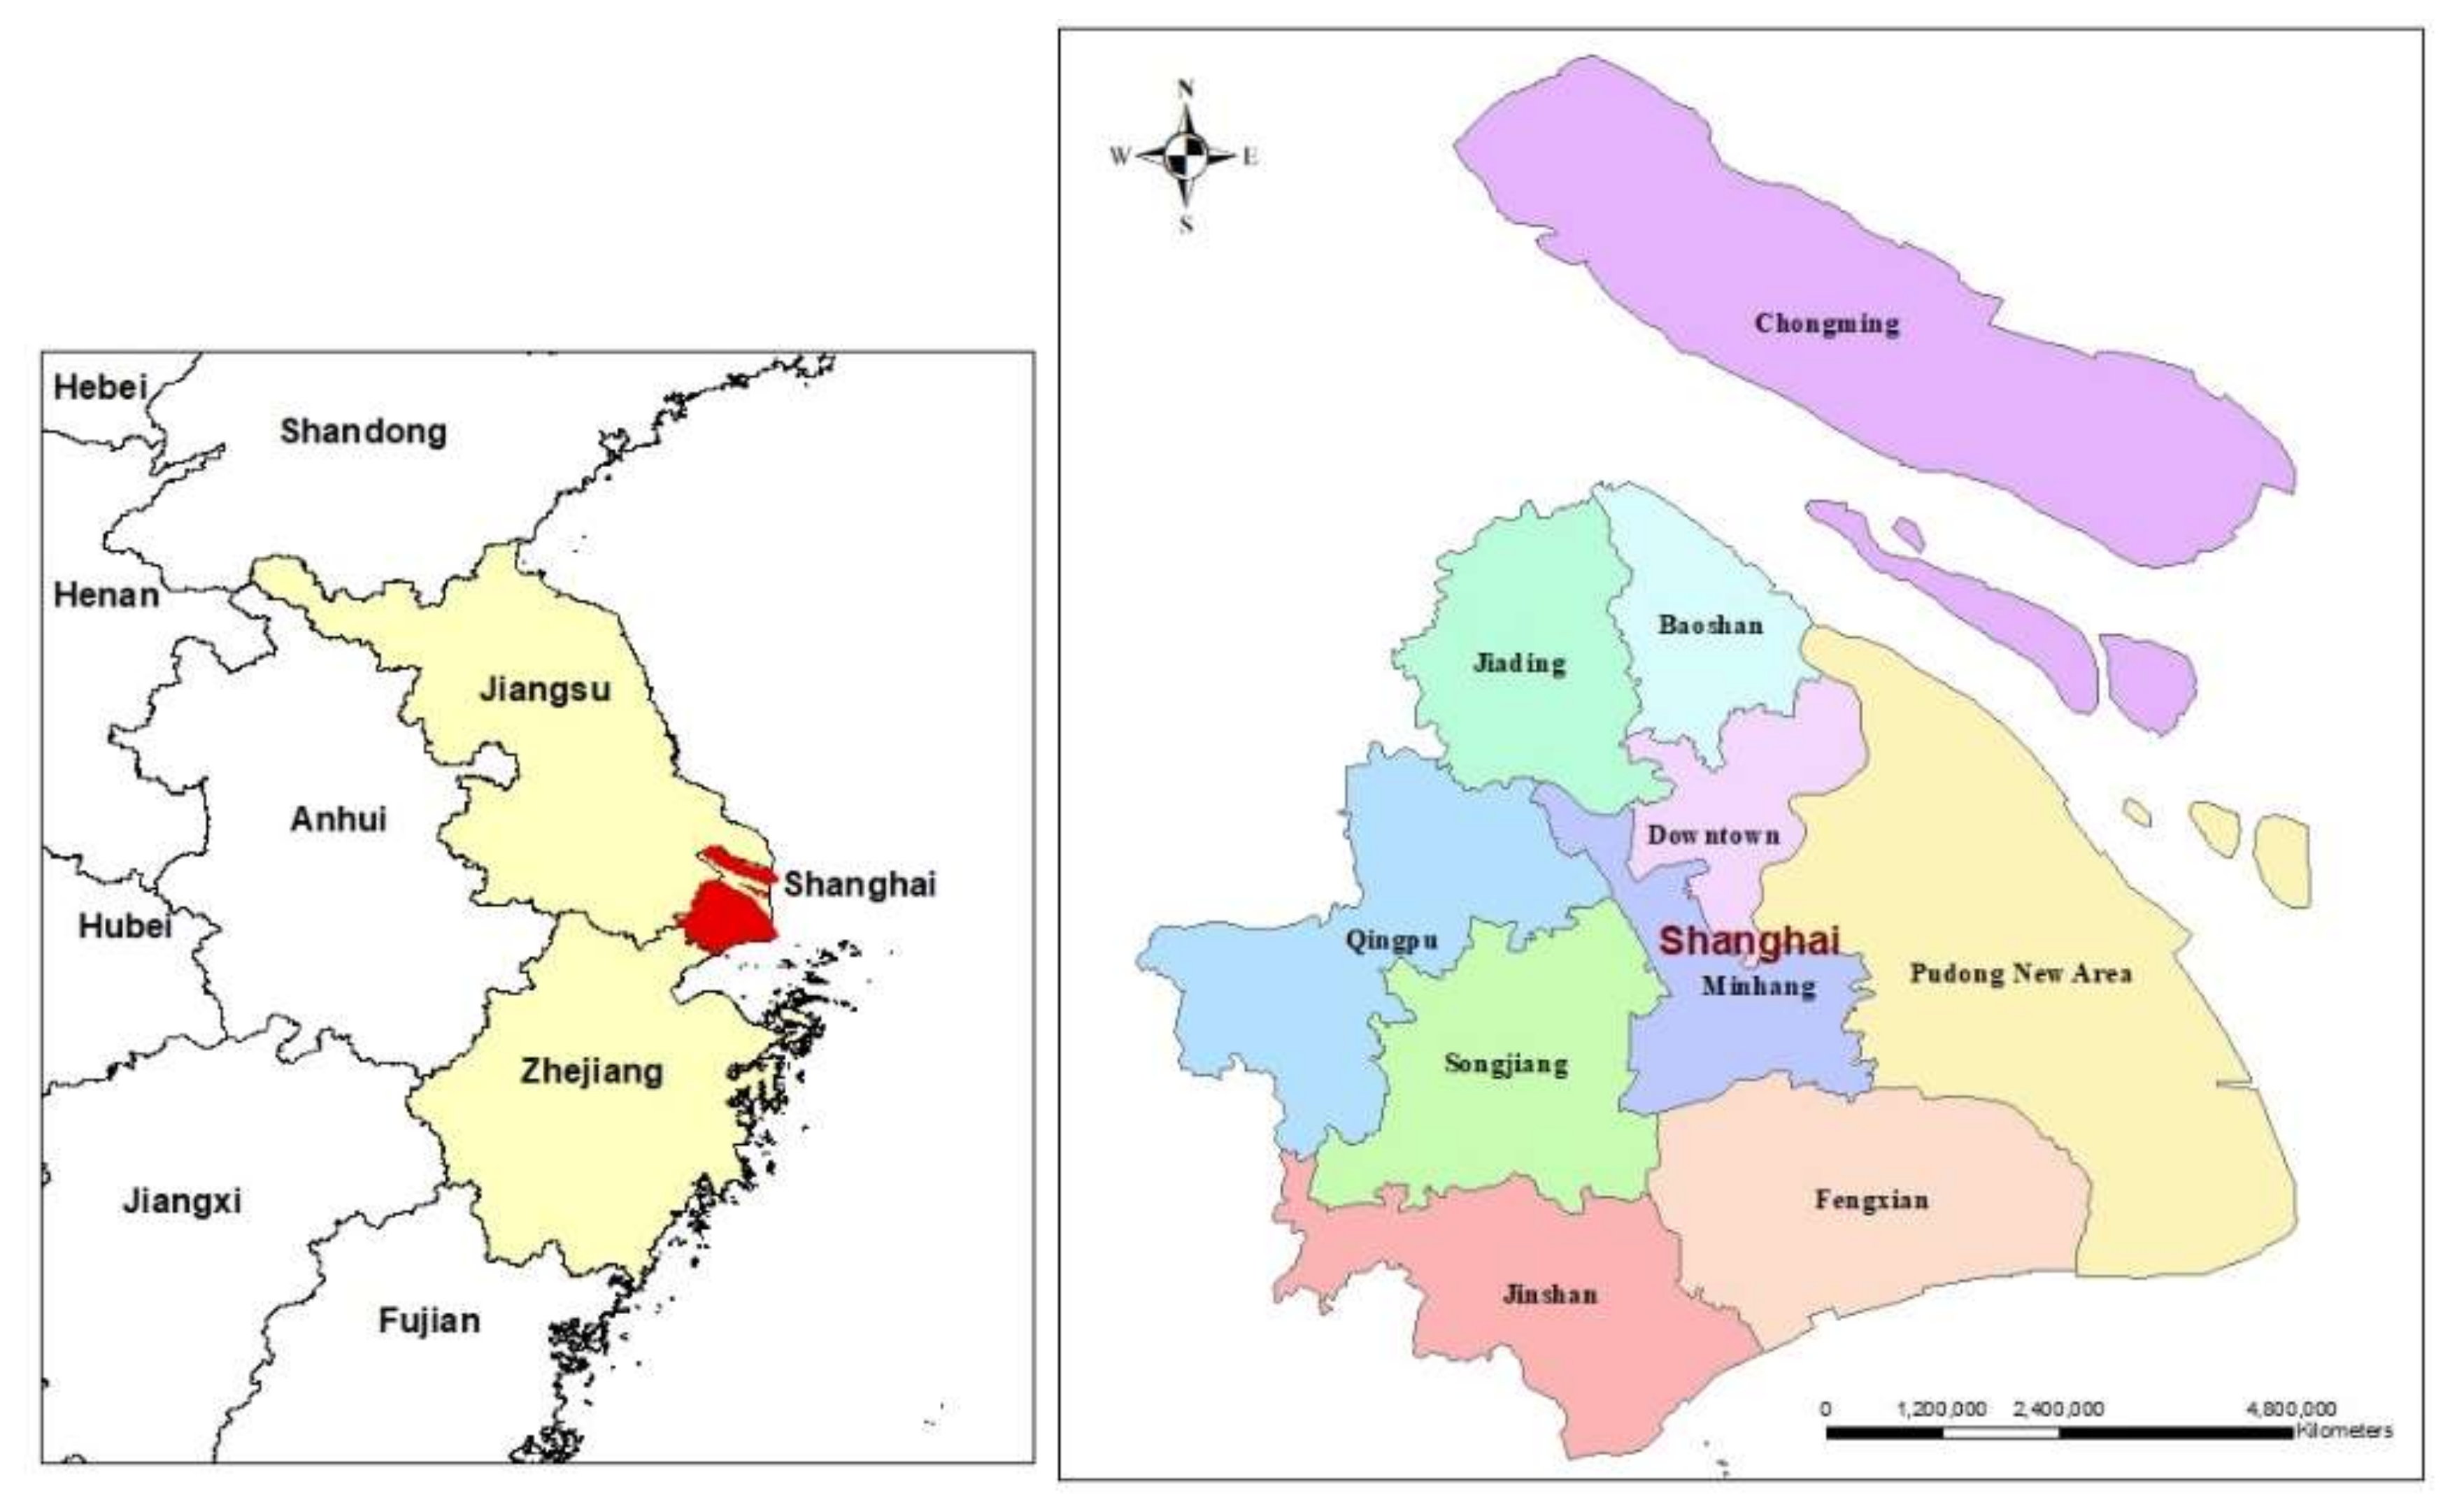
2. Study Areas and Materials

Shanghai is located at latitude from 30°40′ N to 31°53′ N and longitude 120°52′ E to 122°12′ E. It is located on the west bank of the Pacific Ocean and on the east side of the Asian continent. Shanghai is located along the front edge of the Yangtze River Delta, east of the East China Sea, south of Hangzhou Bay, west of Jiangsu, Zhejiang Province, and north of where the Yangtze River enters the sea (Figure 1). Shanghai has a subtropical monsoon climate with four distinct seasons, abundant sunshine and abundant rainfall. Shanghai urban forests primarily consist of subtropical evergreen broadleaf forests, Metasequoia forests, bamboo forests and economic forests. The forests are characterized by wide distribution in suburban areas, small areas of urban forest, and mostly blocky (ecological forest, forest park) and zonal distribution (green belt around the city, water conservation forest in the upper reaches of Huangpu River). There is little natural vegetation in Shanghai, and most of the territory consists of man-made cultivated crops and forests. The proportion of man-made forests in the Shanghai area is relatively large. The proportion of man-made young forests is the largest (85%), and some of the residual zonal natural vegetation only exists in Sheshan and Jinshan Island. Being a typical international metropolis and an economic and commercial center in China, Shanghai is also the city with the highest level of urbanization (89% urbanization rate) and the highest population density (3000 people/km2) in mainland China. In 2014, the permanent population of Shanghai was 24.25 million, and the regional GDP reached 236 million yuan. That same year, the forest coverage rate reached 14%, but the demand for urban forest ecosystem services is high due to severe pollution, heavy environmental pressure and a lack of residential recreation space [44,45,46].
The Landsat series of data images from 2004 to 2014 were downloaded from the Geospatial Data Cloud Platform (http://www.gscloud.cn/) and used as the main data source. Remote sensing data from different seasons in the region were used to subdivide the urban landscape and tree species. This study selected other supporting data, including Shanghai land-use data (1980s–2010) from the National Geoscience Data Platform-Yangtze River Delta Science Data Center (http://nnu.geodata.cn:8008/), a Shanghai urban green map, additional resource survey data from Shanghai (2014), a map of the Shanghai administrative division (from the Shanghai Surveying and Mapping Institute), Shanghai aerial images data (2000–2009), and the related vegetation survey data.

3. Methodology

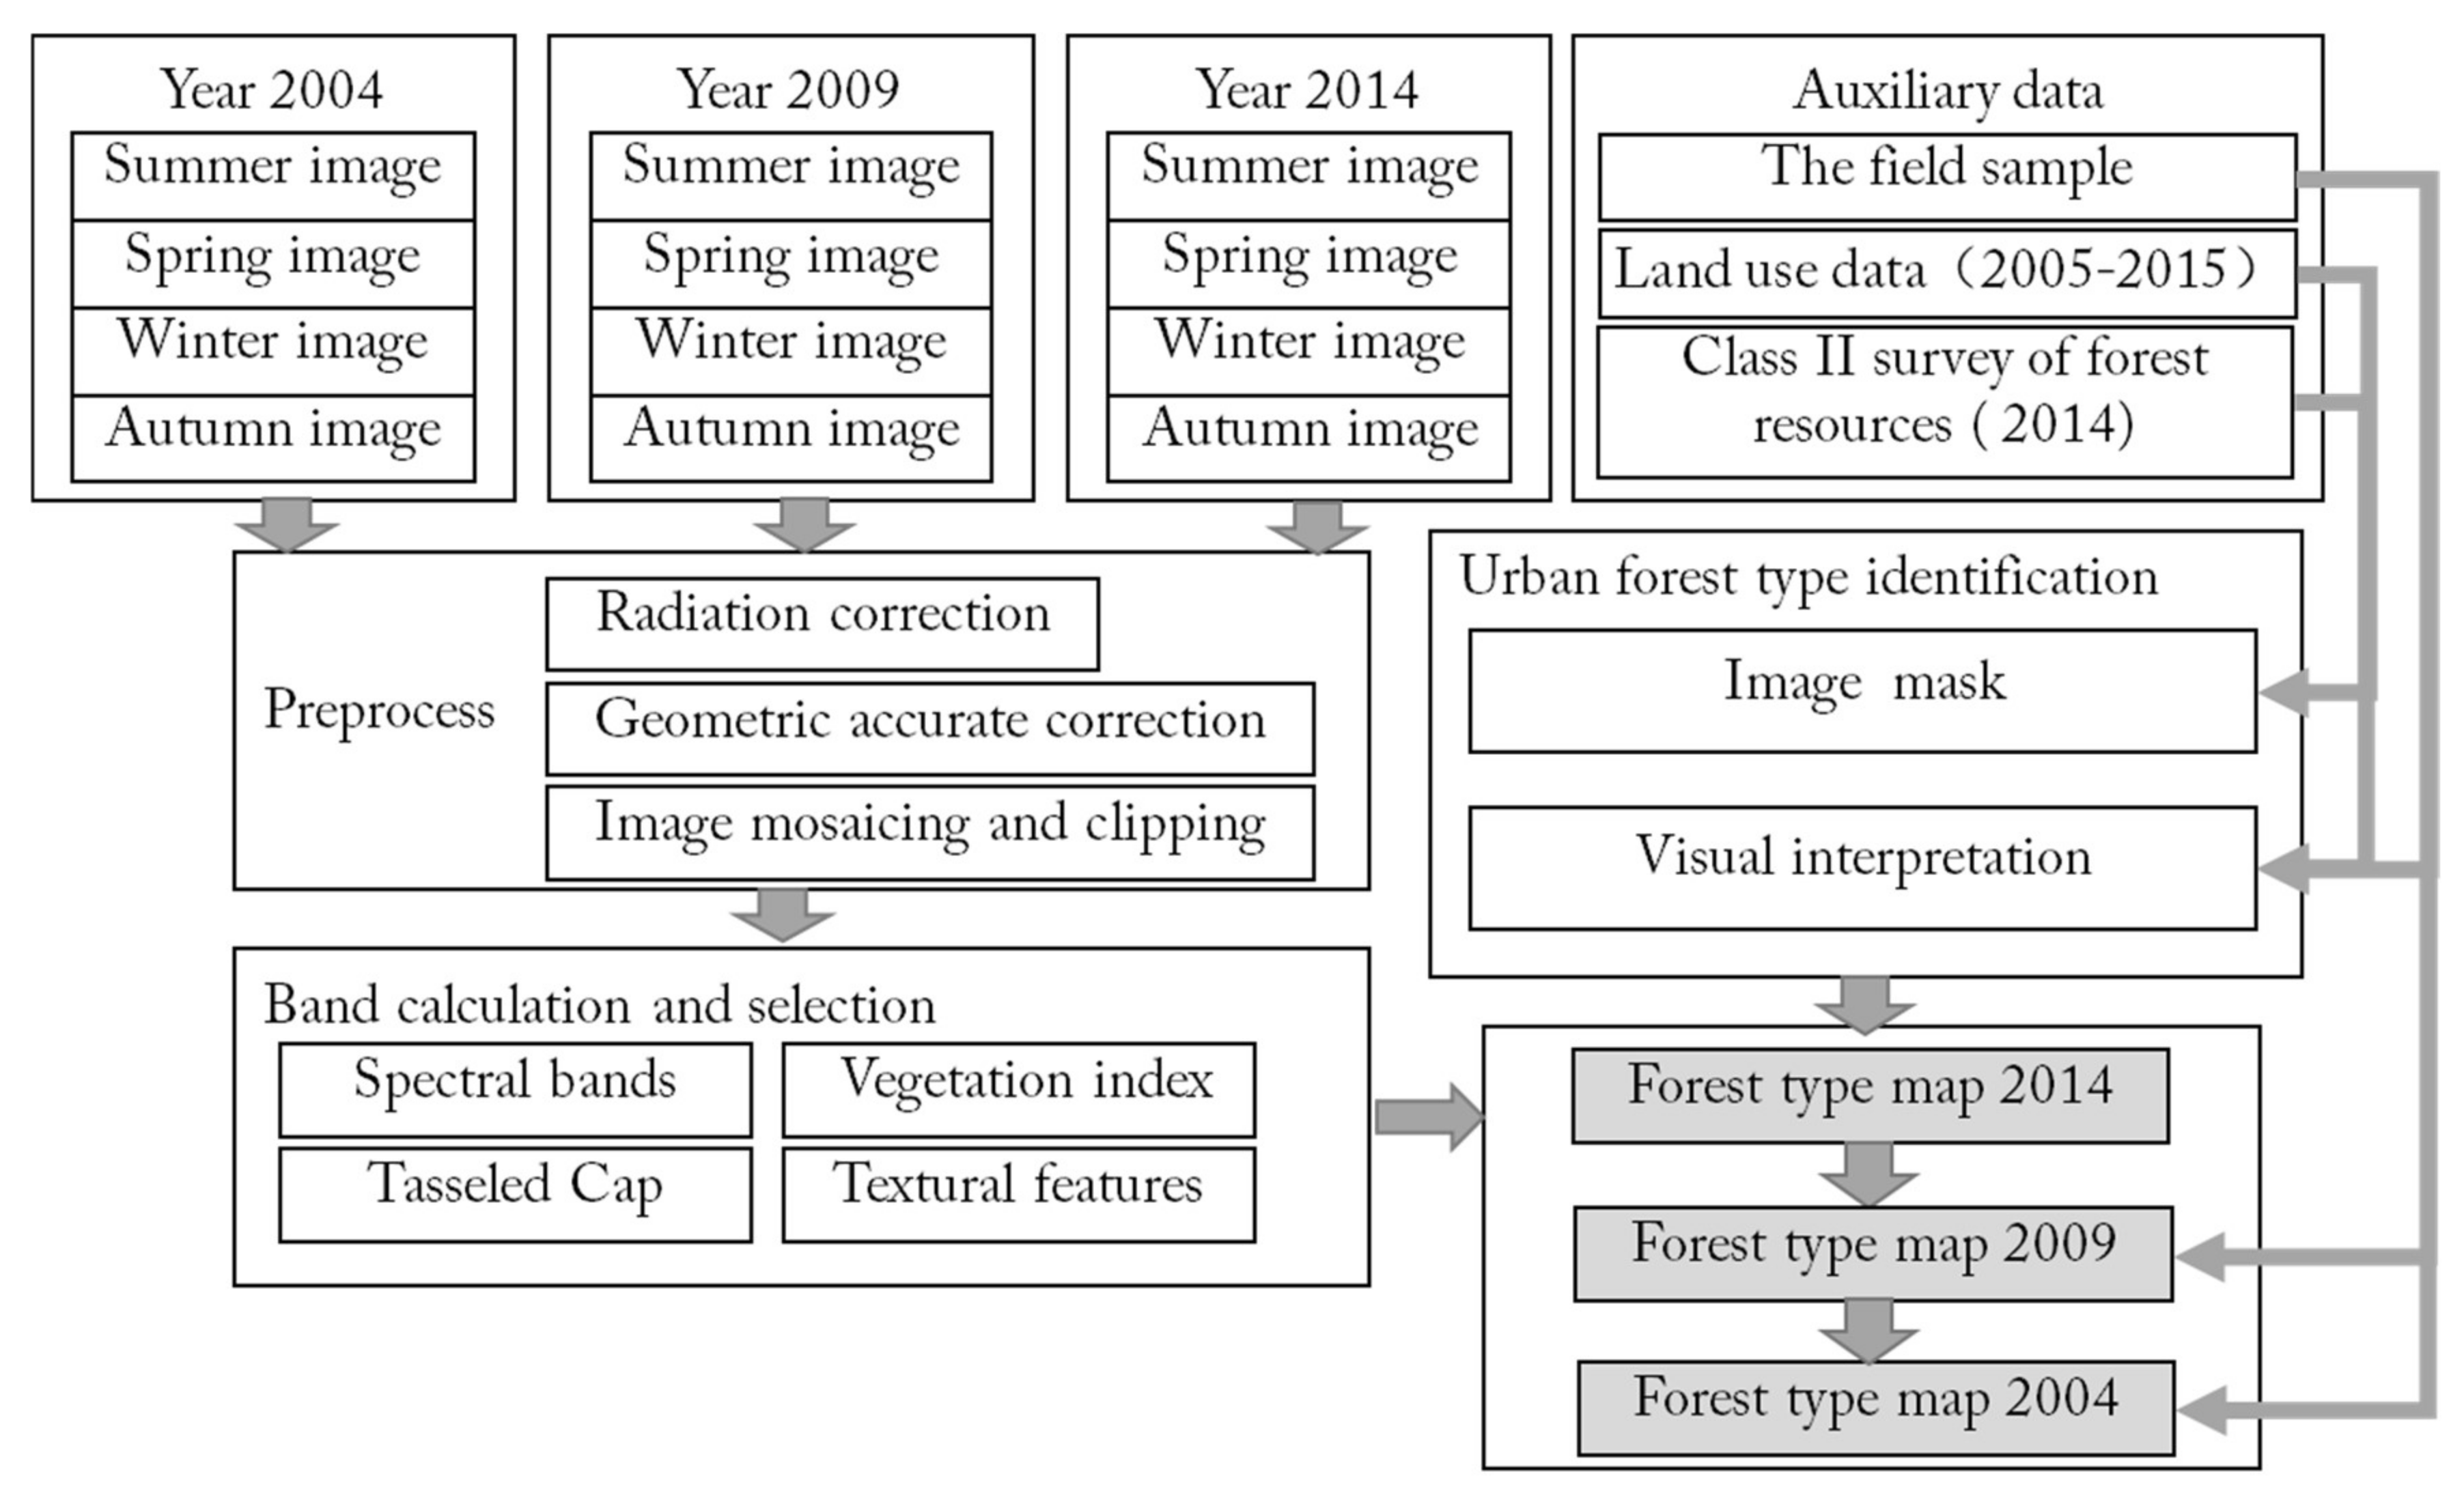
3.1. Urban Forest Landscape Classification Based on Remote Sensing Data

The detailed definition of the landscape pattern type depends not only on the degree of recognition that data and technical analysis can achieve, but also on the level of classification required by the research objectives. The urban forests in Shanghai primarily consists of subtropical evergreen broadleaf forest, Metasequoia, bamboo and economic forests. Forests are characteristically small, blocky and have a zonal distribution, with a large proportion of man-made forest. Based on the forest distribution characteristics of Shanghai and the forest classification characteristics in the land use classification data, as well as differences in the external and internal structure of forest landscapes, the urban forest was divided into the following landscape types: (I) coniferous forest landscapes, in which pure coniferous forest is prominent, with fir and Masson pine being the dominant species (1: needleleaf forests); (II) broadleaf forest landscapes, which are primarily composed of pure broadleaf forest and mixed broadleaf forest (2: broadleaf forests); (III) mixed forest landscapes (3: mixed forests); (IV) fruit forest landscape, which refers to special irrigation forest, including economic fruit forest (4: shrublands); (V) other shrub landscapes, which include special shrubs other than fruit trees (5: shrublands and nursery); and (VI) no forest landscape, which includes residential areas, sites, roads, rivers, and unused areas (6: nonforest).
After preprocessing the geometric correction and radiation correction of all remote sensing images, we used the normalized difference vegetation index (NDVI), tasseled cap transformation (TCA), and texture calculation to extract the characteristic bands to improve the type of forest classification. We obtained the characteristic bands, including TC1 (brightness), TC2 (greenness) and TC3 (wetness), and the NDVI, mean, variance, homogeneity, contrast, dissimilarity, entropy, second, and correlation of all images. The auxiliary data were used to visually interpret and extract the forest resources in Shanghai under the unified coordinate system. Using the Shanghai forest resource distribution map (2014) provided by the Shanghai Forestry Station as the main reference data for forest types, we built a visual interpretation of the 2014 Landsat data. Using the Shanghai 1:100,000 land-use data (2015), we labeled the nonvegetation sites, such as water systems and construction land. The human–computer interaction interpretation was conducted in combination with the characteristic band combination of the study area, and the results of the classification of the forest resources in Shanghai were obtained for 2014. These results were combined with the “Shanghai Green Map” and a Google Earth historical image as auxiliary data sources, allowing us to visually interpret and update the types of forest resources in Shanghai in 2009 and 2004, respectively.

3.2. Spatial Analysis of the Forest Landscape Pattern

A landscape pattern is the comprehensive expression of landscape heterogeneity in space. It is the result of the joint action of human activities and environmental disturbances. Furthermore, landscape patterns reflect human activities and economic development under certain social forms, including the type, number and spatial distribution of landscape units. The complexity of landscape patterns is closely related to the stage of social development. Population growth, major social changes, and changes in national policies will all be reflected in landscape patterns [14]. The complexity of the structure of a forest system contributes to a special hierarchical feature and functional connotation of a forest landscape pattern, especially in terms of reducing human disturbance and optimizing landscape patterns. It is vital to consider the relationship between human activities and the natural environment. An ecological perspective helps to explain and thus understand the characteristics of forest landscape patterns in specific areas. Through the analysis of landscape patterns, the changes in forest resources, fragmentation, connectivity and heterogeneity can be effectively analyzed. Therefore, this approach is widely used in the study of nature reserves, forest evolution, and urban expansion. The use of quantitative research methods into landscape patterns can effectively establish a relationship between landscape structure and functional processes and predict potential landscape changes. Compared with previous studies, only the landscape pattern index method was used to analyze urban landscapes. To estimate the multiscale effect of urban development and landscape changes, our study combined the landscape pattern index and landscape point pattern analysis method to explore the evolution of urban forest landscape patterns in the study area.

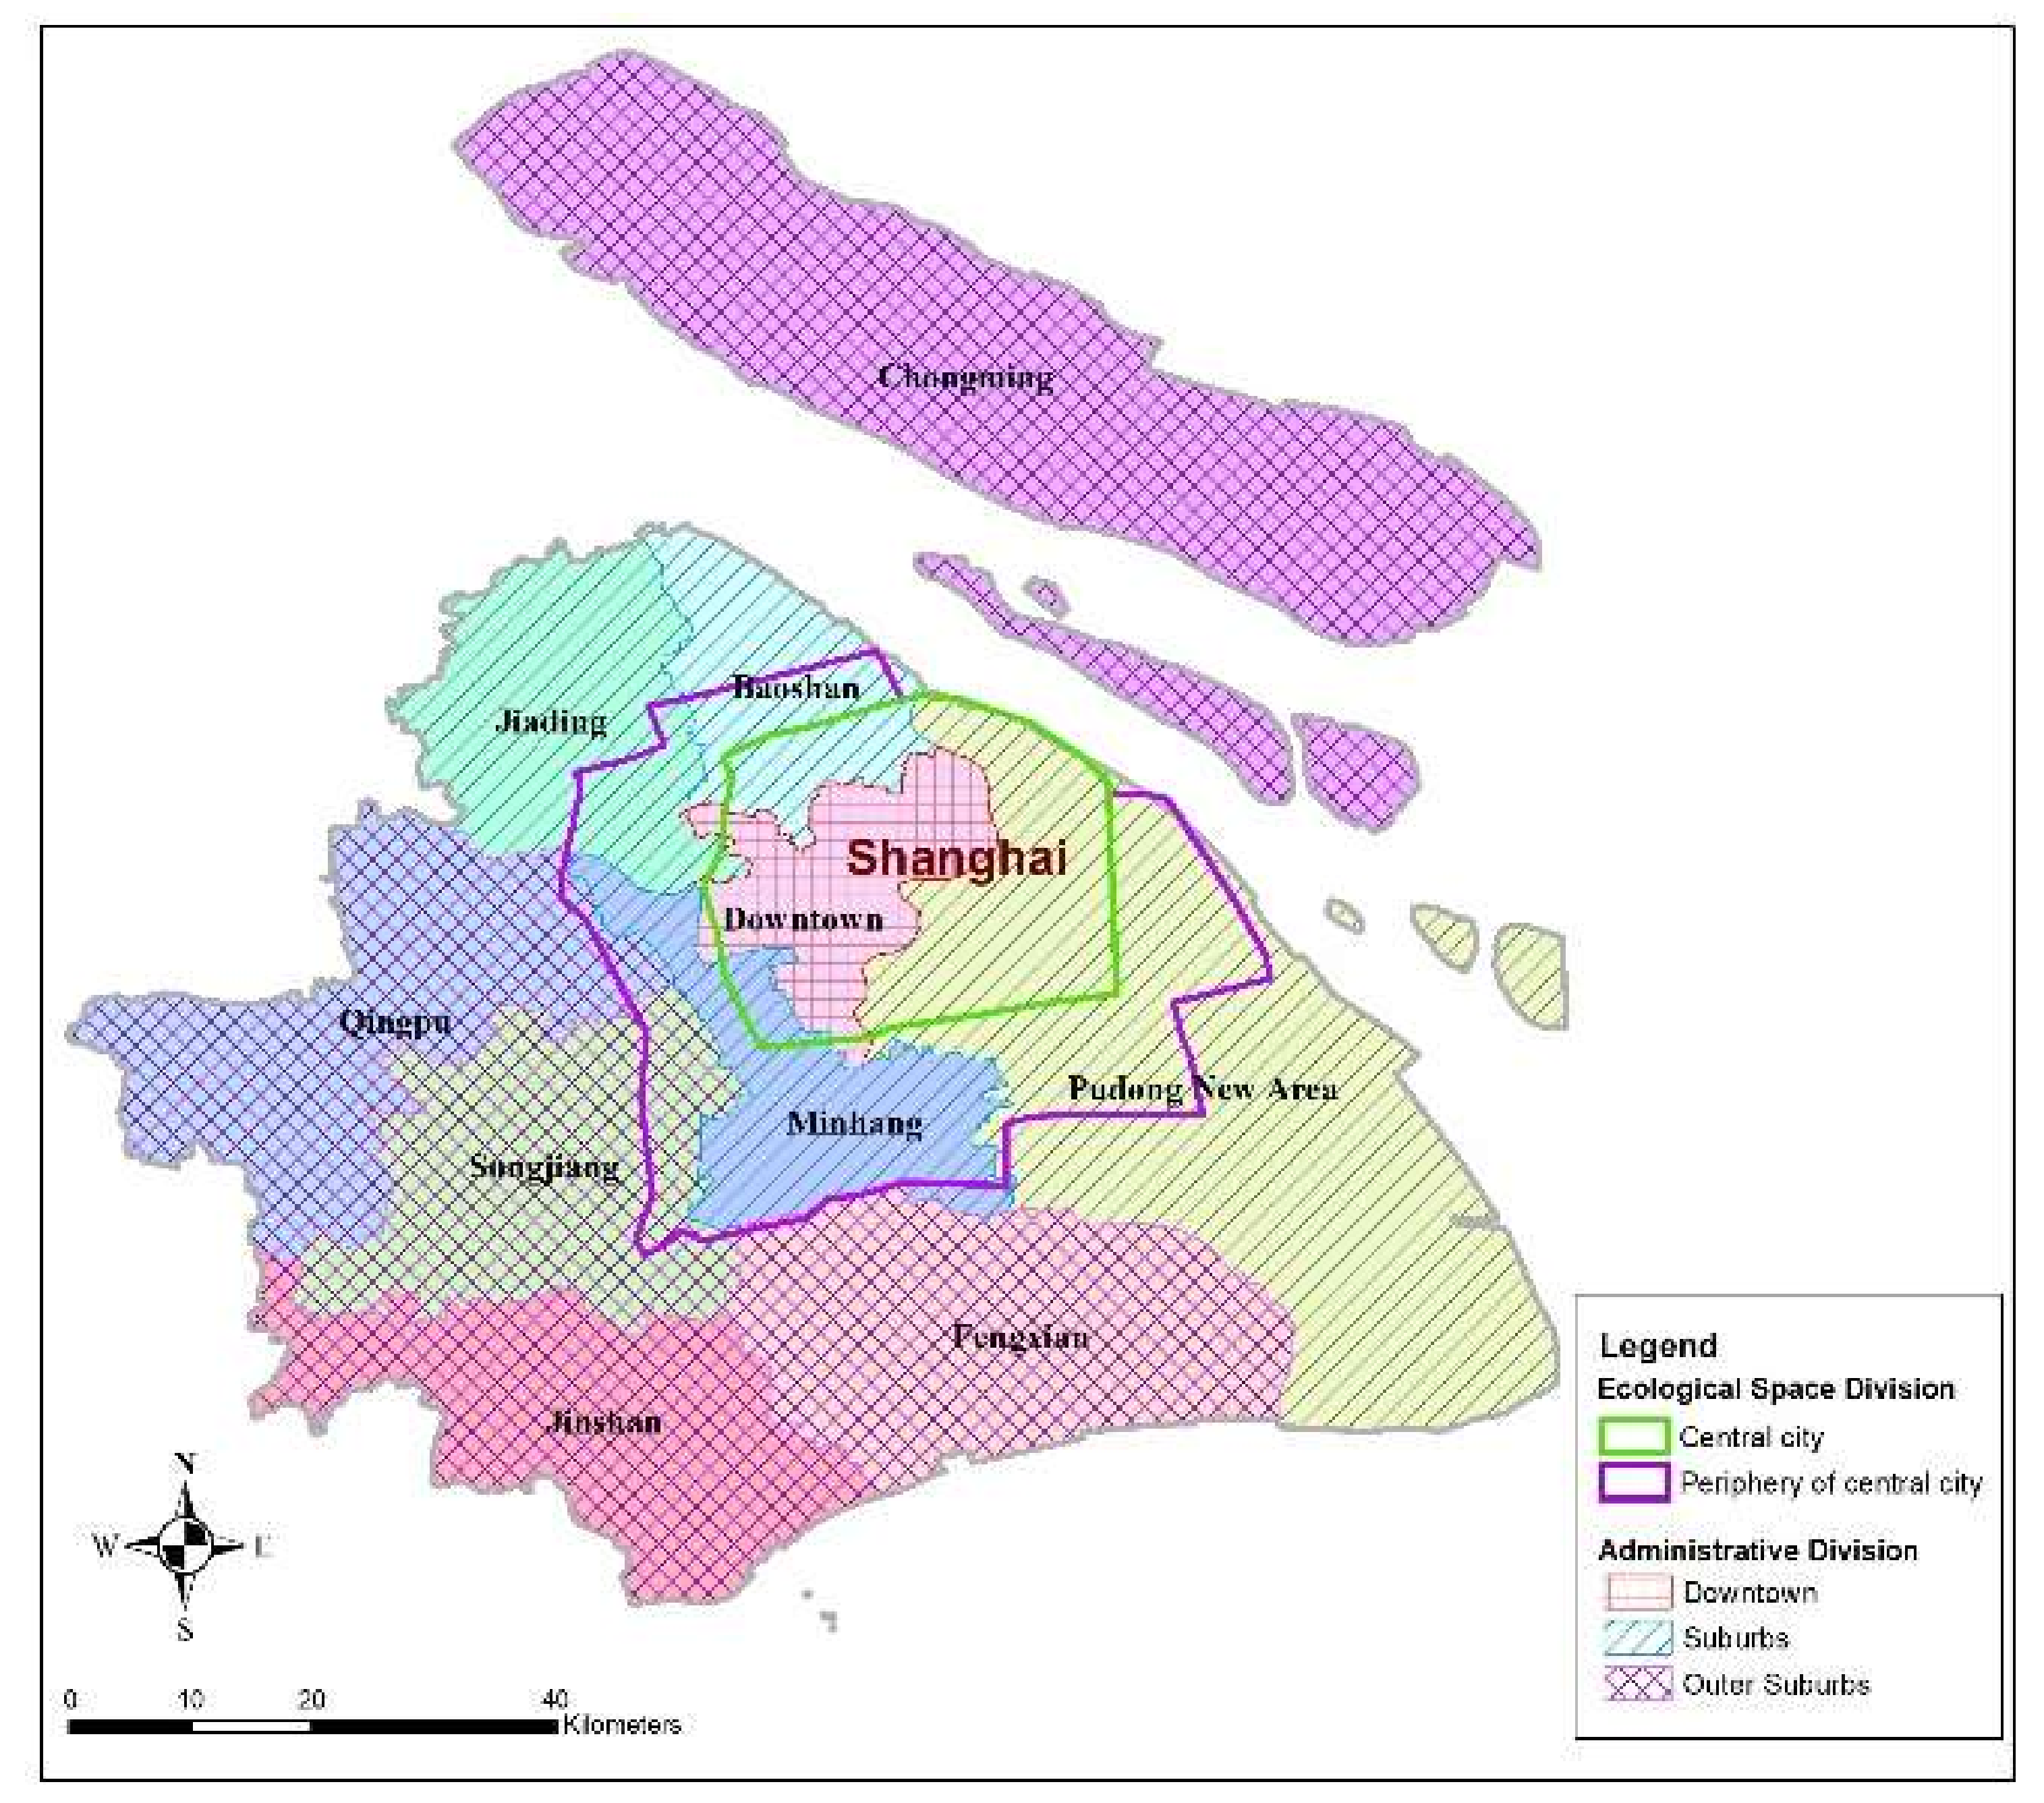
3.2.1. Urban and Rural Gradient Division Method

The suburbs and rural areas account for approximately 85% of Shanghai’s total land area according to the second national land survey. The suburban villages are not only geographically large, but more importantly, they are responsible for indispensable functions. The Shanghai Master Plan (1999–2020) coordinates the overall layout of Shanghai as a principal city and forms a multiaxis, multilevel, multicore urban spatial layout structure. According to the characteristics of urban development and ecological planning in Shanghai, the urban–rural gradient analysis of this study was conducted using two methods. First, based on the basic administrative divisions, the urban and rural gradients can be divided into three areas: downtown (C1), suburbs (S1) and outer suburbs (R1), and each area includes different administrative areas. Second, with reference to the scope of Shanghai’s ecological network planning, and combined with the results of other scholars’ urban–rural gradient divisions [47,48,49], the study area is divided into the central city (U) and the periphery of the central area (S2), and other areas are considered country areas. Figure 2 and Table 1 list the areas covered by the two divisions.

3.2.2. Urban Forest Landscape Analysis Method Based on the Landscape Index.

There are many landscape indicators that describe landscape patterns, and they are divided into three levels (i.e., patch level index, class level index and landscape); each indicator has its own ecological significance. Although there are high correlations between many indicators, the focus of each is different. This study aims to analyze the spatial pattern of the urban forest landscape in Shanghai and measure the impact of humans on the urban forest landscape. Therefore, it is necessary to select indicators that are independent of each other, and that comprehensively reflect the landscape pattern of the study area. Additionally, it is necessary to select area, shape, and aggregation indicators from the class type hierarchy, and select area, shape, clustering, and diversity indicators from the overall landscape level (specific indicators are shown in Table 2).

3.2.3. Urban Forest Landscape Analysis Method Based on Ripley’s K

Ripley’s K function is an important method for point pattern analysis that was originally proposed by Ripley [51]. It can reflect how the spatial agglomeration or spatial diffusion of the quality of the heart changes when the size of the neighborhood changes. This function can also be used to analyze point pattern agglomeration features in multiscale spaces. Developed by Diggle [52] and other scholars, the method overcomes one limitation of the traditional landscape pattern analysis method, i.e., it can only analyze the spatial distribution pattern of a single scale. Furthermore, this method can describe the spatial distribution of the forest landscape under different spatial scales and maximize the use of spatial point information [53,54]. This tool is commonly used in ecology to analyze the spatial patterns of populations. The present study primarily uses Ripley’s K function to analyze the spatial distribution characteristics of urban forests and their various types of forest points in the study area. It is calculated as follows:
K ( d ) = 1 λ 2 A i = 1 N j = 1 N I d ( d i j ) ,
where A is the area of the study area; N is the total number of samples; d is the spatial scale; d i j is the distance between point i and point j; i , j = 1 ,   2 ,   3 N ( i j ) when d i j d ,   I d ( d i j ) = 1 and d i j > d , I d ( d i j ) = 0; and λ is the spatial density when the forest is assumed to be evenly distributed throughout the study area.
For Ripley’s K function to evaluate whether the actual observation point spatial pattern is spatially aggregated, diverged, or randomly distributed, Besag proposed Ripley’s L function [55]. The formula for L(d) is as follows:
L ( d ) = K ( d ) π d .
When L ( d ) > 0, the point features are aggregated. If the value is less than 0, the distribution is represented by diffusion.

4. Results

4.1. Overall Spatial Patterns of Urban Forests in Shanghai from 2004 to 2014

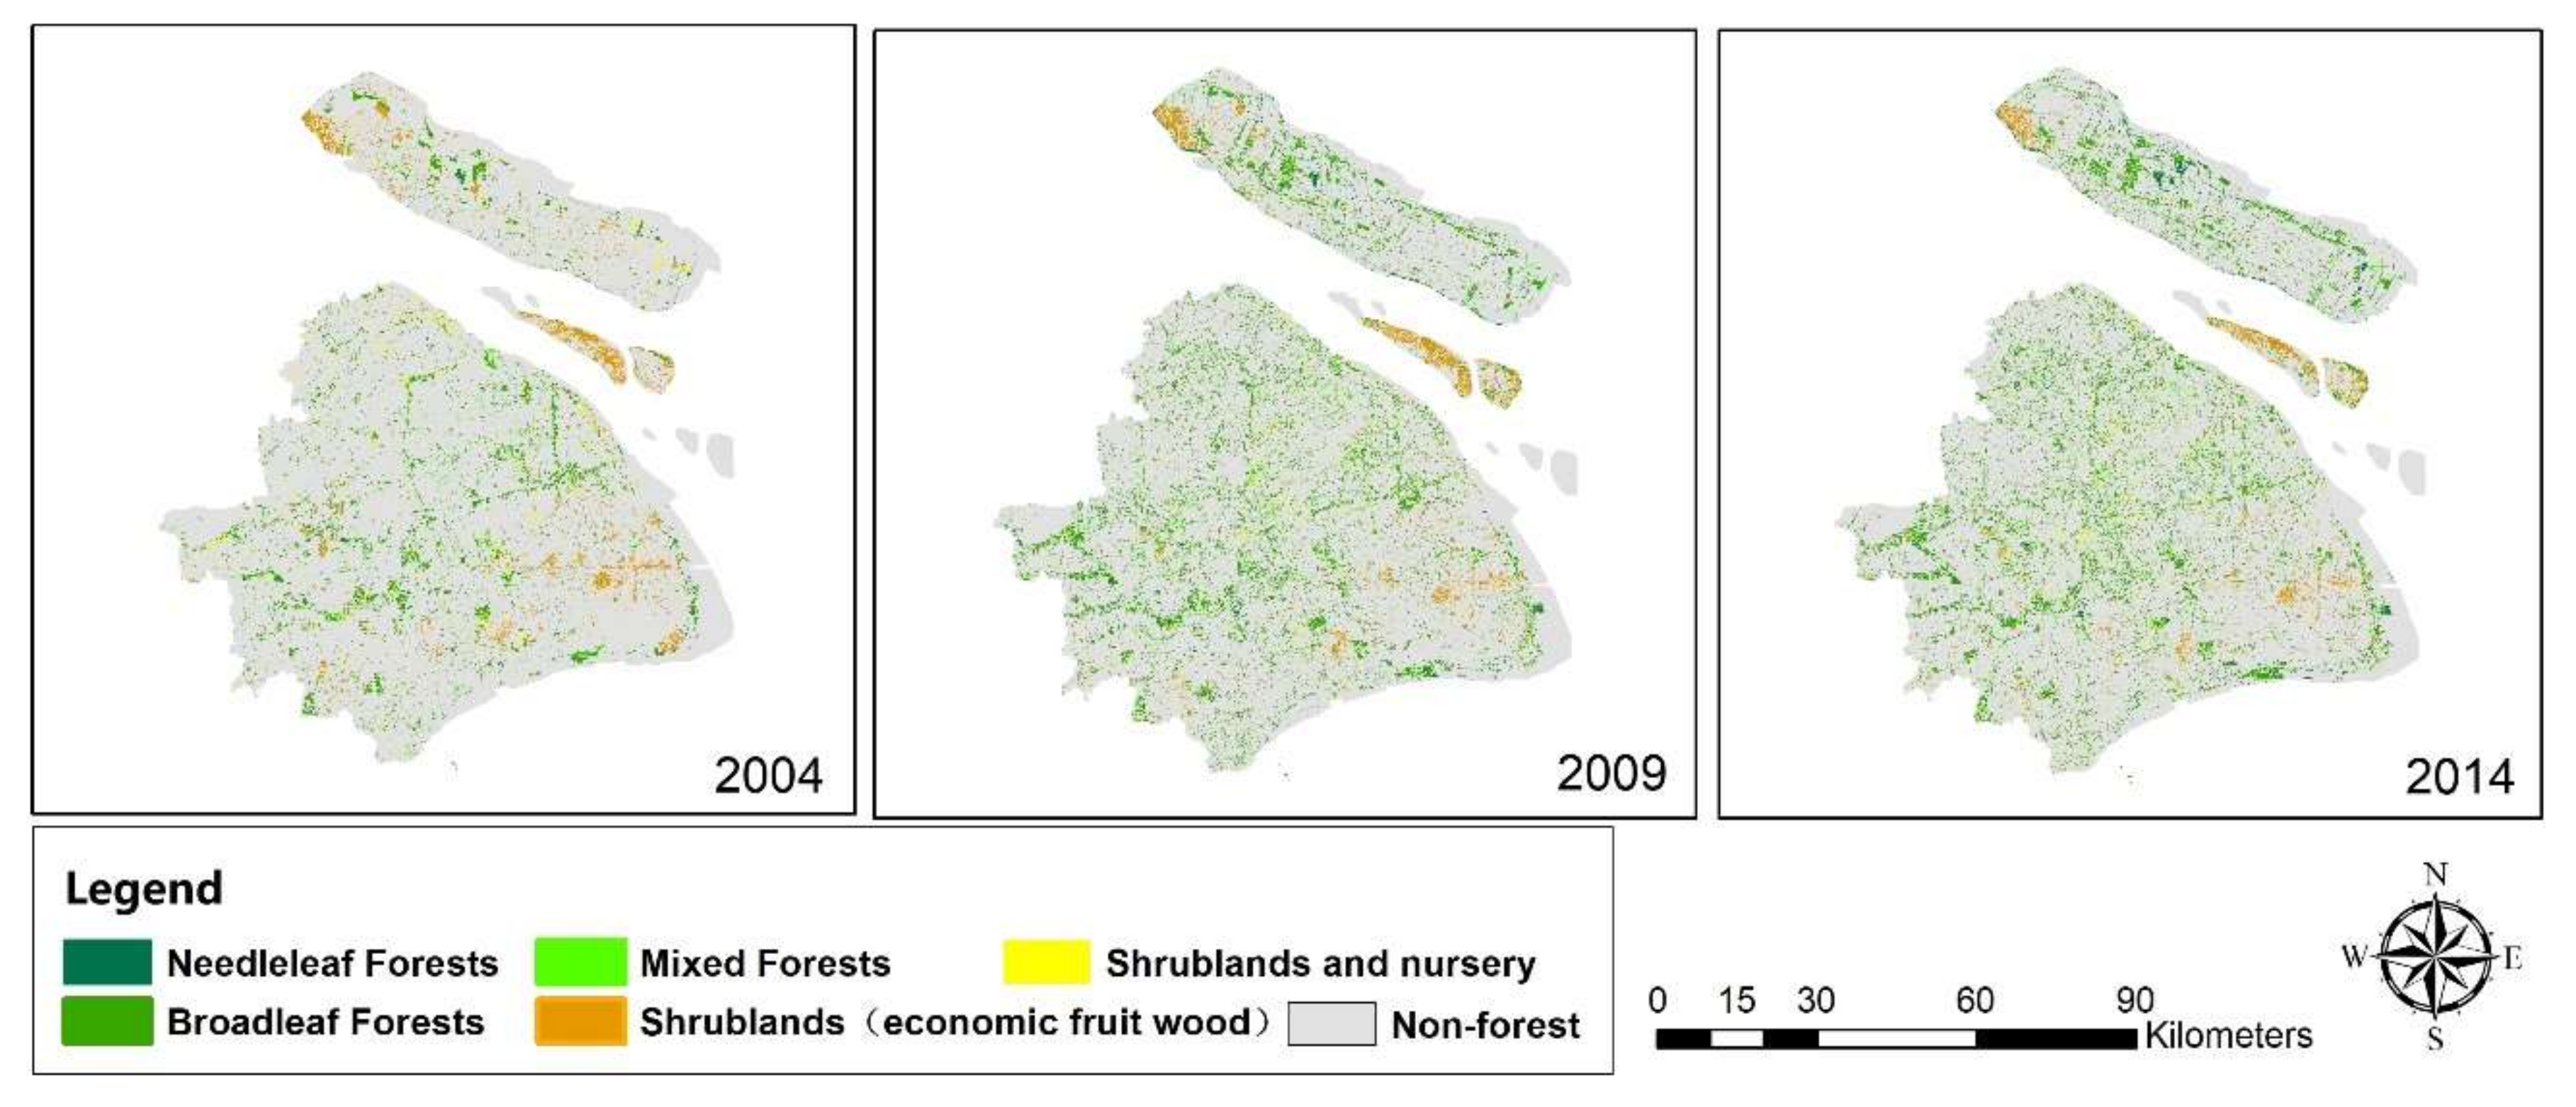
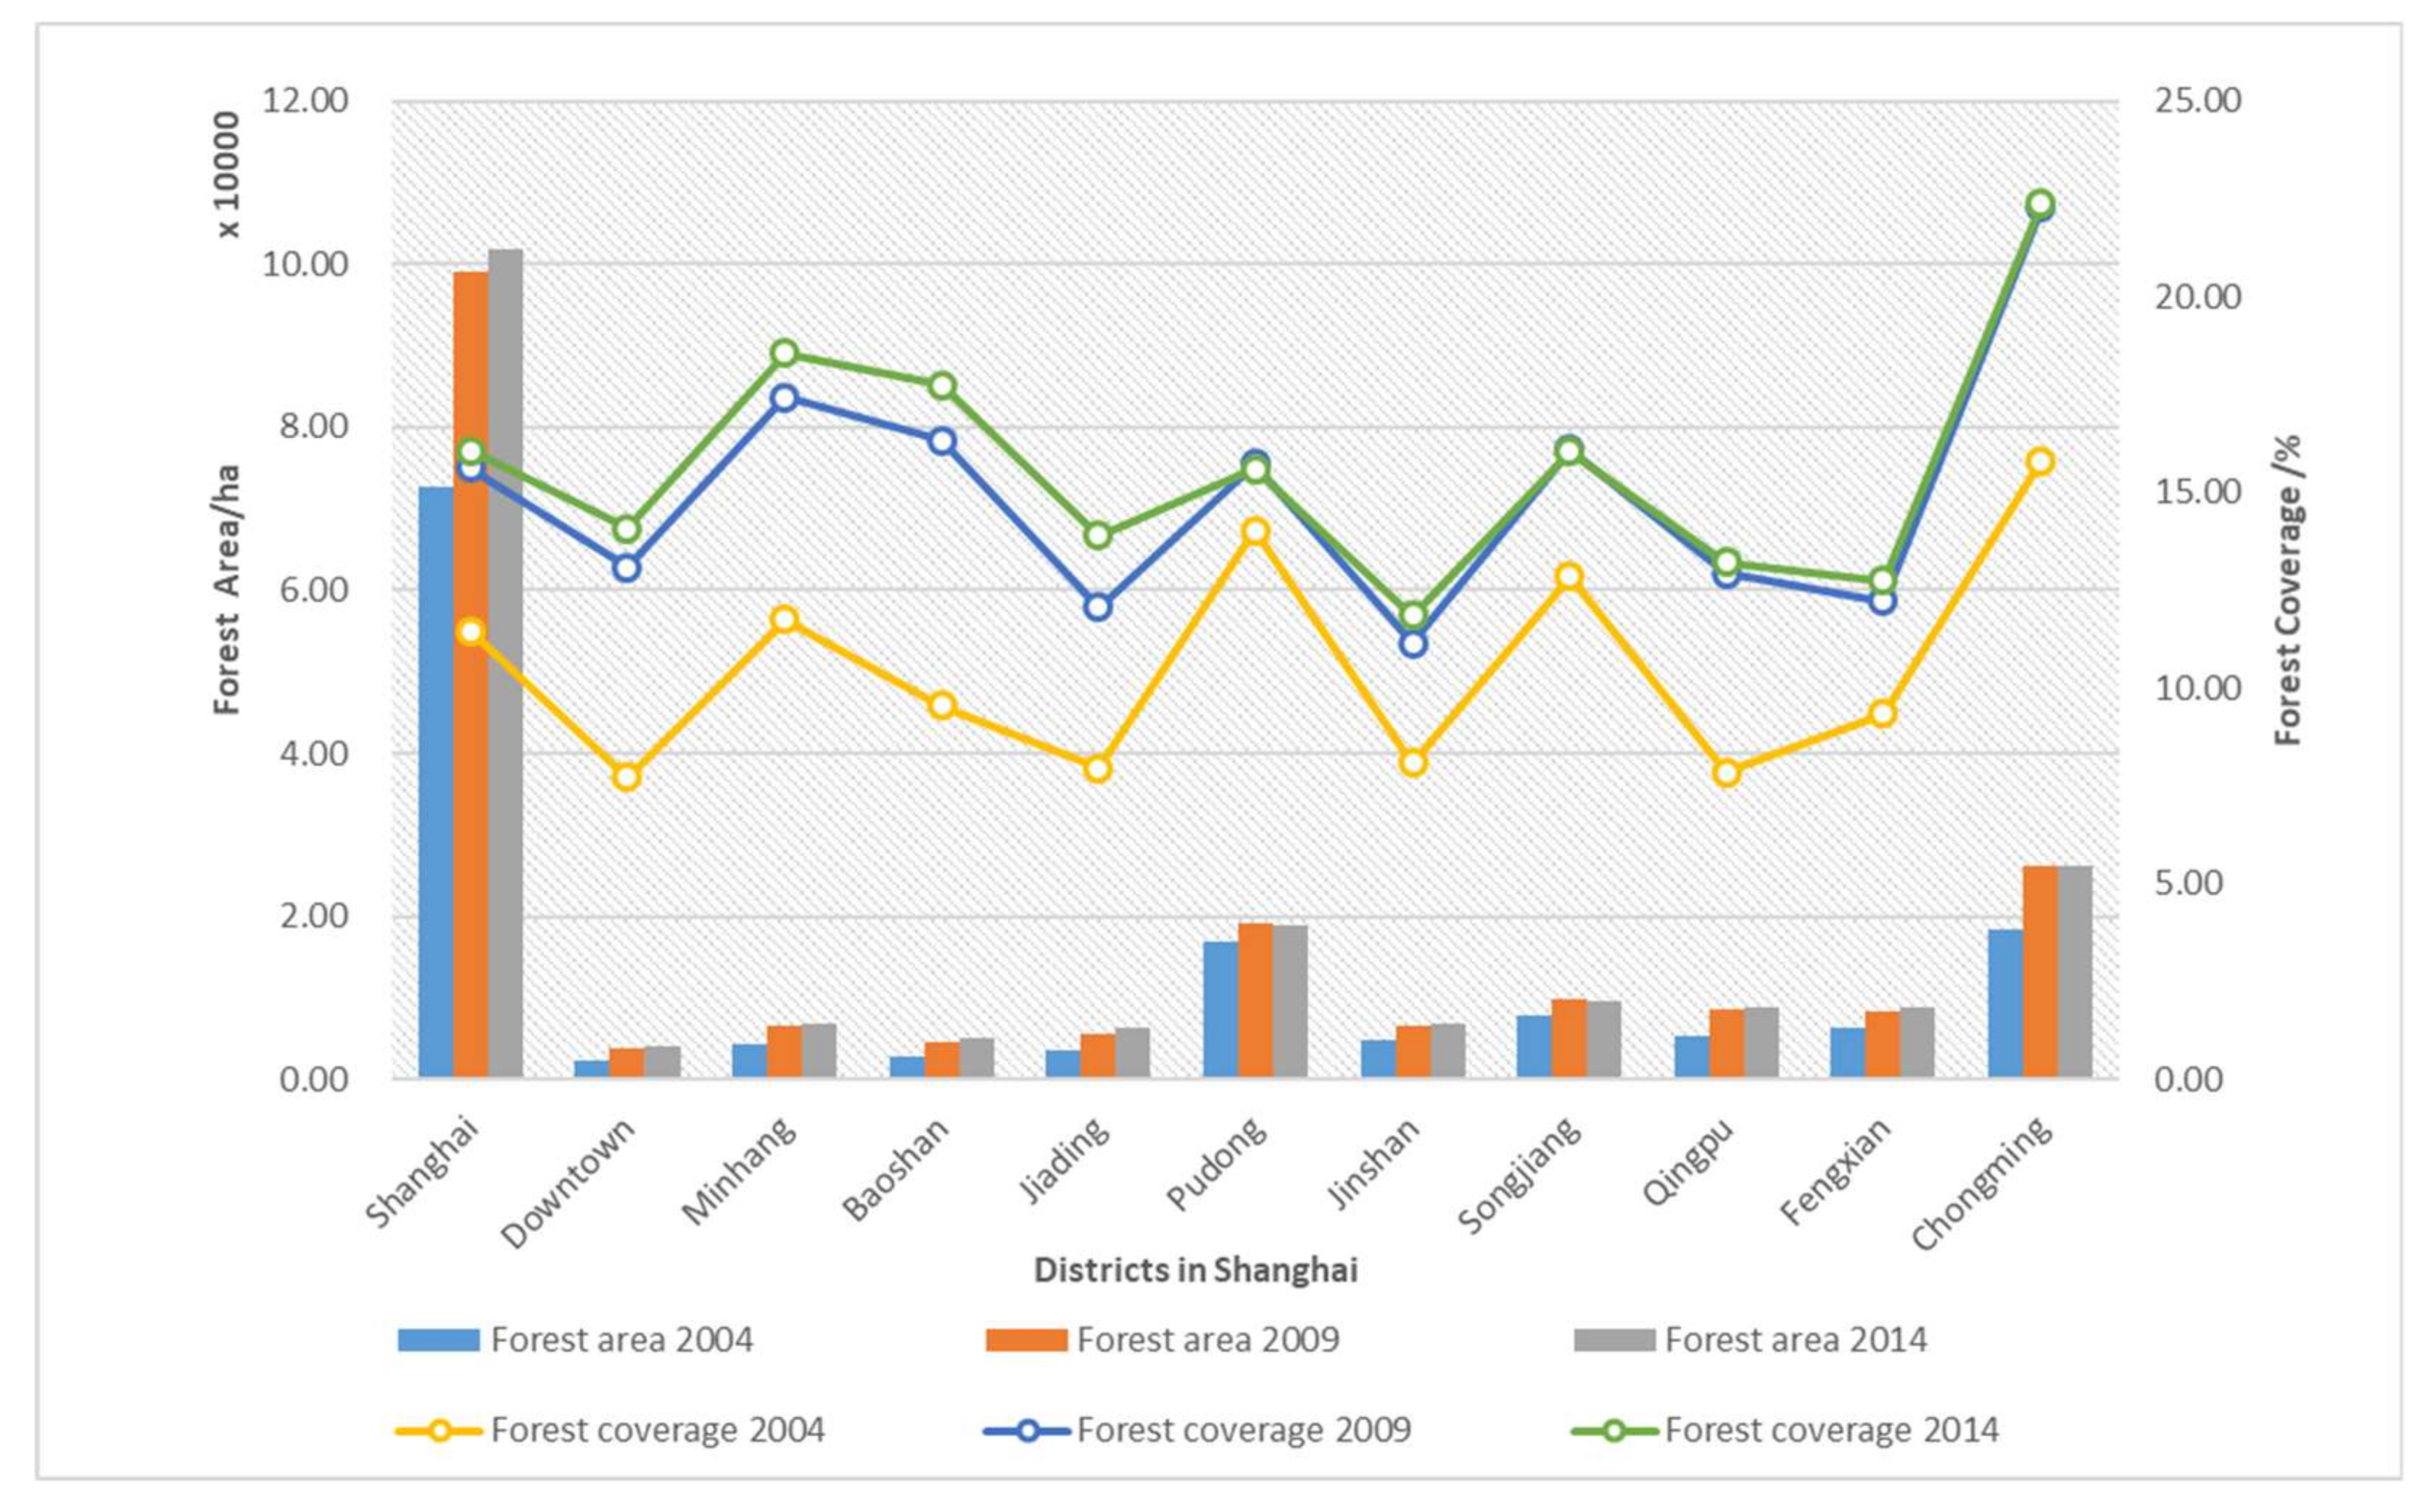
4.1.1. Overall Distribution of Urban Forests in Shanghai

The urban forest landscape maps of Shanghai for 2004, 2009 and 2014 were obtained (the specific technical process is shown in Figure 3). Using the field sample from 2014 and the historical high-resolution aerial data sample verification, the combined visual interpretation accuracy averaged 90%, including 91.06% for the 2014 image, 90.5% for the 2009 image, and 89.95% for the 2004 image. These results were good and met the classification accuracy requirements. The results are shown in Figure 4.
Based on the interpretation of the forest resources in Shanghai combined with the urban land area of the Shanghai Social and Economic Statistical Yearbook (2004–2014), the results are presented in Table 3 and Figure 5. The total forest area (the definition of urban forest here is the broad definition mentioned in the review, including the total amount of urban forest of all interpretation types in this study) in Shanghai increased from 72,455 ha in 2004 to 101,587 ha in 2014, and the forest coverage (the definition of forest coverage rate refers to the ratio of forest area to total land area) increased from 11.43% to 16.02%. The forest coverage rate in the northeastern part of Shanghai is higher than that in the southwestern part. The forest area in the southwest is high, but the coverage rate is relatively low. According to regional statistics, the forest area in the downtown area is increasing. The forest in other areas increased significantly between 2004 and 2009, but the growth rate from 2009 to 2014 was slow. The Pudong New Area has a forest area of 18,891 ha, followed by Minhang District and Jiading District. Chongming District, Songjiang District and Qingpu District have large forest areas. In 2014, the forest coverage rate of Chongming District reached 22.38%, a similar forest coverage rate increase to that in 2009. The forest coverage rate in Minhang District was 18.56%, which was significantly higher than that in 2004. In 2004–2009, the forest coverage rates increased significantly, and a growth trend from 2009 to 2014 was not evident.

4.1.2. Spatial Analysis of Urban Forest Landscape Patterns in Shanghai

The landscape pattern index provided valuable information about urban forest changes, specifically fragmentation, connectivity and heterogeneity. Based on the FRAGSTATS v4.2 software (University of Massachusetts Amherst, MA, USA) used for the spatial analysis and calculation, the results for 16 indicators of class type and landscape scale were obtained for Shanghai from 2004 to 2014. The overall landscape scale calculation results are shown in Table 4 and Figure 6 at the landscape level, and Figure 7 at the class level.
At the landscape level, the landscape structure of the area metrics (NP and TA) was shown to increase significantly from 2004 to 2009, and the growth rate was small from 2009 to 2014. However, the metrics (LPI and AREA_MN) exhibited gradual declining trends. The shape metrics (PAFRAC) exhibited an increasing trend each year, with the shapes and traits of patches becoming more complex. The metrics (CONTIG_MN) gradually decreased, indicating that the spatial connectedness of the landscape was decreasing in the study area. In terms of the aggregation indicators, compared with 2004, the patch density increased significantly. The aggregation metrics (IJI and COHESION) indicated that other types of landscapes around the study area decreased, and the landscape patches in the study area also decreased in terms of segmentation continuity. The diversity indicators SIEI and SHDI both exhibited a decreasing trend from 2004 to 2014, reflecting that with increasing human activity, landscape types tend to be simpler. This result shows that human activity has obvious effects on the study area, large patches gradually diminished, and urban forest landscape fragmentation in the area intensified.
At the class level, the landscape structure of the area metrics (CA and PLAND) reveal that broadleaf forests accounted for the majority of forest types in Shanghai, followed by shrublands and needleleaf forests, and the area of broadleaf forests increased from 2004 to 2014; in contrast, the areas of the other forest types decreased. The metrics (AREA_MN) reveal that mixed forests, shrublands and broadleaf forests had larger patches than the other forest types from 2004 to 2014. After 2009, the average patch area of shrublands (fruit tree economic forests), which are predominantly distributed outside the main urban area, was much larger than that of the other forest types. The shape metrics (PARFAC) reveal that needleleaf forests, mixed forests and broadleaf forests increased significantly from 2004 to 2009. The results also reveal that the degree of fragmentation of the other forest types in Shanghai increased, and the intensity of human activities increased, which had a significant effect on other types of disturbances. The aggregation metrics (AI) and the other indicators reveal that all forest types had a decreasing trend from 2004 and 2009. This result implies that the degree of aggregation of urban forest types in Shanghai is generally declining, and the patch distribution is fragmented.

4.2. Analysis of the Evolution of Multiscale Features of the Urban Forest Landscape in Shanghai

The landscape pattern of urban forest not only reflects the influence of urbanization on urban forests, but also determines its function in urban ecosystem services. Based on an analysis of the overall urban forest landscape pattern, the present study of an urban forest landscape structure at different scales and in different urbanized regions was performed, which is conducive to achieving a comprehensive understanding of the forest characteristics of a city. The suburbs and outer suburbs play an important role in improving the environmental quality of the central city, and although the forest area in these regions is generally high, it is still insufficient relative to the potential land area. Here, we analyze the landscape structure and multiscale aggregation characteristics of an urban forest in different regions to better analyze the landscape level and type level of an urban forest in Shanghai at different scales.

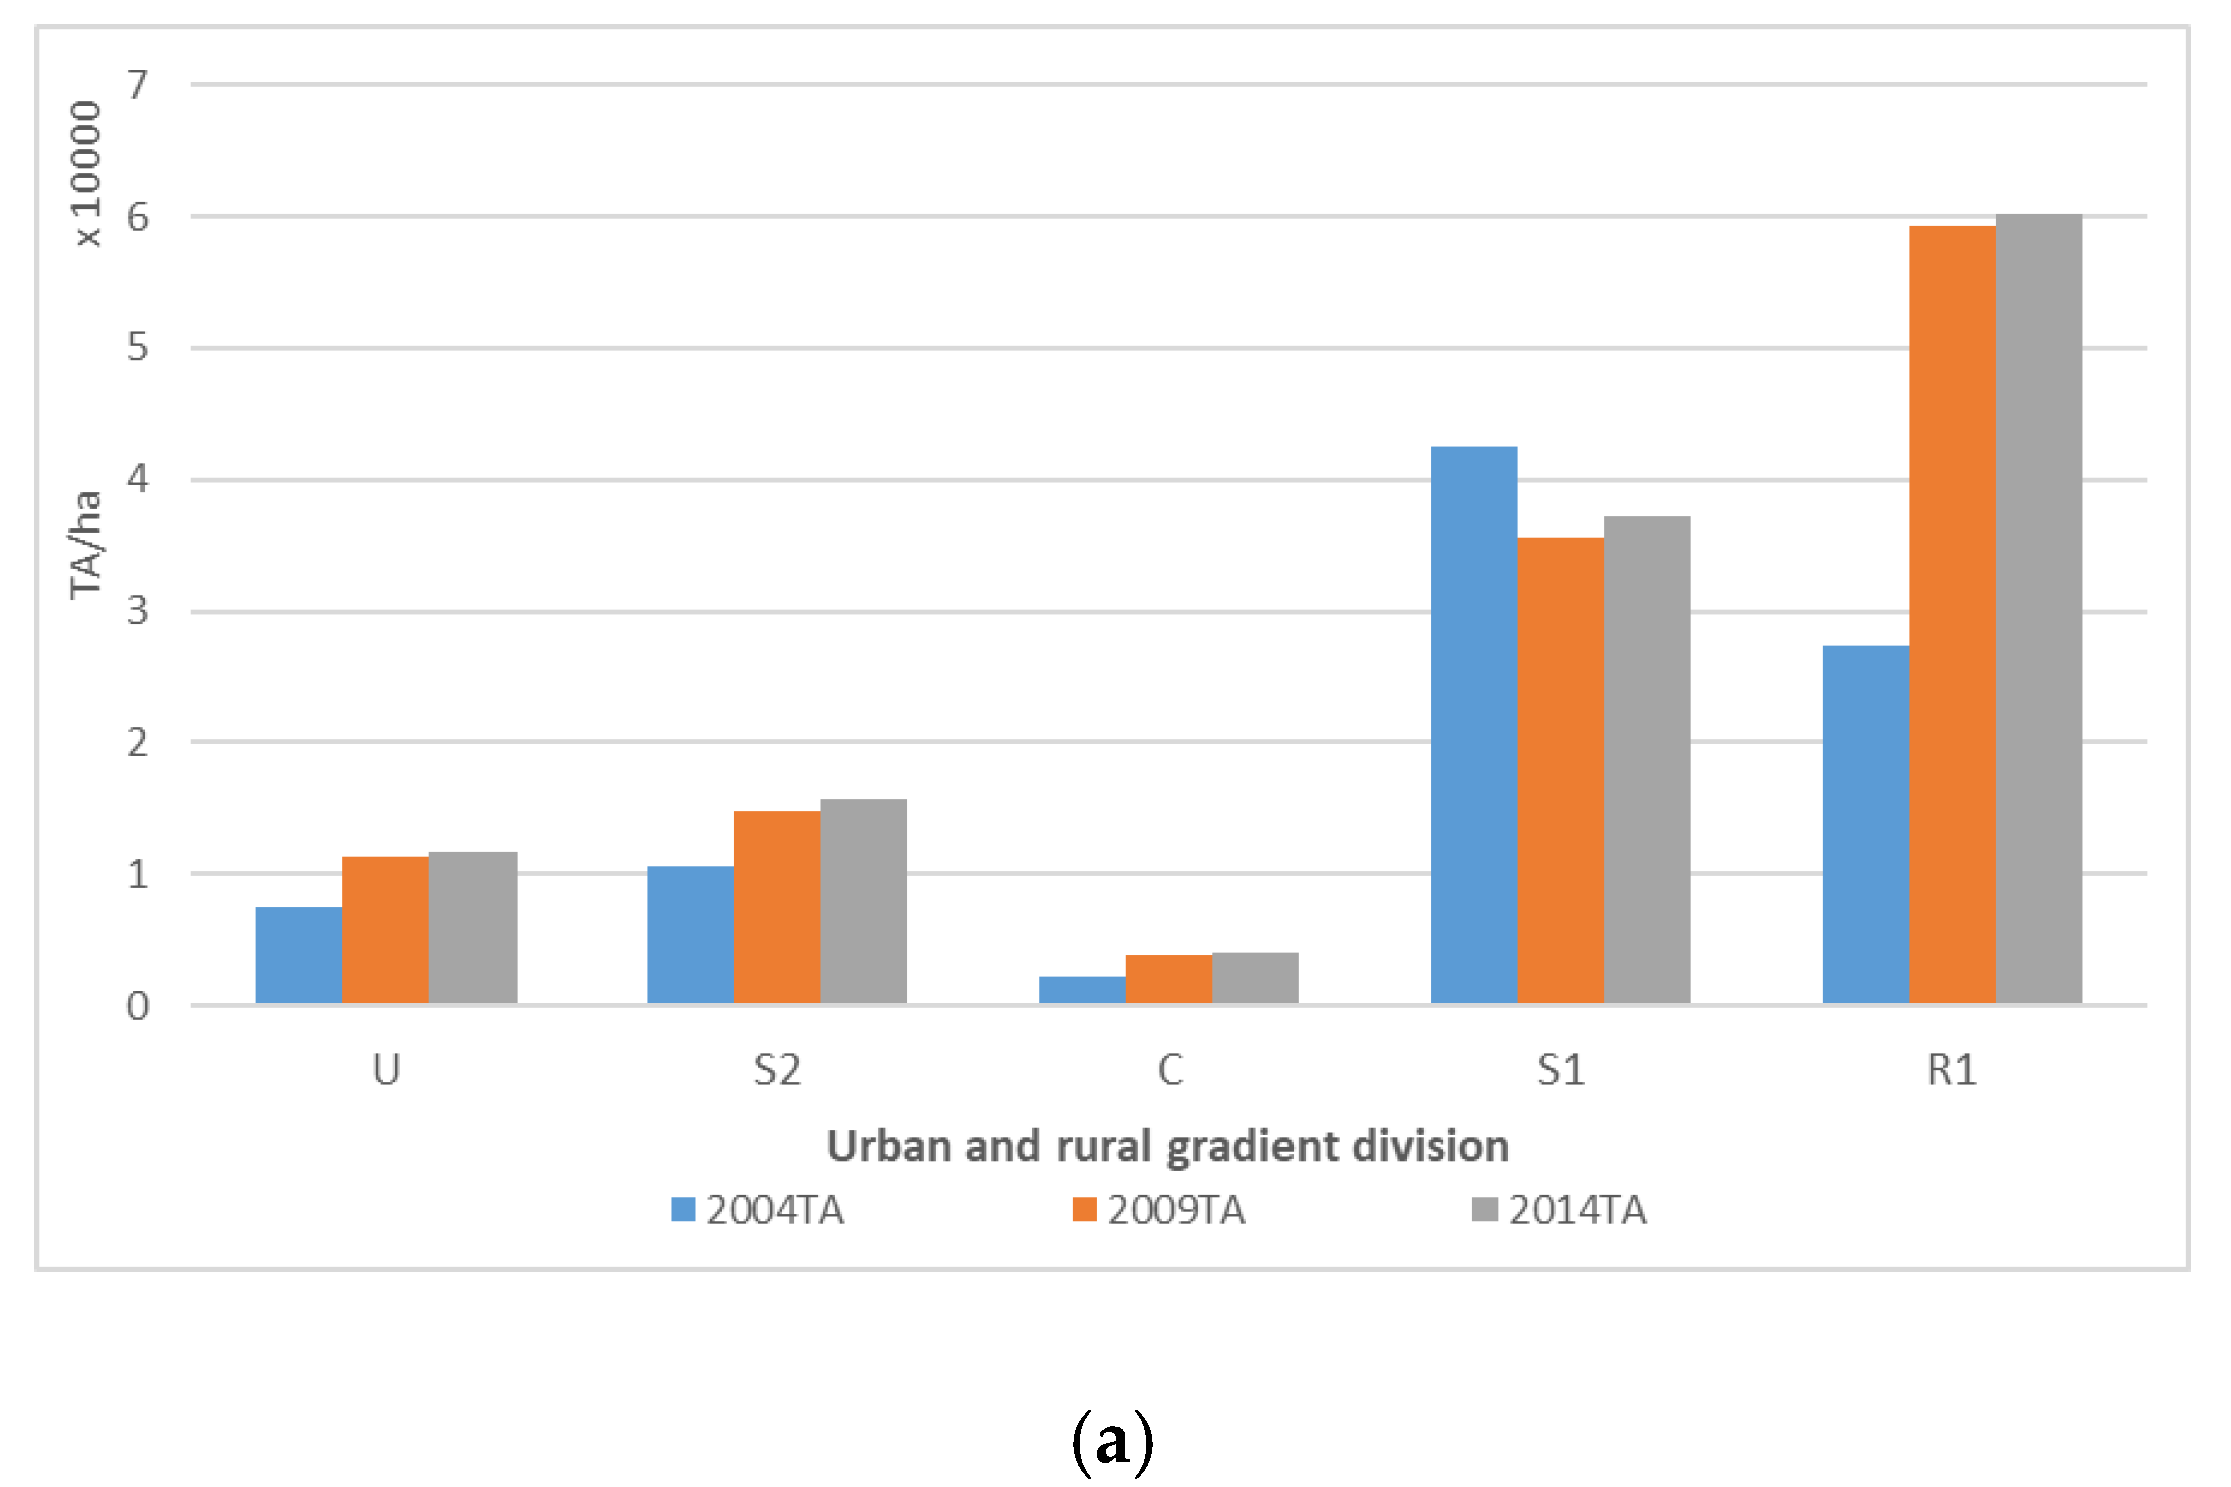
4.2.1. Spatial Pattern of the Urban Forest Landscape with an Urban and Rural Division

Based on the interpretation of the data on forest resources in Shanghai, we used urban and rural gradient division data to separately extract the urban forest interpretation results, and we augmented the landscapes in the different zones with the support of ARCGIS10.0 software (ESRI, Redlands, CA, USA) and FRAGSTATS v4.2 software (University of Massachusetts Amherst, MA, USA). We analyzed the landscape patterns and their changes using ecological space division (U, S2) and administrative division (C, S1 and R1).

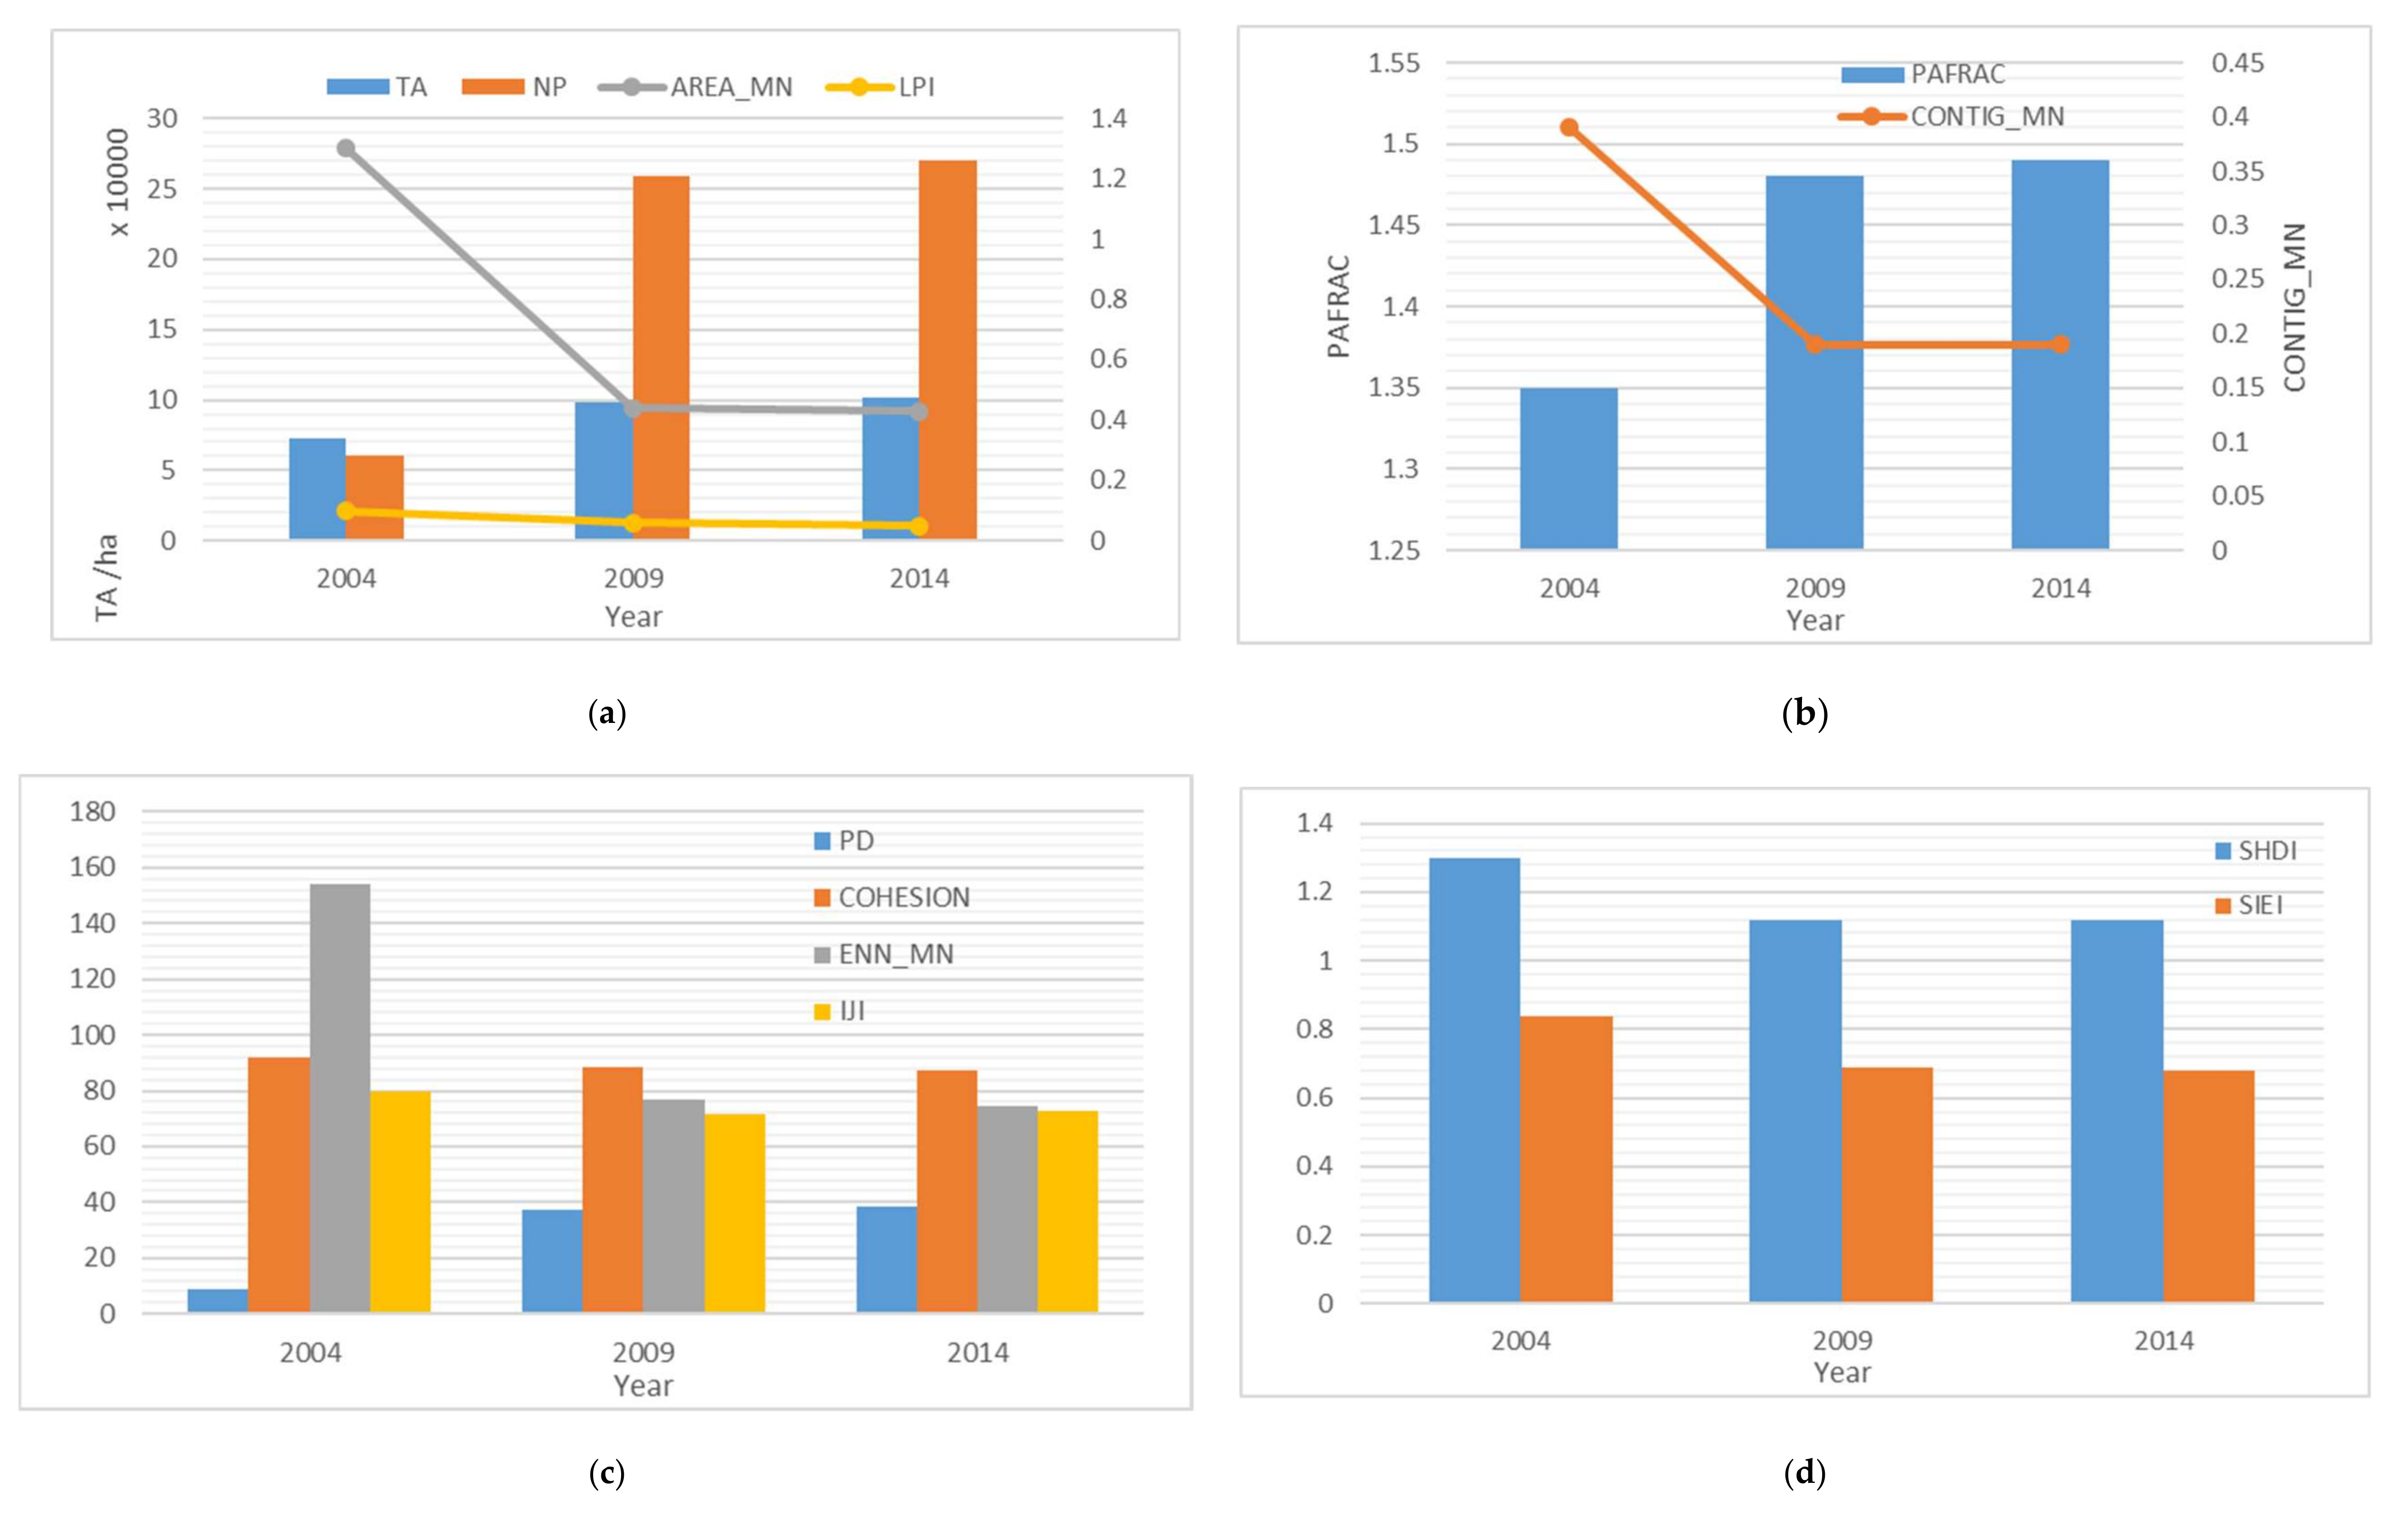
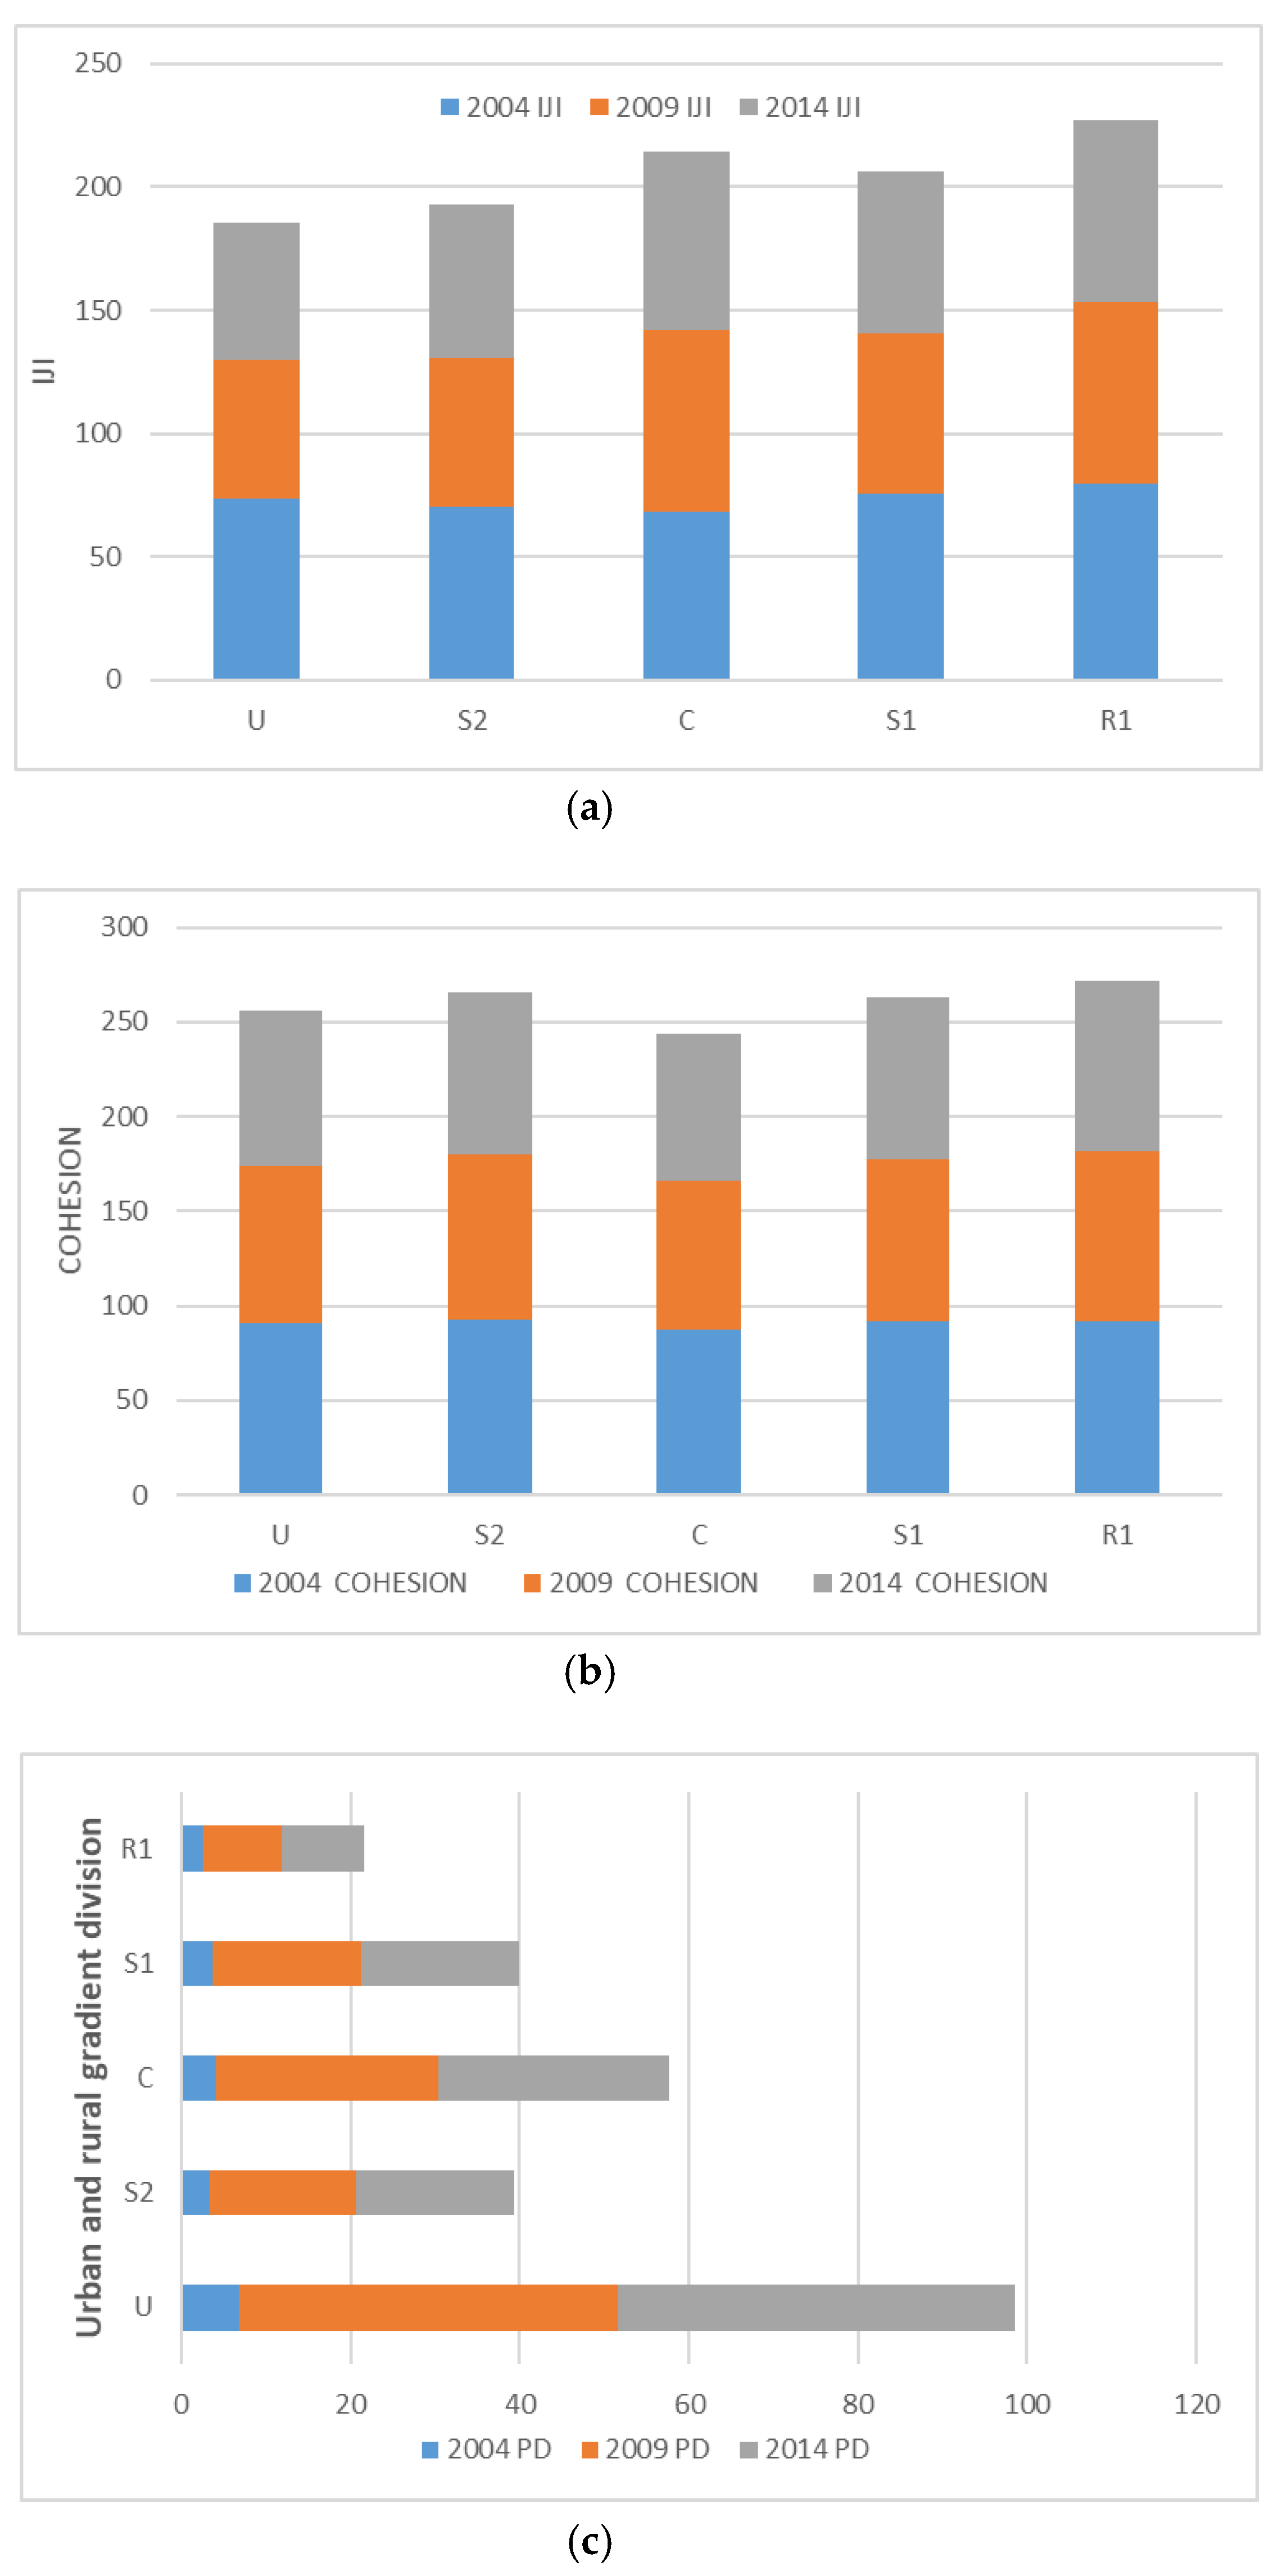
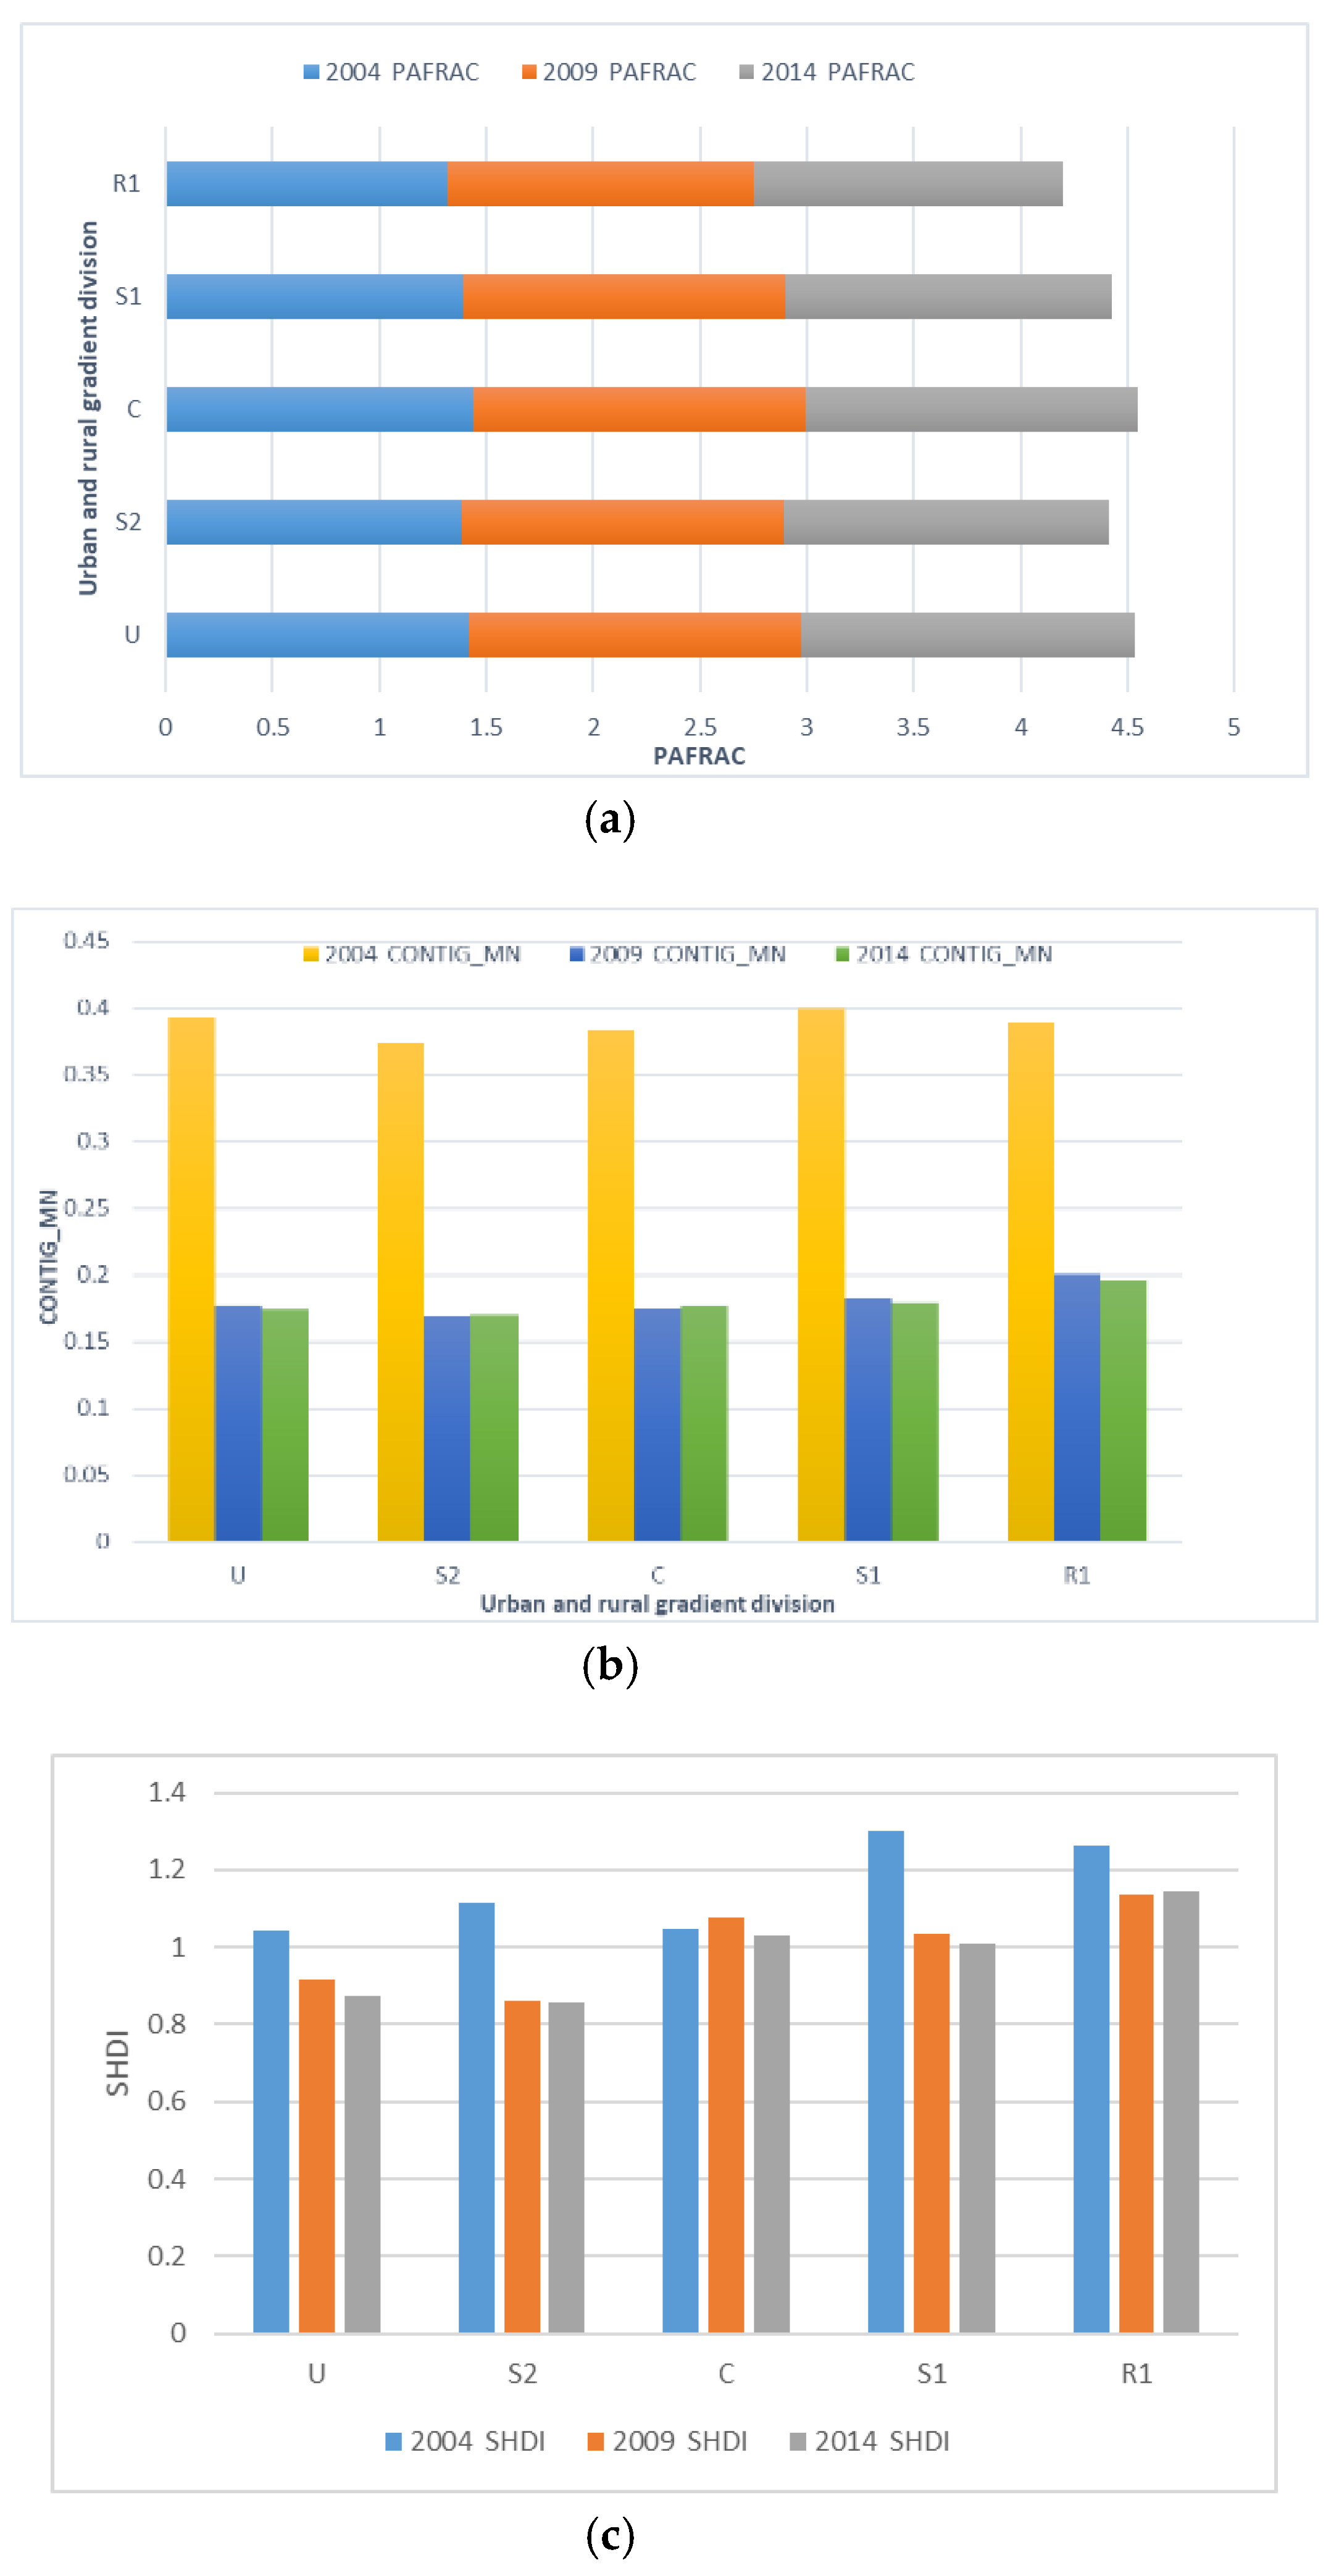
Spatial Pattern of the Urban Forest at the Landscape Level

Comparing these areas, the landscape structure of the area metrics (CA, NP, and AREA_MN) were slightly different in each region (Figure 8). The total urban forest area in C and R1 increased by approximately 50% from 2004 to 2009. The total urban forest area in U, S2 increased by about 16%. Compared with 2009, the total urban forest area in all districts typically increased, except for the S1 region. The S1 region is an administrative partition area near the center of the city, and contains both the urban area and the transition area between the urban and rural areas. The cause of the forest area reduction may be that the urbanization and forest construction layout is not reasonable. The growth rate of patch numbers in each region was marked by multiple increases from 2004 to 2009, and the growth rate of each region was 3–5% from 2009 to 2014. The average urban forest area in each region decreased approximately 0.2–0.4 from 2004 to 2009. We can see that the forest area had slow growth and the number of patches increased dramatically, while the average patch area was greatly reduced. Close to the central city, the U and C regions had a small forest area, and the suburbs of the R1 and S1 regions had a high forest area. However, the average patch area was not bigger than within the C and U regions from 2009 to 2014. Therefore, the construction of suburban forests needs to pay more attention to the construction of large-scale patches of forest and to improving the quality and level of forests. This is the fundamental way to improve the ecological benefits of forests.
The aggregation metrics (IJI) exhibited a trend of C < S2 < U < R1 < S1 (Figure 9), indicating that the overall forest landscape type in Shanghai was more complex at the periphery of the city. However, the U area had more complex landscape types than the S2 area in 2004, and the forest landscape type was also more complex in the C region than it was in the R1 region, which may be related to landscape-oriented afforestation. In the central urban area and other concentrated areas, landscape afforestation is the main objective. Therefore, the purpose of landscape afforestation requires a more diverse selection of tree species. However, afforestation in the suburbs is primarily based on pure forest or a block-mixed mode; that is, one tree is planted in a plot, and the type is relatively simple. The aggregation metrics (COHESION) index exhibited a trend of C < U < R1 < S1 < S2 from 2004 to 2009, indicating that the forest patches in the main urban area were segmented and more disconnected; thus, the natural connectivity gradually decreased in the 10-year period. The aggregation metrics (PD) show that the patch density of U and C increased significantly. The S2 area exhibited a significant increase compared to the S1 area in 2009. The forest landscape had a high degree of fragmentation in U and C, whereas the S2 area was closer to the urban residential area, where human disturbance was significantly broken.
The shape metrics (PAFRAC and CONTIG_MN) reveal the difference in the degree of human interference in the different regions. The metrics of U, C and S1 were slightly larger than that in S2 (Figure 10), indicating that the closer they get to the downtown area, the greater the forest patch fragmentation. The difference in aggregation between regions was small in the same year. The diversity metrics exhibited a trend of U < C < S2 < R1 < S1 in 2004 and S2 < U < C < S1 < R1 in 2009 and 2014, which implies that the difference in the proportion of the landscape types of U and C was lower than that of the other regions. At the same time, it can be seen that the forest landscape diversity in the S2 region decreased, and the diversity of the R1 region increased after 2009. S2 and R2 as regions were divided by different rules (administrative division and ecological division), both of which are worth further discussion.

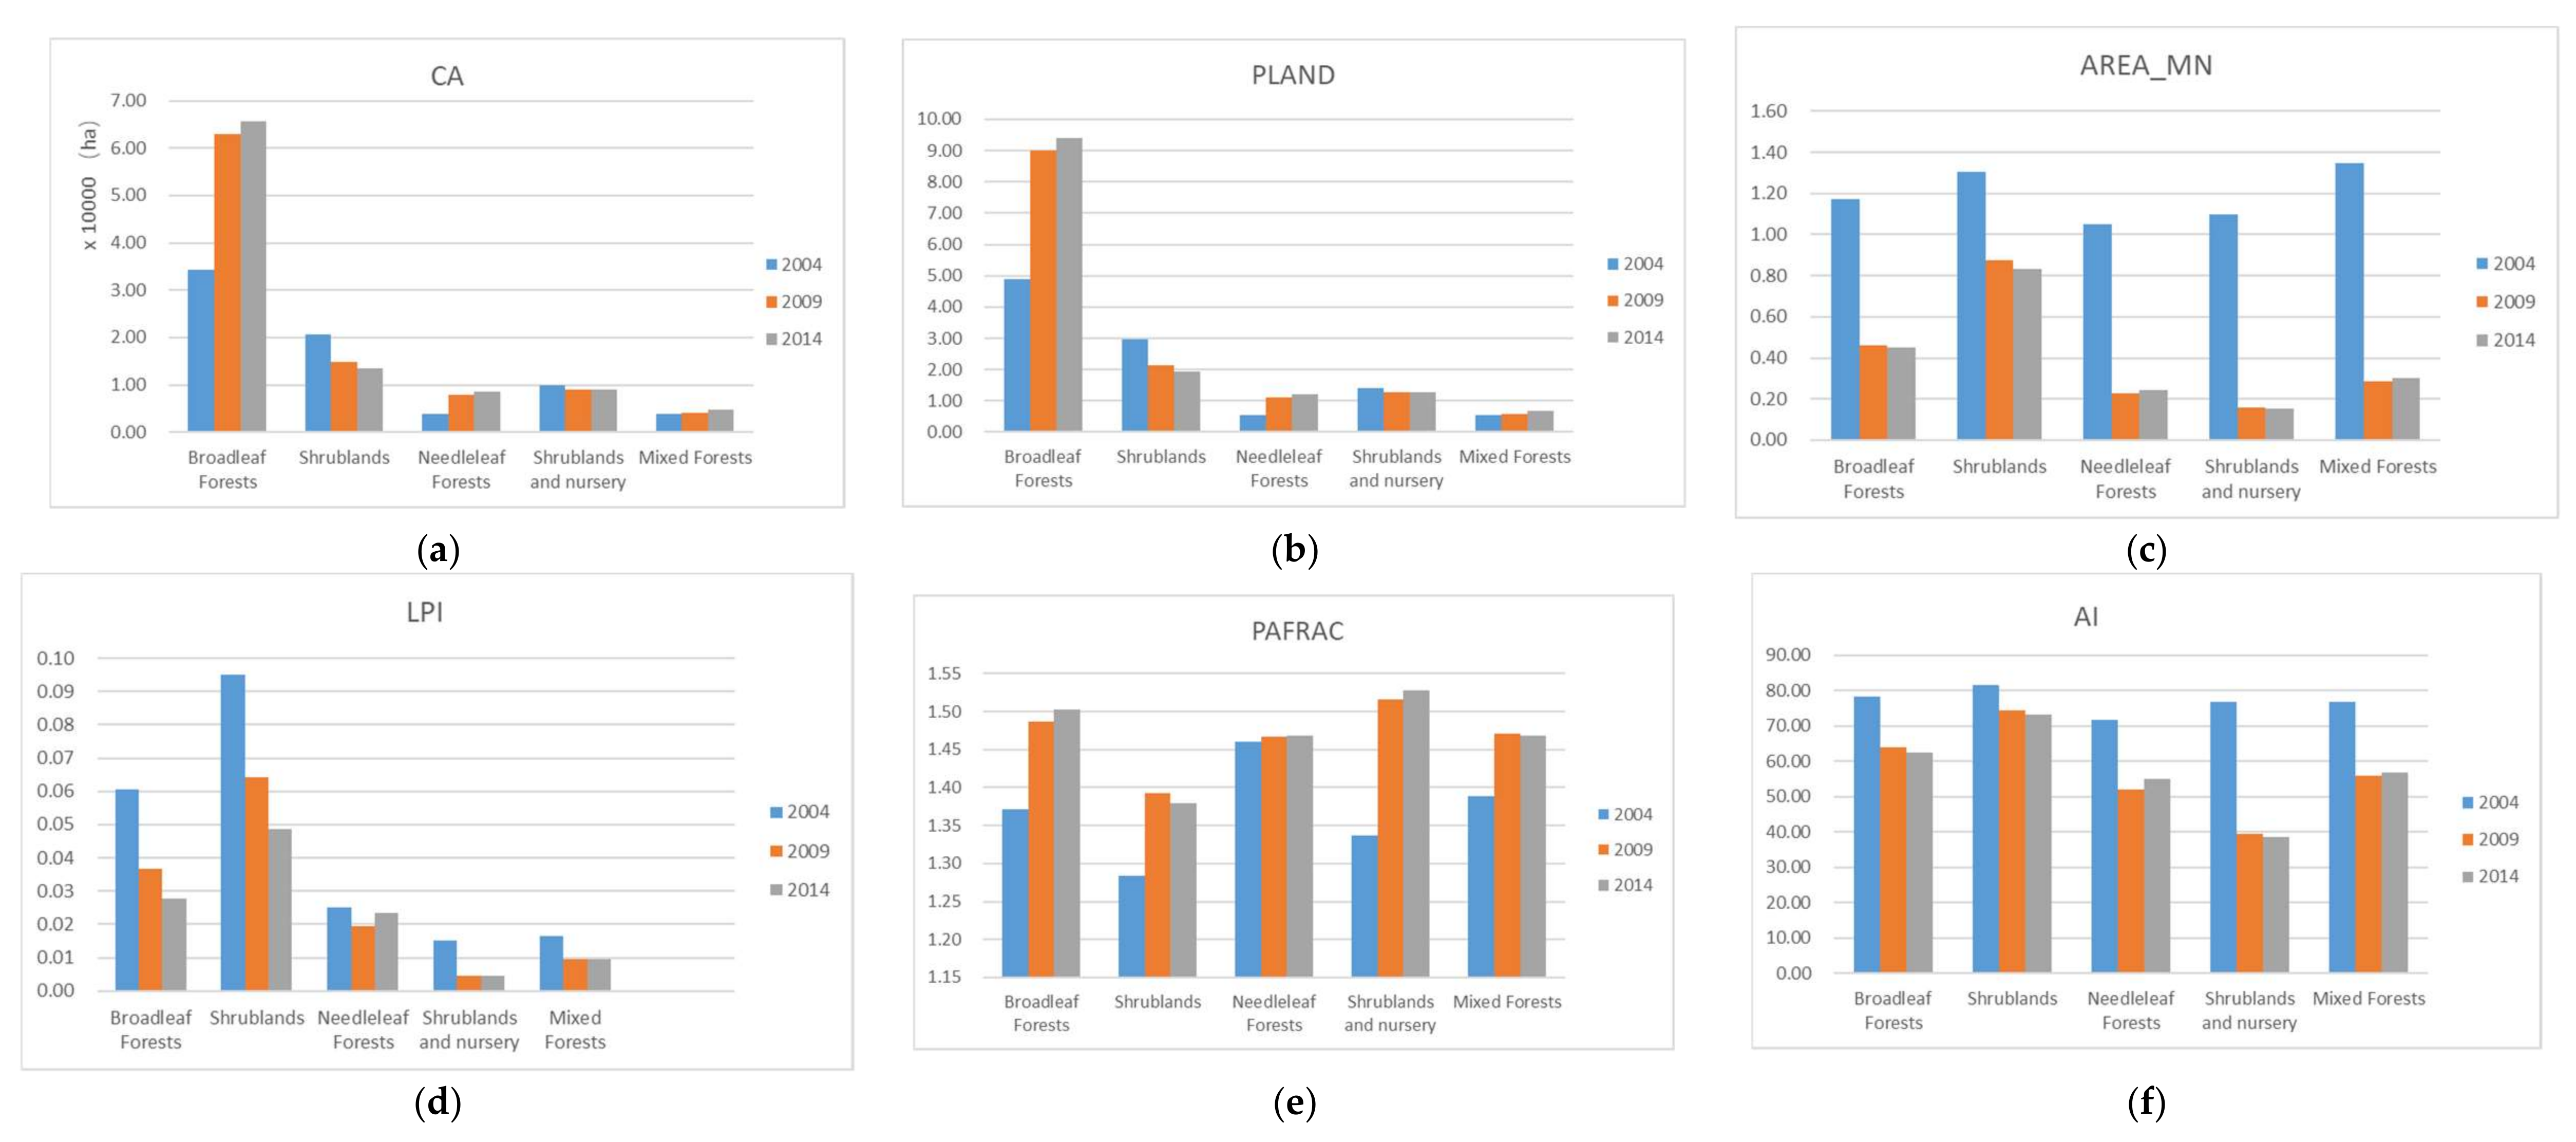
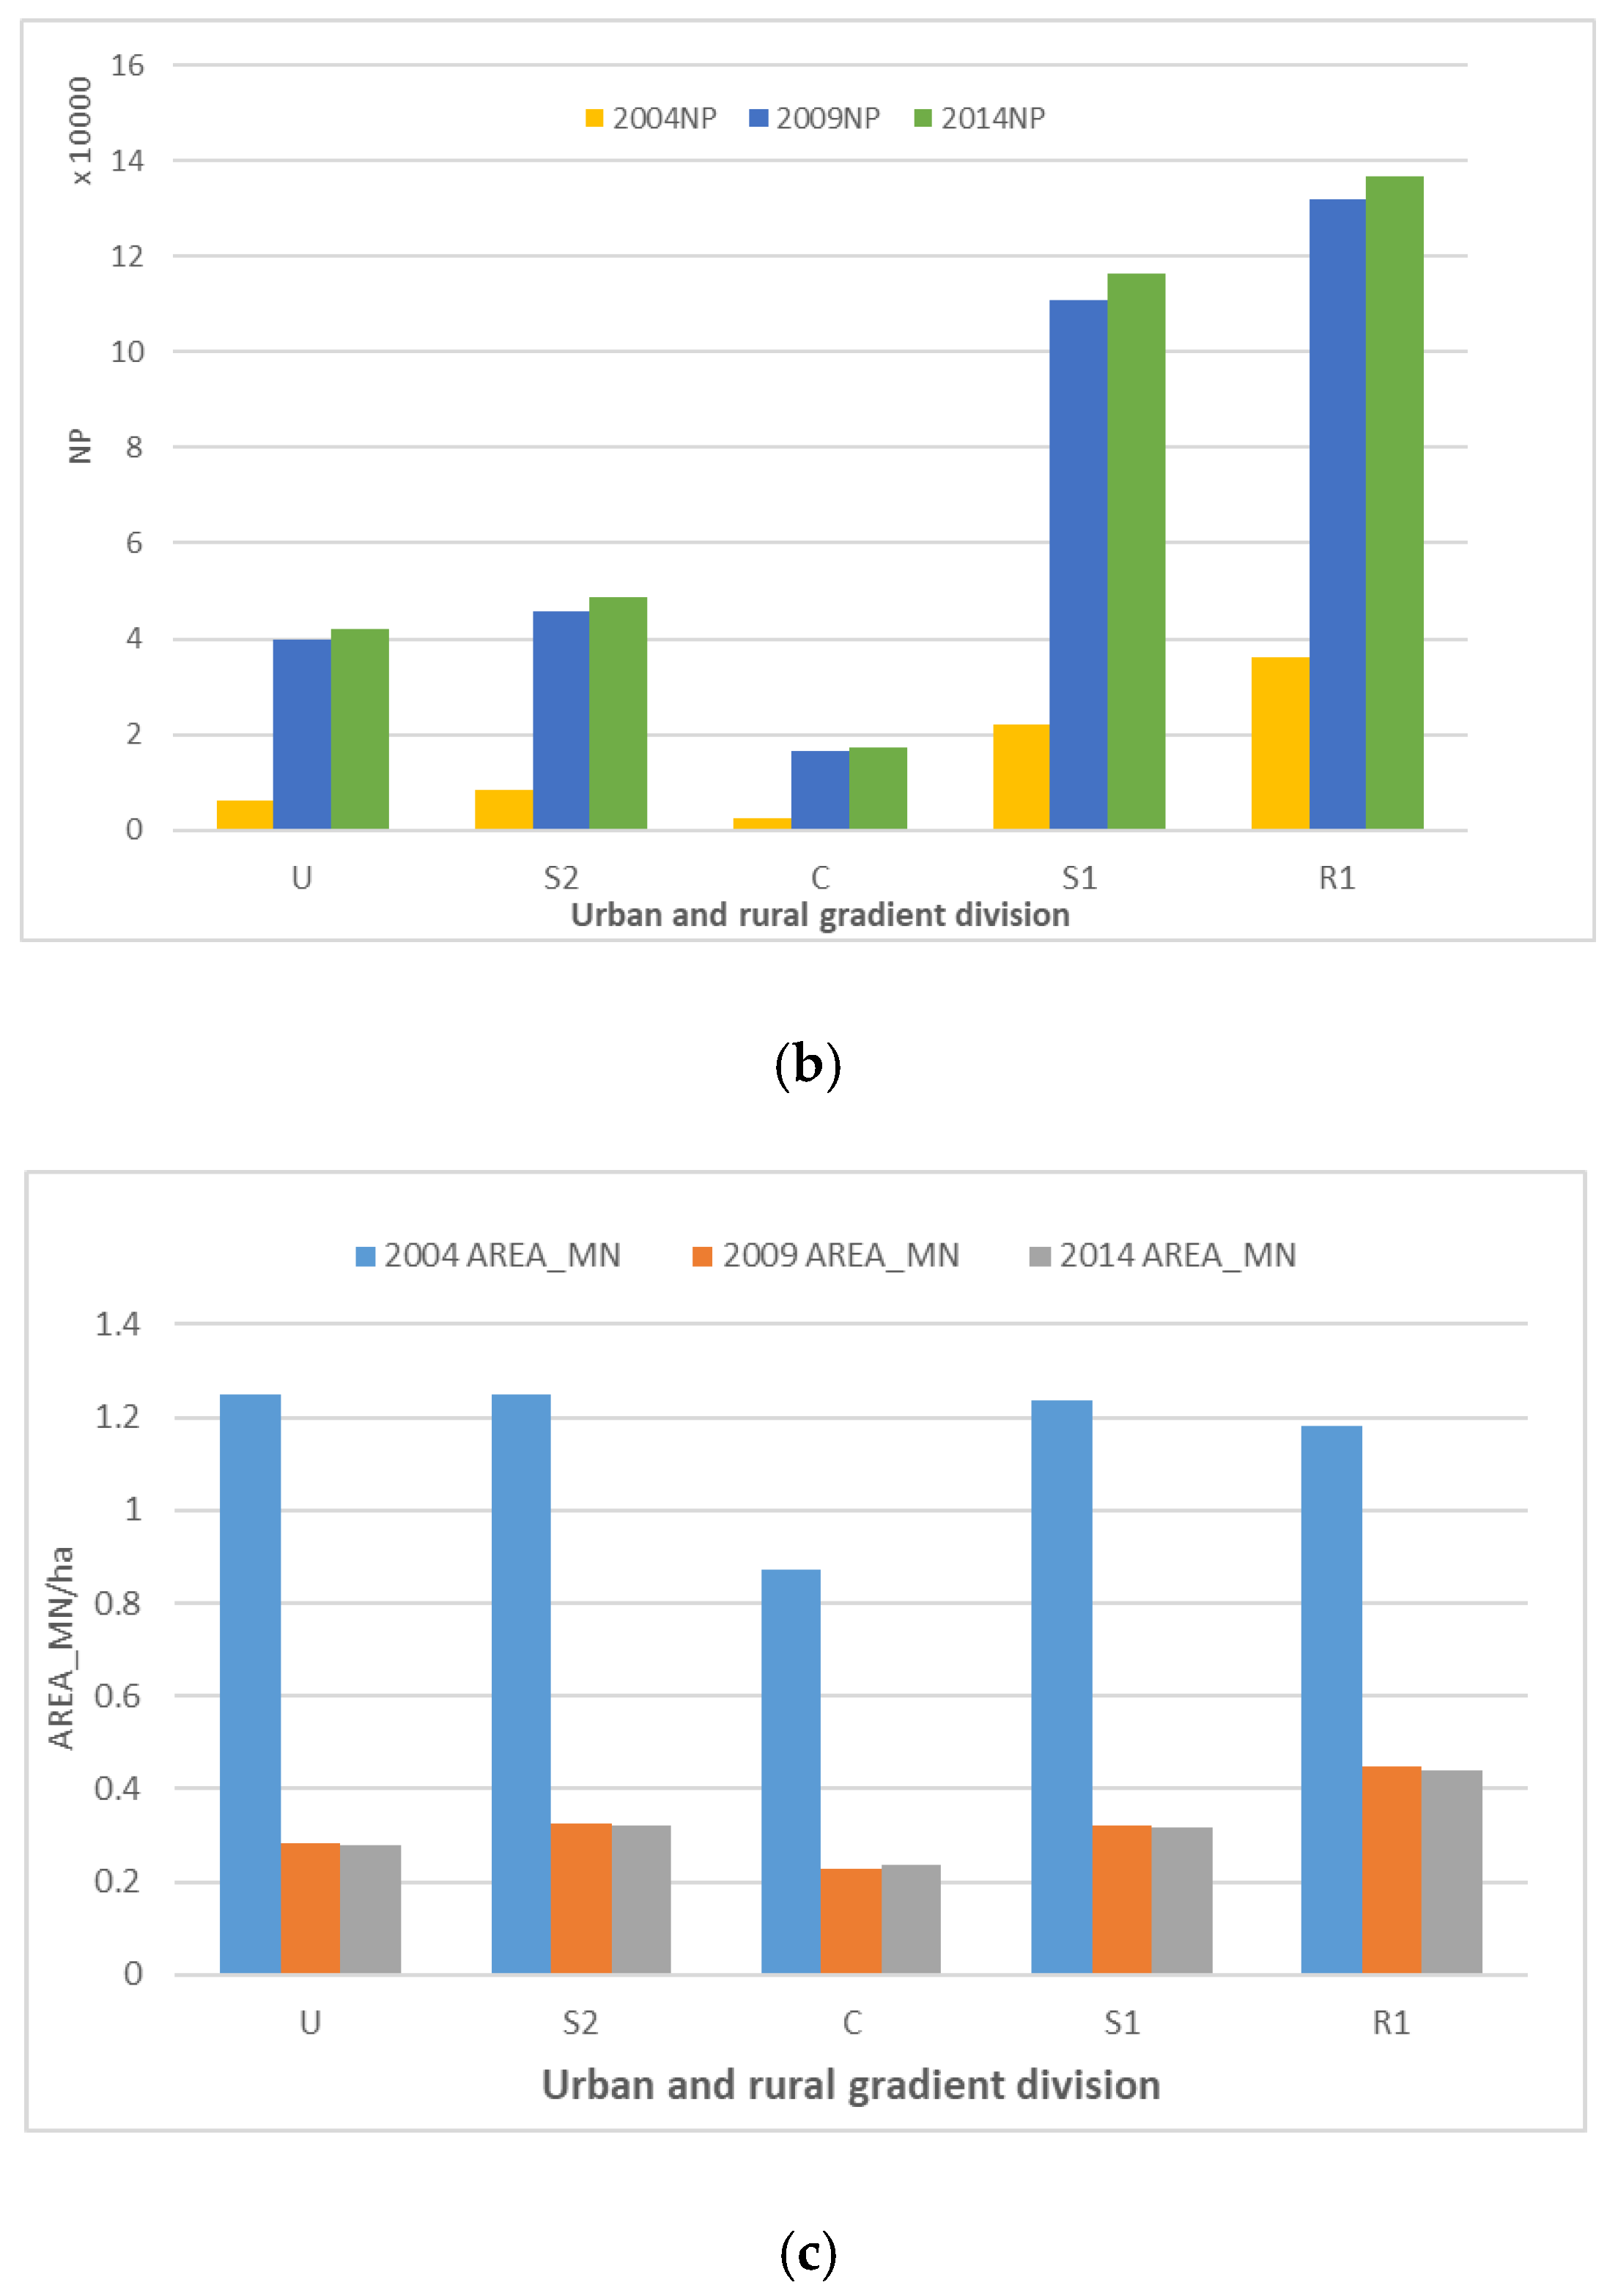
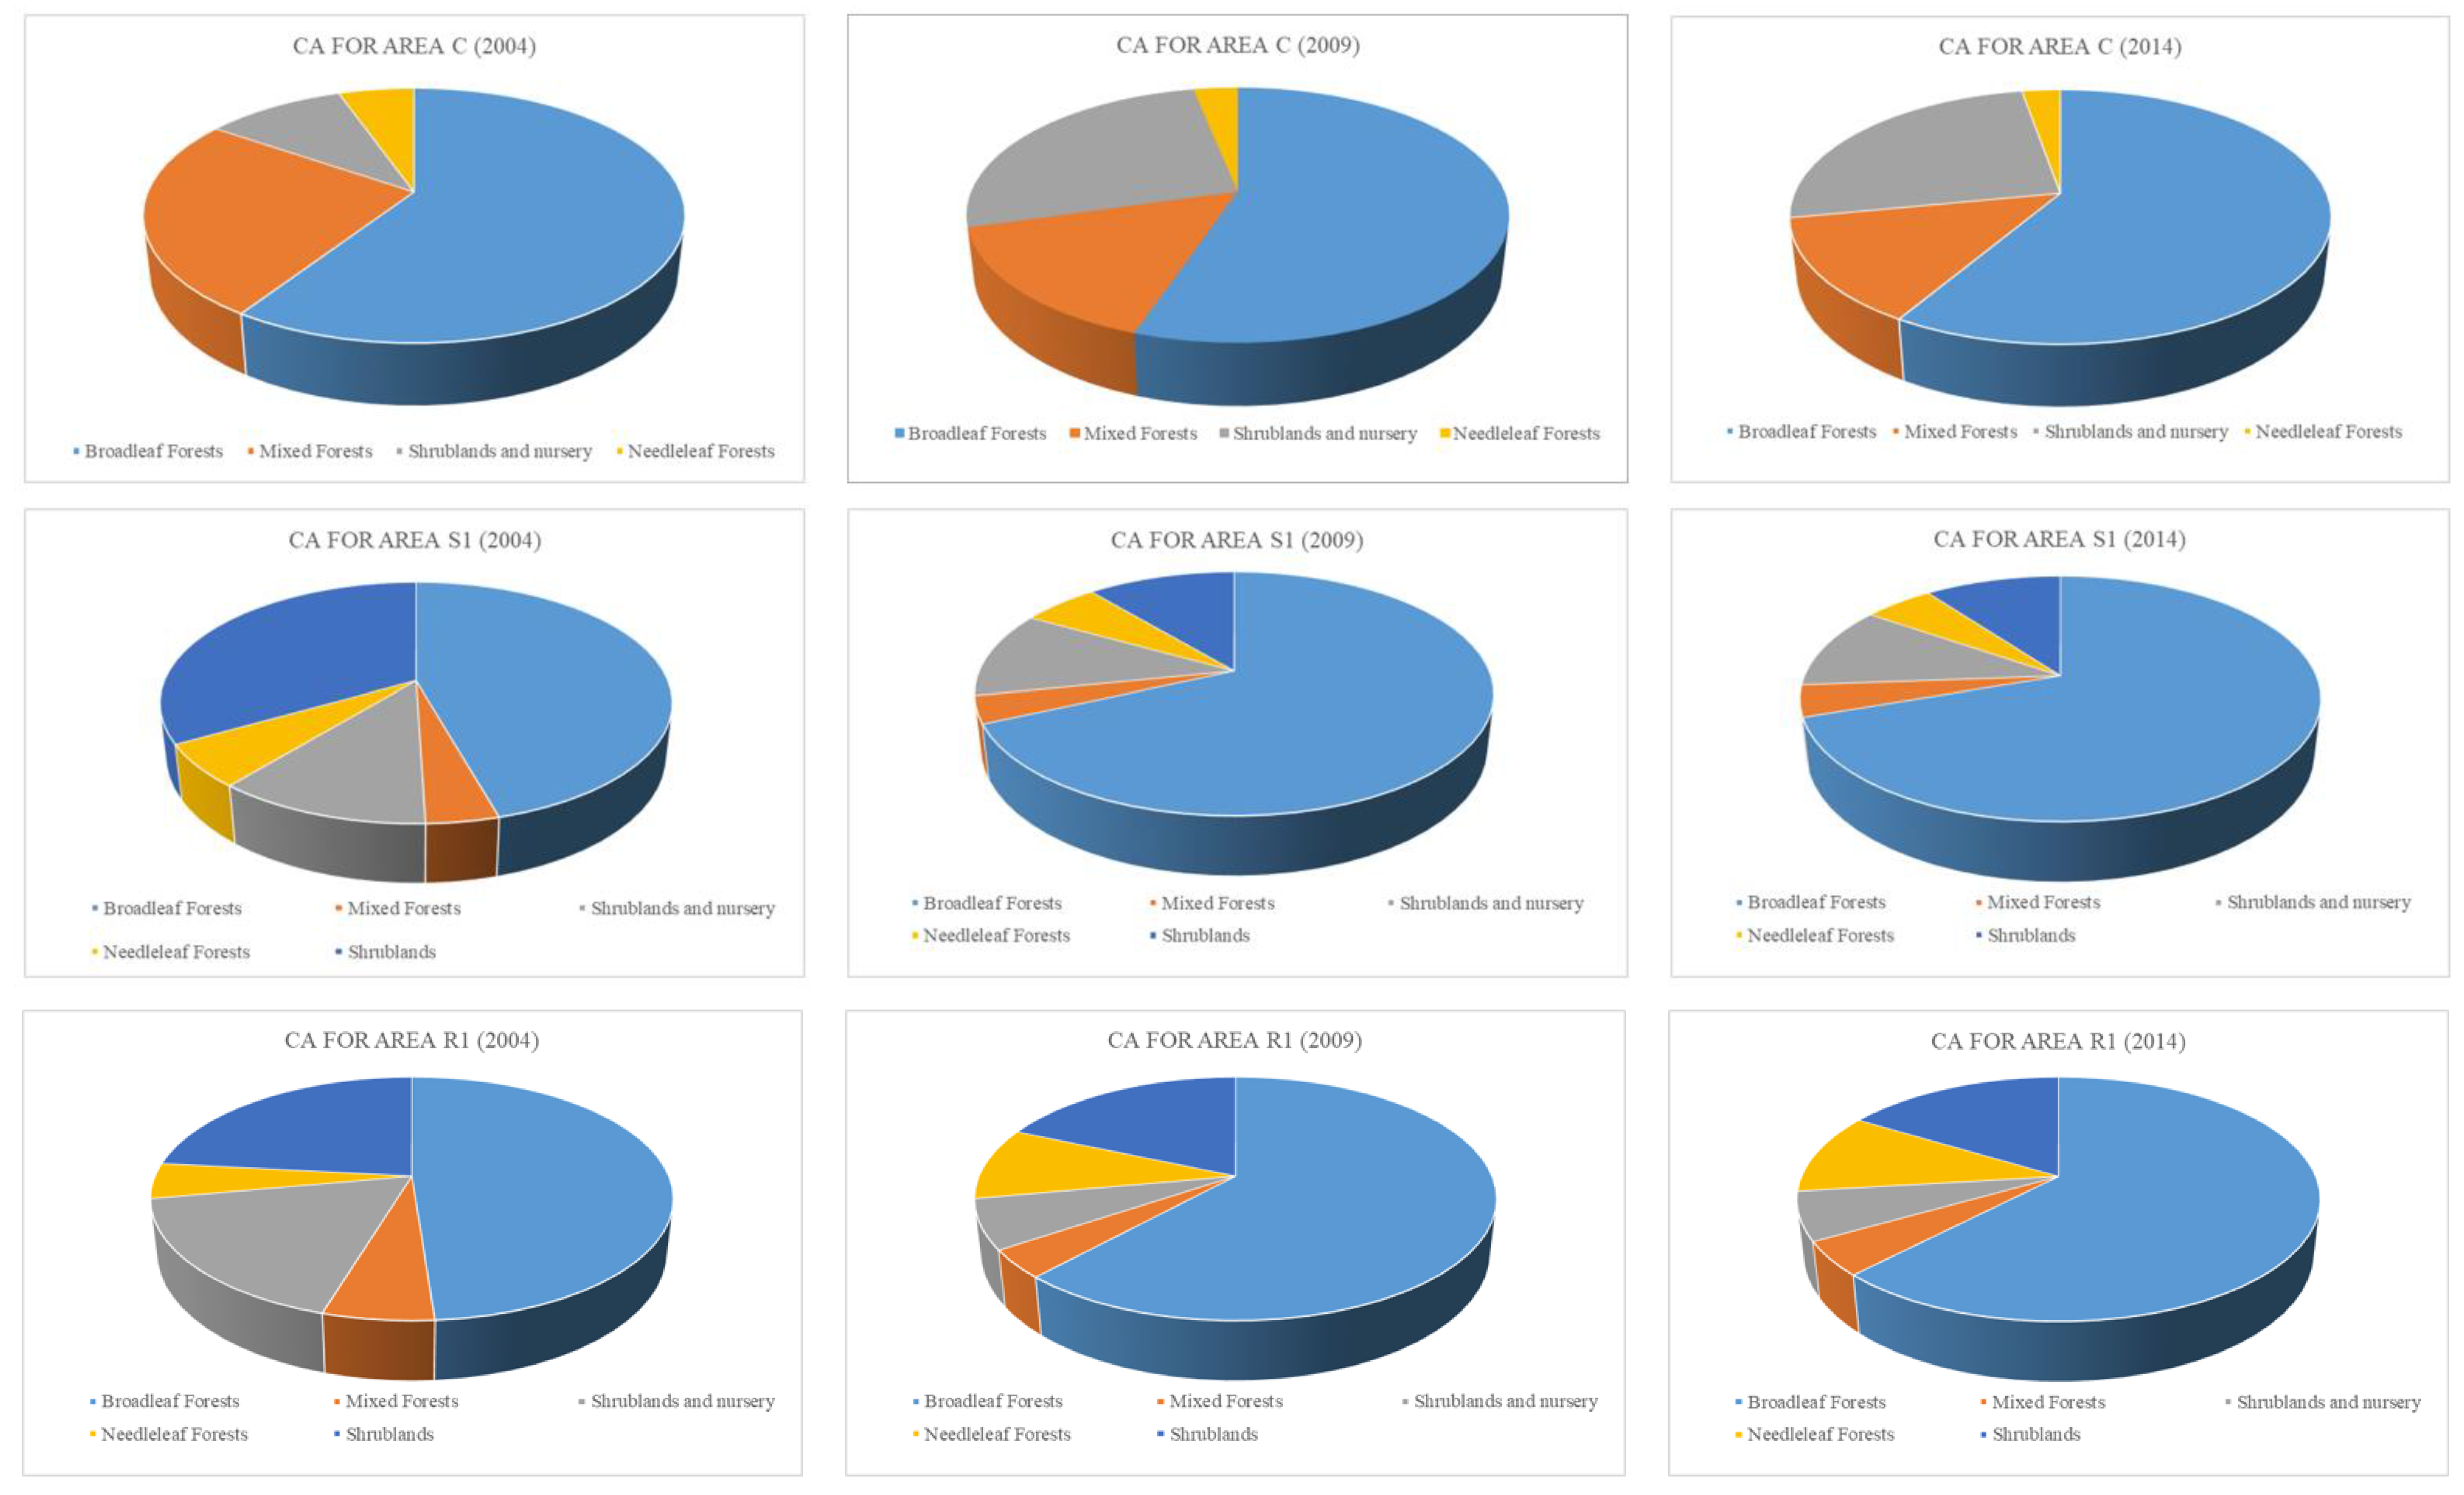
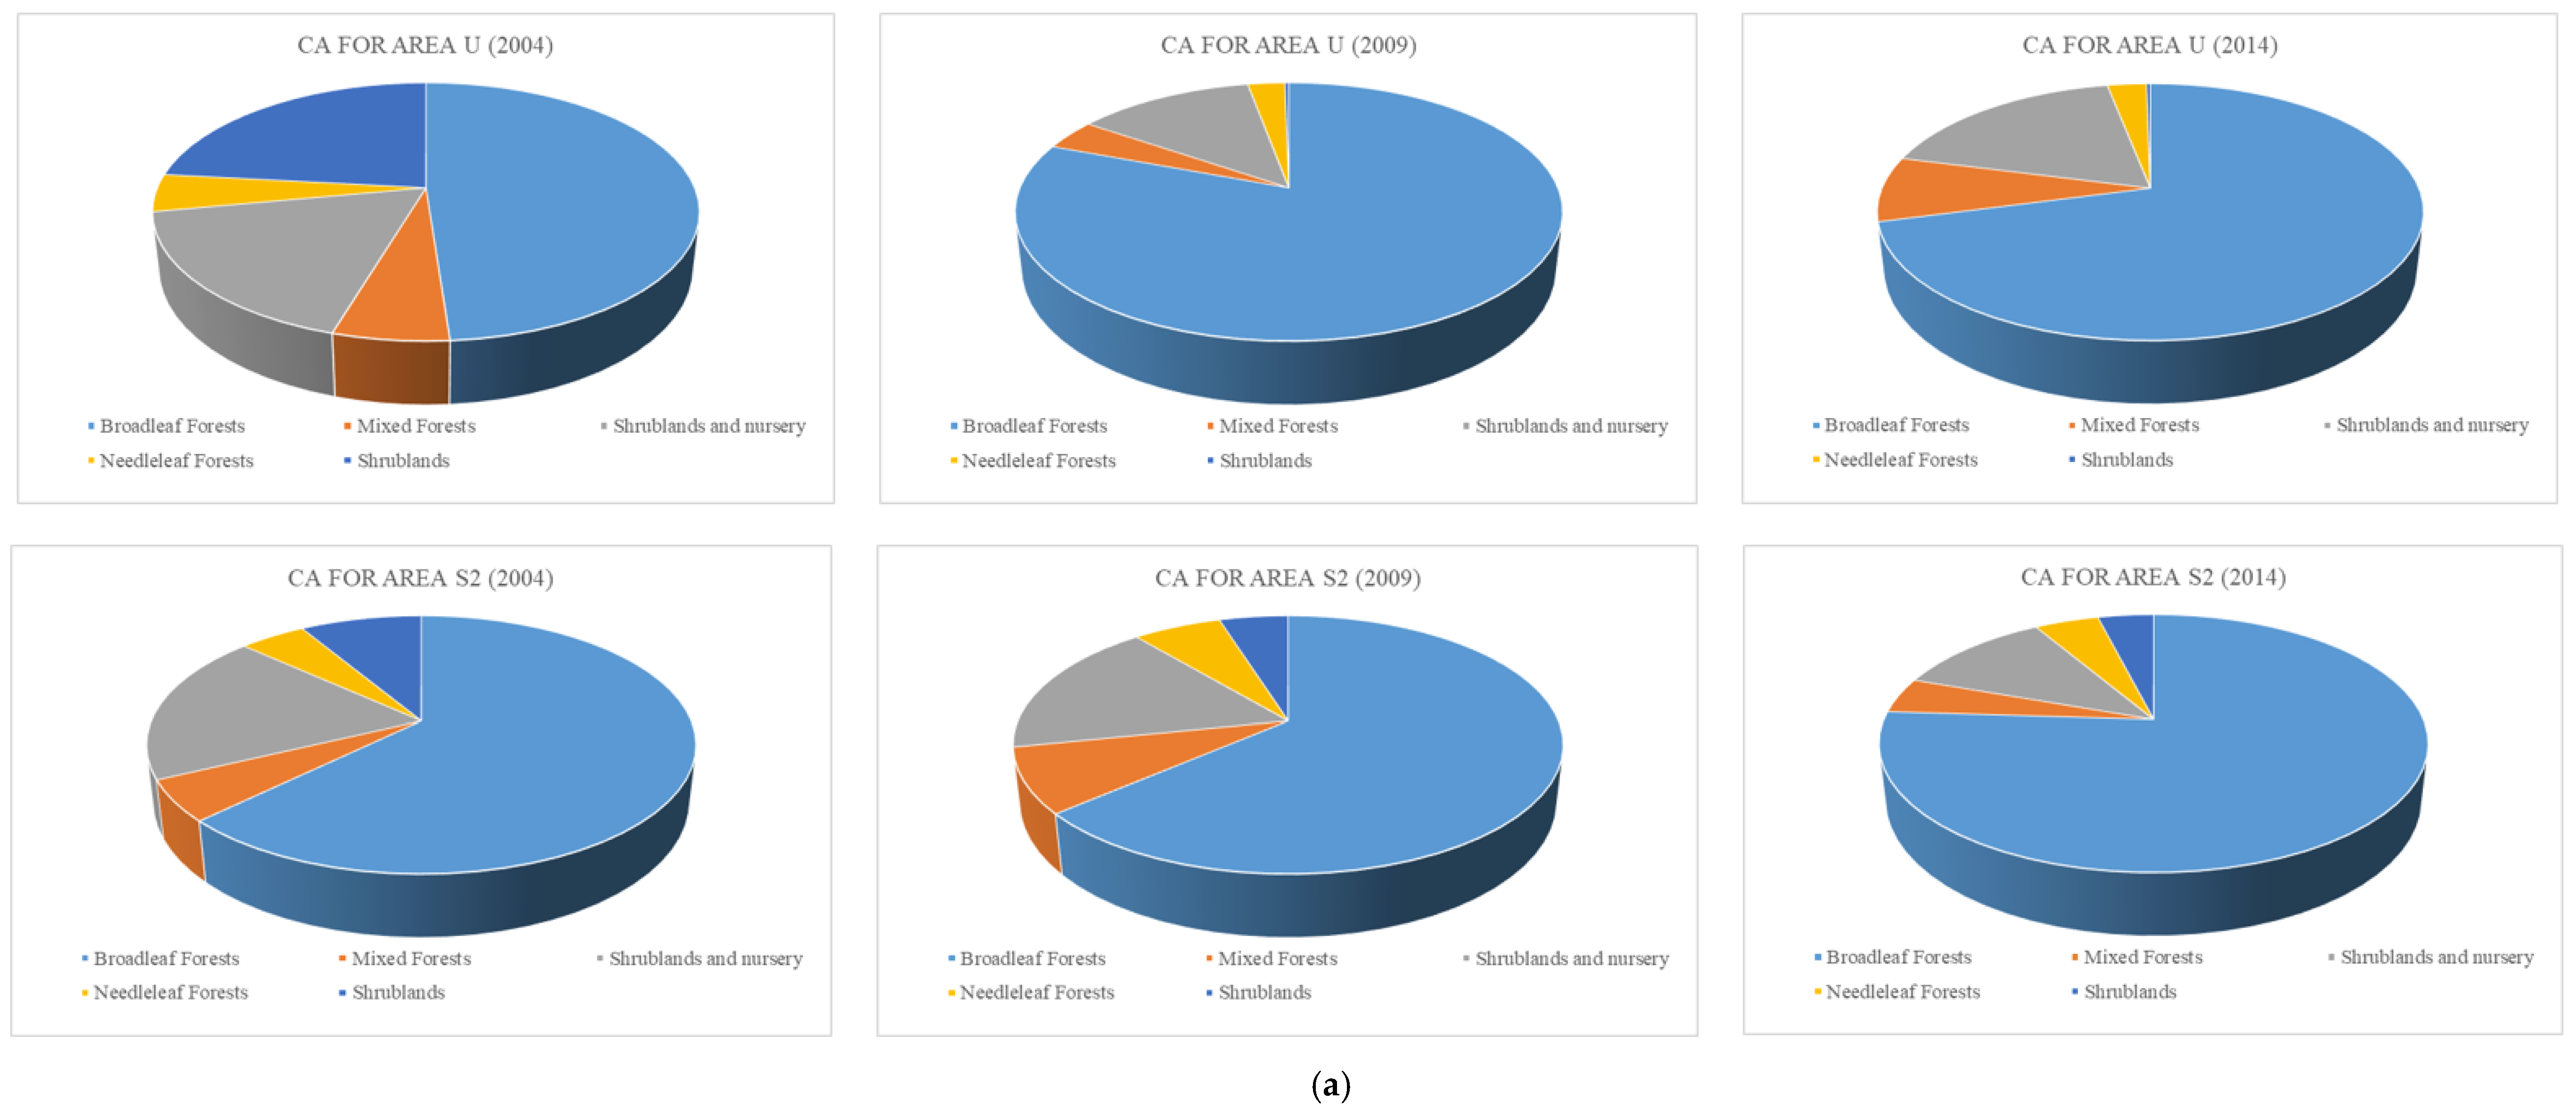
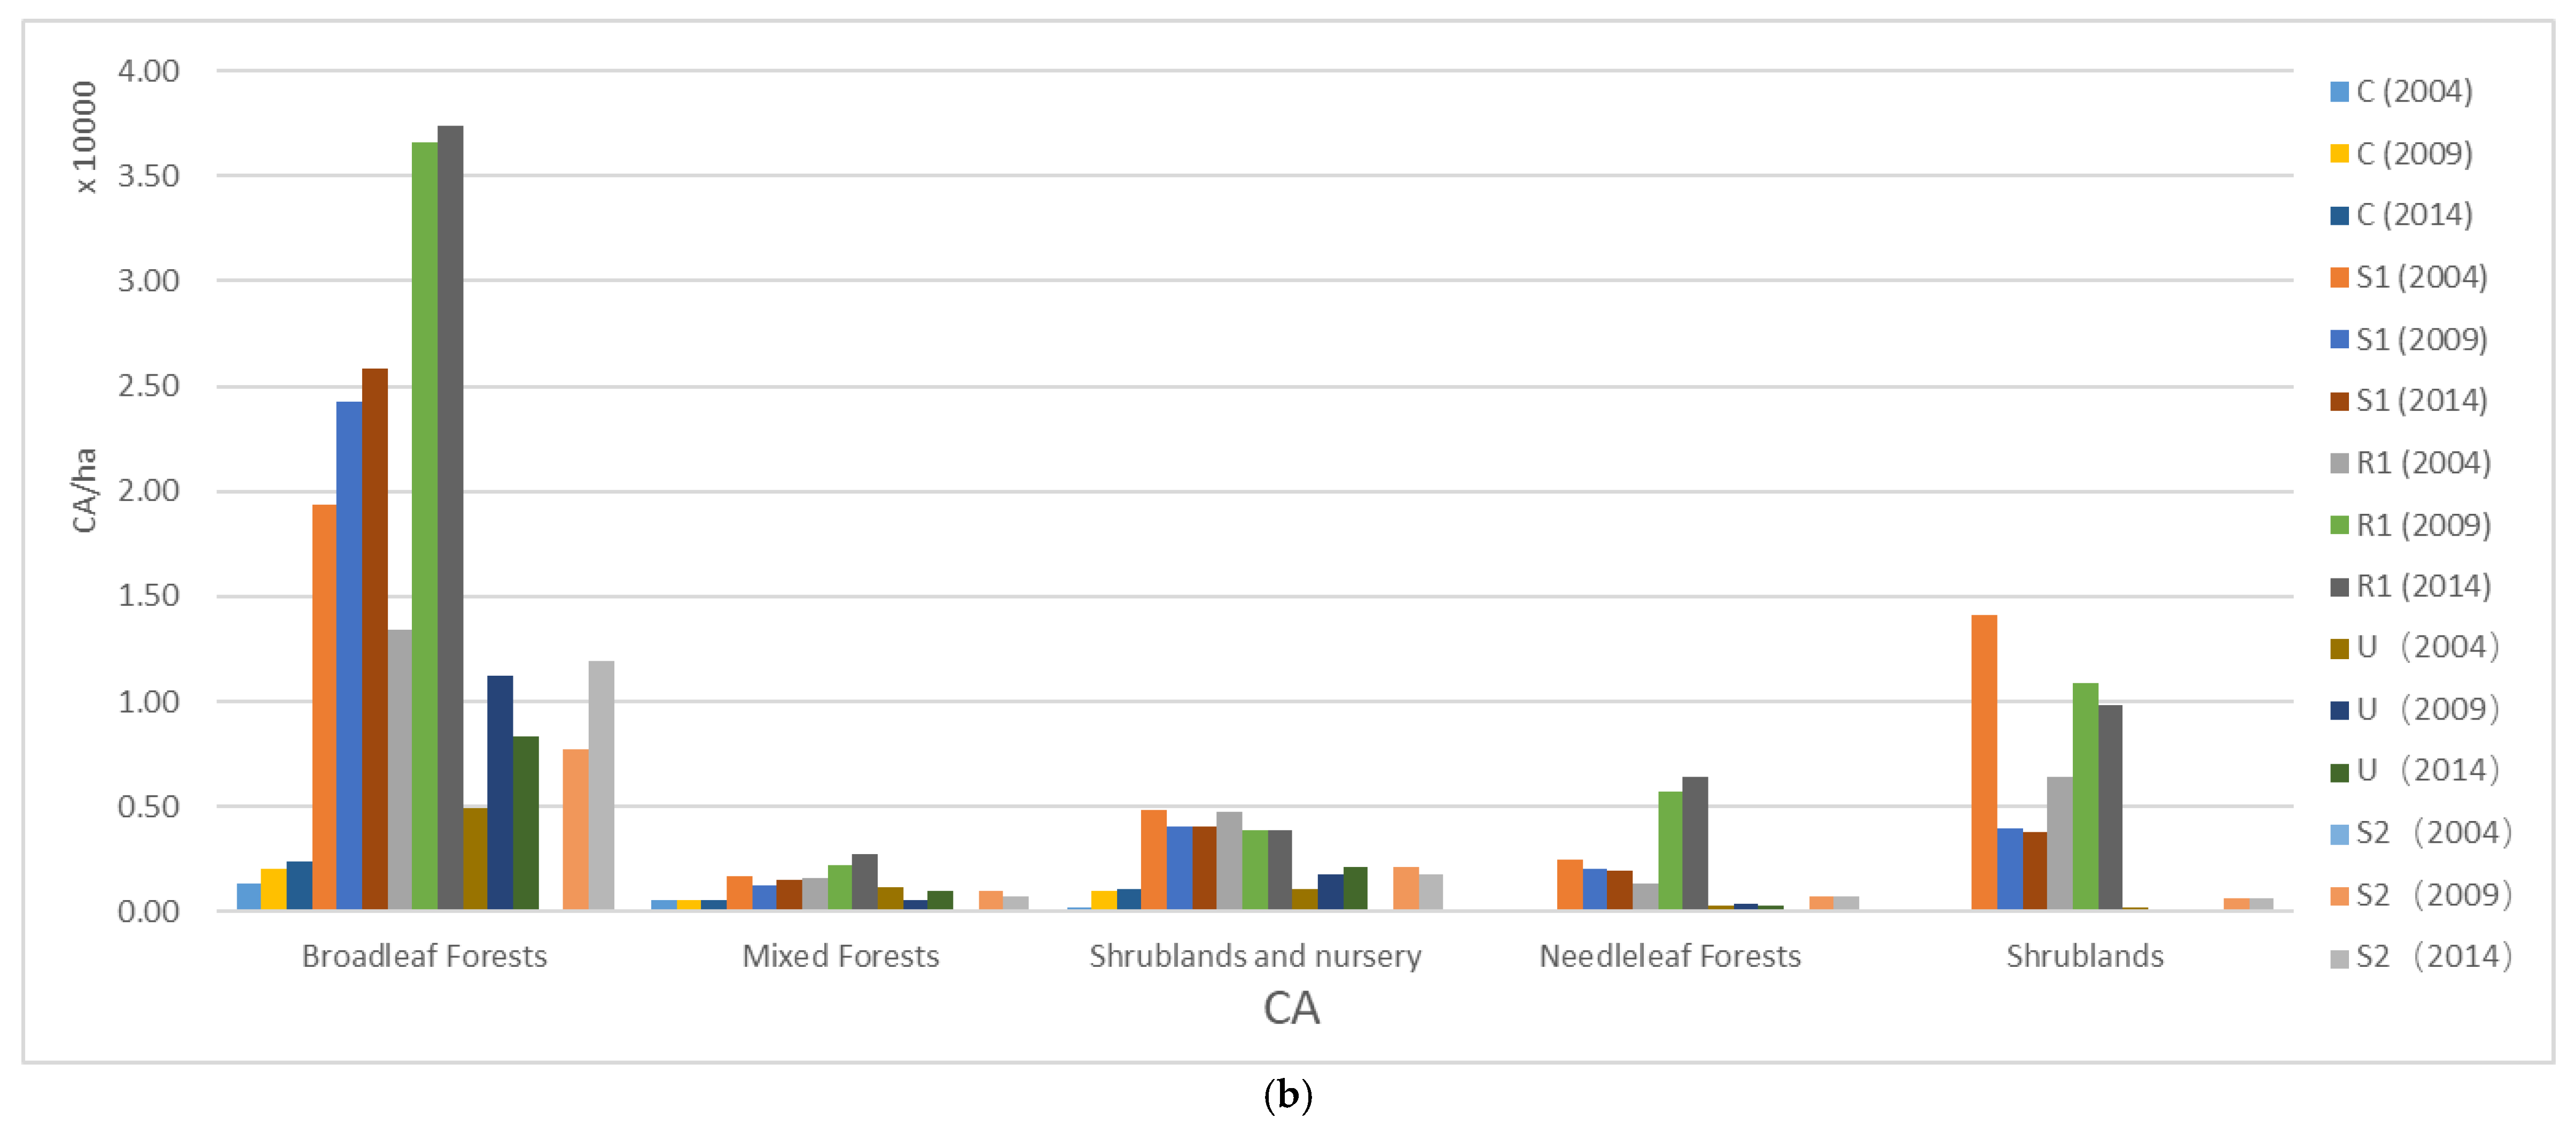
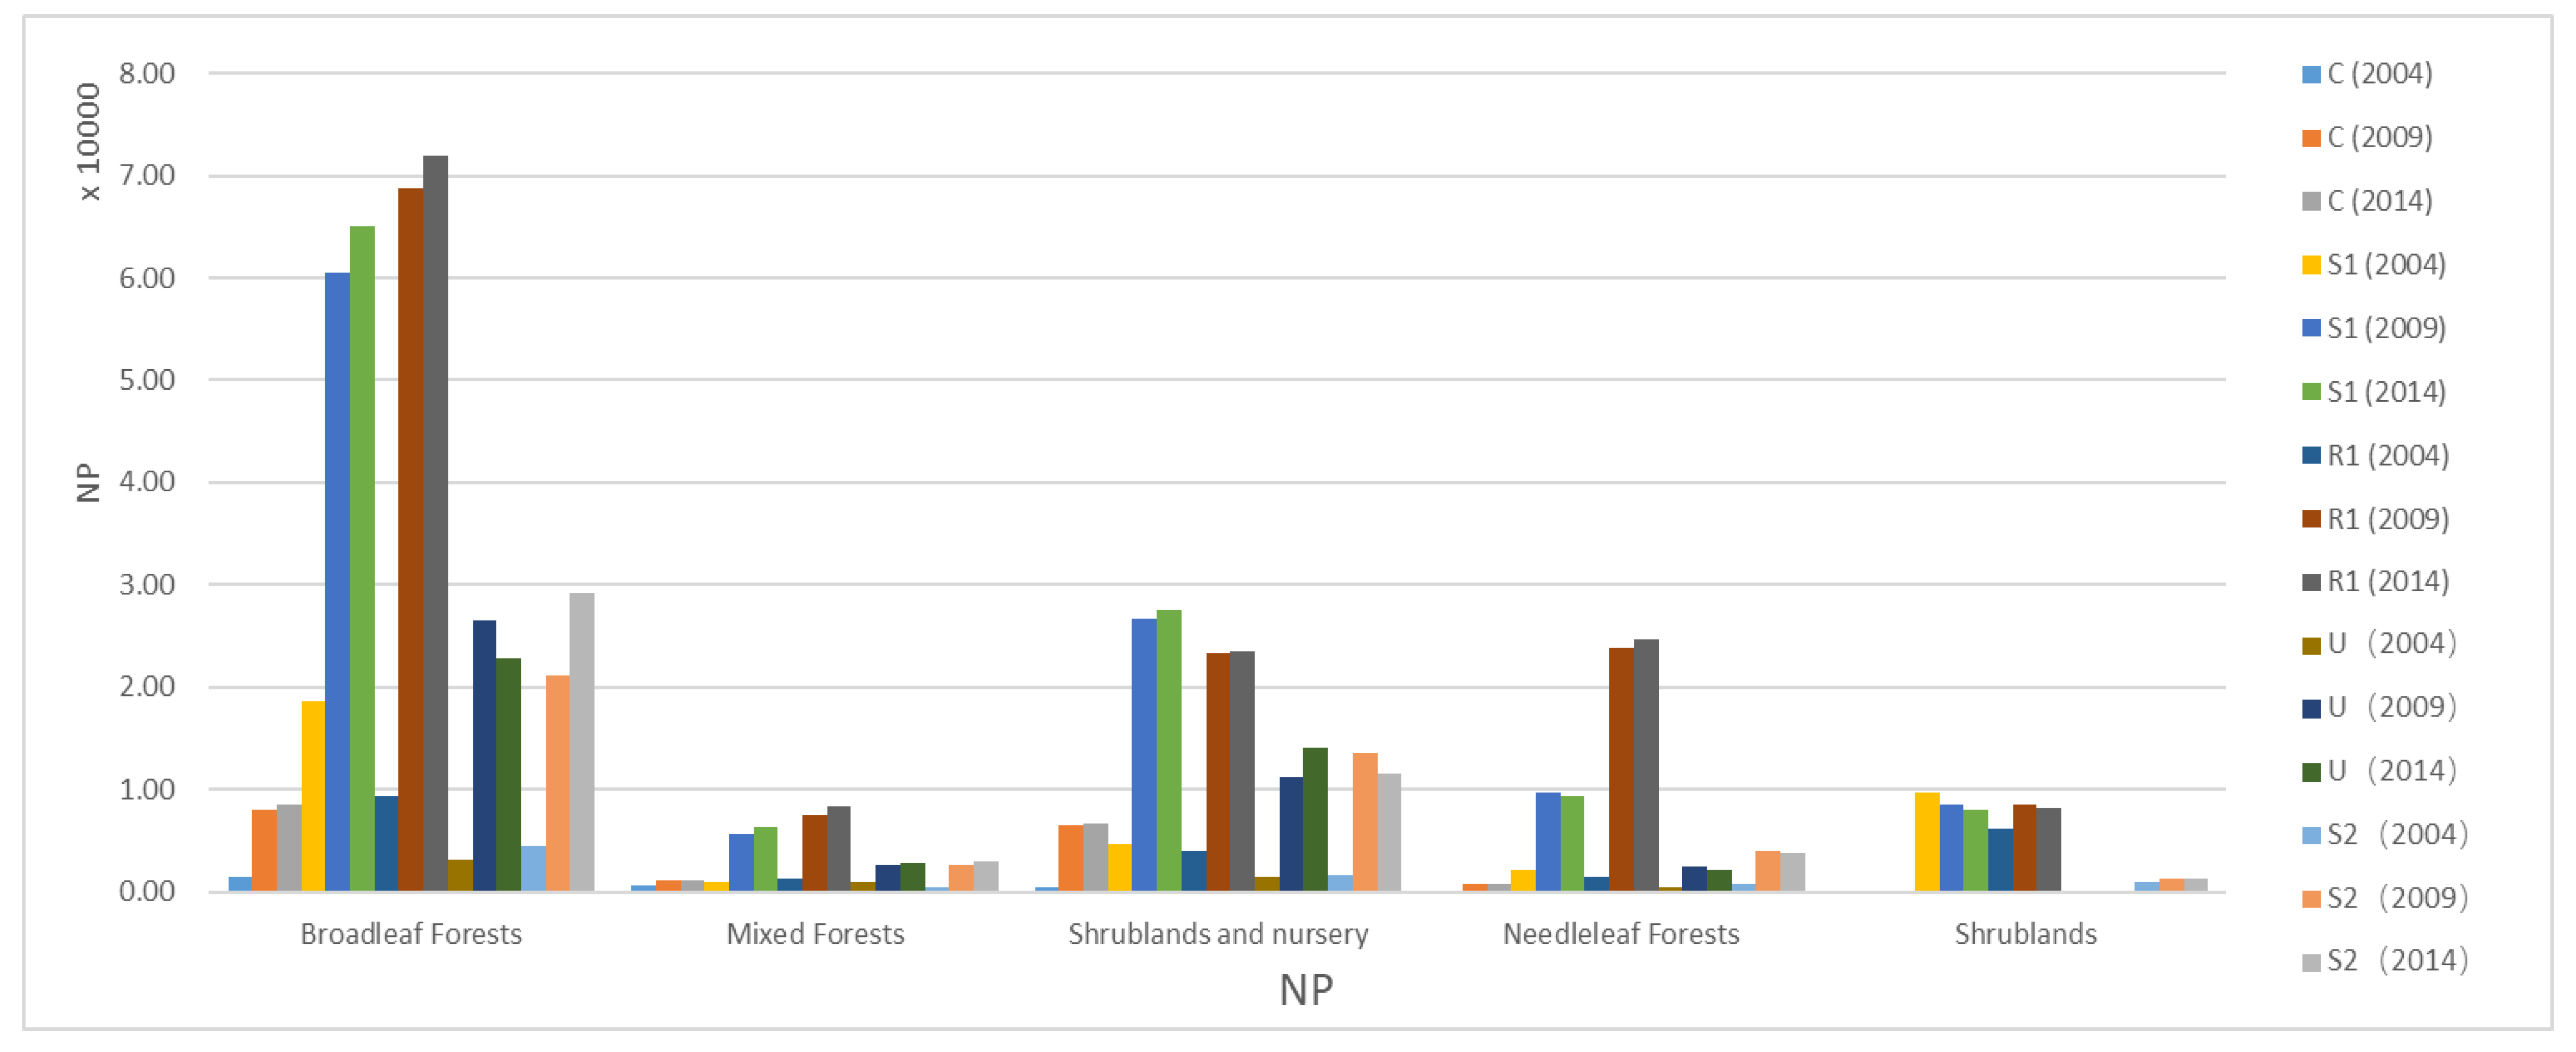
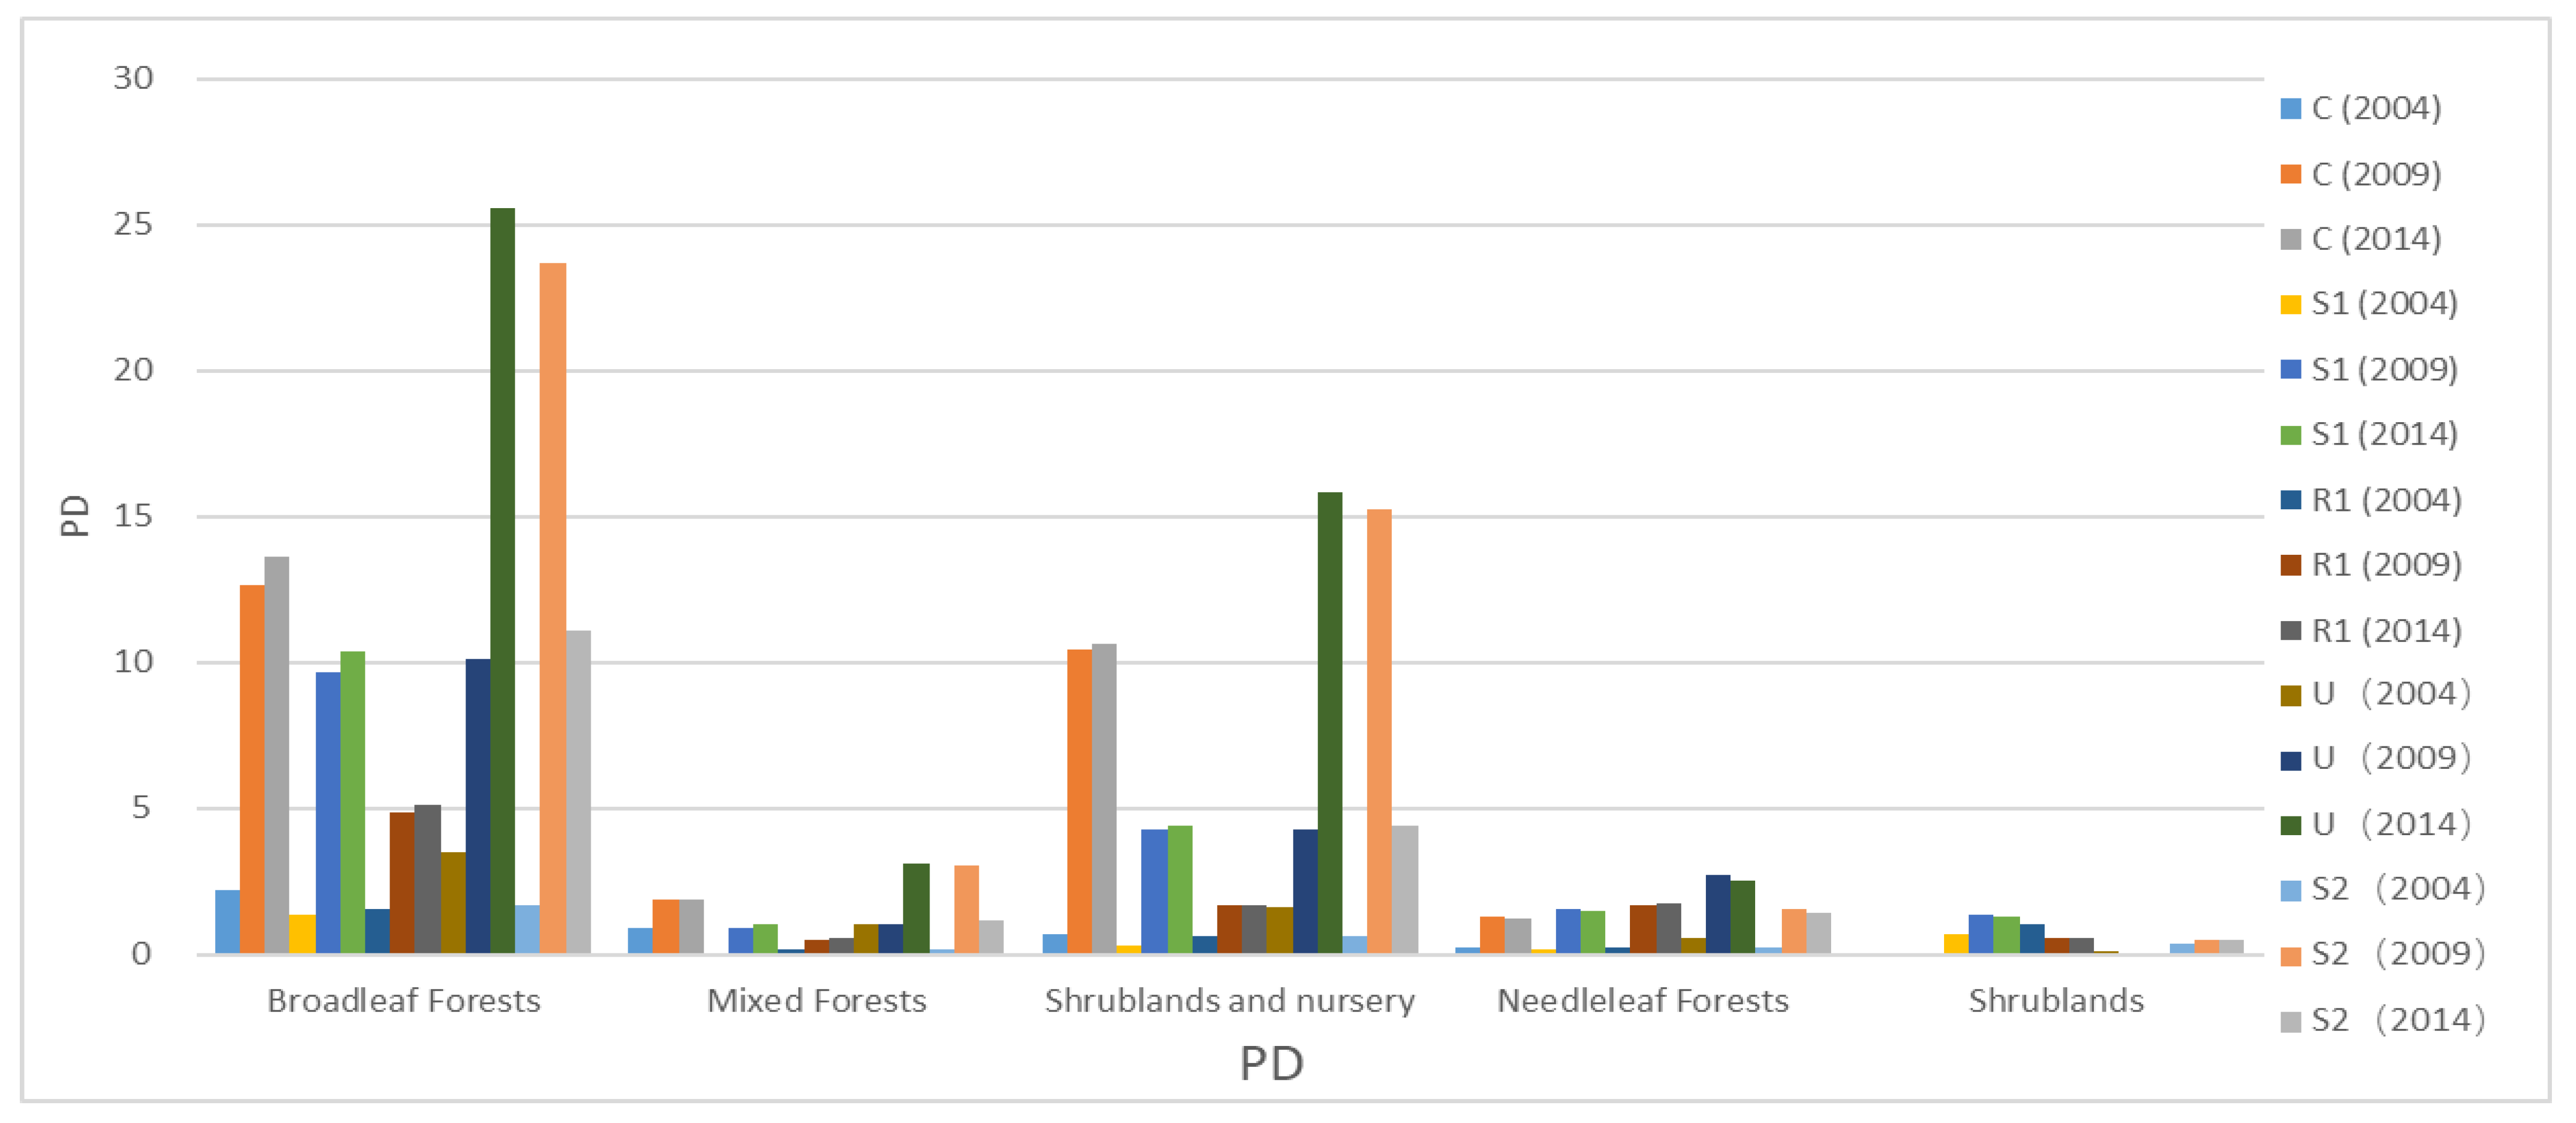
Spatial Pattern of Urban Forests at the Class Level

To understand the spatial distribution characteristics of urban forest types in different regions, as different regions have different levels of urbanization, we compared the urban forest landscape types in the regions C, S1, R1, U and S2. According to the landscape structure of the area metric values (CA, see Figure 11), broadleaf forest is the predominant landscape type in all regions, with an area of over 50%. Compared with S1 and R1, the regions of various types of forest area are relatively small. The broadleaf forest, shrublands and nursery landscape types increased to some extent in the C and U regions. The U region was mainly dominated by broadleaf forests, shrublands and nursery; moreover, only broadleaf forests increased significantly from 2004 to 2014. In S1, the proportion of needleleaf forests and mixed forests is small. Shrublands have decreased significantly since 2009, and broadleaf forests have increased significantly. In the S2 region, broadleaf, shrublands and nurseries take up a relatively large area, and all types of area have increased significantly since 2009. From the above analysis it can be seen that, from the perspective of forest type, most of the forest types are included in each region, but the growth in the area of the forest types in each region was concentrated on broadleaf forests and shrublands. Large increases in forest area were concentrated in regions far from the urban, such as S1 and R1. The urban area was restricted by land use, and the increase in the area of each forest type was low.
In terms of the area metrics (NP) in each region (Figure 12), the number of patches in the C region was the lowest, and the number of broadleaf forest patches in R1 was the highest and increased each year. Mixed forests, shrublands and nursery, and needleleaf forests all exhibited the trend of C<U<S2<R1<S1. The shrublands were predominantly concentrated in the R1, S1 and S2 regions, and the number of patches decreased each year. The above results show that in addition to shrublands, the number of patches in the region increased significantly. The increase in the number of patches, does not mean that the forest area was growing and that the ecological environment improved. We need to combine more landscape metrics to analysis the landscape structure of the study area, such as the size and spatial distribution of the growing patches.
The aggregation metrics (PD) index revealed an increasing trend each year in all regions (Figure 13). The density of the broadleaf forest showed a trend of S1<R1<S2<C<U in 2004 and 2014, but it is worth noting that there was a significant downward trend of the S2 region from 2009 to 2014. This may have been caused by an adjustment of the economic fruit planting structure, a decline in nursery management, large-scale residential area development and construction, and the construction of large-scale parks. The density of needleleaf forests, shrublands, shrublands and nursery forest in most regions increased significantly from 2004 to 2014. The broadleaf forest in the C and U regions had the highest patch density, followed by shrublands and nursery, and a majority of the regions presented a trend of increasing density. The density of shrublands presented a trend of C<U<S2<R1<S1, which also indicates that the distribution of shrublands was concentrated in the suburban area. Urban forests have certain zonal characteristics in Shanghai. The central urban areas are dominated by broadleaf forests and shrublands and nursery, and this increased year by year. The forest density in the central urban areas also increased significantly, but the forest area grew slowly, and the number of patches increased. There is a lack of large-scale group forests and landscape corridors in Shanghai, and the city’s demand for ecological functions cannot be fully met.

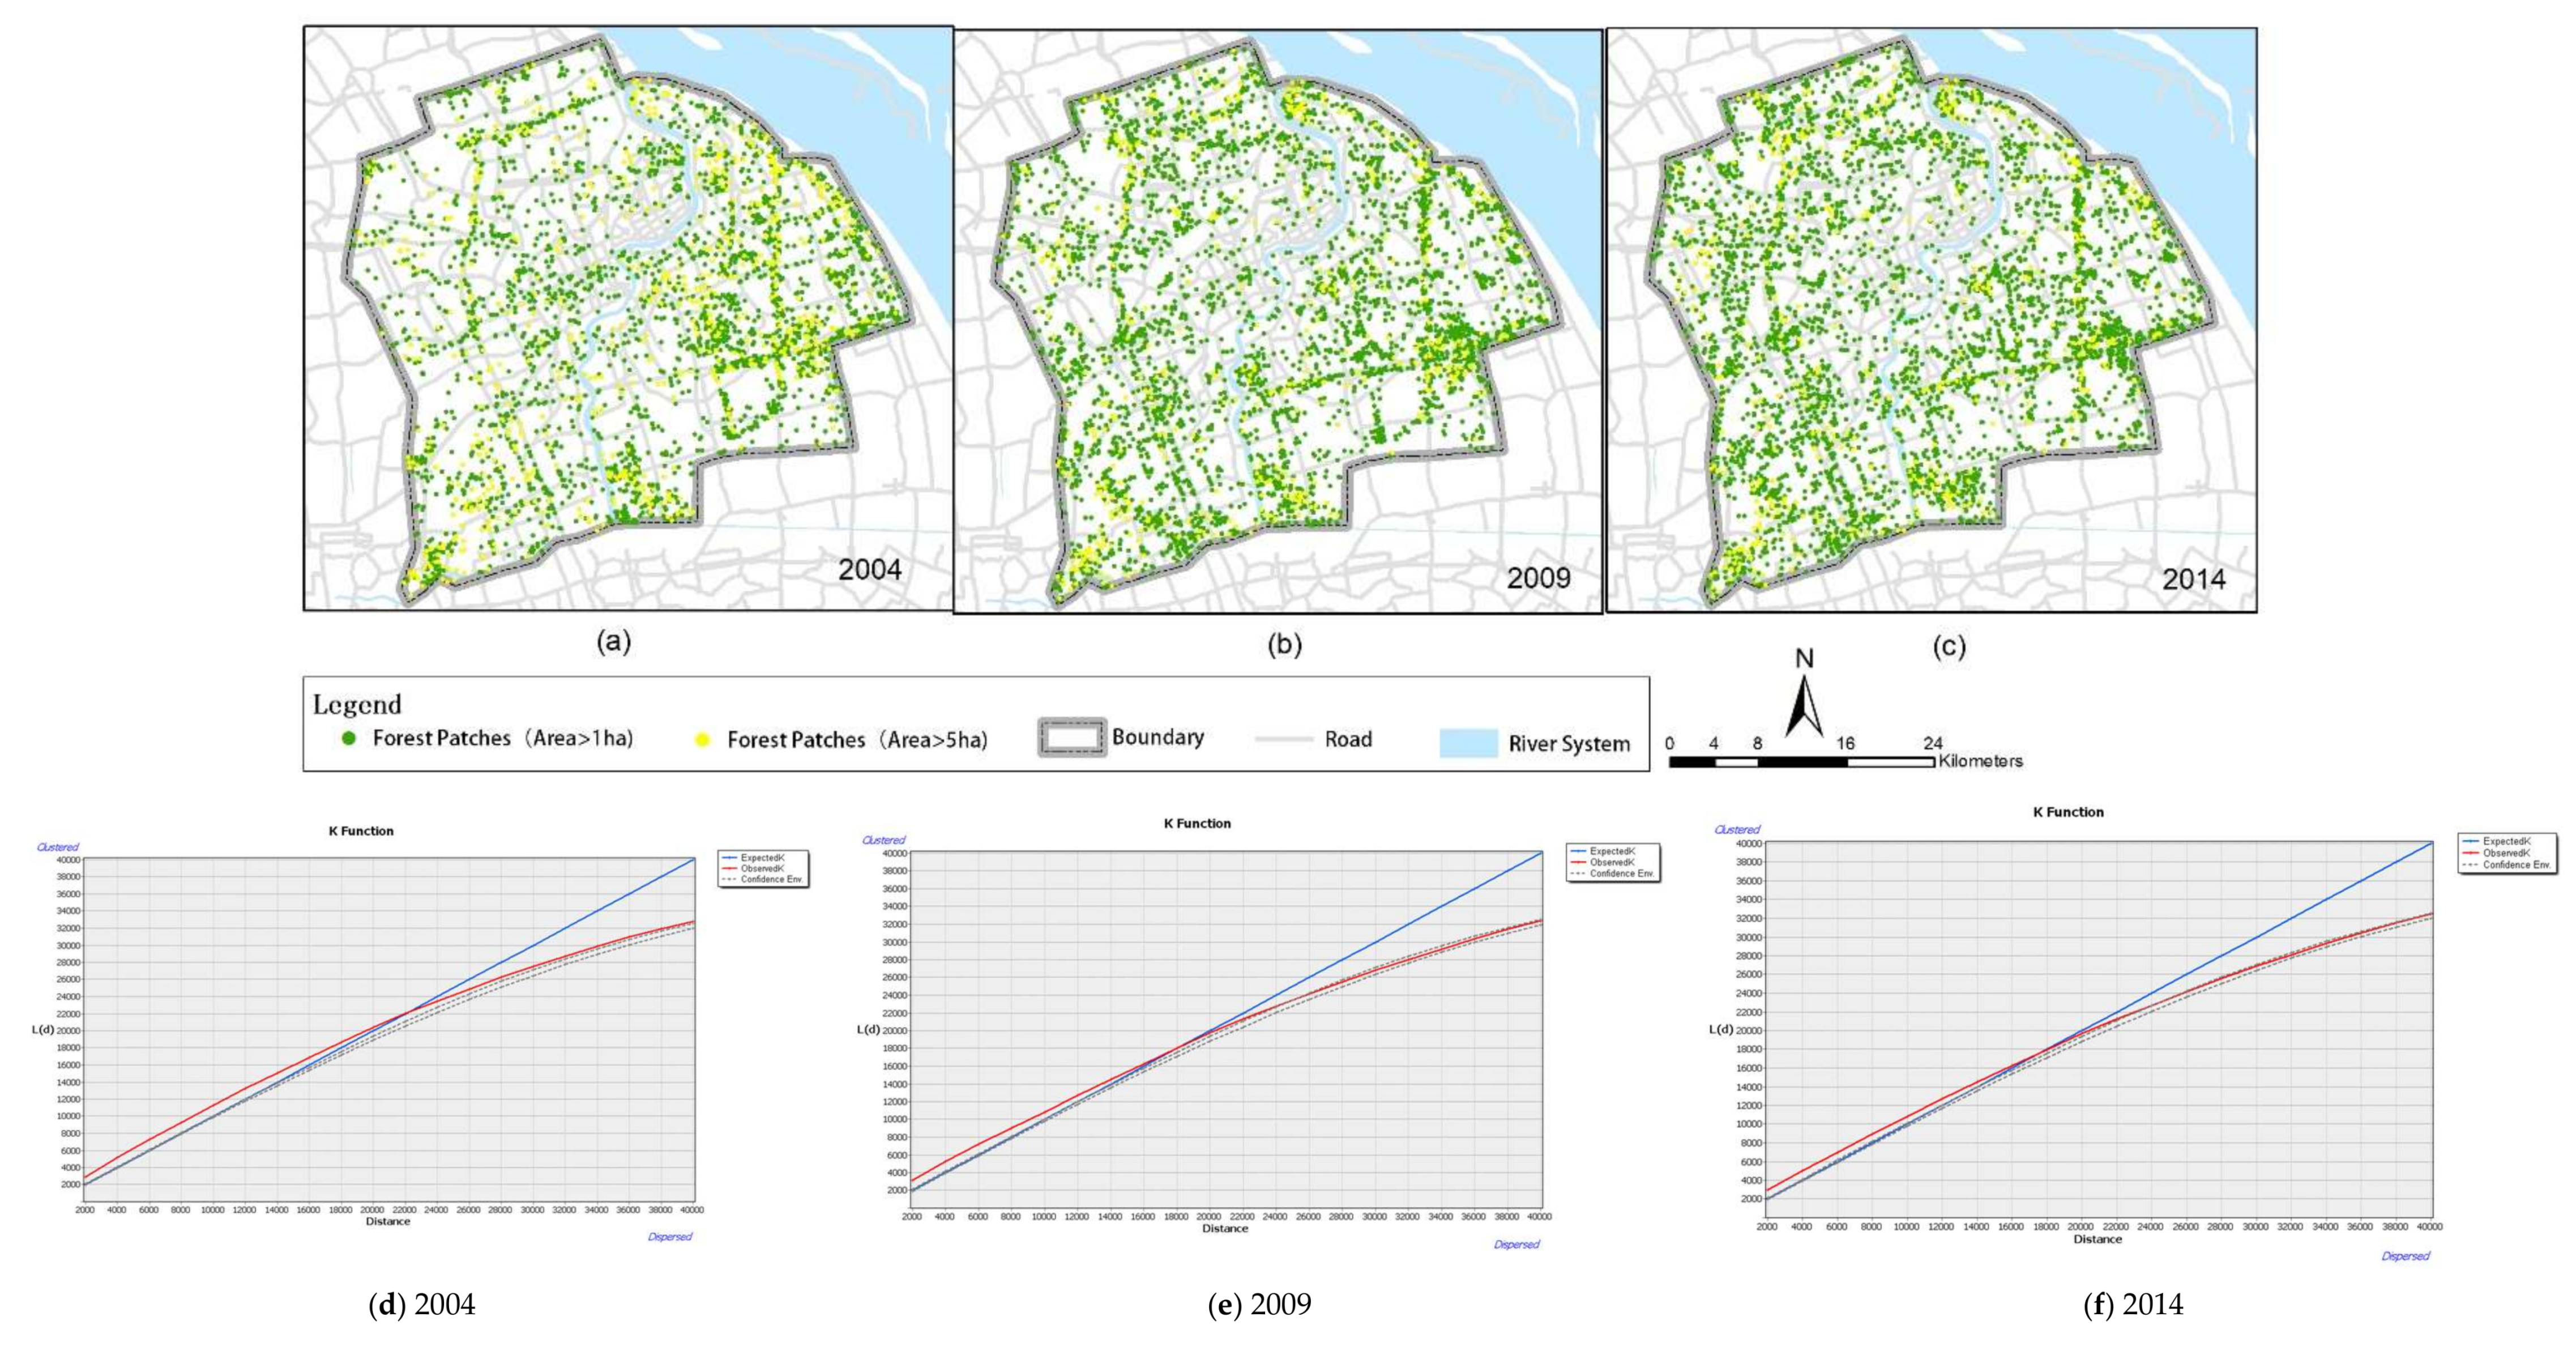
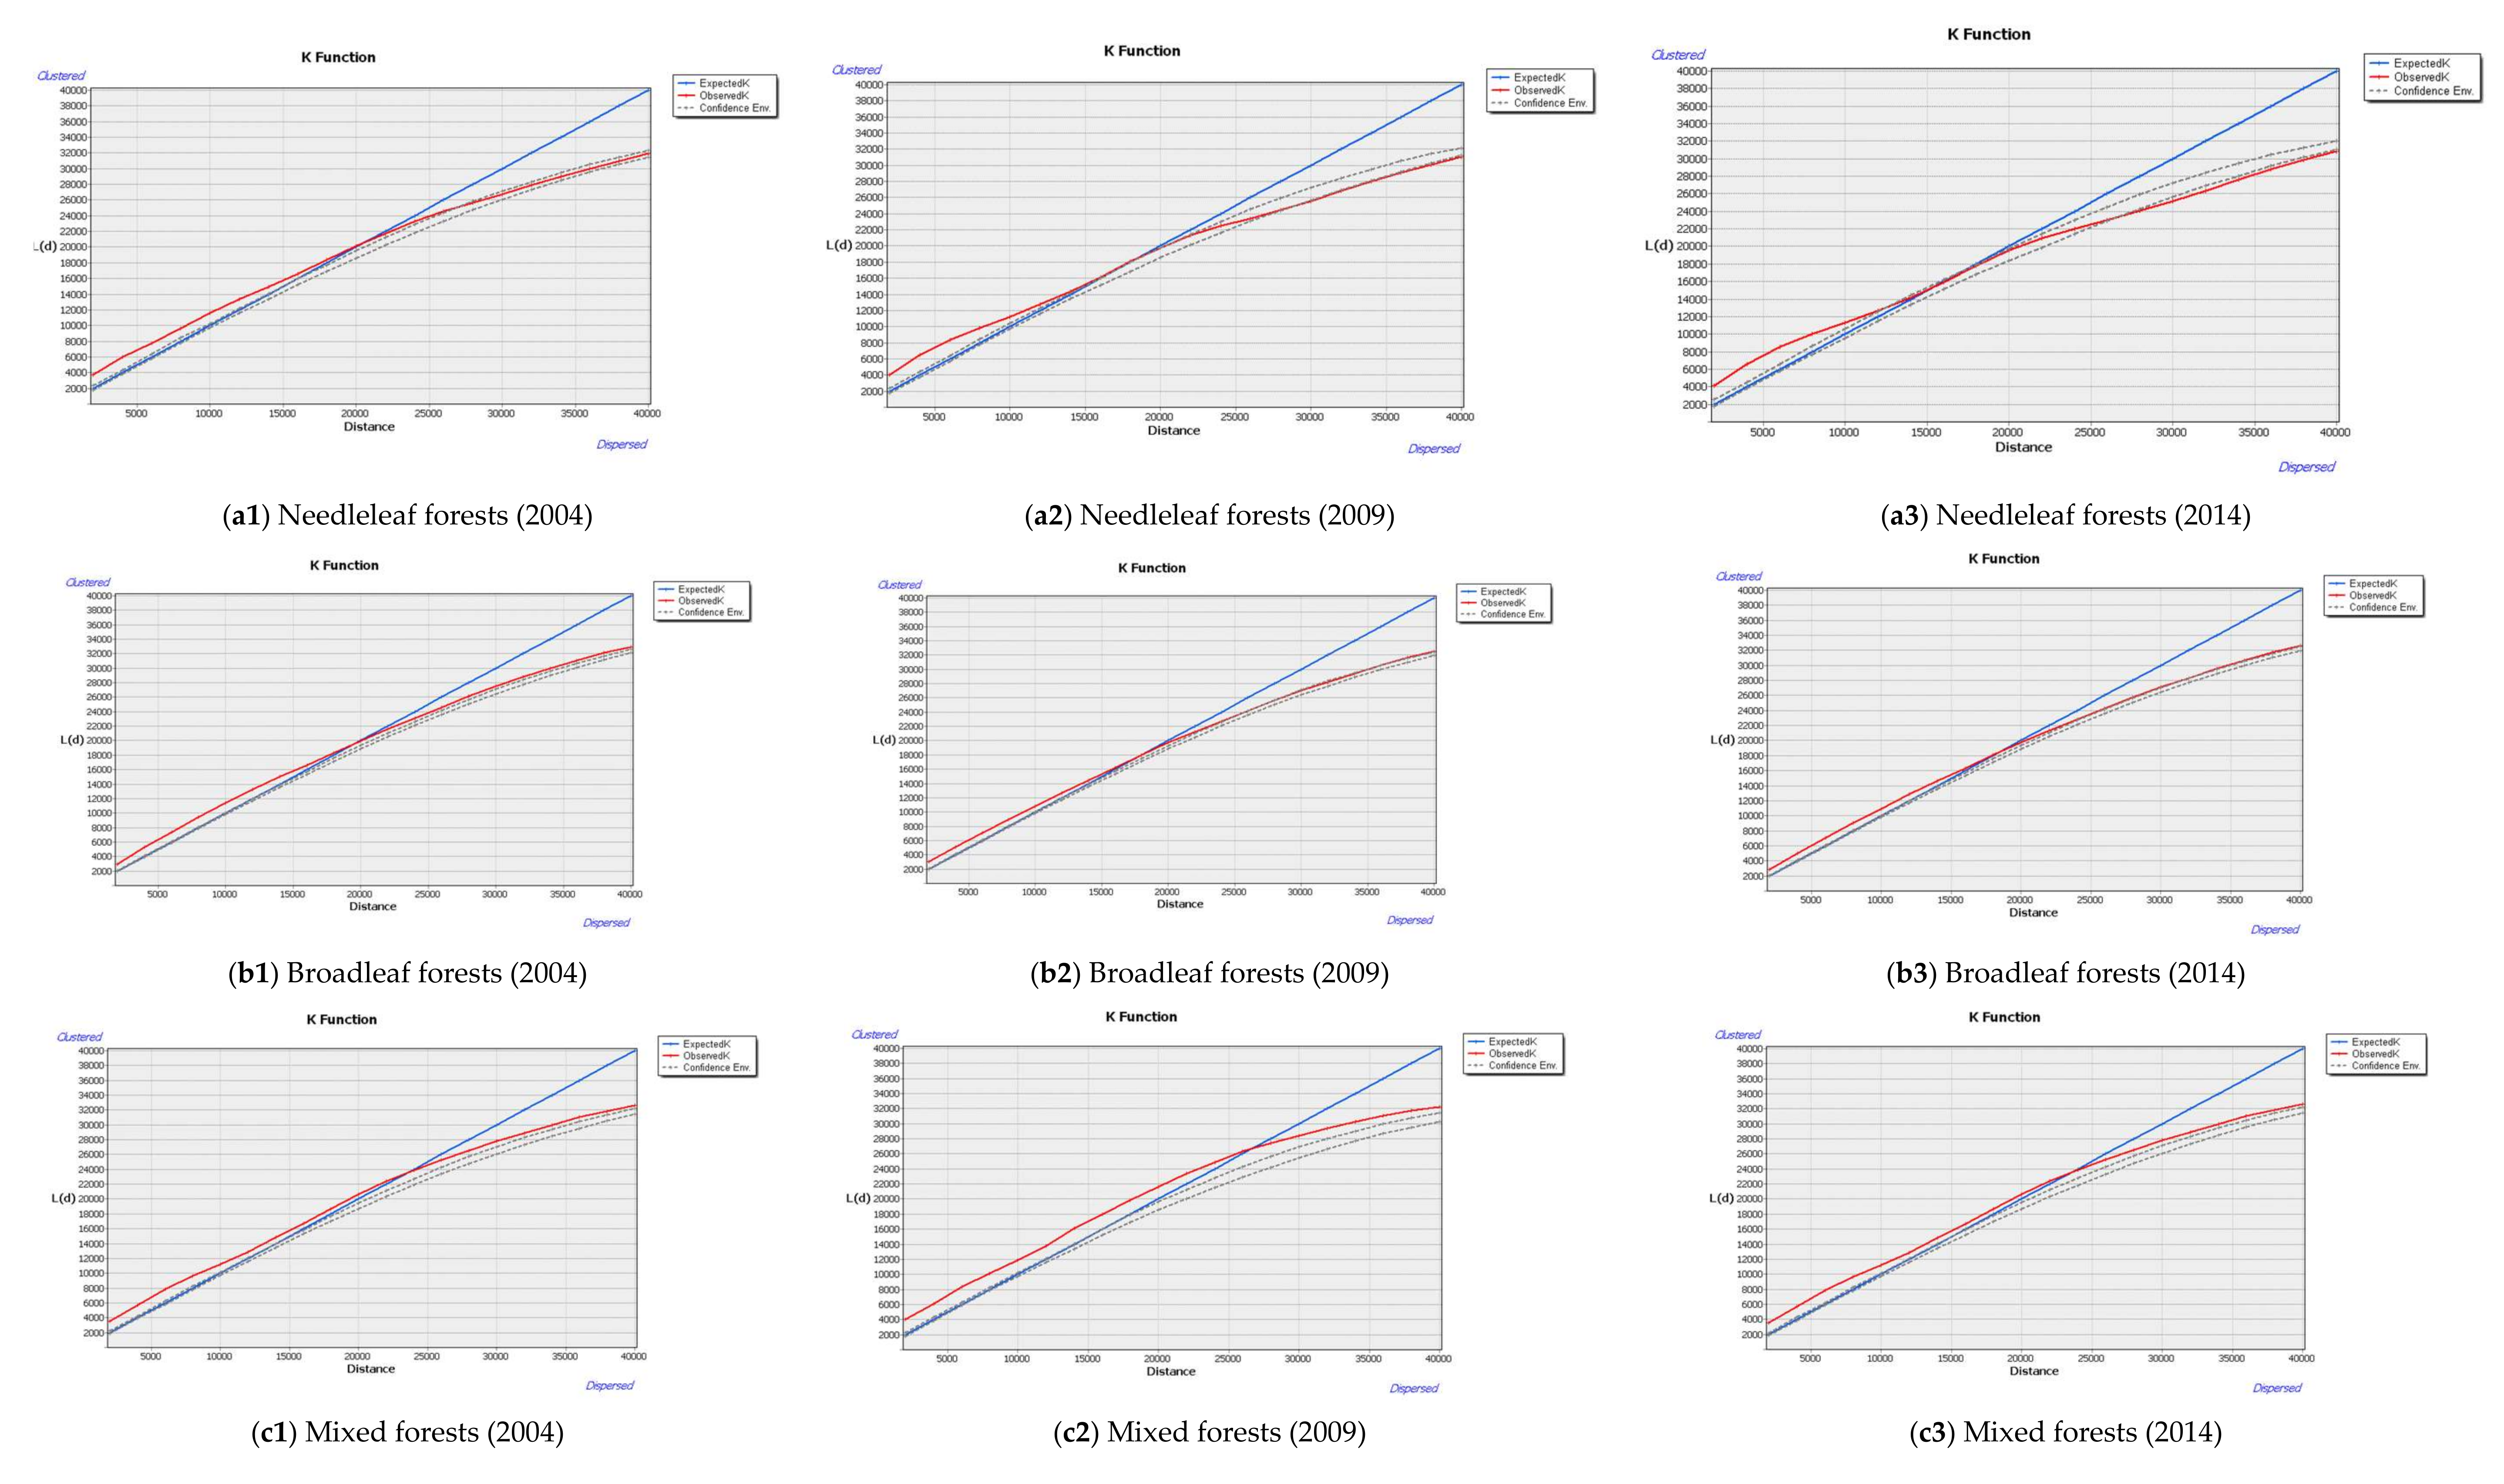
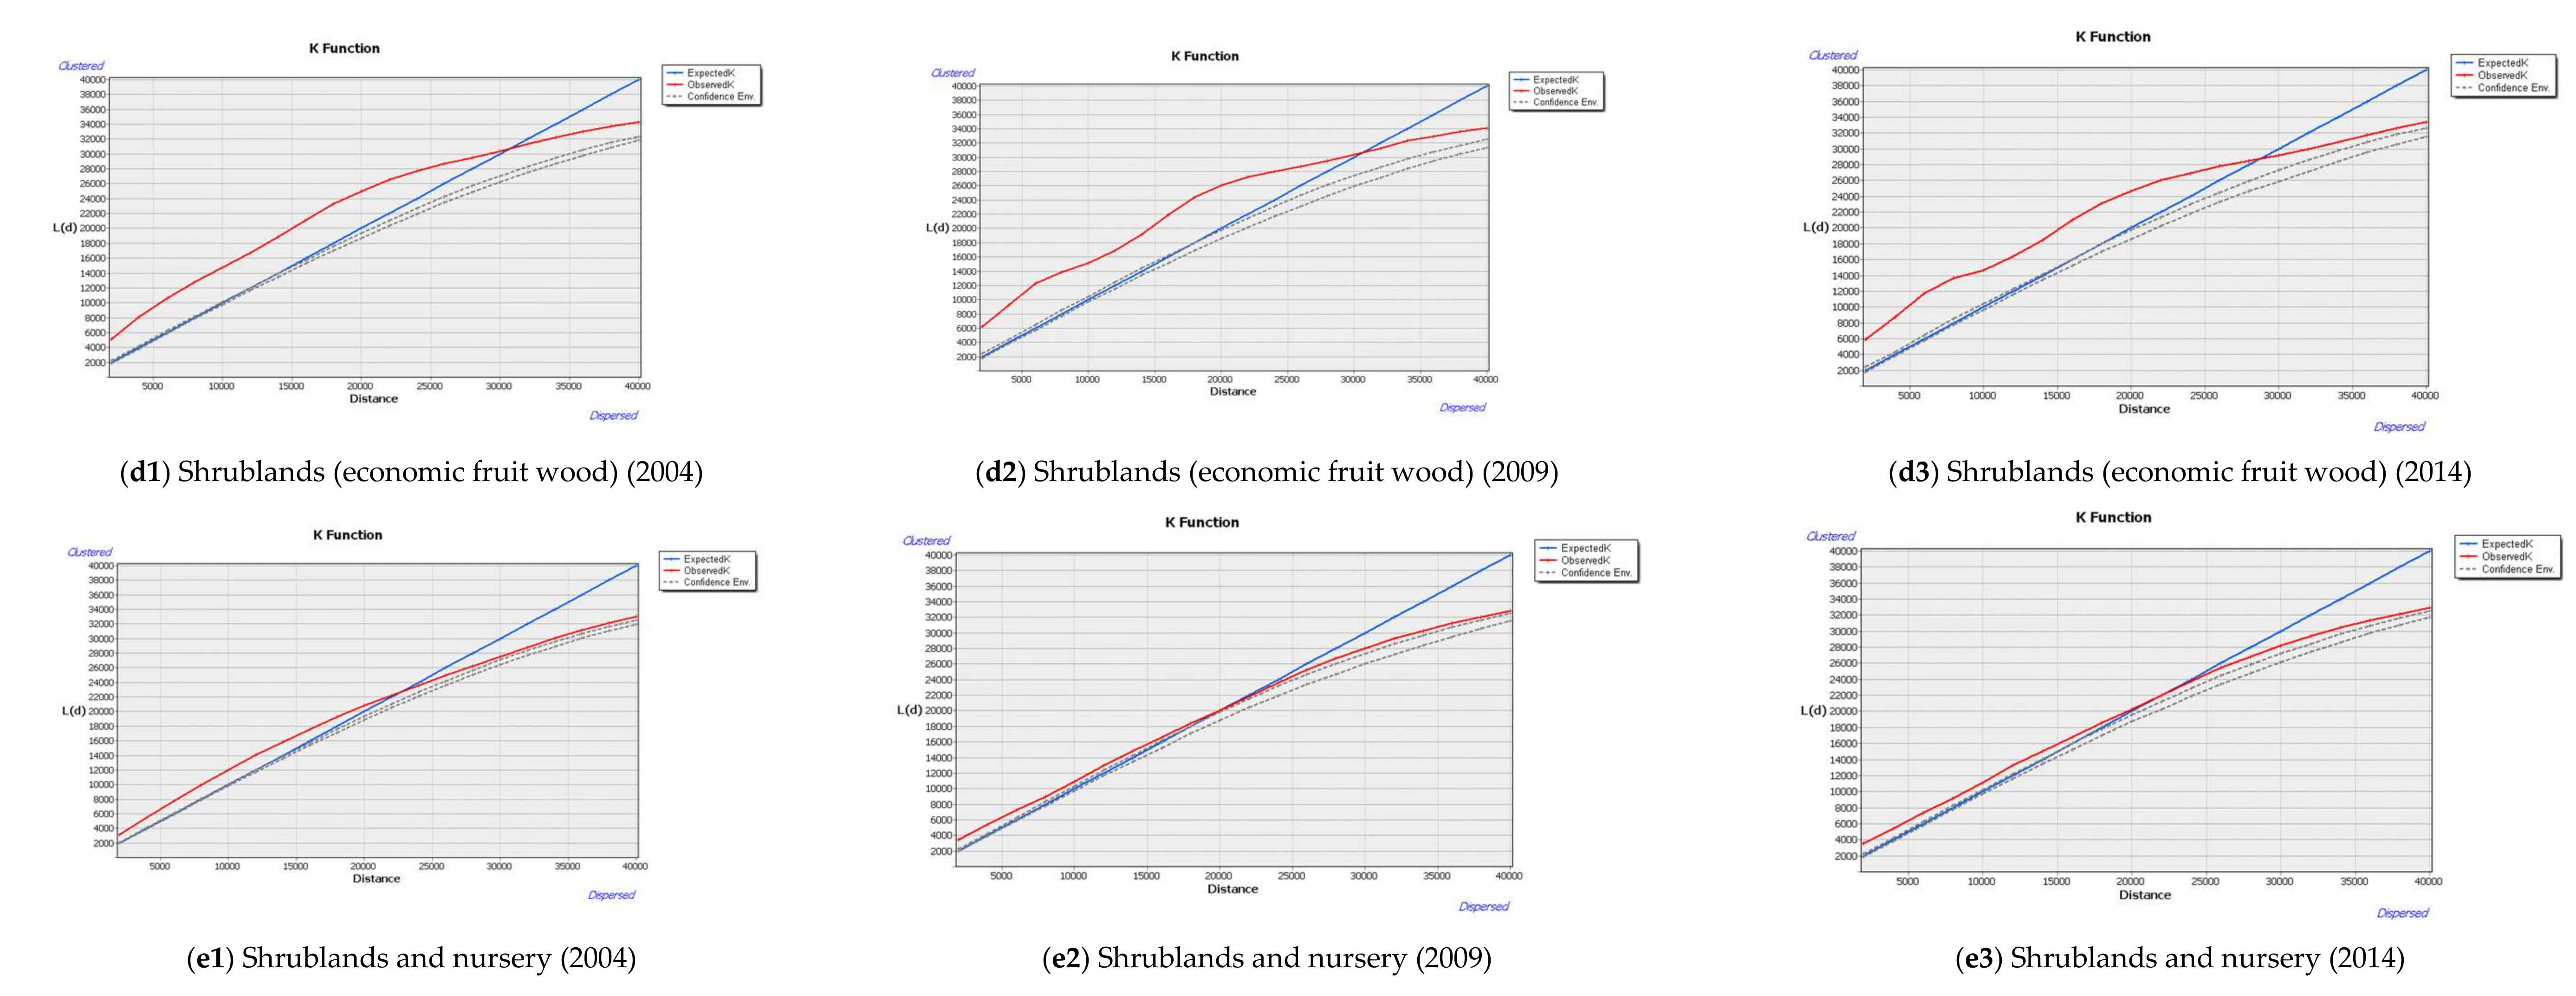
4.2.2. Analysis of the Multiscale Agglomeration Characteristics of Urban Forest Landscape Patterns

To further understand the impact of urbanization on urban forests, we selected urban forests in different division regions to analyze the characteristics of the urban forest landscape structure. In order to further explore the spatial and temporal distribution characteristics of urban forest patches on multiple scales, we selected large-scale patches greater than 1 ha that were believed to contribute to the ecological environment. These patches were transformed into point data to analyze the multiscale characteristics of the urban forest landscape in Shanghai over the past 10 years using ArcGIS (Esri, Redlands, CA, USA) Desktop 10.2 software. We set the distance band to be 20 and the starting distance and increment as 2000 m; additionally, we used the simulated outer boundary values method to correct the underestimation of adjacent points near the edge of the study area. Monte Carlo simulation with a confidence level of 99% was used to test the significance of the Ripley’s L index deviation from randomness.
In terms of time variation (see Figure 14a–c), the dot pattern density in 2004 was higher than that in 2014. In terms of spatial variation, the spatial distribution of the urban forest landscape point patterns in the study area exhibited extremely uneven characteristics. The changes in time and space were the concrete manifestations of the temporal and spatial fluctuations of the forest landscape patterns in the study area. The variation trend of the measured value L(d) of the Ripley’s K function in the multi-scale space was analyzed, and the agglomeration distribution characteristics of urban forest land and the different types of landscape point patterns were analyzed in greater detail (see Figure 14d–f). The L(d) curves of the third-phase urban forest landscapes were essentially outside of the upper and lower envelopes, indicating that the urban forest landscapes exhibited significant local aggregation distribution characteristics at a certain distance at different spatial scales. In 2004, the urban forest landscape point pattern in Shanghai was characterized by a significant aggregation distribution at 22 km; it then began to exhibit discrete distribution characteristics (see Figure 14d). In 2009, the urban forest landscape point pattern in Shanghai was characterized by significant aggregation at 17 km and then began to exhibit discrete distribution characteristics (see Figure 14e). Figure 14f shows that the urban forest landscape point pattern in Shanghai was characterized by a significant aggregation distribution at 16 km in 2014 and then began to exhibit discrete distribution characteristics. Based on the above results, although the spatial density of urban forests in Shanghai increased from 2004 to 2014, the total number of patches comprising an area larger than 5 ha decreased. In the past 10 years, the clustering characteristics of urban forests with large patches have gradually decreased. In 2014, the urban forest landscapes decreased by 5 km compared with the concentration of forests in 2004, which also reflects the overall fragmentation of urban forests in Shanghai. Important large patches are gradually becoming fragmented.
Similarly, we analyzed the spatial aggregation characteristics of the different forest types in Shanghai, in which we selected large patches of one ha. The results are presented in Figure 15. In the same scale range, the aggregation intensity and scales of different forest types are different. The L (d) value increases as the spatial distance increases, and the value gradually moves away from the upper and lower envelopes. The clustering distribution is presented. After a certain distance, the observed K becomes smaller than the expected K and gradually approaches the envelope line. The forest-type landscape presents clustering characteristics on a spatial scale of 14–20 km during 2004–2014, and the forest landscape at the class level and landscape level have certain similarities in terms of their spatial aggregation characteristics.
The needleleaf forest exhibited a significant aggregation distribution within 20 km in 2004 and had a discrete distribution after 20 km (Figure 15(a1–a3)). The aggregation range began at 15 km and then began to show a discrete distribution after 20 km as of 2009. A significant discrete distribution presented after 27.5 km. In 2014, the aggregation range started from 14 km and then presented a discrete distribution, exhibiting a significant discrete distribution at 27.5 km. The clustering range of broadleaf forests in Shanghai ranged from 17.5 km in 2004 to 19 km in 2014 (Figure 15(b1–b3)), and both were significant aggregation distributions, indicating that the primary urban forest type in Shanghai was the broadleaf forest space aggregation. The distribution range was larger than that of needleleaf forests, and the aggregation effect was more evident. The mixed forests in Shanghai accounted for a relatively small proportion. As shown in Figure 15(c1–c3), the spatial aggregation characteristics are primarily expressed at 24 km and gradually increased to 27.5 km from 2009 to 2014. The clustering trend of the patch spatial distribution above 1 ha was less evident. The clustering distributions of special irrigation forests in Shanghai ranged from 30 km in 2004 to 27.5 km in 2009 (Figure 15(d1–d3)). According to the statistics, Shanghai’s special irrigation forests are primarily peach, pear and citrus. After 2009, the citrus in Chongming and peaches in Pudong experienced a large reduction in area. The distribution of shrublands and nurseries showed a significant aggregation distribution from 20 km to 22 km from 2004 to 2014, followed by a discrete distribution (Figure 15(e1–e3)).

5. Discussion

5.1. Evolution of the Spatial Distribution Pattern of Urban Forests in Shanghai

Through an analysis of the characteristics of the overall landscape of Shanghai and the spatial characteristics of the landscape pattern on the urban and rural gradients, it was concluded that although the total forest area in Shanghai reached 101,586 ha in 2014, the forest coverage rate increased from 11.43% to 16.02%. In terms of forest coverage, the global average is 31%, including 64% in Japan, 61% in South Korea, 60% in Norway, 54% in Sweden, 50–60% in Brazil, 44% in Canada, 30% in Germany and 33% in the United States. According to the “Regulations on the Implementation of the Forest Law of the People’s Republic of China” [56], the national forest coverage rate should reach 30%, among which mountain areas should generally be more than 40%, hilly areas should be more than 30%, and plain areas and counties should be more than 10%. Compared with the coverage rates in other similar cities in China, such as Beijing (35.84%) and Hangzhou (64.96%), there is still a large gap in Shanghai, where the forest coverage rate still does not fully meet the requirements of sustainable development for an international metropolis.
The overall urban forest landscape in Shanghai exhibits an uneven forest distribution. The forest coverage rate in the northeast is higher than that in the southwest. The forest area in the southwest is large, but the coverage is relatively low. We classify areas less than 0.05 ha as small patches (IV), areas of 0.05–0.3 ha as medium patches (III), areas of 0.3–1 ha as large and medium patches (II), and areas larger than 1 ha as large patches (I). According to the statistics, the total area of large forest patches with an area larger than 5 ha was 40,308 ha in 2004, which decreased to 34,905.88 ha in 2009 and 33,573.12 ha in 2014. The overall quality of forest patches exhibited a declining trend, and large-scale forest patches were gradually fragmented and broken. As shown in Figure 16 and Figure 17, Shanghai’s forest landscape is dominated by a large number of small- and medium-sized patches. From the spatial distribution data of remote sensing interpretation (using the ecological division city center area as an example), small patches were primarily distributed in urban residential areas, and near roads and water systems, whereas medium patches were distributed in urban parks. For resorts, large patches were predominantly ecological forests, country parks and large-scale public welfare forests. The sum of the small- and medium-sized patches in Shanghai accounted for only 9% of the total area in 2004. However, the patch number accounted for 70% of Shanghai. In 2009 and 2014, the sum of the small and medium patches accounted for 27% of the total area, but the sum of the patches accounted for 88%, which also reflected the tension of Shanghai’s land use.
On the urban–rural gradient, the total amount of forest follows the pattern of outer suburbs > suburban > city center; however, for urban forest coverage, the level in the suburbs is higher than in the outer suburbs and central urban areas. The central urban area is affected by land area, population density, urbanization and other factors. The forest area has less space to increase. Because the suburbs and outer suburbs play an important role in improving the environmental quality of the city center, although the forest area is generally higher in the suburban regions, there is a certain upside. According to analysis of the urban forest landscape pattern in Shanghai, the spatial distribution of forest patches in Shanghai tends to be randomly distributed. Although there are large ecological forests, country parks and large-scale public welfare forests in the suburbs and outer suburbs, the number and area of forest patches have clear advantages; however, because of the limitations associated with economic development, green infrastructure is imperfect, patch uniformity and connectivity are poor, and ecological processes and functions are weak [57]. In the past 10 years, due to the influence of planning and human activities, the fractal dimension of urban forest patches in Shanghai has gradually decreased, the overall appearance of patches are broken, and the landscape patch boundaries are neat and solitary. The ecological processes between the patches are weak, which is not conducive to biodiversity conservation, and small patch areas cannot improve the urban landscape. Therefore, based on the Shanghai Urban Master Plan and the Shanghai Land Use Master Plan, we need to combine the natural geography conditions and climatic conditions of Shanghai, guided by the principles of landscape ecology, from the consistency of urban structure and the coordination of natural geographical conditions. The connectivity of landscape elements, the uniformity of landscape patterns, the hierarchical structure of landscapes, and the integration of landscape elements into the central city and suburban greening need develop simultaneously. In the central city, it is necessary to pay attention to the combination with the garden department to achieve the organic integration of the landscape effect and various ecological functions. In the suburbs, it is necessary to emphasize the ecological function, taking into account the economic function and the landscape effect.

5.2. Discussion of the Factors Affecting Urban Forest Evolution in Shanghai

Shanghai is located at the mouth of the Yangtze River. According to the statistics, Shanghai’s forested area has historically been small, with water comprising 697 km2, equivalent to 11% of the city’s total area. At the beginning of liberation, Shanghai’s total area of cultivated land reached 3750 km2, accounting for approximately 59% of the administrative area. However, with the acceleration of urbanization, Shanghai’s cultivated land area has rapidly decreased and little land remains for forest development. Apart from a small amount of residual yellow-brown soil formed by mountain weathering, the land comprising the vast plain has evolved into different types of agricultural soil under the long-term influence of human activities. Under such environmental conditions, especially given the high population density and tight land resources, the development of Shanghai’s urban forest is a difficult task, requiring more technology than many cities possess. Shanghai lacks natural resources and is characterized by rapid population growth, active production and rapid urban–rural integration. These historical and natural factors have led to a relatively weak foundation for urban forest development in Shanghai; thus, the city has low urban forest coverage and does not meet the requirements of sustainable urban development.
One of the primary features of Shanghai’s urban landscape is the large size and density of the landscape corridors, such as rivers and roads. This pattern creates a cutting effect on urban forest landscapes. Compared with natural factors, the impact of human activities is the primary reason for the change in the urban forest landscape in the study area. According to statistics of the Shanghai Statistical Yearbook, between 2004 and 2014 the total population of Shanghai increased from 18.35 million to 24.26 million. The population density also increased from 2133 people per square kilometer to 3826 people per square kilometer. The rapid population growth has led to the expansion of human settlement. Although the forest area is relatively small compared with the amount of agricultural land that has been developed, the growth rate of the forest cover during the last decade has also increased due to policy-oriented support. However, due to population growth, rapid urbanization has changed the landscape pattern of forests and promoted more intense human activity. Statistics reveal that Shanghai’s GDP exhibited a significant upward trend each year from 2004 to 2014. Economic growth primarily depends on the rapid development of industry, and industrial development also causes particular damage to forest resources. Based on the above problems, the current situation of the urban forest landscape in Shanghai is primarily due to the rapid urbanization that has occurred in recent years, as well as natural, socioeconomic and local government decisions, and national macro policies. Due to the high density of buildings, concentrated population, limited land area, and high degree of urbanization, the central urban area is subject to the greatest human disturbance, resulting in a serious degree of fragmentation.
Shanghai has actively promoted the development of an ecological civilization. Since the country’s reform and opening up, Shanghai has fully implemented the concept of urban forests, implemented planning and greening, and improved policy guidance. In 2001, the Shanghai Urban Forest Planning initiative was launched. In November 2003, the municipal government approved its implementation and promoted Shanghai. Guidelines for the development of the city’s urban ecosystem, e.g., “Shanghai Basic Ecological Network Planning” and “Shanghai Forest Land Protection and Utilization Plan”, have been issued, and focusing on a balanced layout and functional diversity. After 10 years of large-scale urban plantation development, the forest coverage rate reached 12% in 2009, which was approximately double the amount of forest area in 1999 [58]. Under the influence of Shanghai’s ecological development policy, by 2014 Shanghai initially formed an ecological network system of “rings, wedges, corridors, gardens and forests”. However, through an analysis of the urban–rural gradient landscape pattern, the fragmentation index is shown to have increased from the outer suburbs to the central urban area, and the spatial aggregation of large patches has gradually decreased. The spatial structure of urban forests still needs to be strengthened.

6. Conclusions

In this paper, we used multi-source remote sensing data and 3S technology to interpret the spatial distribution data of urban forest resource types in Shanghai from 2004 to 2014, and we used a multiscale landscape analysis method to study landscape patterns in Shanghai. The evolutionary characteristics of urban forest landscapes in different sub-districts and the spatial aggregation characteristics of different forest types led to the following conclusions:
(1)
The urban forest landscape and its patch characteristics meant that the spatial information surveys of the urban forest landscape had to rely on modern information technology, combined with multi-source remote sensing data, RS and GIS technology for urban forest landscape surveys. In addition, automatic/semiautomatic extraction is an inevitable trend and a requirement to obtain the time series of urban forest classification information. According to the research, using remote sensing big data combined with forest resource survey business data, the accuracy of the semiautomatic interpretation results generally met the research and analysis needs. The spatial morphological characteristics of the terrestrial patches obtained by this interpretation were spatial reflections of the combined effects of human disturbance and habitat. The development of urban forests requires a holistic and systematic framework. It is necessary to formulate a plan that is human-oriented, and the coordinated development of humans and nature according to the analysis of the status of forest ecological resources, environment and ecological division is important. By analyzing the spatial distribution pattern of the urban forest landscape in Shanghai, the results contribute to the rational planning and layout of urban forests, improve the quality of urban forests, and effectively assess the role of ecosystem services.
(2)
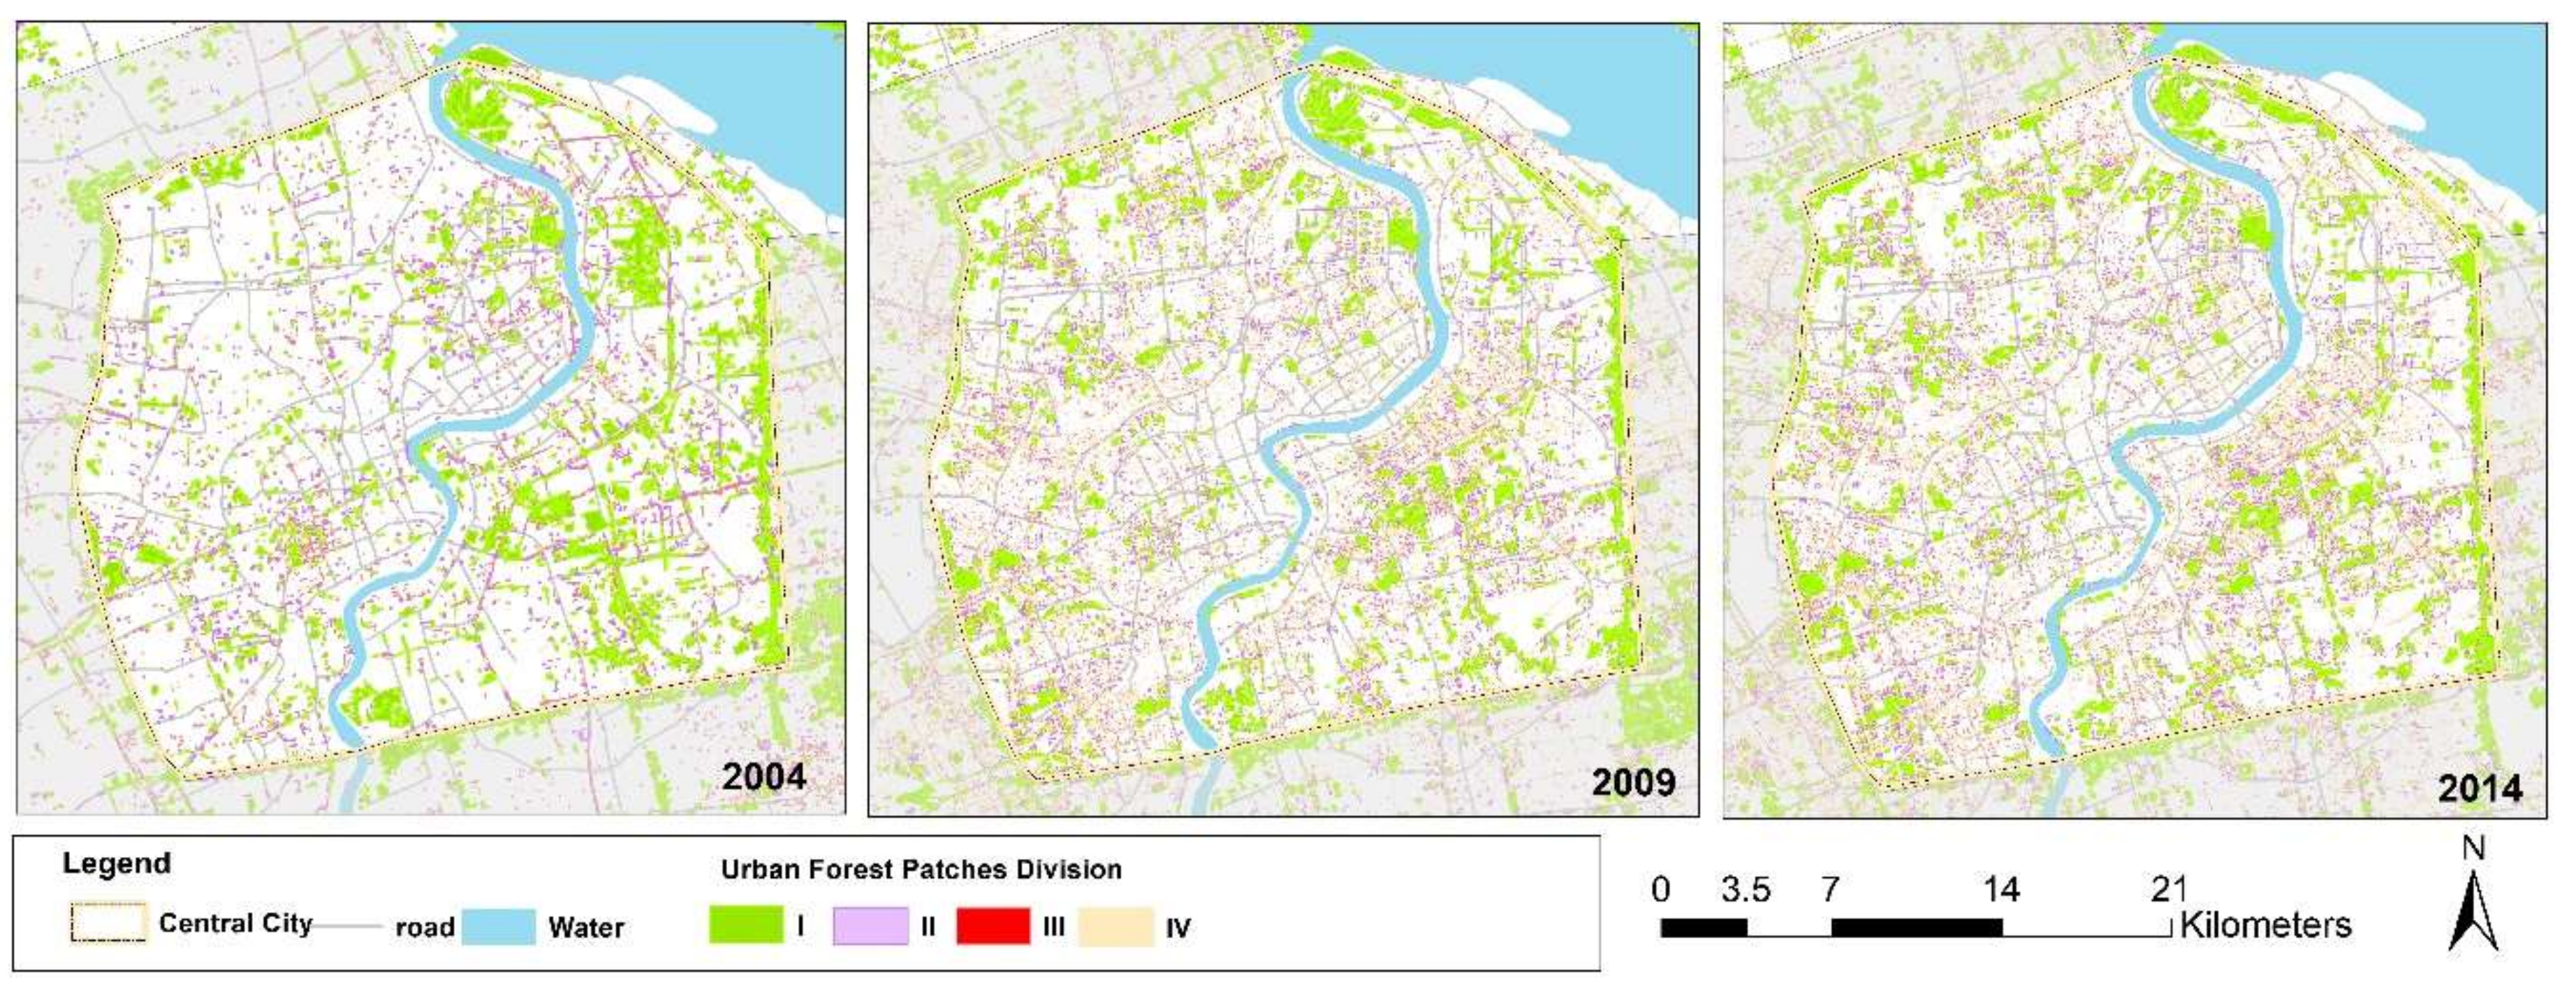
The analysis of the urban forest landscape pattern characteristics and the urban–rural gradient zoning characteristics in Shanghai showed that the spatial distribution of the urban forest landscape in Shanghai is essentially consistent with the urban geomorphological pattern. Although the forest coverage rate has increased in some places, the spatial distribution area is noticeably different, the regional difference is large, and the overall quality of the landscape is not high. Large seminatural and near-natural landscape patches are less common, especially near the central urban area, where the forest coverage is lower, and the patches are more fragmented. The analysis of the urban forest landscape pattern in different urban and rural gradient zones showed that the formation, distribution and type differentiation of urban forest landscape ecosystems in Shanghai were closely related to the geographical differentiation of the natural environment, and the regional differences in the landscape ecological characteristics were evident. Under the strong interference of human activities, the urban forest landscape has a high degree of fragmentation, the patch shape area is simple and more regular, and the comprehensive function of the landscape ecosystem is weakened, which weakens the function of improving the urban ecological and environmental quality. The regional differences in the ecological characteristics of the urban forest landscapes are the result of the combination of natural environmental differentiation, historical development, and socioeconomic and cultural traditions. Due to urban planning and zoning, the regional differences in the urban forest landscape’s ecological characteristics have further increased.
(3)
It is a feasible countermeasure to develop high-quality urban forests in urban suburbs by learning from foreign experiences. Currently, Shanghai’s research on the landscape ecology of urban greening has begun to focus on the development of green corridors for roads and water systems. Urban green belts in the outer ring of the city have been developed and have created favorable conditions for Shanghai to build urban forest systems. According to Shanghai’s land-use status data, it is very costly to increase the urban forest coverage in the city center. Therefore, Shanghai should consider maintaining the integrity of the ecosystem while considering optimization of the distribution, such as the area, shape, density, agglomeration, diversity, uniformity and accessibility of the green patches. On the landscape scale, these scattered and isolated system units should be rationally planned and distributed, and the urban forest open space should be connected to a network through a combination of urban forest “points”, “lines”, “faces”, “wedges” and “rings”. This connection not only acts as an outer ring to restrain the expansion of the city to the countryside, but also introduces the natural elements of the outer suburbs into the city through these networks; thus, these features connect the different regions as a whole through a large number of core forest lands, small green areas, forest belts and other forms, and this system forms an urban forest ecosystem with a uniform distribution and complete ecosystem functions.

Author Contributions

Y.L. had the original idea for this study, wrote the paper, completed the literature review and analyzed the data. H.S. and C.X. processed the data; G.S. drew the analysis figures and read the literature. N.J. reviewed the paper structure and gave advice to the methodology design. All authors have read and approved the final manuscript.

Funding

This research was undertaken at the Nanjing Normal University, School of Geography and funded by the National Natural Science Foundation of China (NO.: 41601449; 41501431; 41771421), the Natural Science Foundation of the Jiangsu Higher Education Institutions of China (NO.: 16KJD420002), and the Priority Academic Program Development of Jiangsu Higher Education Institutions (NO.: 164320H116)

Acknowledgments

Acknowledgments for the data support from the Yangtze River Delta Science Data Center. National Earth System Science Data Sharing Infrastructure, National Science and Technology Infrastructure of China (http://nnu.geodata.cn).

Conflicts of Interest

The authors declare that they have no conflict of interest.

References

  1. Johnston, M. A brief history of urban forestry in the United States. Arboricult. Assoc. J. 1996, 20, 257–278. [Google Scholar] [CrossRef]
  2. Jorgensen, E. Urban forestry in Canada. Arborists News 1971, 46, 529. [Google Scholar] [CrossRef]
  3. Lawrence, H.W. The neoclassical origins of modern urban forests. For. Conserv. Hist. 1993, 37, 26–36. [Google Scholar] [CrossRef]
  4. Turner, M.G.; Gardner, R.H.; O’Neill, R.V. Landscape ecology in theory and practice. Geography 2003, 83, 479–494. [Google Scholar]
  5. Konijnendijk, C.C. A decade of urban forestry in Europe. For. Policy Econ. 2003, 5, 173–186. [Google Scholar] [CrossRef]
  6. Yin, K.; Zhao, Q.J.; Cui, S.H.; Lin, T.; Shi, L.Y. Progresses in urban forest and landscape pattern. Acta Ecol. Sin. 2009, 29, 389–398. [Google Scholar] [CrossRef]
  7. Zhu, W.; He, X.; Chen, W. Advances in Urban Forest. Chin. J. Ecol. 2001, 20, 55–59. [Google Scholar] [CrossRef]
  8. Huang, G.; Xu, D.X.; Su, P. Relationship between eco-environment construction and urban forestry in Shanghai. Chin. J. Ecol. 2004, 23, 119–124. [Google Scholar] [CrossRef]
  9. Song, Y.C. Analysis of Several Problems in Studies of Urban Forest. J. Chin. Urban For. 2004, 1, 4–9. [Google Scholar] [CrossRef]
  10. Rowntree, R.A. Ecology of the urban forest: Introduction to part III. Landsc. Urban Plan. 1988, 15, 1–10. [Google Scholar] [CrossRef]
  11. Rowntree, R.A. Ecology of the urban forest—Introduction to part II. Urban Ecol. 1986, 9, 229–243. [Google Scholar] [CrossRef]
  12. Bai, J.; Peng, D.; Yu, X.H.; Zheng, X. Research advances in forest landscape ecology. Chin. J. Ecol. 2005, 24, 943–947. [Google Scholar] [CrossRef]
  13. Ouyang, Z.Y.; Wang, X.K.; Miao, H. A primary study on Chinese terrestrial ecosystem services and their ecological-economic values. Acta Ecol. Sin. 1999, 19, 607–613. [Google Scholar] [CrossRef]
  14. Wu, J.G. Landscape Ecology Pattern, Process, Scale and Hierarchy; Higher Education Press: Beijing, China, 2007; ISBN 978-7-04-020879-5. [Google Scholar]
  15. Zhang, N. Scale issues in ecology: Concepts of scale and scale analysis. Acta Ecol. Sin. 2006, 26, 2340–2355. [Google Scholar] [CrossRef]
  16. Husté, A.; Boulinier, T. Determinants of Local Extinction and Turnover Rates in Urban Bird Communities. Ecol. Appl. 2007, 17, 168–180. [Google Scholar] [CrossRef]
  17. Zhu, W.Q.; He, X.Y.; Chen, W.; Chen, Y.H.; Zhang, Y.; Ning, Z.H. Quantitative analysis of urban forest structure: A case study on Shenyang arboretum. Chin. J. Appl. Ecol. 2003, 14, 2090–2094. [Google Scholar]
  18. Zhao, T.Q.; Ouyang, Z.Y.; Zheng, H.; Wang, X.K.; Miao, H. Forest ecosystem services and their valuation in China. J. Nat. Resour. 2004, 4, 480–491. [Google Scholar] [CrossRef]
  19. Baker, W.L. A review of models of landscape change. Landsc. Ecol. 1989, 2, 111–133. [Google Scholar] [CrossRef]
  20. Chen, W.X.; Yang, X.R.; Li, Z.Q. The Analysis of Forest Landscape Patterns in East Dongting Lake Region Based on 3S Technology. Chin. Agric. Sci. Bull. 2015, 31, 1–9. [Google Scholar] [CrossRef]
  21. Zellweger, F.; Morsdorf, F.; Purves, R.S.; Braunisch, V.; Bollmann, K. Improved methods for measuring forest landscape structure: LiDAR complements field-based habitat assessment. Biodivers. Conserv. 2014, 23, 289–307. [Google Scholar] [CrossRef]
  22. He, H.S.; Yang, J.; Shifley, S.R.; Thompson, F.R. Challenges of forest landscape modeling—Simulating large landscapes and validating results. Landsc. Urban Plan. 2011, 100, 400–402. [Google Scholar] [CrossRef]
  23. Xi, W.; Coulson, R.N.; Birt, A.G.; Shang, Z.; Waldron, J.D.; Lafon, C.W.; Cairns, D.M.; Tchakerian, M.D.; Klepzig, K.D. Review of forest landscape models: Types, methods, development and applications. Acta Ecol. Sin. 2009, 29, 69–78. [Google Scholar] [CrossRef]
  24. Dai, E.; Wu, Z.; Wang, X.F.; Fu, H.; Xi, W.M.; Pan, T. Progress and prospect of research on forest landscape model. J. Geogr. Sci. 2015, 25, 113–128. [Google Scholar] [CrossRef]
  25. Orsi, F.; Church, R.L.; Geneletti, D. Restoring forest landscapes for biodiversity conservation and rural livelihoods: A spatial optimisation model. Environ. Model. Softw. 2011, 26, 1622–1638. [Google Scholar] [CrossRef]
  26. Liang, Y.Y.; Zhou, N.X.; Xie, H.W.; Jiang, M.P. Long-term dynamic simulation on forest landscape pattern changes in Mount Lushan. Acta Ecol. Sin. 2013, 33, 7807–7818. [Google Scholar] [CrossRef]
  27. Xi, W.M.; Dai, E.Z.; He, H.S. Advances in forest landscape modeling: Current research and applications. Prog. Geogr. 2016, 35, 35–46. [Google Scholar] [CrossRef]
  28. Jia, Z.M.; Ma, B.R.; Zhang, J.; Zeng, W.H. Simulating spatial-temporal changes of land-use based on ecological redline restrictions and landscape driving factors: A case study in Beijing. Sustainability 2018, 10, 1299. [Google Scholar] [CrossRef]
  29. Mather, A.S.; Fairbairn, J.; Needle, C.L. The course and drivers of the forest transition: The case of France. J. Rural Stud. 1999, 15, 65–90. [Google Scholar] [CrossRef]
  30. Matlack, G.R. Four centuries of forest clearance and regeneration in the hinterland of a large city. J. Biogeogr. 1997, 24, 281–295. [Google Scholar] [CrossRef]
  31. Aghnoum, M.; Feghhi, J.; Makhdoum, M.; Amiri, B.J. Assessing the environmental impacts of forest management plan based on matrix and landscape degradation model. J. Agric. Sci. Technol. 2014, 16, 841–850. [Google Scholar]
  32. Berland, A.; Shuman, B.; Manson, S.M. Simulated importance of dispersal, disturbance, and landscape history in long-term ecosystem change in the big woods of Minnesota. Ecosystems 2011, 14, 398–414. [Google Scholar] [CrossRef]
  33. Hu, M.J.; Hou, G.L.; Zhou, N.X.; Li, Z.J.; Qi, X.Y.; Fang, Y.L. Spatial distribution patterns and multi-scale features of the Lushan forest landscape. Acta Ecol. Sin. 2015, 35, 5294–5305. [Google Scholar] [CrossRef]
  34. Dong, L.B.; Liu, Z.G.; Zhang, B. Forest landscapes’ spatial point patterns and associations based on Ripley L and O-ring functions. Chin. J. Appl. Ecol. 2014, 25, 3429–3436. [Google Scholar] [CrossRef]
  35. Wu, W.; Li, Y.H.; Hu, Y.M.; Xiu, C.L.; Yan, X.L. Impacts of changing forest management areas on forest landscapes and habitat patterns in northeastern China. Sustainability 2018, 10, 1211. [Google Scholar] [CrossRef]
  36. Gao, K.; Zhou, Z.X.; Yang, Y.P.; Li, H. Characteristics and changes of landscape pattern in Wuhan City based on Ripley’s K function. Chin. J. Appl. Ecol. 2010, 21, 2621–2626. [Google Scholar] [CrossRef]
  37. Popelková, R.; Mulková, M. The mining landscape of the ostrava-karviná coalfield: Processes of landscape change from the 1830s to the beginning of the 21st century. Appl. Geogr. 2018, 90, 28–43. [Google Scholar] [CrossRef]
  38. Liu, Y.X.; Ge, D.B.; Wang, D. Study on landscape pattern in Pingjiang country based on ripley’s K. J. Hunan Ecol. Sci. 2017, 4. [Google Scholar]
  39. Guo, X.Y.; Li, W.L.; Da, L.J. Near-natural silviculture: Sustainable approach for urban renaturalization? assessment based on 10 years recovering dynamics and eco-benefits in shanghai. J. Urban Plan. Dev. 2015, 141, A5015001. [Google Scholar] [CrossRef]
  40. Li, J.; Fang, W.; Wang, T.; Qureshi, S.; Alatalo, J.M.; Bai, Y. Correlations between socioeconomic drivers and indicators of urban expansion: Evidence from the heavily urbanised Shanghai metropolitan area, China. Sustainability 2017, 9, 1199. [Google Scholar] [CrossRef]
  41. Ruan, J.J.; Su, J.H.; Wang, Q. Changes of Urban Ecological Space by Policy Driven: A Case Study of Chongming Island. Ecol. Econ. 2016, 32, 155–158. [Google Scholar]
  42. Wu, J.L. Urban Growth Mode and Urban Landscape Pattern Dynamics in Shanghai. Master’s Thesis, East China Normal University, Shanghai, China, 2015. [Google Scholar]
  43. Hu, T.H. Time and Spatial Dynamic Research of Ecological Footprint in Chongming Island, Shanghai, China. Master’s Thesis, East China Normal University, Shanghai, China, 2011. [Google Scholar]
  44. Guo, C.B.; Xu, W.W. Studies on the Planning and Implementation of Shanghai Basic Ecological Network. Shanghai Urban Plan. Rev. 2012, 6, 55–59. [Google Scholar]
  45. Xu, F. Study on Community Structure and Carbon Fixation of Urban Forest in Shanghai, China. Master’s Thesis, East China Normal University, Shanghai, China, 2010. [Google Scholar]
  46. Fang, H.J. Study and Assessment on the Artificial Plant Community in Urban Spaces of Shanghai City. Master’s Thesis, East China Normal University, Shanghai, China, 2006. [Google Scholar]
  47. Tian, Z.H. Study on Distribution Pattern of Weed Communities of Terrestrial Ecosystem and Forming Reason in Urban and Rural of Shanghai. Ph.D. Thesis, East China Normal University, Shanghai, China, 2011. [Google Scholar]
  48. Guo, X.Y. Multi-Scale Assessments on Ecological Quality of Urban Forest in Shanghai. Ph.D. Thesis, East China Normal University, Shanghai, China, 2017. [Google Scholar]
  49. Gao, X.W.; Dai, Y.M.; Han, J.; Liu, Z.Y.; Niu, X.; Liu, C.J.; Yin, B.; Wang, B. Study on Monitoring Layout and Network Construction of Forest Ecosystem in Shanghai; China Forestry Publishing House: Beijing, China, 2016; ISBN 978-7-50-388890-8. [Google Scholar]
  50. McGarigal, K.; Cushman, S.; Ene, E. FRAGSTATS v4: Spatial Pattern Analysis Program for Categorical and Continuous Maps. Computer Software Program Produced by the Authors at the UNIVERSITY of Massachusetts, Amherst. Available online: http://www.umass.edu/landeco/research/fragstats/fragstats.html (accessed on 24 November 2018).
  51. Ripley, B.D. The second-order analysis of stationary point processes. J. Appl. Probab. 1976, 13, 255–266. [Google Scholar] [CrossRef]
  52. Barendregt, L.G.; Rottschäfer, M.J. A statistical analysis of spatial point patterns a case study. Stat. Neerl. 2010, 45, 345–363. [Google Scholar] [CrossRef]
  53. Lefort, V.; Pijaudier-Cabot, G.; Grégoire, D. Analysis by ripley’s function of the correlations involved during failure in quasi-brittle materials: Experimental and numerical investigations at the mesoscale. Eng. Fract. Mech. 2015, 147, 449–467. [Google Scholar] [CrossRef]
  54. Wiegand, T.; Moloney, K.A. Rings, circles, and null-models for point pattern analysis in ecology. Oikos 2004, 104, 209–229. [Google Scholar] [CrossRef] [Green Version]
  55. Marcon, E.; Puech, F. Generalizing ripley’s k function to inhomogeneous populations. Work. Pap. 2009, 12, 160–172. [Google Scholar]
  56. Chen, G.C.; Zhang, L.P. Comparison between the implementation regulations of forest law and the original implementation rules. Zhejiang For. 2000, 2, 18–20. [Google Scholar]
  57. Zhang, D. Spatial-temporal Changes of Urban Forest Structure and Carbon Storage under Rapid Urbanization: A Case Study in Changchun. Ph.D. Thesis, Northeast Institute of Geography and Agroecology, CAS, Changchun, China, 2015. [Google Scholar]
  58. Yao, X.; Zhao, M. The Impact of Urbanization on the Composition and Structure of Urban Forest. J. Nat. Resour. 2017, 32, 1113–1124. [Google Scholar] [CrossRef]
  59. Shen, W.; Jenerette, G.D.; Wu, J.; Gardner, R.H. Evaluating empirical scaling relations of pattern metrics with simulated landscapes. Ecography 2010, 27, 459–469. [Google Scholar] [CrossRef]
Figure 1. Location of the study area and its boundary (from the Shanghai Surveying Mapping Institute).
Sustainability 10 04397 g001
Figure 2. Urban and rural gradient division map.
Sustainability 10 04397 g002
Figure 3. Forest landscape mapping process using remote sensing data (2004, 2009, and 2014).
Sustainability 10 04397 g003
Figure 4. Forest landscape map of Shanghai for the years 2004, 2009, and 2014.
Sustainability 10 04397 g004
Figure 5. Shanghai forest resource distribution statistics (urban forest cover statistics).
Sustainability 10 04397 g005
Figure 6. The values of the landscape metrics for forest in Shanghai from 2004 to 2014: (a) the value of TA-NP-AREA_MN-LPI; (b) the value of PAFRAC-CONTIG_MN; (c) the value of PD-COHESION-ENN_MN-IJI; (d) the value of SHDI-SIEI.
Sustainability 10 04397 g006
Figure 7. The landscape metric values for forest type in Shanghai from 2004 to 2009: (a) the value of Class area (CA); (b) the value of Percentage of landscape (PLAND); (c) the value of Patch area (AREA_MN); (d) the value of Largest patch index (LPI); (e) the value of Perimeter-area fractal dimension (PAFRAC); (f) the value of Euclidean nearest neighbor distance(ENN_MN).
Sustainability 10 04397 g007
Figure 8. The landscape structure (area and edge metrics values) for urban forest in Shanghai for division areas from 2004 to 2014: (a) the value of Total landscape area (TA); (b) the value of Number of patches (NP); (c) the value of Patch area (AREA_MN).
Sustainability 10 04397 g008aSustainability 10 04397 g008b
Figure 9. The landscape structure (aggregation metrics values) for urban forests in Shanghai for division areas from 2004 to 2014: (a) the value of Interspersion and juxtaposition index (IJI); (b) the value of Patch cohesion index (COHESION); (c) the value of Patch density (PD).
Sustainability 10 04397 g009
Figure 10. The landscape structure (shape and diversity metrics values) for urban forests in Shanghai for division areas from 2004 to 2014: (a) the value of Perimeter-area fractal dimension (PAFRAC); (b) the value of Contiguity index distribution (CONTIG_MN); (c) the value of Shannon’s diversity index (SHDI).
Sustainability 10 04397 g010
Figure 11. The charts of Class area (CA) values for forest types in different zones from 2004 to 2014: (a) the value of TA for the forest type in Shanghai; (b) pie charts of Class area (CA) values for the forest types in different zones.
Sustainability 10 04397 g011aSustainability 10 04397 g011bSustainability 10 04397 g011c
Figure 12. The landscape metric values (NP) for urban forest types in Shanghai for division areas from 2004 to 2014.
Sustainability 10 04397 g012
Figure 13. The landscape metric values (PD) for urban forest types in Shanghai for division areas from 2004 to 2014.
Sustainability 10 04397 g013
Figure 14. Ripley’s L (d) index distribution of the forest landscape in Shanghai from 2004 to 2014.
Sustainability 10 04397 g014
Figure 15. Ripley’s L (d) index distribution of different types of forest landscapes in Shanghai from 2004 to 2014.
Sustainability 10 04397 g015aSustainability 10 04397 g015b
Figure 16. The number and area of urban forest patch division in Shanghai (central city).
Sustainability 10 04397 g016
Figure 17. The number and area of urban forest patch division in Shanghai.
Sustainability 10 04397 g017
Table 1. Range and area of different regions on an urban–rural gradient.
Division Method.Administrative DivisionEcological Space Division
Range NameDowntown (C)Suburbs (S1)Outer Suburbs (R1)Central City (U)Periphery of Central (S2)
Area (ha)27,176262,910377,05669,92095,279
RegionPutuo, Yangpu, Xuhui, Changning, Zhabei, Hongkou, Huangpu, JinganPudong New Area, Jiading, Minhang, BaoshanChongming, Fengxian, Qingpu, Songjiang, JingshanHongkou, Zhabei, Jingan, Huangpu, Yangpu, Putuo, Changning, Pudong, Baoshan, Jiading, MinhangBaoshan, Jiading, Minhang, Qingpu, Songjiang, Pudong
Table 2. Summary table of landscape metrics (all formulas available in [50]).
Landscape StructureLandscape Metric AbbreviationAnalysis Level
Area and Edge MetricsNumber of patchesNP L/C
Total landscape area (ha)TA L
Class areaCA C
Largest patch indexLPI L/C
Percentage of landscapePLAND C
Patch area (mean)AREA_MNL/C
Shape MetricsPerimeter-area fractal dimensionPAFRAC L/C
Contiguity index distributionCONTIG_MN L/C
Aggregation MetricsPatch density (#/100 ha)PD L/C
Interspersion and juxtaposition indexIJI L/C
Patch cohesion indexCOHESION C
Aggregation indexAI L/C
Euclidean nearest neighbor distance (mean)ENN_MN C
Splitting indexSPLITC
Diversity MetricsSimpson’s evenness IndexSIEI L
Shannon’s diversity indexSHDI L
Table 3. Statistics on the distribution of urban forest in Shanghai.
Area/haLand AreaForest Area 2004/km2Forest Area 2009/km2Forest Area 2014/km2Forest Coverage 2004/%Forest Coverage 2009/%Forest Coverage 2014/%
Downtown28,944 2006 3617 3796 6.93 12.50 13.11
Minhang37,168 4366 6481 6900 11.75 17.44 18.56
Baoshan28,608 2732 4673 5076 9.55 16.34 17.74
Jiading46,390 3694 5592 6444 7.96 12.05 13.89
Pudong121,041 16,973 19,049 18,891 14.02 15.74 15.61
Jinshan58,605 4734 6533 6950 8.08 11.15 11.86
Songjiang60,471 7771 9733 9700 12.85 16.09 16.04
Qingpu67,044 5270 8663 8866 7.86 12.92 13.22
Fengxian68,739 6418 8394 8767 9.34 12.21 12.75
Chongming117,040 18,493 26,073 26,197 15.80 22.28 22.38
Table 4. Landscape metrics at the landscape level.
Area and Edge MetricsShape MetricsAggregation MetricsDiversity Metrics
YearTANPLPIAREA_MNPAFRACCONTIG_MNPDENN_MNCOHESIONIJISHDISIEI
200472455.40 60630.000.101.201.350.398.68153.9891.7379.461.300.84
200998807.28 259287.000.060.381.480.1937.0676.9388.3871.771.120.69
2014101586.44 270109.000.050.381.490.1938.6074.7887.5672.541.120.68

