Article

Climate Change Vulnerability Assessment and Adaptation of Bangladesh: Mechanisms, Notions and Solutions

by
Md Aboul Fazal Younus
1,2,* and
Md Alamgir Kabir
3,4
1
Geography, Environment and Population, School of Social Sciences, The University of Adelaide, Adelaide 5005, South Australia, Australia
2
The Bangladesh Australia Hub Inc., Windsor Gardens 5087, South Australia, Australia
3
Bangladesh High Commission, Rue de Lausanne 65, 1202 Genève, Switzerland
4
Senior Assistant Secretary, The Government of Bangladesh, Dhaka 1000, Bangladesh
*
Author to whom correspondence should be addressed.
Sustainability 2018, 10(11), 4286; https://doi.org/10.3390/su10114286
Submission received: 9 October 2018 / Revised: 10 November 2018 / Accepted: 12 November 2018 / Published: 19 November 2018

Abstract

:
The concept of household vulnerability along with sustainable livelihoods has currently emerged as a significant concept in the climate change vulnerability and adaptation (CCVA) literature. In this paper, the vulnerability of Bangladesh has been assessed by using multiple regression analysis where twenty two effective variables have been chosen from the surveyed data given by Bangladesh Bureau of Statistics. The vulnerability has been functioned by three main stream components: Exposure, sensitivity and adaptive capacity, which have been adopted from the reports of Inter-Governmental Panel on Climate Change (IPCC) and other scientific literature. Based on the higher significance and coefficient values, the variables, which have direct relationships and impact on income and illness, have been identified and prioritized. Household income and illness are the known driving forces for assessing the vulnerability. The motion of centripetal and centrifugal forces in decision making mechanisms, which are the main driving contributions of this paper, have been dealt as a new way to envisioning vulnerability and adaptation decision. Based on the prioritized variables some actions along with solutions have been taken into consideration, which have enormous significance in addressing localized plans and actions in order to reduce potential households’ vulnerability under climate change regimes in Bangladesh.

1. Introduction

Vulnerability assessment and the notion of vulnerability in a localized system—both are important aspects in the CCVA literature in recent years, particularly in the context of Bangladesh—where the tipping points of climate change badly prevail. The IPCC’s (2018) and other recent literatures on CCVA place enormous importance on localized solution-based vulnerability assessments under climate change regimes. The notions and mechanisms of vulnerability and its assessment along with solution based intervening transformed adaptations are the critical aspects in order to mobilize a country’s resources coherently at local or community level planning. The paper has dealt with these vital aspects.
The literature suggest that Bangladesh faces worse vulnerability due to climate change and sea-level rise [1,2,3,4,5,6,7,8,9]. The tipping point of this vulnerability can turn disastrous, as the country faces severe multiple and frequent natural calamities, such as cyclones and storm surges, erosion, various types of floods, landslides, severe salinity intrusion into agricultural land, droughts due to withdrawing water from up streams, rising water on the edge of coastal land due to sea level rise, extension of arsenic contamination, reducing soil fertility due to overuse of pesticides and so on. On top of these calamities, the country also faces severe corruption, political instability, weak democracy, severe mismanagement of donors’ development fund allocation, inability to imply climate adaptation planning due to poor economy and technology. The above natural and man-made adverse factors make the country’s vulnerability worse, and these cumulative adverse impacts imply a negative trend line for inhabitants’ illness and income. These factors negatively push the tipping points of country’s vulnerability; as a consequence, illegal migration from Bangladesh to the Asia Pacific region has turned into a crisis for the involved Governments, including of Australia and New Zealand. Illness and income are the dependent factors for measuring the severity of vulnerability in Bangladesh—which has been dealt with in this paper.
The inhabitants of Bangladesh are highly vulnerable due to climate change; hence, the comprehensive transformed adaptation actions—such as formation of community based adaptation committee—need to be implemented immediately in order to enhance people’s adaptive resilience to climate change through forming realistic policies and actions at the local level by the Government [6]. The IPCC’s reports [10,11,12] have been addressing the issues of vulnerability and adaptation resilience since 1990. Currently, the IPCC reports global warming warnings of a possible 1.5 °C rise: A summary for Policy Makers [12] focused on the transformed adaptation (Section 5) along with the potential nature of vulnerabilities to climate change, particularly at the range of 1.5 °C from a pre-industrial level perspective—which the World would experience in coming decades. Hence, regionally, a V & A assessment of Bangladesh is a significant aspect of current advancement of contemporary scientific knowledge [7].
The scientific explanations of vulnerability assessment and the mechanisms of vulnerability in CCVA literature are not highly focused; in other words, the literature on these aspects are thin, though these are heavily being highlighted in forthcoming publications and reports by the UNEP, IPCC, World Bank (WB) etc. The question is how vulnerability assessment can be done, especially statistically; how and what variables would represent potential driving force (s) for assessing vulnerability; how the chosen variables are perturbed by each other in a coherent way; what is the process of prioritizing the variables from the chosen sets of variables? As per prioritized sectors, what would be the solutions vis a vis intervening transformed adaptations in order to enhance resilience at local level? These questions are vital in CCVA literature. To find the answers to the above questions, some effective objectives need to be addressed:
  • To understand household vulnerability along with sustainable livelihoods at community levels in Bangladesh through multiple regression analysis in order to understand which sectors need to be emphasized under climate change regimes;
  • To understand the notions, mechanisms and assessment of vulnerability through regression analysis in order to identify some solutions vis a vis transformed adaptations for enhancing adaptation resilience in Bangladesh.
The paper focuses on the notion and assessment of vulnerability along with sustainable livelihoods, and finds some co-relationships between the determinants of vulnerabilities through multiple regression analysis. These correlations along with the level of significance would indicate some solutions in order to enhance adaptation resilience at local levels in Bangladesh. The significance of this paper is that these solutions would obviously help to produce effective and local resource-based policies and actions for reducing vulnerabilities.

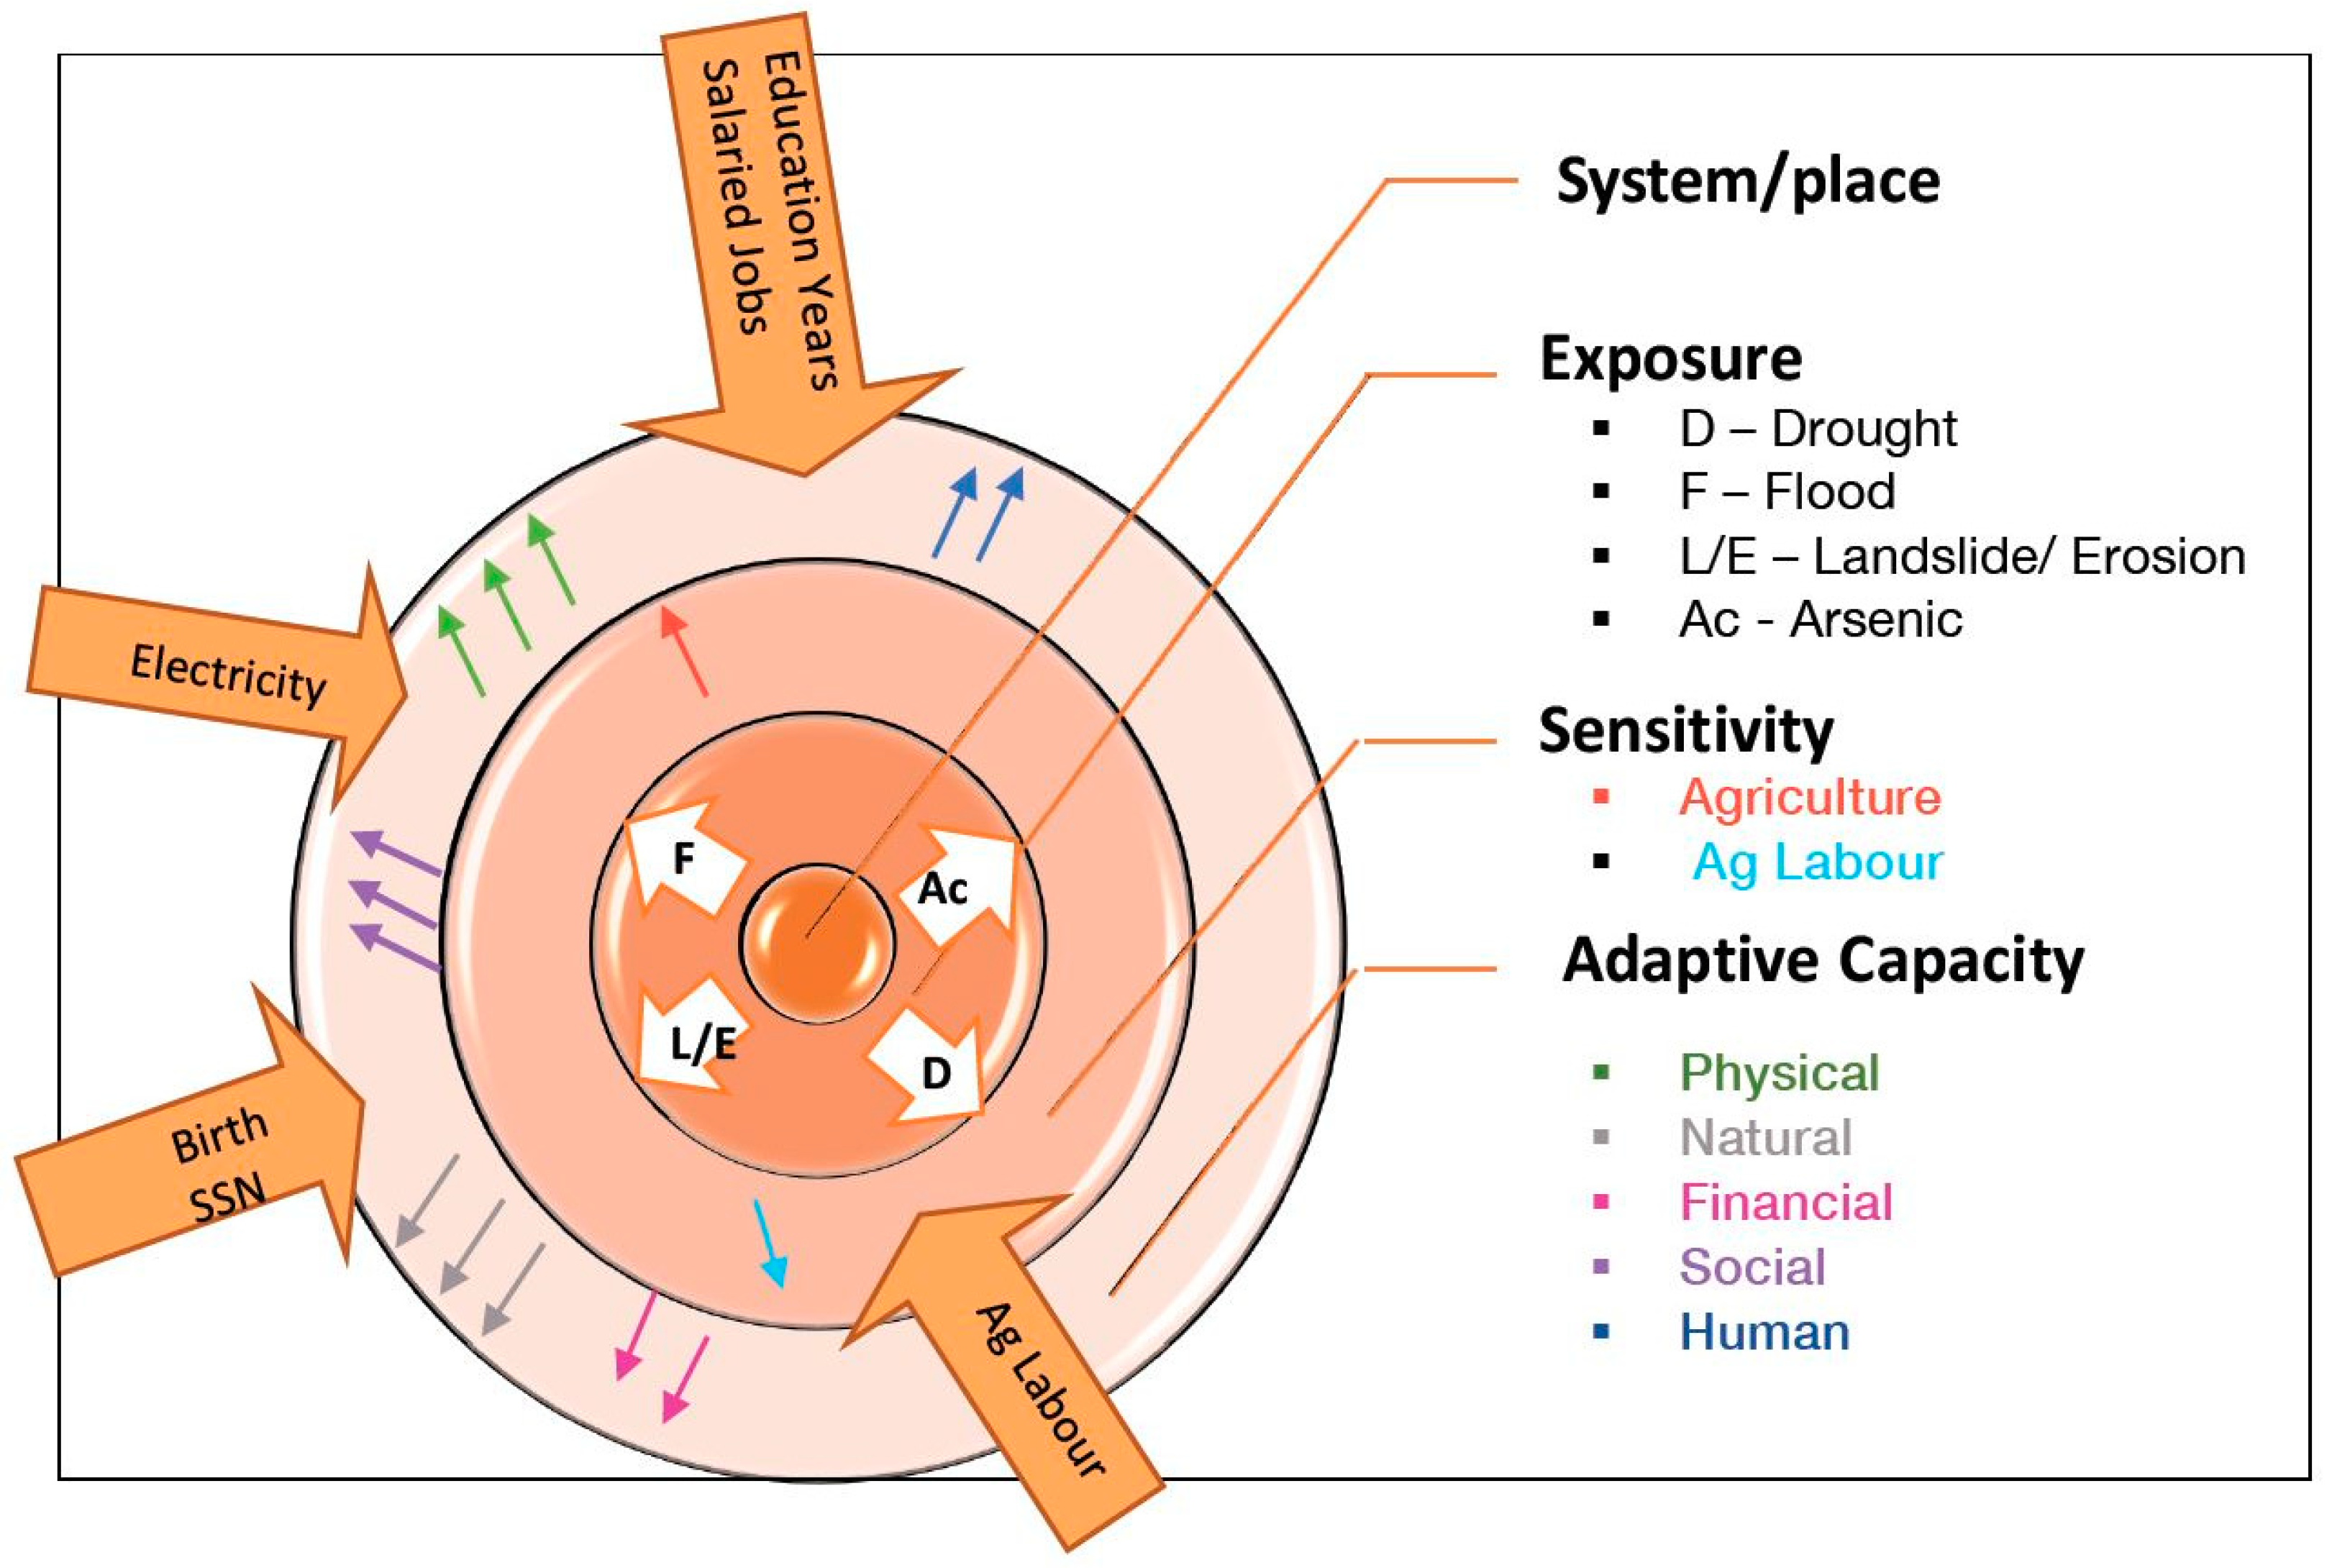
2. Vulnerability Assessment, Sustainable Livelihood and Transformed Adaptation: A Conceptual Paradigm

Vulnerability assessment (VA), sustainable livelihood (SL) and solution-based transformed adaptations (TA)—all are reciprocal and related to one other. The concept of transformed adaptation has recently emerged and been emphasized with greater interest in climate change V & A assessment literature. How local people would cope with surrounding vulnerability in an effective way where proper planning using sustainable technology and solution based interventions would be assimilated—these thematic knowledge expansions have recently been prioritized by UN actions and programs.
V & A assessment is not a new concept in the disaster management science; White [13], Burton et al. [14,15,16] and Bohle et al. [17] had worked on this; this concept has also recently been focused on by Adger et al. [18], Warrick and Ahmad [4], Carter et al. [19], Smit and Wandel [20], IPCC [7,11], Harvey et al. [21], Adger et al. [22], Mortreux & Barnett [23], Younus [6,24]. The CCVA has already emerged as a science; many leading Universities in the World, such as Oxford, ANU, MIT, Oslo, have already accepted it as a science. There are many branches of this science; the mentionable branches are: Migration as adaptation, moral reasoning [18]; ecosystem based mosaic adaptation and land cover change [25]; climate change transformation [26,27,28]; governance and justice [29]; community based planning in CCVA [6,30]; Economics [31]; CCVA awareness and Policy [14,32]; disaster/hazard management and transformed adaptation [27]; coastal adaptation [21,33]; adaptation cities [34]; resilience [35]; capacity building and resilience [36,37]; social norms in CCVA; local climate adaptation [24,38]. Some leading universities have CCVA institutions. Sectoral advancements of CCVA—such as, water, forest agriculture, coastal—have also effectively emerged since last one or two decades. Therefore, V & A is a leading ‘thought and concept’ within the broad science of CCVA.
In the context of Bangladesh, some scientists, such as Warrick and Ahmad [6], Brammer [5], Younus and Harvey [39], Rashid and Paul [9], Paul [40] and Younus [6,7] have also been working on the CCVA issues and a country’s sustainable development. However, the literatures on these critical aspects are thin—more scientific work is needed in order to imply solution-based TA into communities. Transformed adaptation is a much better and improved adaptation which ensures quality and functional out-production, maximize profit, positive changes of attributes on a system and long-term sustainability. The transformed adaptation involves proper and local comprehensive planning that is suitable to local resources and environment, being friendly with advanced technology, ensuring local inhabitants’ participation and acceptance, maintaining suitability for local climates and ensuring maximum out-products and profit. In summary, there are no substantial comprehensive literatures on a V & A assessment of Bangladesh; a few are found in literature on poverty alleviation and food security aspects.
Vulnerability has recently been assessed by three main components: Exposure, sensitivity and adaptive capacity; this assessment process has been found in some literature of IPCC [10,11], UNDP, World Bank and UNEP. The IPCC mentioned about vulnerability as “… a system is exposed, its sensitivity, and its adaptive capacity.” [10]. The bottom up vulnerability studies have emerged to explore how society is adapting in a changing climate [41]. Social vulnerability is influenced by socio-economic factors, political characteristics, and institutional process and trends [42]. The IPCC [11] reported “Vulnerability encompasses a variety of concepts and elements including sensitivity or susceptibility to harm and lack of capacity to cope and adapt”. Younus and Harvey [43] summarized the vulnerability as “V & A are complex terms, and vulnerability is used differently depending on the multi-disciplinary context. The above literature (e.g., IPCC, UNDP, WB and UNEP) including Heltberg and Bonch-Osmolovskiy [44] and Deressa et al. [45] indicate that vulnerability includes the functions of sensitivity, exposure unit and adaptive capacity.
Recently many scientists have focused on TA [26,27,28,46,47,48,49]. TAs are an applied intervention into CCVA assessment which improve livelihoods, and enhance the coping mechanisms of resilience from climatic or hazardous shocks. The TAs would help sustainable decision making process for potential micro level planning. How the TAs would act is effectively based on the understanding of past, present and potential vulnerability—these depend on the local level planning where the TAs would be highly prioritized, and effectively and coherently implied, otherwise the potential and existing integrating planning process would fail to bring sustainable livelihoods under the climate change regimes.

3. Methodology

After careful consideration of various vulnerability studies over the World, such as indicator-based assessments of vulnerability, UNDP’s HDI assessment procedures, weighting index of Principal Component Analysis (PCA), SLF’s (Sustainable Livelihood frameworks) adaptive capacity measurement through using five capitals, a regression analysis is conducted to observe the effects of 22 chosen variables on ‘income’ and ‘illness’ in order to avoid the effects of personal judgment on the variables. Twenty-two variables (Table A1) have been chosen for identifying households’ vulnerability and sustainable livelihood through multiple regression analysis. The multivariate linear regression model has been chosen in this study. The linearity assumption has been checked, and linear relationship between dependent and independent variables has been found. The rational of selecting the model: 1. the dependent variables are continuous, and residuals are normally distributed; 2. the linearity assumption has been satisfied; 3. multiple independent variables have been used in the model. The regression analysis has been run by ‘R’ software [50]. Raw data were collected from the Household Income and Expenditure Survey 2010 from the Bangladesh Bureau of Statistics [51]. Under the Integrated Multipurpose Sample (IMPS) design, a two-stage stratified (district-upazilla-union-village) random sampling technique was followed to collect the data. The survey data were collected for 12,240 households in 373 upazillas (sub-districts) in 64 districts comprising rural, urban and small municipal areas. The survey was conducted from 1 February 2010 to 31 January 2011. The average monthly ‘income’ was measured in Bangladeshi currency taka (1 Australian dollar = 84 taka, 2012). The survey questionnaire was designed to capture household information on employment, education, health, economic activities and wages, housing, agricultural and non-agricultural enterprises, income, assets and consumption. Each household was given a questionnaire comprising over 100 questions.

4. Results and Discussions

4.1. General Findings

The analysis demonstrates how a household’s income and illness are affected by 22 different variables, which measure vulnerability through its three major components: exposure, sensitivity and adaptive capacity. Statistics between coastal regions and the national average of Bangladesh indicate that people in coastal areas are more exposed to droughts and arsenic contamination in ground water but are less exposed to floods and erosion. In addition, the coastal inhabitants have reduced capacity to raise livestock and less access to drinking water, fewer people are engaged in agricultural activities and they have less land than the national average.
The exposed factors such as drought, flood, landslide/erosion and arsenic contamination act on the factors of sensitivity. The function of each factor of adaptive capacity regulates and influence sensitivity. These above mentioned mechanisms, as a whole, act on the incomes which virtually regulate households’ chronic illness. If income is severely affected by the variables of exposure units then prevalence of chronic illness would automatically increase due to malnutrition and other determinants of sufferings, such as poor agricultural production. These mechanisms regulate overall vulnerability and sustainable livelihoods.
The regression was run for 22 variables to assess the effects of exposure, sensitivity and adaptive capacity of households of Bangladesh on income and illness. Out of 22 variables, only 13 were statistically significant at >95 per cent confidence on income and illness. In the coastal areas, all variables under sensitivity had a statistically significant effect on income, but one also affected illness. Only one variable from physical capital affected income in coastal areas. However, all three variables on human capital showed a significant correlation to income nationally. Only the financial capital variable affected illness nationally as well as in coastal areas. Of the four variables in social capital, only two significantly affected income, and there was no geographical difference. In human capital, both variables had a significant effect on ‘income’ and ‘illness’ nationally. However, only one affected income for coastal areas (see Table A1, Table A2 and Table A3, and Table 1).
The effect on income and illness identified for the exposure, sensitivity and adaptive capacity measures used in this study are discussed below.

4.1.1. Exposure

Among the three different variables under exposure, the only significant variable is flood, which is negatively related to income and illness for the country. However, no variable under exposure was found to have a significant effect on outcomes in coastal areas. The average households affected by flood nationally are 2.59 per cent and 1.08 per cent in coastal areas (Table A1). The analysis showed that a 1 per cent increase in the number of people affected by floods nationally could reduce income by 38.43 taka per month, and for coastal areas, it could reduce income by 30.88 taka per month (see Table A2). Thus, there is a significant effect on income, especially in some of the districts in the northern area of the country, such as Kurigram and Rangpur, where more than 50 per cent of the population were affected by floods.

4.1.2. Sensitivity

For Bangladesh as a whole, all of the variables under sensitivity are highly negatively correlated to income, but only the variable ‘percentage of people who engaged in agriculture as agricultural labor’ is highly negatively correlated with illness in coastal areas. However, in coastal areas, the proportion of people engaged in agriculture as agricultural labor for their livelihoods was significant and highly negatively correlated to income (see Table 1).
If the number of people who engage in agriculture as agricultural laborers decreases, there may be a differential effect on coastal areas. Nationally, people are less likely to fall chronically ill if they are not agricultural laborers, but no significant effects of the percentage of agricultural laborers to illness were statistically identified in coastal areas compared to Bangladesh. The labor wage being higher in coastal districts except for Khulna, Bagerhat and Satkhira may be a possible reason.

4.1.3. Adaptive Capacity

Physical Capital

Among the five capitals for physical capital, income is highly positively correlated to Bangladesh households that use sanitary toilets and that have access to electricity. There is a significant and negative correlation to income for both coastal areas and all of Bangladesh in relation to households that use tube-wells for their source of drinking water. The higher coefficient value in coastal areas shows that the same amount of money spent to obtain safe drinking water has a higher effect on income in coastal areas compared to the rest of the world. It reveals that the cost of obtaining safe drinking water is higher in coastal areas than in other parts of the country. No variables under physical capital show any significant relation to illness for both areas (see Table 1).

Natural Capital

The only variable under natural capital is average rainfall, which is collected from historical rainfall data for cropping seasons. This variable is highly negatively correlated to illness in Bangladesh, even though it does not have any significant relation to the any of the outcome variables for coastal areas. It also does not have a significant relation to income for Bangladesh as a whole (see Table 1).

Financial Capital

In financial capital, the level of households receiving remittance from either inside or outside the country is highly negatively correlated to illness both for coastal areas and for the country as a whole; it does not show any spatial difference. In addition, there is no spatial difference in having no significant relation to income. The possible reason may be remittances are being invested non-income generating activities. The value of the coefficient shows that for any increase of remittance, the percentage of people with a chronic illness in coastal areas will be higher than that of the country as a whole (see Table A3). Remittances are a resource for households in addition to wages, and it appears that they can spend this extra money for additional healthcare or things that limit exposure to sickness, such as better nutrition or shelter.

Social Capital

Among the variables in the social capital, households that gave birth with the assistance of a doctor or nurse is highly positively correlated to income for both areas, even though it does not have a significant relation to illness for the same areas. The value of the coefficient shows that every increase in the percentage of households receiving assistance for giving birth will have more of an effect on income in coastal areas than the rest of the country. This means that the cost of such assistance is higher in coastal areas compared to the rest of the country, or perhaps that those with greater incomes choose to, and have the resources to, have a doctor or nurse assist with birth.
Income and illness of households in coastal areas are highly positively correlated to borrowing money from friends and relatives, but only illness has a highly significant positive relation to borrowing money from friends and relatives for the country as a whole. As income decreases, the need to borrow money from friends and relatives apparently increases. The income of households receiving government assistance under a social safety net is highly negatively correlated with the income for Bangladesh as a whole, but there is no significant relation in coastal areas. Primarily low-income households receive Social Safety Net (SSN), although it may help them. The improved outcome might be better measured with caloric intake, as SSN often involves assistance with food (see Table 1).

Human Capital

In human capital, household income is highly positively correlated to the average years of schooling for both areas. However, illness is not significantly related to education in coastal areas, although it is highly positively correlated to income for Bangladesh. The value of the coefficient suggests that each increase in the year of schooling has a higher effect on income increments in coastal areas than in Bangladesh as a whole. This shows that there may be more opportunities for livelihood diversification for educated people in coastal areas compared to other parts of the country. It also shows that the per cent of households engaged in salaried jobs does not affect income in coastal areas. In coastal areas, household engagement in salaried jobs has no significant relationship to illness. However, it is highly negatively correlated to household illness and is highly positively correlated to household income for Bangladesh. The average year of schooling in coastal areas is 3.89 years (see Table A1). Analysis shows that one more year of average schooling per person could increase income by 978 taka nationally, and in coastal areas it could increase by 987 taka. In such cases, the average income could increase by 17 per cent for one additional year of schooling per household in coastal areas.

4.2. Notion and Mechanism of Vulnerability and Adaptation

The Figure 1 indicates how vulnerability works on a system or micro level space. 22 variables perturb each other within the three spheres of vulnerability: Exposure, sensitivity and adaptive capacity, and these perturbation processes act as centrifugal and centripetal forces which indicate the level of vulnerability of a system. If the variables of an exposure unit (e.g., drought, flood, landslide/erosion and arsenic) are highly stressed, then obviously the elements of sensitivity, such as proportion of engagement of agriculture and the proportion of agricultural labor, would be negatively impacted or stressed—which turns into severe vulnerability. At the same time, the elements of adaptive capacity, such as physical, natural, financial, social, and human (for examples education year, birth, salaried jobs, electricity, SSN-Social Safety Nets), would act as centripetal forces towards the system/s. The centripetal forces try to counter the centrifugal force. If the centrifugal force exceeds centripetal force within the three spheres then the overall vulnerability of the system would worsen. In other words, when the centripetal force—that acts as planned, transformed, intervening adaptation resilience—exceeds the centrifugal force then the overall scenario of vulnerability of the system would be improved. Thus, the centripetal forces have enormous significance in reducing the localized vulnerability in the system. As the transformed vis a vis intervening adaptation strategies (centripetal forces) substantially reduce local vulnerability, these have greater implications on localized resource distribution and micro level planning.
The Figure 1 also indicates that 22 variables have been acting as centrifugal and centripetal forces; while only seven of them have been acting as centripetal forces; the centripetal forces are: Education years, birth, salaried jobs, electricity, agriculture labor, agriculture and SSN (Table 2). The multiple regression analysis (Table A2 and Table A3 and Table 1) indicates that these variables are highly significant with the variable of income, and they have also higher coefficient values. The higher coefficient means the results are more certain or accurate. These indicate that the confidence level is 100 per cent. With these seven variables, two are from ‘Human Adaptive Capacity’, two from ‘Social’, one from ‘Physical’ and other two from ‘Sensitivity’ component. These seven centripetal forces are trying to minimize the level of vulnerability, where the vulnerability causing forces, act upon the elements of exposure component/s: Flood, drought, arsenic, landslide/erosion. These centripetal forces, in combined form, act upon the component of sensitivity. The sensitivity is functioned by two main variables, these are: 1. Percentage of people engaged in agriculture (ag), 2. Percentage of households engaged in agriculture as agricultural laborers (aglabour). The centripetal and centrifugal forces act on the factors of sensitivity through the main driving forces (flood, drought, arsenic, landslide and erosion) of vulnerability; these driving forces, individually or in combination, act upon ‘exposure’ component. The nature of vulnerability of that localized space depends on these driving forces’ damaging severity, which are called centrifugal forces. If the centrifugal forces, in terms of severity, are higher than the centripetal forces then the levels of vulnerabilities of that space are higher; hence, minimizing or managing the level of localized vulnerability needs robust intervening transformed adaptation measures, which are identified as centripetal forces. The perturbed linkages of centrifugal and centripetal forces act as a mechanism; this can be referred to as a mechanism of V & A. These mechanisms ultimately substantially impact level of household income, which in turn regulates the level of household vulnerability.
Similarly, there are six variables, cited in Table 2: education years, borrowing monies, salaried jobs, flood, average rainfall and remittances—which are highly significant with the variability “illness” and they have also higher coefficient values (Figure 1/Table A2 and Table A3, and Table 1). These indicate that the confidence level is closer to 99.9 per cent. Five out of above six variables are from the adaptive capacity component. These variables of adaptive capacity along with the factor of the exposure unit: Flood—have a strong impact on household illness. In summary, the centrifugal and centripetal forces have greater implications on the level of household income—which virtually regulate the level of household illness, which means that income has a strong correlation with illness.
The centripetal forces which have strong links with income and illness (Table A1, Table A2 and Table A3, and Table 1), are vital in order to regulate the level of vulnerability at local level. These forces can act as transformed adaptations which virtually improve the overall situation of vulnerability at local system or place. If the government of Bangladesh wants to improve the country’s local level vulnerability, then identified forces (7 for income integration and 6 for illness integration, cited in Table 2) need to be focused on and intervened/acted upon at local level. Table 3 indicates how the government can act and intervene the transformed adaptation. As mentioned, the Government of Bangladesh needs to prioritize seven determinants which have a greater impact on household income—this would improve the situation of overall vulnerability, and hence the household livelihood patterns would also be improved and sustained as the levels of income would increase due to intervened transformed adaptation.
Therefore, vulnerability is a mechanism where all pertinent are perturbed by each other and act as centrifugal and centripetal forces; the centrifugal forces of exposure, sensitivity and adaptive capacity increase the level of vulnerability. On the other hand, the centripetal forces try to neutralize the vulnerability threshold, thus improving the overall vulnerability situation, hence when centripetal forces overcome the centrifugal forces, household livelihoods would automatically reach a sustainable condition.

4.3. Potential Convincing Solutions of the Prioritised Sectors

From two sets of above prioritized variables (Table A2)—the common sectors are education years and salaried jobs; hence these need appropriate importance. If intervening actions vis a vis centripetal forces bring a higher degree of stability than centrifugal forces, then sustainable conditions prevail. The Table 3 indicates how these variables (education and salaried jobs) can be prioritized. In order to enhance these variables, some intervening options or solutions have been carefully made. The solutions are realistic as the authors have long term expertise on the dealt issues at a root level in Bangladesh and Australia. The recommended solutions have been made based on Australia’s education system. These convincing solutions are largely practically-oriented. The solutions are named as intervening options; these can also be called transformed adaptations.
These transformed adaptations are urgently needed for improving the overall situation of vulnerability at the community level. As an example, vocational training (wielding, weaving, making fishing nets, use of the internet, electricity technicians, auto tempo driving, pruning trees, jeweler designer, deed (dolil) agreement typist, health technician, agricultural informer (e.g., watering expert), are vital driving forces for enhancing the education sector at grass-roots levels in Bangladesh. The current traditional educational systems need to be replaced or intervened by the vocational based training which would fulfil local demand. These vocational trainings would be local resource based and short duration. In Australia, technical and further education (TAFE) institutions provide a wide range of predominantly vocational tertiary education courses which are recognized by the Australian Quality Training Framework. These TAFE institutions are producing students with well-equipped technical knowledge (e.g., auto mobile or computer technician/s) which permit them to assimilate into the country’s labor force as a entry level worker. Students of TAFE do not need to graduate or obtain a master’s degree; they only need specific time (weeks or months) to earn practical knowledge. These types of practical based knowledge and training (e.g., shallow machine technician) need to be incorporated into education sector in Bangladesh. This system can be an example of minimum investment (time and money) and maximum out production (generating skilled work force).
These types of short term and localized resource based transformed adaptation need to be implemented in the education sector, which would ensure an increase in the average households’ income level. If the average households’ incomes increases countrywide then automatically the country’s vulnerability would decrease. Households’ illness would be taken care of by investing money for doctors and medicine. Table 3 indicates the prioritized sectors which need to be intervened in; some solutions (intervening strategies/transformed adaptation) have also been recommended. These interventions are also well-linked with each other over prioritized sectors, and over some time, these act in an integrative manner. These solutions can mainly be executed by the local community based adaptation committee (CBAC), as Younus [6,52,53] has proposed the rationality of CBAC at root levels in Bangladesh. Further in-depth research is needed in order to identify the ranks of actions of each prioritized sectors and how and by whom these actions would be executed at the community levels in Bangladesh.

5. Conclusions and Recommendations

The notion and mechanisms of vulnerability in a localized system and its assessment in the context of one of the World’s most vulnerable countries, Bangladesh, to climate change and natural hazards, have been focused on in a new dimension. The relevant up-to-date literature on vulnerability and adaptation have been reviewed. 22 variables have effectively been chosen for assessing vulnerability where all the variables have perturbed each other as like a mechanism, which act as centripetal and centrifugal forces over a system. The motion of centripetal and centrifugal forces in decision making mechanisms, which are the main driving contributions of this paper, have carefully been dealt in the Figure 1 through the variables of measuring vulnerability at exposure, sensitivity and adaptive capacity unit. This mechanism has been identified as a new way to envision vulnerability and adaptation decisions. The centripetal and centrifugal forces and their interactions into V & A decision mechanisms played a key role that is a unique finding or contribution in this paper, which has not yet been dealt in other published V & A literature. Within these mechanisms, the selected variables’ level of significance and their relevant coefficients over households’ income and illness—have been measured and assessed through multiple regression analysis using R statistical software. The MRA identifies some effective prioritized variables in order to reduce country’s potential vulnerability. Later, some potential transformed adaptation actions, strategies and solutions have been proposed for major prioritized sectors—as a model study—which should have an enormous contribution in decreasing a country’s vulnerability and improving sustainable household livelihood through implementing localized adaptation plans under climate change regimes.

Author Contributions

Conceptualization, M.A.F.Y.; Data curation, M.A.K.; Formal analysis, M.A.F.Y.; Funding acquisition, M.A.K.; Investigation, M.A.K.; Methodology, M.A.F.Y.; Software, M.A.K.; Supervision, M.A.F.Y.; Writing—original draft, M.A.F.Y.; Writing—review & editing, M.A.F.Y.

Funding

Md Kabir awarded Adelaide University Postgraduate Scholarship.

Conflicts of Interest

there is no conflict of interest.

Appendix A

Table A1. Variables with average values in coastal areas and the rest of the country.
Variable TypeDescriptionsNameBangladesh AverageCoastal Average
Outcome% of people suffering chronic illness%illness14.7015.00
Average net salary of salaried employeeincome5265.035608.57
Exposure% of household that have experienced drought shock%drought3.5910.27
% of household that have experienced flood shock%flood2.591.08
% of household shock landslide/erosion%landslide0.420.09
% of household have found arsenic in their tubewell%arsenic4.085.24
SensitivityPercentage of people engaged in agriculture%ag40.5433.51
Percentage of households engaged in agriculture as agricultural labourers%aglabor34.3635.78
Physical% of household have pucca and semi pucca room%pucca62.4265.81
% of household have sanitary toilet%toilet18.2731.83
% of household using tube-well as their source of drinking water%tubewell88.4884.11
% of household have electricity connection%electricity54.2358.28
% of household raise livestock%livestock45.4635.86
NaturalAverage rainfall April–October from historic rainfall datarainavg2050.042173.69
Standard deviation of rainfall April–October from historic rainfall datarainvar456.12446.45
% of household have cultivable land%agland41.1336.53
Average amount of cultivable land per householdagland134.72115.56
FinancialAverage remittance income all sourcesremittances112,848.20120,718.40
Social% of child birth by doctor or nurse%birth11.0911.85
% of people ever immunized%immune11.4911.59
% of household borrow money from friends and relatives%borrow33.1433.97
% of people included in SSN%ssn6.917.20
HumanAverage year of schoolingeduc_years3.433.89
proportion of household engaged in salaried job%salaried21.6826.24
Table A2. Regression results of income and illness with exposure and sensitivity variables for coastal areas and all of Bangladesh.
BangladeshCoastal Areas
IncomeIllnessIncomeIllness
ExposureCoefficients:
Estimate Std. Error t value Pr(>|t|)
Coefficients:
Estimate Std. Error t value Pr(>|t|)
Coefficients:
Estimate Std. Error t value Pr(>|t|)
Coefficients:
Estimate Std. Error t value Pr(>|t|)
(Intercept)5439.035187.63728.987<2 × 10⁻¹⁶ ***(Intercept)14.8308520.45592032.529<2 × 10⁻¹⁶ ***(Intercept)6044.38482.8212.519<2 × 10⁻¹⁶ ***(Intercept)14.431050.8957616.110<2 × 10⁻¹⁶ ***
drought−9.59617.829−0.5380.5907drought0.0249120.0433200.5750.5656drought−22.3824.83−0.9010.370drought0.061940.046061.3450.182
flood−38.43415.051−2.5540.0111 *flood−0.0747000.036571−2.0430.0418 *flood−30.8878.07−0.3950.693flood0.201410.144851.3910.168
arsenic−9.78115.331−0.6380.5239arsenic−0.0074210.037250−0.1990.8422arsenic−33.0033.42−0.9870.326arsenic−0.054160.06201−0.8730.385
SensitivityCoefficients:
Estimate Std. Error t value Pr(>|t|)
Coefficients:
Estimate Std. Error t value Pr(>|t|)
Coefficients:
Estimate Std. Error t value Pr(>|t|)
Coefficients:
Estimate Std. Error t value Pr(>|t|)
(Intercept)7377.184321.91622.916<2 × 10⁻¹⁶ ***(Intercept)15.031800.8461017.766<2 × 10⁻¹⁶ ***(Intercept)7858.82670.0511.729<2 × 10⁻¹⁶ ***(Intercept)16.183611.3224112.238<2 × 10⁻¹⁶ ***
ag−45.6396.065−7.5244.3 × 10−13 ***ag0.012190.015940.7650.445ag−45.4713.90−3.2700.00152 **ag0.021640.027440.7890.4324
aglabor−7.6186.359−1.1980.232aglabor−0.024150.01671−1.4450.149aglabor−20.3111.73−1.7310.08684aglabor−0.053340.02315−2.3040.0235 *
Note: significance code: 0 for ***, 0.001 for **, 0.01 for *, 0.05 for “.”.
Table A3. Regression results of income and illness for adaptive capacity variables in different capital endowments for coastal areas and whole of Bangladesh.
BangladeshCoastal Area
IncomeIllnessIncomeIllness
Adaptive CapacityPhysical capitalCoefficients:
Estimate Std. Error t value Pr(>|t|)
Coefficients:
Estimate Std. Error t value Pr(>|t|)
Coefficients:
Estimate Std. Error t value Pr(>|t|)
Coefficients:
Estimate Std. Error t value Pr(>|t|)
(Intercept)5457.429793.3366.8792.72 × 10−11 ***(Intercept)12.8058322.1477755.9625.99 × 10−9 ***(Intercept)5231.4241675.7103.1220.00244 **(Intercept) 21.6043293.4930286.1851.96 × 10−8 ***
pucca7.2865.2901.3770.169274pucca0.0040750.0143210.2850.776pucca18.80211.9811.5690.12019pucca−0.0068050.024974−0.2720.786
toilet18.2067.3622.4730.013863 *toilet−0.0321730.019931−1.6140.107toilet18.27213.4411.3590.17751toilet−0.0425730.028017−1.5200.132
tubewell−17.4826.198−2.8210.005061 **tubewell0.0013670.0167800.0810.935tubewell−26.37311.875−2.2210.02895 *tubewell−0.0404860.024753−1.6360.106
electricity20.3725.7163.5640.000415 ***electricity0.0093020.0154740.6010.548electricity16.27412.4191.3100.19352electricity−0.0263620.025888−1.0180.311
livestock−11.8276.719−1.7600.079231livestock0.0351630.0181911.9330.054livestock−4.79614.369−0.3340.73934livestock0.0039060.0299520.1300.897
Natural capitalCoefficients:
Estimate Std. Error t value Pr(>|t|)
Coefficients:
Estimate Std. Error t value Pr(>|t|)
Coefficients:
Estimate Std. Error t value Pr(>|t|)
Coefficients:
Estimate Std. Error t value Pr(>|t|)
(Intercept)7683.3239768.089110.003<2 × 10⁻¹⁶ ***(Intercept)15.13685131.87723688.0631.13 × 10−14 ***(Intercept)5291.82621845.50312.8670.00517 **(Intercept)13.25530013.47511713.8140.000251 ***
rainavg−0.10690.3561−0.3000.764252rainavg−0.00225280.0008702−2.5890.0100 *rainavg0.97050.96891.0020.31922rainavg0.00094090.00182450.5160.607313
rainvar−2.18921.4780−1.4810.139450rainvar0.00649820.00361241.7990.0729rainvar−4.08044.8047−0.8490.39802rainvar−0.00266810.0090473−0.2950.768749
agland−29.19107.9888−3.6540.000297 ***agland0.02950560.01952491.511 0.1316agland0.789218.46130.0430.96600agland0.02438100.03476300.7010.484915
Financial capitalCoefficients:
Estimate Std. Error t value Pr(>|t|)
Coefficients:
Estimate Std. Error t value Pr(>|t|)
Coefficients:
Estimate Std. Error t value Pr(>|t|)
Coefficients:
Estimate Std. Error t value Pr(>|t|)
(Intercept)5.218 × 1031.981 × 10226.34<2 × 10⁻¹⁶ ***(Intercept)1.523 × 1014.774 × 10−131.900<2 × 10⁻¹⁶ ***(Intercept)5.375 × 1034.693 × 10211.45<2 × 10⁻¹⁶ ***(Intercept)1.629 × 1018.615 × 10−118.908<2 × 10⁻¹⁶ ***
remittances4.171 × 10−41.016 × 10−30.410.682remittances−4.720 × 10⁻⁶ 2.449 × 10⁻⁶−1.9270.0548.remittances1.933 ×10−32.611 × 10−30.740.461remittances
−1.068 × 10−54.793 × 10−6−2.2290.0283 *
Social capitalCoefficients:
Estimate Std. Error t value Pr(>|t|)
Coefficients:
Estimate Std. Error t value Pr(>|t|)
Coefficients:
Estimate Std. Error t value Pr(>|t|)
Coefficients:
Estimate Std. Error t value Pr(>|t|)
(Intercept)5987.43624.909.581<2 × 10⁻¹⁶ ***(Intercept)10.536851.645966.4024.84 × 10−10 ***(Intercept)6459.761303.064.9573.44 × 10−6 ***(Intercept)10.356632.750123.7660.000299 ***
birth110.0712.368.903 <2 × 10⁻¹⁶ ***birth0.029300.032570.9000.3688birth
132.2825.035.2859.05 ×10 −7 ***birth0.062930.052831.1910.236739
immune−75.8341.74−1.8170.070112immune−0.139590.10994−1.2700.2050immune−79.3586.22−0.9200.3599immune−0.081490.18196−0.4480.655376
borrow−15.237.86−1.9370.053486borrow0.140620.020706.7924.62 × 10−11 ***borrow−36.9818.47−2.0030.0483 *borrow0.115670.038972.9680.003861 **
ssn−82.1523.40−3.511 0.000504 ***ssn0.112780.061631.8300.0681ssn−33.6944.56−0.7560.4515ssn0.126740.094041.3480.181189
Human capitalCoefficients:
Estimate Std. Error t value Pr(>|t|)
Coefficients:
Estimate Std. Error t value Pr(>|t|)
Coefficients:
Estimate Std. Error t value Pr(>|t|)
Coefficients:
Estimate Std. Error t value Pr(>|t|)
(Intercept)1194.250399.0912.9920.002959 **(Intercept)12.736181.13594 11.212 <2 × 10⁻¹⁶ ***(Intercept)831.701055.880.7880.43295(Intercept)15.241152.288776.6592.12 × 10−9 ***
educ_years978.102133.3667.3341.5 × 10−12 ***educ_years1.027890.37960 2.708 0.00710 **educ_years
987.09307.023.2150.00181 **educ_years0.063300.665500.0950.924
salaried33.2289.2573.5890.000377 ***salaried−0.072000.02635−2.7330.00659salaried35.6218.521.9240.05752salaried−0.018580.04014−0.4630.644
Note: significance code: 0 for ***, 0.001 for **, 0.01 for *, 0.05 for “.”.

References

  1. Chen, J.; Mueller, V. Coastal climate change, soil salinity and human migration in Bangladesh. Nat. Clim. Chang. 2018, 8, 981–985. [Google Scholar] [CrossRef]
  2. Momtaz, S.; Shameem, M. Experiencing Climate Change in Bangladesh: Vulnerability and Adaptation in Coastal Region; Elsevier: Amsterdam, The Netherlands, 2016. [Google Scholar]
  3. Shaw, R.; Mallick, F.; Islam, A. (Eds.) Climate Change Adaptation Actions in Bangladesh; Springer: New York, NY, USA, 2013. [Google Scholar]
  4. Warrick, R.A.; Ahmad, Q.K. The Implications of Climate and Sea-Level Change for Bangladesh; Kluwer Academic Publishers: Dordrecht, The Netherlands, 1996. [Google Scholar]
  5. Brammer, H. Bangladesh’s diverse and complex physical geography: Implications for agricultural development. Int. J. Environ. Stud. 2016, 74, 1–27. [Google Scholar] [CrossRef]
  6. Younus, M. Adapting to Climate Change in the Coastal Regions of Bangladesh: Proposal for the Formation of Community-Based Adaptation Committees. Environ. Hazards 2017, 16, 21–49. [Google Scholar] [CrossRef]
  7. Younus, M. An assessment of vulnerability and adaptation to cyclones through impact assessment guidelines: A bottom-up case study from Bangladesh coast. Nat. Hazards 2017, 89, 1437–1459. [Google Scholar] [CrossRef]
  8. Adger, W.N.; Adams, H.; Kay, S.; Nicholls, R.J.; Hutton, C.W.; Hanson, S.E.; Rahman, M.M.; Salehin, M. (Eds.) Ecosystem Services, Well-Being and Deltas: Current Knowledge and Understanding. In Ecosystem Services for Well-Being in Deltas: Integrated Assessment for Policy Analysis, Palgrave Macmillan; Springer Nature: Cham, Switzerland, 2018. [Google Scholar]
  9. Rashid, H.; Paul, B. Climate Change in Bangladesh: Confronting Impending Disasters; Lexington Books: Lanham, MD, USA, 2013. [Google Scholar]
  10. IPCC. Climate Change 2007: Impacts, Adaptation and Vulnerability; Contribution of Working Group 2 to the Fourth Assessment Report of the Intergovernmental Panel on Climate Change; Parry, M.L., Canziani, O.F., Palutikof, J.P., van der Linden, P.J., Hanson, C.E., Eds.; Cambridge University Press: Cambridge, UK, 2007; 976p. [Google Scholar]
  11. IPCC. The IPCC Fifth Assessment Report; Climate Change 2014: Impacts, Adaptation, and Vulnerability, Part A; Ch 5—Coastal Systems and Low-Lying Areas; IPCC: Geneva, Switzerland, 2014. [Google Scholar]
  12. IPCC. Global Warming of 1.5 °C; Summary for Policy Makers; IPCC: Geneva, Switzerland, 2018. [Google Scholar]
  13. White, G.F. (Ed.) Natural Hazards: Local, National, Global; Oxford University Press: New York, NY, USA, 1974. [Google Scholar]
  14. Burton, I.; Bizikova, L.; Dickinson, T.; Howard, Y. Integrating adaptation into policy: Up scaling evidence from local to global. Clim. Policy 2007, 7, 371–376. [Google Scholar] [CrossRef]
  15. Burton, I.; Diringer, E.; Smith, J. Adaptation to Climate Change: International Policy Options; Pew Centre on Global Climate Change: Arlington, VA, USA, 2006. [Google Scholar]
  16. Burton, I.; Kates, R.W.; White, G.F. The Environment as Hazard, 2th ed.; The Guilford Press: New York, NY, USA, 1993. [Google Scholar]
  17. Bohle, H.G.; Downing, T.E.; Watts, M.J. Climate Change and Social Vulnerability—Towards a Sociology and Geography of Food Insecurity. Glob. Environ. Chang. 1994, 4, 37–48. [Google Scholar] [CrossRef]
  18. Adger, W.N.; Butler, C.; Walker-Springett, K. Moral reasoning in adaptation to climate change. Environ. Politics 2017, 26, 371–390. [Google Scholar] [CrossRef]
  19. Carter, T.R.; Parry, M.L.; Harasawa, H. IPCC Technical Guidelines for Assessing Climate Change Impacts and Adaptations; University College: London, UK; Centre for Global Environmental Research: Kobe, Japan, 1994. [Google Scholar]
  20. Smit, B.; Wandel, J. Adaptation, Adaptive Capacity and Vulnerability. Glob. Environ. Chang. 2006, 16, 282–292. [Google Scholar] [CrossRef]
  21. Harvey, N.; Dew, R.E.; Hender, S. Rapid land use change by coastal wind farm development: Australian policies, politics and planning. Land Use Policy 2017, 61, 368–378. [Google Scholar] [CrossRef]
  22. Adger, W.; Barnett, J.; Brown, K.; Marshall, N.; O’Brien, K. Cultural dimensions of climate change impacts and adaptation. Nat. Clim. Chang. 2013, 3, 112–117. [Google Scholar] [CrossRef]
  23. Mortreux, C.; Barnett, J. Adaptive capacity: Exploring the research frontier. Wiley Interdiscip. Rev. Clim. Chang. 2017, 8, e467. [Google Scholar] [CrossRef]
  24. Younus, M.; Sharna, S. Combination of Community-based Vulnerability and Adaptation to Storm Surges in Coastal Regions of Bangladesh. J. Environ. Assess. Policy Manag. 2014, 16, 1450036. [Google Scholar] [CrossRef]
  25. Nicholls, R.J.; Hutton, C.W.; Adger, W.N.; Hanson, S.E.; Rahman, M.M.; Salehin, M. (Eds.) Ecosystem Services for Well-Being in Deltas: Integrated Assessment for Policy Analysis; Palgrave Macmillan: Basingstoke, UK, 2018. [Google Scholar]
  26. O’brien, K. Global environmental change II: From adaptation to deliberate transformation. Prog. Hum. Geogr. 2012, 36, 667–676. [Google Scholar] [CrossRef]
  27. Pelling, M.; O’Brien, K.; Matyas, D. Adaptation and transformation. Clim. Chang. 2014, 133, 113–127. [Google Scholar] [CrossRef] [Green Version]
  28. Kates, R.; Travis, W.; Wilbanks, T. Transformational adaptation when incremental adaptations to climate change are insufficient. Proc. Natl. Acad. Sci. USA 2012, 109, 201115521. [Google Scholar] [CrossRef] [PubMed]
  29. Schultz, L.; Folke, C.; Österblom, H.; Olsson, P. Adaptive governance, ecosystem management, and natural capital. Proc. Natl. Acad. Sci. USA 2015, 112, 7369–7374. [Google Scholar] [CrossRef] [PubMed]
  30. Shi, L.; Chu, E.; Debats, J. Explaining Progress in Climate Adaptation Planning Across 156 U.S. Municipalities. J. Am. Plan. Assoc. 2015, 81, 191–202. [Google Scholar] [CrossRef]
  31. Sterner, T. Higher costs of climate change. Nature 2015, 527, 177–178. [Google Scholar] [CrossRef] [PubMed]
  32. Lee, T.M.; Markowitz, E.M.; Howe, P.D.; Ko, C.-Y.; Leiserowitz, A.A. Leiserowitz: Predictors of public climate change awareness and risk perception around the world. Nat. Clim. Chang. 2015, 5, 1014–1020. [Google Scholar] [CrossRef]
  33. Barnett, J.; Graham, S.; Mortreux, C.; Fincher, R.; Waters, E.; Hurlimann, A. A Local Coastal Adaptation Pathway. Nat. Clim. Chang. 2014, 4, 1103–1108. [Google Scholar] [CrossRef]
  34. McEvoy, D.; Ahmed, I.; Trundle, A.; Sang, L.T.; Diem, N.N.; Suu, L.T.; Quoc, T.B.; Mallick, F.H.; Rahman, R.; Rahman, A.; et al. In support of urban adaptation: A participatory assessment process for secondary cities in Vietnam and Bangladesh. Clim. Dev. 2014, 6, 205–215. [Google Scholar] [CrossRef]
  35. Schipper, E.L.; Langston, L. A Comparative Overview of Resilience Measurement Frameworks: Analysing Indicators and Approaches; Working Paper 422; Overseas Development Institute ODI: London, UK, 2015. [Google Scholar]
  36. Yoseph-Paulus, R.; Hindmarsh, R. Addressing inadequacies of sectoral coordination and local capacity building in Indonesia for effective climate change adaptation. Clim. Dev. 2018, 10, 35–48. [Google Scholar] [CrossRef]
  37. Williams, C.; Fenton, A.; Huq, S. Knowledge and Adaptive Capacity. Nat. Clim. Chang. 2015, 5, 82–83. [Google Scholar] [CrossRef]
  38. Vogel, B.; Henstra, D. Studying local climate adaptation: A heuristic research framework for comparative policy analysis. Glob. Environ. Chang. 2015, 31, 110–120. [Google Scholar] [CrossRef]
  39. Younus, M.; Harvey, N. Economic Consequences of Failed Autonomous Adaptation to Extreme Floods: A Case Study from Bangladesh. J. Local Econ. Policy Unit 2014, 29, 20–35. [Google Scholar] [CrossRef]
  40. Paul, B. Human Injuries Caused by Bangladesh’s Cyclone Sidr: An Empirical Study. Nat. Hazards 2010, 54, 483–495. [Google Scholar] [CrossRef]
  41. Vincent, K. Creating an Index of Social Vulnerability to Climate Change for Africa; Working Paper; Tyndall, Center for Climate Change Research: Oxford, UK, 2004; Volume 56. [Google Scholar]
  42. Kelly, P.M.; Adger, W.N. Theory and practice in assessing vulnerability to climate change and facilitating adaptation. Clim. Chang. 2000, 47, 325–352. [Google Scholar] [CrossRef]
  43. Younus, M.; Harvey, N. Community-based flood vulnerability and adaptation assessment: A case study from Bangladesh. J. Environ. Assess. Policy Manag. 2013, 15, 1350010. [Google Scholar] [CrossRef]
  44. Heltberg, R.; Bonch-Osmolovskiy, M. Mapping Vulnerability to Climate Change; World Bank Policy Research Working Paper No. 5554; The World Bank: Washington, DC, USA, 2011. [Google Scholar]
  45. Deressa, T.; Hassan, R.M.; Ringler, C. Measuring Ethiopian Farmers’ Vulnerability to Climate Change across Regional States; International Food Policy Research Institute: Washington, DC, USA, 2008. [Google Scholar]
  46. Adger, W.N.; Agrawala, S.; Mirza, M.M.Q.; Conde, C.; O’Brien, K.; Pulhin, J.; Pulwarty, R.; Smit, B.; Takahashi, K. Assessment of adaptation practices, options, constraints and capacity. In Climate Change 2007: Impacts, Adaptation and Vulnerability. Contribution of Working Group II to the Fourth Assessment Report of the Intergovernmental Panel on Climate Change; Parry, M.L., Canziani, O.F., Palutikof, J.P., van der Linden, P.J., Hanson, C.E., Eds.; Cambridge University Press: Cambridge, UK, 2007; pp. 717–743. [Google Scholar]
  47. Adger, W.N.; Dessai, S.; Goulden, M.; Hulme, M.; Lorenzoni, I.; Nelson, D.R.; Naess, L.O.; Wolf, J.; Wreford, A. Are there social limits to adaptation to climate change? Clim. Chang. 2009, 93, 335–354. [Google Scholar] [CrossRef]
  48. Adger, W.N.; Lorenzoni, I.; O’Brien, K. (Eds.) Adapting to Climate Change: Thresholds, Values, Governance; Cambridge University Press: Cambridge, UK, 2009. [Google Scholar]
  49. Park, S.E.; Marshall, N.A.; Jakku, E.; Dowd, A.M.; Howden, S.M.; Mendham, E.; Fleming, A. Informing adaptation responses to climate change through theories of transformation. Glob. Environ. Chang. 2011, 22, 115–126. [Google Scholar] [CrossRef]
  50. Kabcoff, R.I. Quick-R Accessing the Power of R. Available online: http://www.statmethods.net/graphs/scatterplot.html (accessed on 7 August 2016).
  51. Bangladesh Bureau of Statistics, Government of Bangladesh. BBS—Bangladesh Bureau of Statistics (2011): Household Income and Expenditure Survey 2010; Bangladesh Bureau of Statistics, Government of Bangladesh: Dhaka, Bangladesh, 2011.
  52. Younus, M. Autonomous Crop Adaptation Processes to Extreme Floods: A Case Study in Bangladesh. Environ. Hazards 2015, 14, 36–53. [Google Scholar] [CrossRef]
  53. Younus, M. Flood Vulnerability and Adaptation to Climate Change in Bangladesh: A Review. J. Environ. Assess. Policy Manag. 2014, 16, 1450024. [Google Scholar] [CrossRef]
Figure 1. Mechanism vis a vis Centripetal & Centrifugal forces of Vulnerability in a System/Place.
Sustainability 10 04286 g001
Table 1. Regression results of income and illness with only significant variables and their coefficients for coastal areas and rest of the country.
BangladeshCoastal Areas
Variable TypeNameIncome SignificanceInterceptCoefficientIllness SignificanceInterceptCoefficientIncome SignificanceInterceptCoefficientIllness SignificanceInterceptCoefficient
Exposure% of households exposed to flood shock*5439.035−38.434*14.830−0.0747
Sensitivity% of people engaged in agriculture***7377.184−45.639 **7858.82−45.47
% of households engaged in agriculture as agricultural labourers***7377.184−7.618 “.”7858.82−20.31*16.183−0.053
Adaptive capacityPhysical% of households with a sanitary toilet*5457.42918.206
% of households using tubewell as their source of drinking water**5457.429−17.482 *5231.424−26.373
% households have electricity connection***5457.42920.372
NaturalAverage rainfall April–October from historical rainfall data *15.136−0.0022
FinancialAverage remittance income
from all sources (home/abroad)
“.”1.523 × 101−4.720 × 10−6 *1.629 × 101−1.068 × 10⁻⁵
Social% of child birth by doctor/nurse***5987.43110.07 ***6459.76132.28
% of households borrowing
money from friends and relatives
***10.5360.140*6459.76−36.98**10.3560.1156
% of people included in SSN***5987.43−82.15
HumanAverage year of schooling***1194.250978.102**12.7361.027**831.70987.09
% of households engaged in salaried jobs***1194.25033.228**12.736−0.072
Note: *** represents 100% confidence, ** represents 99.9% confidence, * represents 99% confidence, ‘.’ Represents 95% confidence.
Table 2. The Prioritized variables/sectors as Per Multiple Regression Analysis.
Highly Significance to IncomeHighly Significance to Illness
1. Edu_years (Human)1. Edu_years (Human)
2. Birth (Social)2. Borrow (Social)
3. Salaried jobs (Human)3. Salaried jobs (Human)
4. Electricity (Physical)4. Flood (Exposure)
5. Aglabour (sensitivity)5. Rain Average (Natural)
6. Agriculture (sensitivity)6. Remittances (Financial)
7. SSN (Social Safety Network)
Table 3. Proposed intervening transformed adaptations under various prioritised variables.
Prioritized VariablesIntervention Strategies/Transformed Adaptation StrategiesPotentially Executed by
Education Years-Technical Education
-Computer Education
Internet related technologically equipped knowledge
-Vocational training
Wielding
Weaving
fishing nets
Social Worker Education
Carer training
Rural health worker education
Carpenter education
auto mobile education
Handling tractor Driving
agricultural cultivation equipment and machineries training and education
Auto Mechanics
Building structuring (Raj Mistri)
Typing training
Data analysis training
Village doctors or health assistant training
Surveyors (amin)
Driving auto tempo training
Jewellery labouring training
Hospitality training
Asst agriculture officer training
Deed registration training (mohuri)
Assistant surveyor training
localised resources maintenance worker (fishing, cultivating and weaving)
electrician training
telephone operator training
telephone cable mechanic
TV antenna mechanic
Rice threshold worker (boiler)
Animal doctors’ helper
Customer service training
Auto rickshaw driving training
Rickshaw Mechanic Training
Pruning trees/vegetables producing expert training
Taxi/Uber/rent a car/rental auto tempo training personnel
Child care training
Irrigation water supplier training
Environment Knowledge sharing worker
Job seeking adviser
labour registration and suppling training
disaster preparedness training
evacuation volunteer from local disaster training
first aid training
Poultry/hatchers’ food supplier training
Cattle food supplier training
Trained Informer training course (for information centre with Community based adaptation committee (CBAC) centre at Mauza level).
  • Department of
    (i)
    Youth development
    (ii)
    Women affairs
    (iii)
    Technical education
    (iv)
    Bureau of manpower employment and training
    (v)
    Vocational training institutes
  • Community based adaptation committees (Younus, 2017) at Union level; these committees can act as trainers and trainee.
BorrowFacilitating government and non-government micro financing
-Interest free loaning
-after disaster special interest free money from the concerned government agencies at local levels
NGO affairs bureau, Planning commission
Bangladesh Bank, Upazilla Nirbahi Office,
Upazilla Cooperative Office, Upazilla Women Affairs Office
Salaried JobsFacilitating private sector investment
Introducing agricultural labor as formal jobs
Facilitating SME’s
BEZA, BEPZA, BOI, Ministry of agriculture
Flood
  • River bed excavation
  • Massive program for river shore protection
  • Strong flood management planning and budgeting
Ministry of water resources
Bangladesh water dev. board field office
District Executive Engineers Office, Water Board
RemittanceReducing migration cost
Eliminating visa trading
Creating national job roster for overseas placement
Ministry of expatriates welfare and overseas employment
Bureau of manpower employment training
District employment and training offices
Electricity connectionsTaking every household under electricity connections BPDB, REB
Agriculture and agricultural labor
  • Ensuring multi-layer cropping in order to maximize the out-production and profit
  • Planting new varieties of crops, fruits (avocado) and vegetables (cultivate lettuce underneath of mangoes/lychee gardens) which are more productive, meeting local demand
  • Constructing storage facilities for rural farmers in sub district level
  • Privatized cultivation
Private companies and SMEs
SSNExpanding the area of SSN by
Increasing the number of VDG beneficiaries, Aged pensions holders
Department of social service
Department of women affairs

