1. Introduction
The transition from competition between single companies to competition between supply chains is an inevitable market development. Supply chains during the last fifty years have evolved from dyadic customer–supplier relationships through information sharing to strategic collaborations among supply chain partners [
1]. Supply chain management (SCM) is the decision-making process that manages different activities that generate advantageous profits to the suppliers, retailers, and customers involved [
2]. Due to the rapid development of the world economy for the consumption non-renewable resources and the deteriorating world environment, the importance of sustainability development is increasingly recognized across the world in individual organizations under the context of SCM [
3,
4,
5]. In recent years, research in the SCM discipline has increasingly been conducted under the concept of sustainable supply chain management (SSCM). Ahi and Searcy [
6] defined SSCM as: “The creation of coordinated supply chains through the voluntary integration of economic, environmental, and social considerations with key inter-organizational business systems designed to efficiently and effectively manage the material, information, and capital flows associated with the procurement, production, and distribution of products or services in order to meet stakeholder requirements and improve the profitability, competitiveness, and resilience of the organization over the short and long-term”. Veit, C. et al. [
7] analyzed whether customer perceptions towards sustainability are affected by a company’s country of origin and sourcing strategies, based upon the literature regarding customer interest in sustainable products. Quarshie, Salmi, and Leuschner [
8] examined and contrasted existing research and knowledge creation, focusing on sustainability and corporate social responsibility issues in supply chains, within and across these two disciplines. Linton et al. [
9] discussed new research paths for a sustainable supply chain perspective, outlining how it promotes environmental management research. Stefan and Martin [
10] offered a conceptual framework that summarizes the research on SSCM, concluding that SSCM involves a broader range of performance objectives, thereby taking into account the environmental and social dimension of sustainability. Carter and Rogers [
11] built a theoretical framework of SSCM that incorporates the TBL and four supporting aspects of sustainability: Risk management, transparency, culture, and strategy. Pagell and Wu’s [
12] further studied the development of the SSCM theory, with a particular focus on sustainability leaders’ novel SSCM practices.
Many upstream and downstream SMEs in the supply chain are led by core enterprises who cooperate to develop core competitiveness across the supply chain. However, SME financing difficulties have been a constant restriction on SME development, which can hinder the overall supply chain development. While many countries have recently introduced policies to support the development of SMEs, and these strategies have brought some relief to SME financing, they have not changed the global SME financing difficulties. For the SME financing difficulties, many scholars have been researching this subject from several perspectives. Some scholars analyzed the main reasons for financing difficulties based on internal SME factors such as cash holdings [
13], enterprise scale [
14,
15], and business growth cycle [
16,
17,
18], and others analyzing the external factors that restrict SME financing such as a lack of financing policies and SME focused financial systems [
19], the lack of financial institutions for SME services [
20], the lack of sound capital market systems [
21], and the lack of mature credit guarantee mechanisms [
22]. Due to the long-term SME financing difficulties, the growing popularity of industrial SME clusters and supply chain financing models have significant development potential and market prospects. As the core driving force for supply chain development, supply chain finance can play a vital role in resolving the financing difficulties for upstream and downstream SMEs.
Jacoby and Saulnier [
23] summarized the developments in US receivable financing, based on bill discounting, which was a pioneer in supply chain finance research. Berger [
24] first conducted a theoretical analysis of supply chain finance to resolve the financing problems, concluding that providing financing services for SMEs from the supply chain perspective was a positive step. He and Tang [
25] believed that the emergence of supply chain finance allowed for the development of a new financing model that could solve SME financing problems. Chen and Yano [
26] analyzed the supply chain finance mechanism to reduce credit risk from various factors such as financial status, internal management, customer service, and development cooperation, concluding that asset liquidity could be increased by streamlining the procedures associated with ownership transfers. More and Basu [
27] stated that supply chain financing manages the cash flow of transaction activities and processes in the supply chain for increasing turnover efficiency of working capital. Feng, Moon, and Ryu [
12] demonstrated that supply chain SMEs could reduce the cost of capital through income sharing contracts and repurchase contracts.
Supply chain financing has increasingly become a hot topic in supply chain management and a growing product category of financial institutions. In China, supply chain financing is experiencing a rapid development stage and numerous financial institutions have begun to focus on developing and designing new supply chain financing services and products to solve the financing issues facing SMEs [
28]. However, the reason for asymmetry of information makes it difficult for financial institutions to accurately identify the supply chain risks and make the most reasonable investment decisions.
Existing research on SME supply chain financing has mainly focused on a financing theory [
29,
30], the causes of the financing dilemma [
31] and financing countermeasures [
32]. However, there has been little research on the establishment of sound evaluation systems for SME supply chain financing. Designing a complete and practical SME supply chain financing system and an objective and practical method to evaluate SME financing to resolve the information asymmetry and to accurately predict SME growth is the key to successful financial implementation. Most previous SME supply chain financing evaluation research has analyzed SME operating status, capital financing, and development prospects from an economics perspective. However, sustainability becomes a growing demand within global business settings in the context of SCM. The World Commission on Environment and Development stated in the report, “Our Common Future” [
33], that: “Sustainable development is development that meets the needs of contemporary people without compromising the ability of future generations to meet their needs”. This definition embodies the two aspects of demand and restriction; that is, it must meet the needs of the present, as well as to ensure future development, and is therefore a continuous, coordinated development of the three dimensions of the economy, the society, and the environment. Therefore, the current economic interest-oriented supply chain financing concept is contrary to the sustainable development concept—see also John Elkington’ critique on the lack of systemic approach of his own TBL concept [
34]. Generally, blind investments based on only maximizing economic benefits can therefore face significant risks. In China, for example, there are already 176,000 “polluting” enterprises scattered across 28 cities, and those that fail to meet the new sustainability standards are to be shut down, regardless of whether they have good operating conditions and rapid growth. The closure of these enterprises will inevitably bring incalculable losses to investors; therefore, when assessing SME supply chain financing in the context of SSCM, it is necessary to break through the traditional single evaluation perspective focused on economic benefits and focus attention on the economic benefits that can be derived from enterprise development while paying attention to corporate social responsibility and restricting environmental damage. Therefore, this paper takes sustainable development theory as the basic premise for the development of an effective finance evaluation mechanism for supply chain SMEs that coordinates the transition from a single financial assessment to encompass economic, social, and environmental aspects. Through a combination of supply chain financing, the triple bottom line, and sustainable development, a basic SME finance evaluation framework is developed that not only provides better decision-making information for financial institutions, but also reduces the financial risks associated with SME financing.
Based on the triple bottom line theory, a framework for measuring the financing assessment of SMEs was developed. However, how to choose an objective and highly practical method to evaluate the scientific and effective analysis of the financing problems of SME supply chain has become a top priority. Firstly, due to the complexity of objective things and the limitations of cognition, the description and evaluation of things are often ambiguous and uncertain. The reason for this uncertainty may be the lack of information, abundance of information, conflicting evidence, and ambiguity. In order to extend the work on the possibility theory into a formal system of mathematical logic, Zadeh [
35] first proposed the fuzzy set theory approach in 1965, fuzzy set theory is mathematical principles for knowledge representation based on degrees of membership rather than on the crisp membership of classical binary logic. Watanabe. N [
36] proposed a theoretical method for estimating membership functions, which further enriched the connotation of fuzzy theory. Centobelli, Cerchione, and Esposito [
37] based on the classification method of the three dimensional fuzzy method to deal with misplacement problems, broadening the application of fuzzy theory in practice. In the fuzzy set theory, the membership function is one of its most basic elements. Among the membership functions, the triangular fuzzy number is one of the representative ones. Dağdeviren, Yavuz, and Kılınç [
38] believed that modeling with triangular fuzzy numbers is an effective way to make decision-making problems if the available information is subjective and inaccurate. In practical applications, the triangular form of the membership function has been most commonly used to represent fuzzy numbers [
39,
40]. Secondly, as a multi-objective decision-making method, Topsis has no strict restrictions on indicators, sample size and data distribution, and can avoid the loss of original data information to the greatest extent possible. The method ranks the advantages and disadvantages of the scheme by analyzing the distance between the best and the worst schemes, which significantly improves the scientificity, accuracy, and operability of multi-objective decision analysis. It has been successfully applied in many fields such as logistics supplier selection [
41,
42,
43], meteorological disaster assessment [
44], land use planning [
45], and human resource management assessment [
46]. However, in the process of dealing with problems, it requires that the preferences of decision makers must be definite, clear, and quantifiable. For some ambiguous and vague concepts, it is easy to ignore and produce errors in the process of processing. Therefore, in this paper, triangular fuzzy numbers are combined with an improved TOPSIS model to conduct multi-objective decision making to evaluate SME supply chain financing. On the one hand, the incomplete and uncertain information is transformed into fuzzy concepts using fuzzy triangular numbers, which quantifies qualitative problems and improves the accuracy and credibility of the evaluation process, thereby reducing some of the bias resulting from subjective evaluations. On the other hand, the improved TOPSIS model is used to conveniently, efficiently, and practically reflect the actual situation of each evaluation object.
The main innovation in this paper is the development of an SME supply chain financing evaluation system based on the triple bottom line theory to reduce financial institutional risks by combining the triangular fuzzy numbers used in multi-objective decision-making problems with an improved TOPSIS model to design a set of suitable SME supply chain risk assessment schemes.
2. Construction of SMEs Supply Chain Financing Evaluation Index System Based on Triple Bottom Line Theory
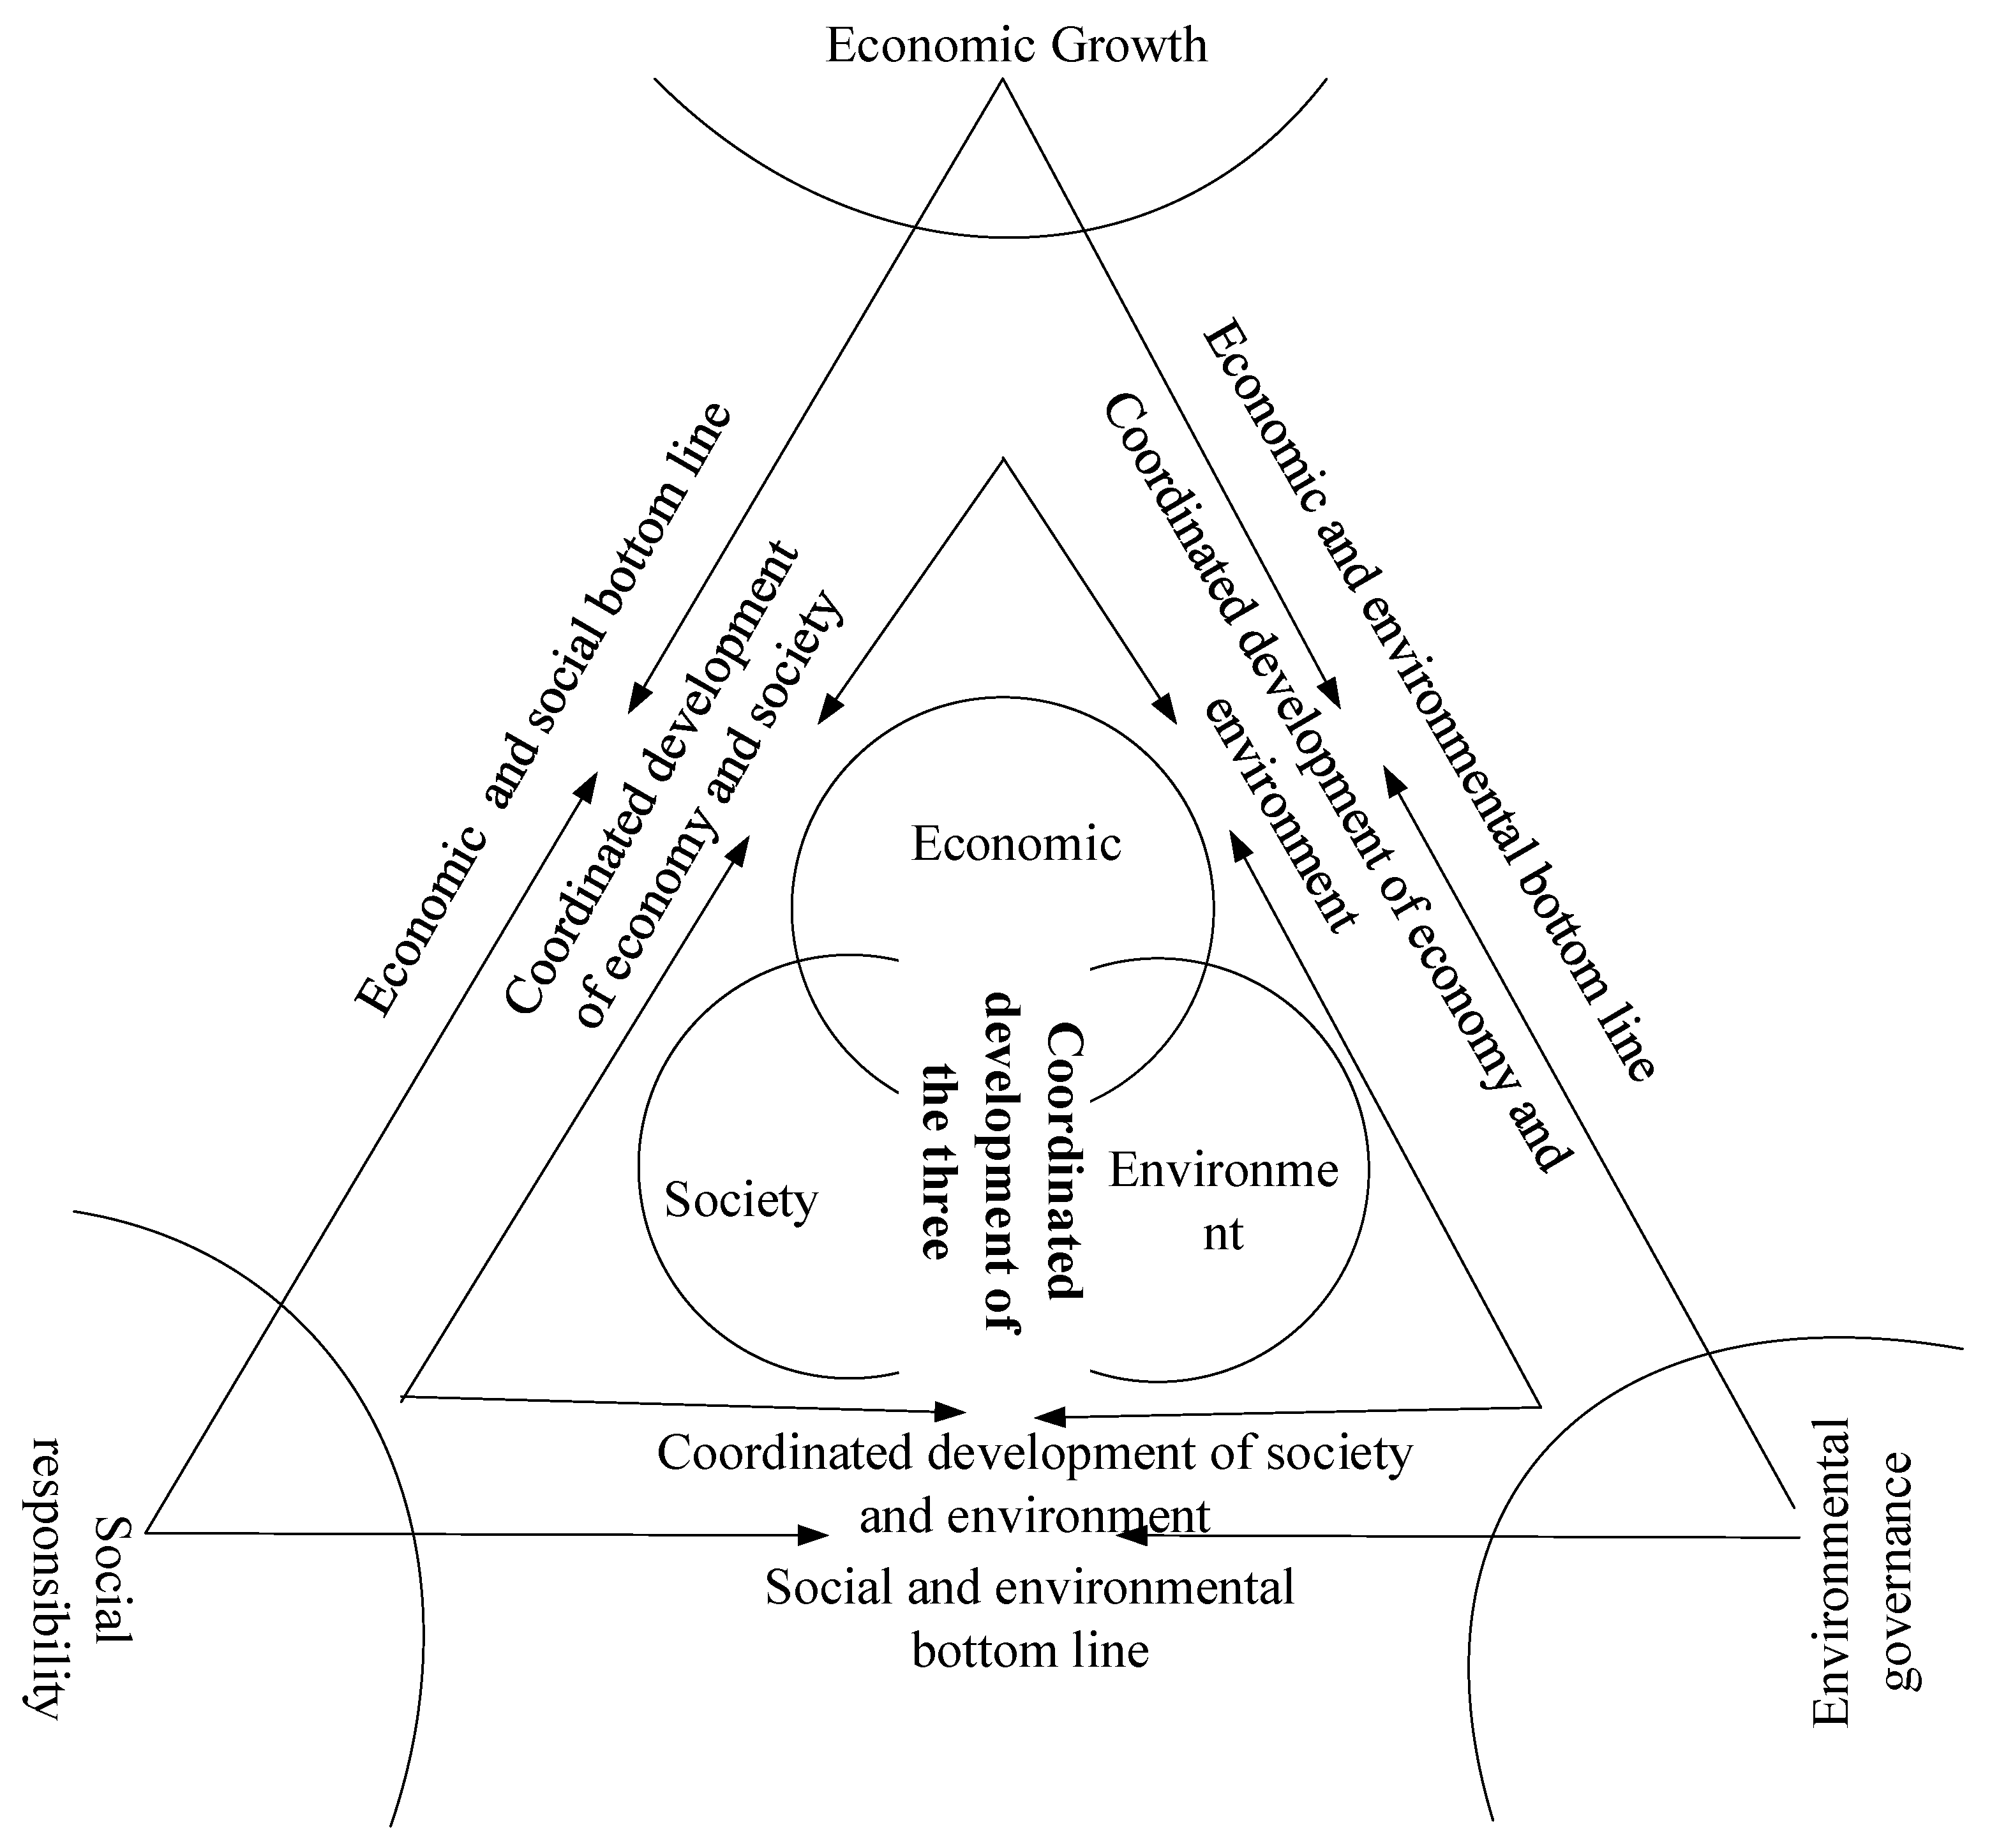
The SME supply chain financing evaluation system based on the triple bottom line theory [
36] is an evaluation model that comprehensively considers enterprise economic growth factors, social responsibility factors, and environmental governance factors to provide a wider range of decision-making information for supply chain financial services so they can decide on the best financing options for supply chain SMEs, which can be visually represented by
Figure 1.
(1) “Economic bottom line” evaluation index
Economic performance research has identified the comprehensive economic indicators as: Asset operating status, financial status, debt status, and development capability. Based on the Enterprise Performance Evaluation Standard Value, this paper constructs an economic bottom line indicator system from five aspects: Asset investment, profitability, asset quality, debt risk, and operational capability; and seven specific indicators, from which total investment, total return on assets, and asset-liability ratio are selected.
(2) “Social bottom line” evaluation indicators
The “social bottom line” measures the ability and effectiveness of enterprises to fulfill their social responsibilities. Corporate social responsibility can be divided into broad social responsibility and narrow social responsibility, with broad social responsibility encompassing corporate environmental responsibility and economic responsibility. Based on the GRI (The Global Reporting Initiative), narrow social responsibility encompassed the five aspects of employment compensation: Labor security, training and education, occupational safety, and social donations, and further specific indicators such as employment position and labor contract signing rates.
(3) “Environmental bottom line” evaluation index
Based on the sustainable development theory, this paper draws on the indicators recommended by the Sustainability Reporting Guidelines to analyze the actual situation for SME supply chain financing, such as pollution control, energy consumption, resource utilization, and environmental protection, using five specific indicators to evaluate the corporate environment bottom line such as total greenhouse gas emissions and total direct energy consumption.
Based on the above analysis of the enterprise economic bottom line, the social bottom line, and the environmental bottom line evaluation indicators, a summary table for a SME supply chain financing evaluation index system is developed, as shown in
Table 1.
3. Relevant Theoretical Knowledge
3.1. Fuzzy Set Theory in Multi-Criteria Decision Making
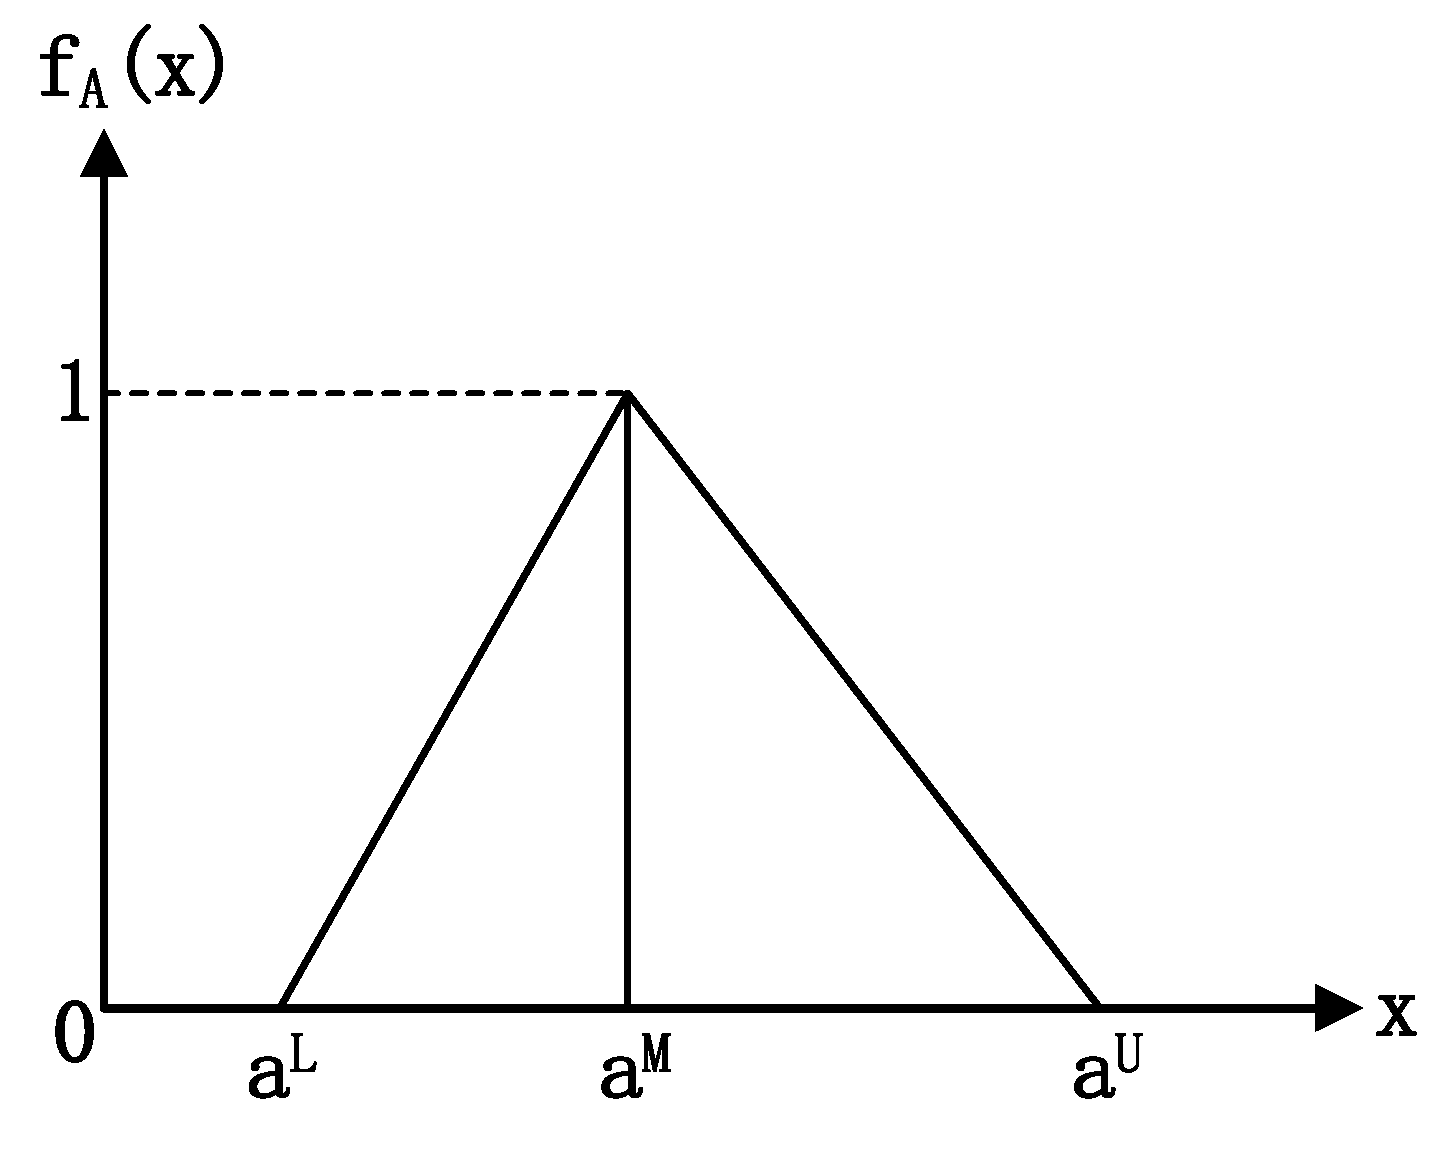
A fuzzy set is a type of object with a continuous membership, the intermediate value for which is between zero and one. The fuzzy subset A of the universal set X is defined by the membership function , which maps each element in X to a real number [0,1]. When an element membership is one, this indicates that the element belongs to the collection; however, when the element membership is zero, this means that the element is definitely not in the collection. Ambiguous cases are assigned a value between zero and one; therefore, the triangular fuzzy number can be expressed as (a, b, c), which, respectively, represent the smallest possible value, the most promising value, and the largest possible value for the fuzzy event. In the following, some important fuzzy set theory definitions and symbols are reviewed.
Definition 1. If the fuzzy number can be determined byand the membership function (or feature function) is: is a canonical triangular fuzzy number,; when,is an exact number.
The distribution of triangular fuzzy numbers is shown below (see
Figure 2).
In the program evaluation, is the most conservative estimate, is the most likely estimate, and is the most optimistic estimate.
Let and , where , is the fuzzy number. If , < 0.5, the ambiguity is small, and if , > 1, the ambiguity is too large. Generally , is most appropriate.
Definition 2. Triangular fuzzy number arithmetic properties.
Letandbe two triangular fuzzy numbers. The operational laws for these two triangular fuzzy numbers are as follows: The distance between the two fuzzy numbersis calculated as: Definition 3. Assume that a decision group has K DMs. The fuzzy rating of each DM (n = 1, 2, …, K) can be expressed as a positive triangular fuzzy number R with the membership function f(x). Then the aggregated fuzzy rating can be defined as: 3.2. The Fuzzy TOPSIS Method
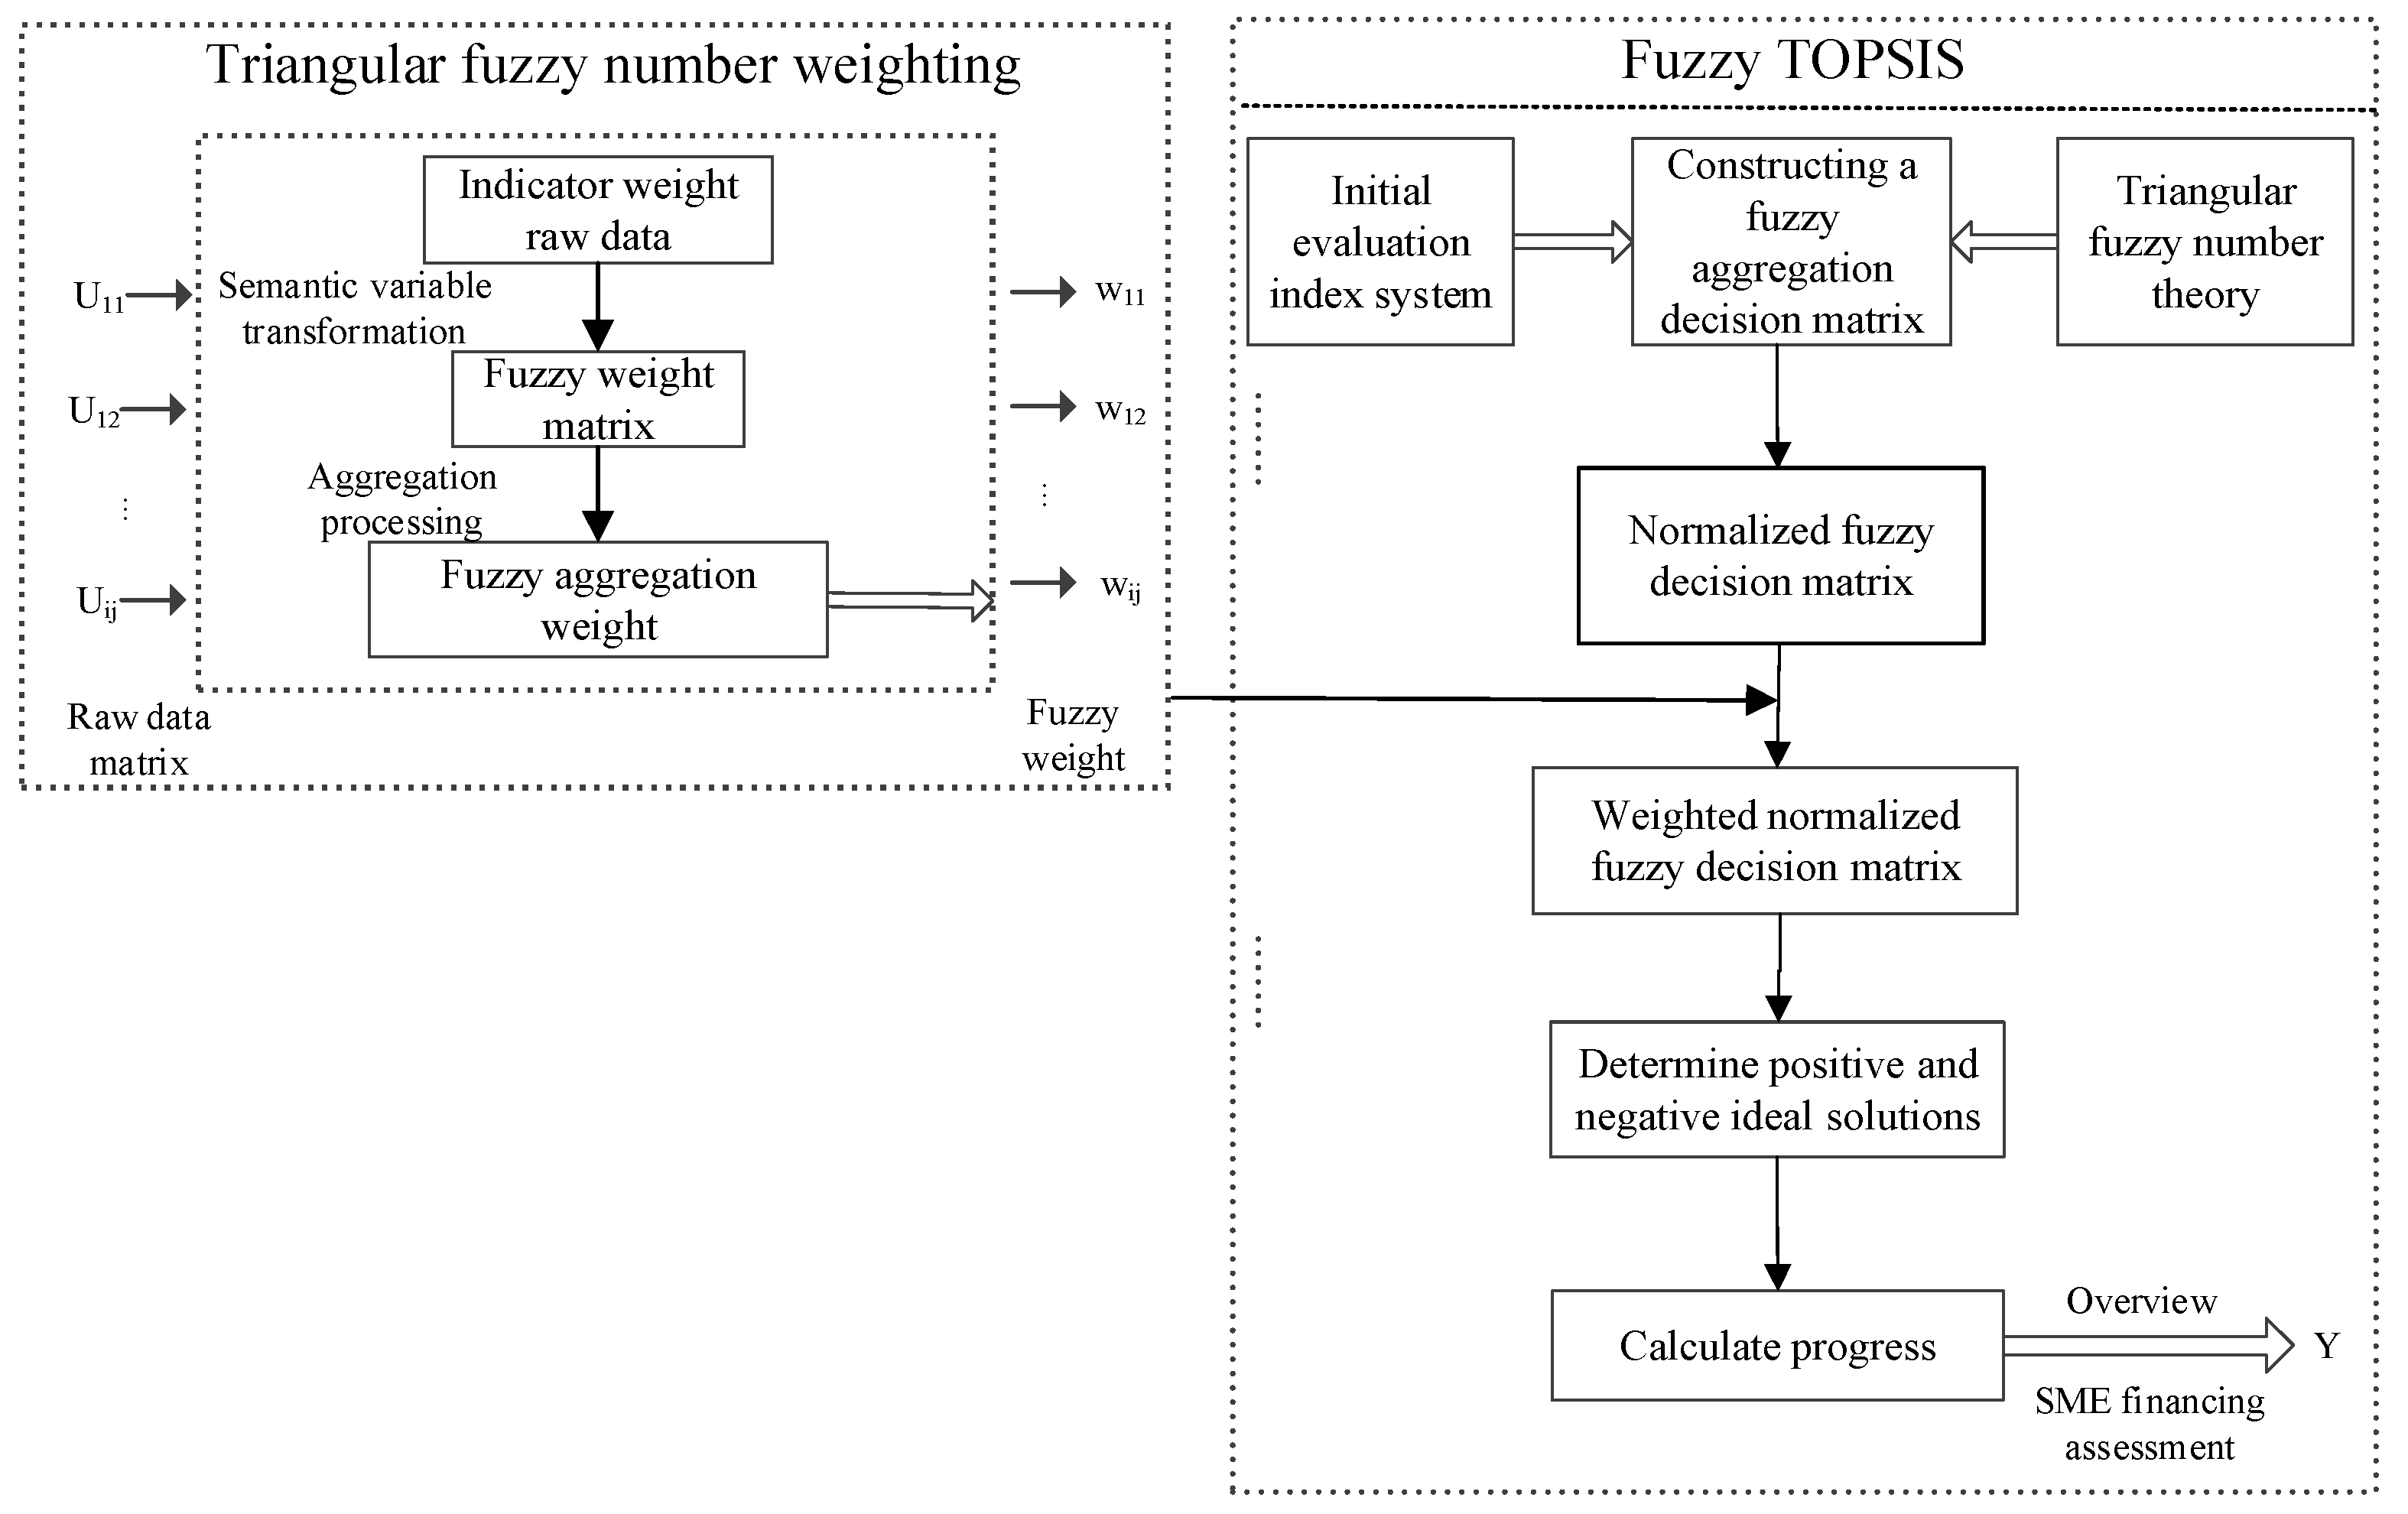
In a multi-objective decision problem, the greater the degree of association between the decision plan and the ideal solution, the more likely the program is selected as the optimal solution. The TOPSIS method was first proposed by Hwang and Yoon to solve a multi-objective decision making program optimization problem. The basic principle is to choose the best decision-making scheme by minimizing the distance between the decision-making scheme and the positive ideal solution and maximizing the distance from the negative ideal solution. In this study, a fuzzy TOPSIS model is proposed to optimize the multi-objective decision algorithm, which allows the model to achieve more effective and satisfactory results in the “fuzzy information” environment, the specific research framework is shown in
Figure 3. And the specific steps are as follows:
Step 1. Calculate the normalized decision matrix.
A canonical fuzzy decision matrix can be expressed as:
where
B and
C are the benefit and cost criteria sets, and
The normalization method mentioned above preserves the triangular fuzzy number attribute that the element normalizes (normalized).
Step 2. Calculate the weighted normalized decision matrix.
The weighted normalized value
is calculated as:
where
and
is the weight of the
attribute or criterion.
Step 3. Determine the positive and negative ideal solutions.
The fuzzy positive ideal solution (FPIS,
) and the fuzzy negative ideal solution (FNIS,
) can be defined as:
where
, and
, and
.
Step 4. The distance of each alternative from the positive and negative ideal solution
,
can be calculated as:
where
is the distance measurement between two fuzzy numbers.
Step 5. Calculate the relative proximity to the ideal solution.
Calculate the relative closeness to the ideal solution and rank the performance order. The closeness coefficient (
CCi) of the alternative SMEi can be expressed as:
Step 6. Rank the priorities.
Rank the preference order. Alternative is closer to FPIS () and furthest from FNIS () as approaches 1. Based on the descending order for the ranking order of all alternatives can be determined and the best of the possible alternatives selected.
4. Case Study
A practical case was chosen to test the practicality and effectiveness of the assessment methods provided. This case is an example where XX commercial organization in Chengdu in making a decision as to which SME they should invest in. As it involves trade secrets, details about the decision makers and the commercial organizations are not disclosed in this paper.
First, the SME sustainability performance criteria for the assessment were determined from previous research. Then, selected experts provided linguistic ratings for the standards and alternatives and fuzzy TOPSIS was used to aggregate the ratings, generate the overall performance scores, and sort each supply chain SME to be financed to finally select the best SMEs. A sensitivity analysis was performed to determine the impact of different evaluation systems on the decision outcome. Based on the criteria in
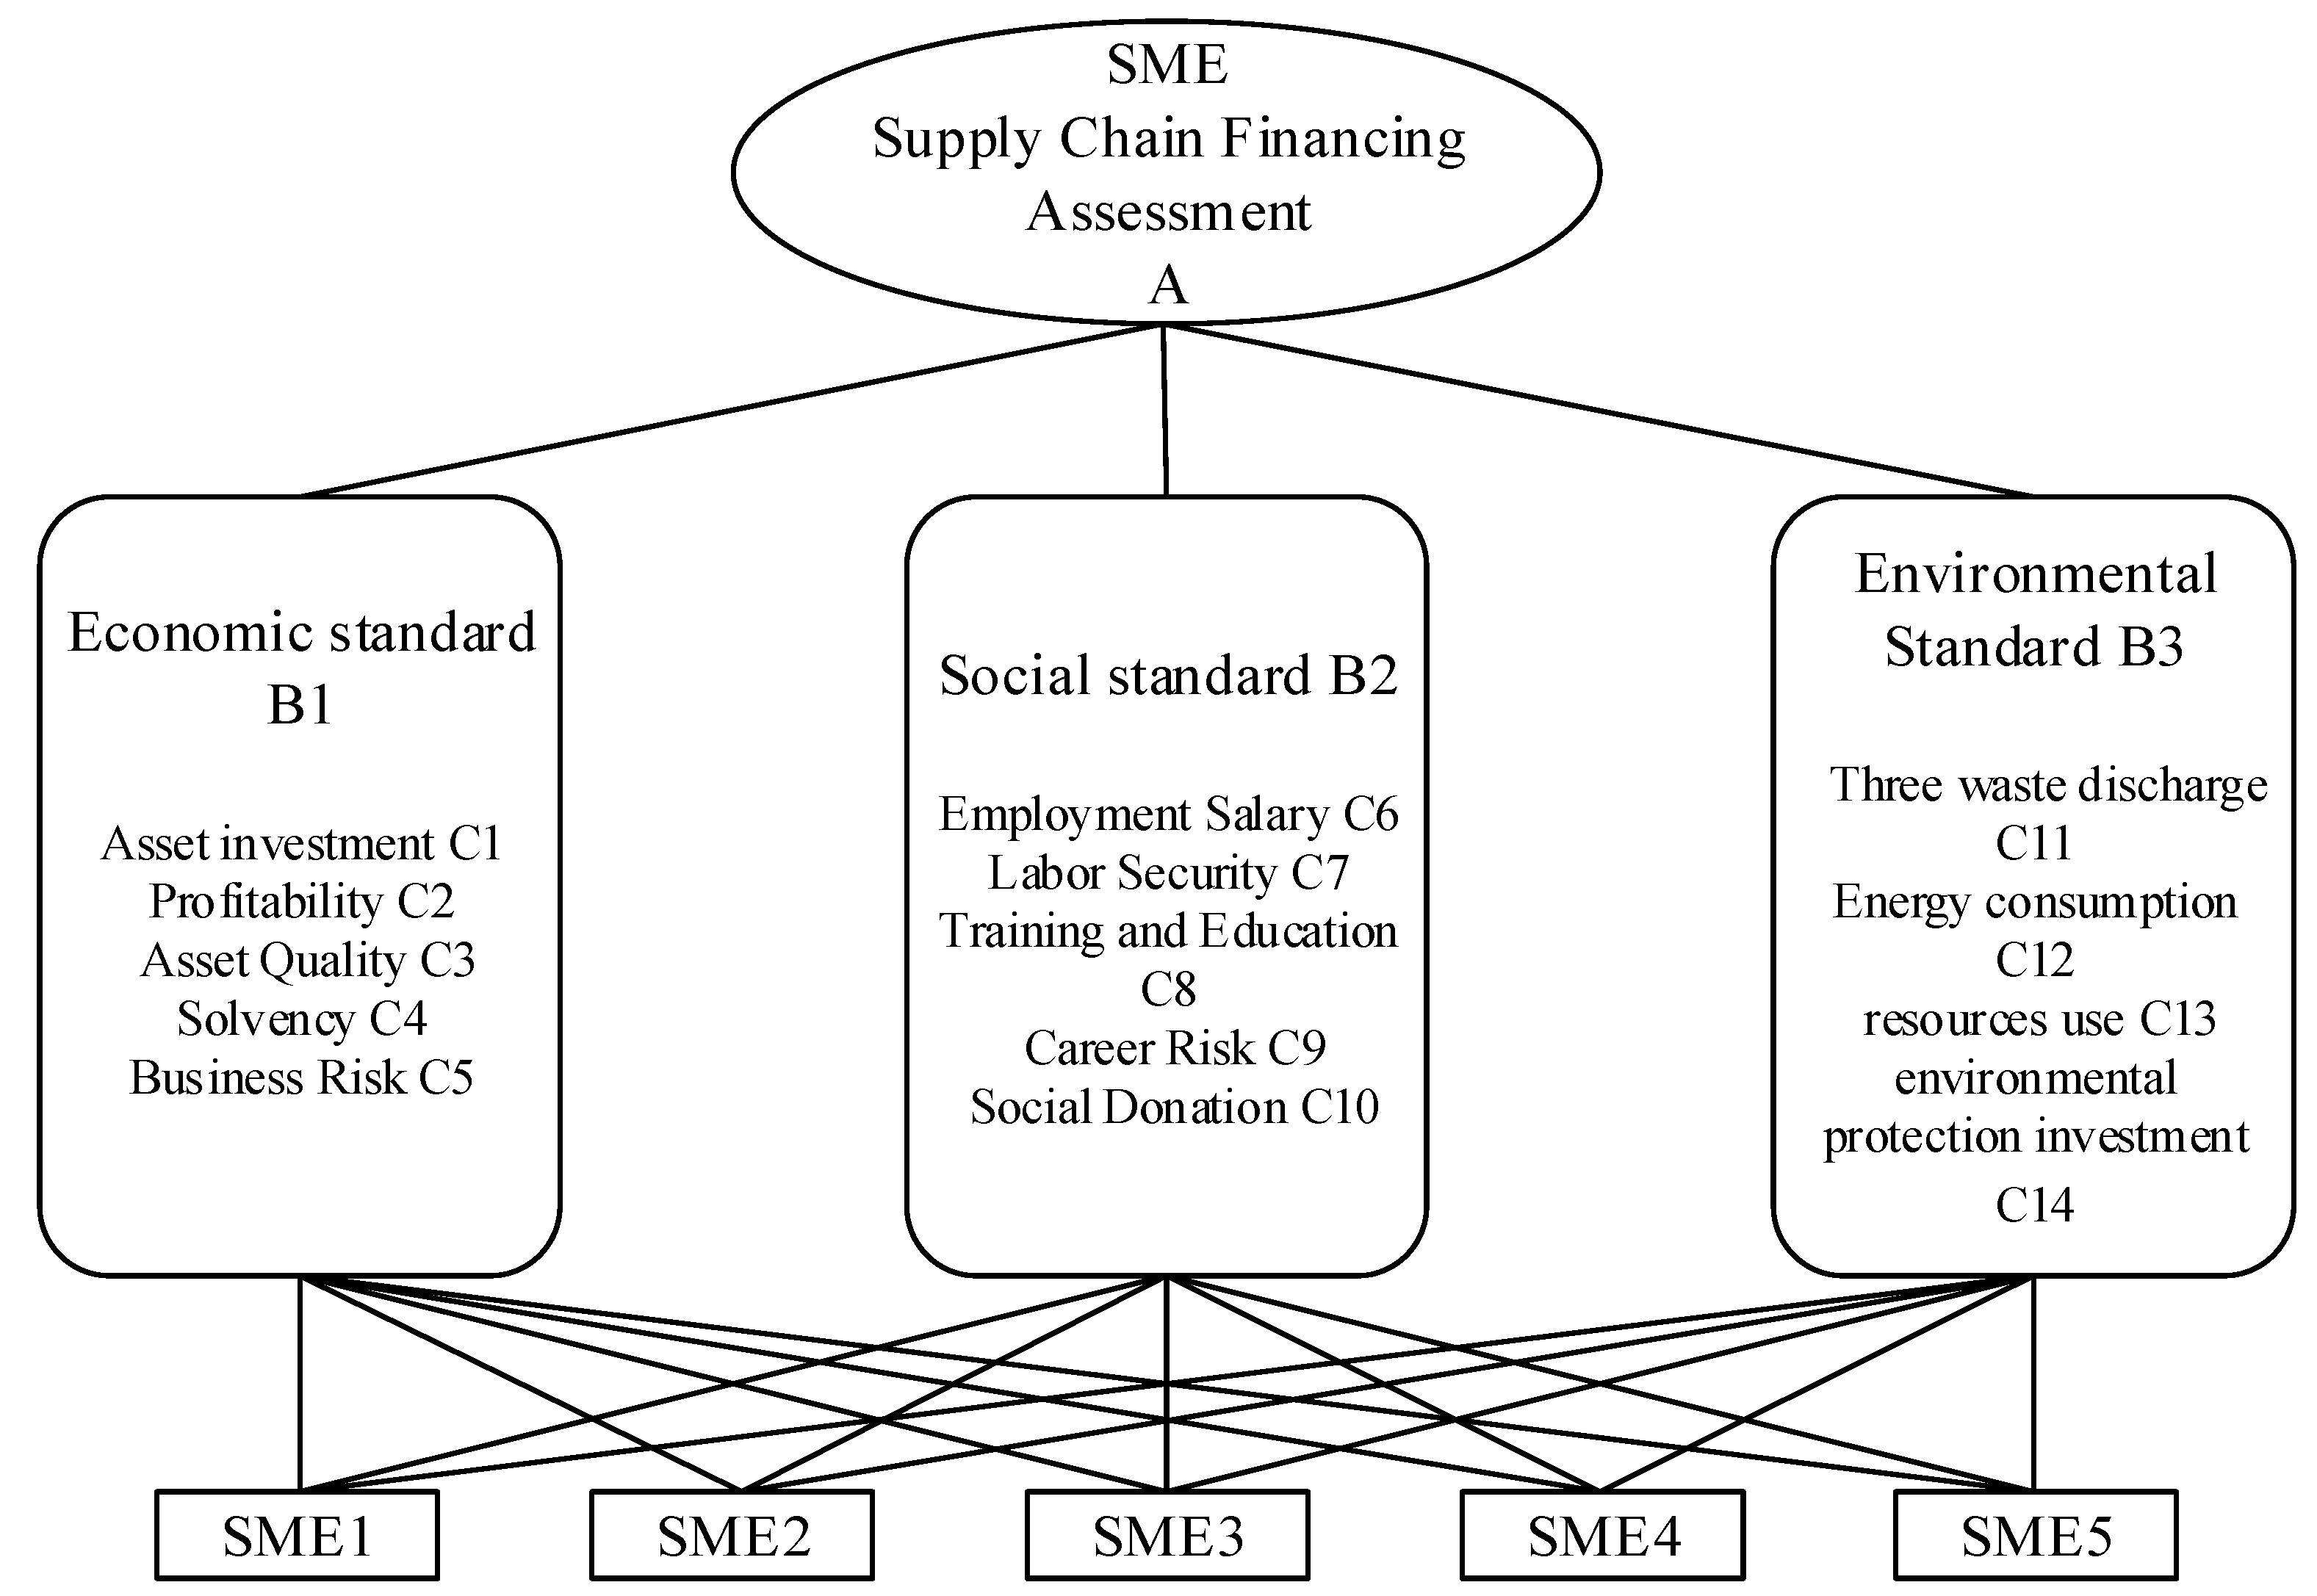
Table 1 for the SME Financing Evaluation Index System, questionnaires were distributed to three investment and financing experts for comment, the results from which clarified the relative importance weights of the various standards and ratings. As shown in
Table 1, there were five economic standards (X11, X12, X13, X14, and X15), five social standards (X21, X22, X23, X24, and X25), and four environmental standards (X31, X32, X33, and X34), of which X22, X24, and X32 were cost standards, and the others were efficiency standards. The hierarchical structure of the decision problem is shown in
Figure 4.
In the fuzzy set theory, conversion scales are applied to transform the linguistic terms into fuzzy numbers. In this paper, we will describe the relative importance weights for the linguistic variables and criteria ratings using linguistic variables are expressed by five scales [
47], as shown in
Table 2.
The three experts independently expressed their opinions on the importance weights for the fourteen standards and the fourteen standard ratings for each SME.
According to
Table 2, we transfer the three experts’ semantic variables about the importance weight of the fourteen standards and the fourteen standard ratings of each SME into triangular fuzzy numbers, and then calculate the fuzzy aggregation decision matrix and standard fuzzy weights by Equation (9), which is shown in
Table 7.
According to Equations (10) and (11), the fuzzy aggregation decision matrix is normalized to obtain a normalized fuzzy decision matrix, as shown in
Table 8.
To calculate the weighted normalized fuzzy decision matrix by Equation (12), and the result is presented in
Table 9.
To determine the positive and negative ideal solutions, according to Equations (13) and (14), and then calculate the distance between the SMEs and
Z+ and
Z− by Equation (8). The result is shown in
Table 10.
To calculate the distance of each alternative from the positive and negative ideal solution and the closeness coefficient of the alternative SMEi by Equations (15)–(17), and the result is shown in
Table 11.
4.1. Results Analysis
The final results of the fuzzy TOPSIS analysis are shown in
Table 11. From the tightness coefficient (
CCi) value, the ranking order for the five SME supply chain financing assessments is: SME2 > SME1 > SME5 > SME4 > SME3.
Therefore, it can be concluded that SME2 has the best sustainability and is the most suitable investment target. Considering all criteria based on the triple bottom line theory, we have presented an analysis of an SME supply chain financing assessment. In the next section, we examine whether changing the evaluation standards or the number of decision makers has an impact on the decision outcome.
4.2. Sensitivity Analysis
The purpose of the sensitivity analysis is to detect whether there is a difference in the evaluation results when selecting different decision makers or different evaluation criteria for the SMEs that need to be financed to judge the degree of influence of the evaluation factors on the decision results.
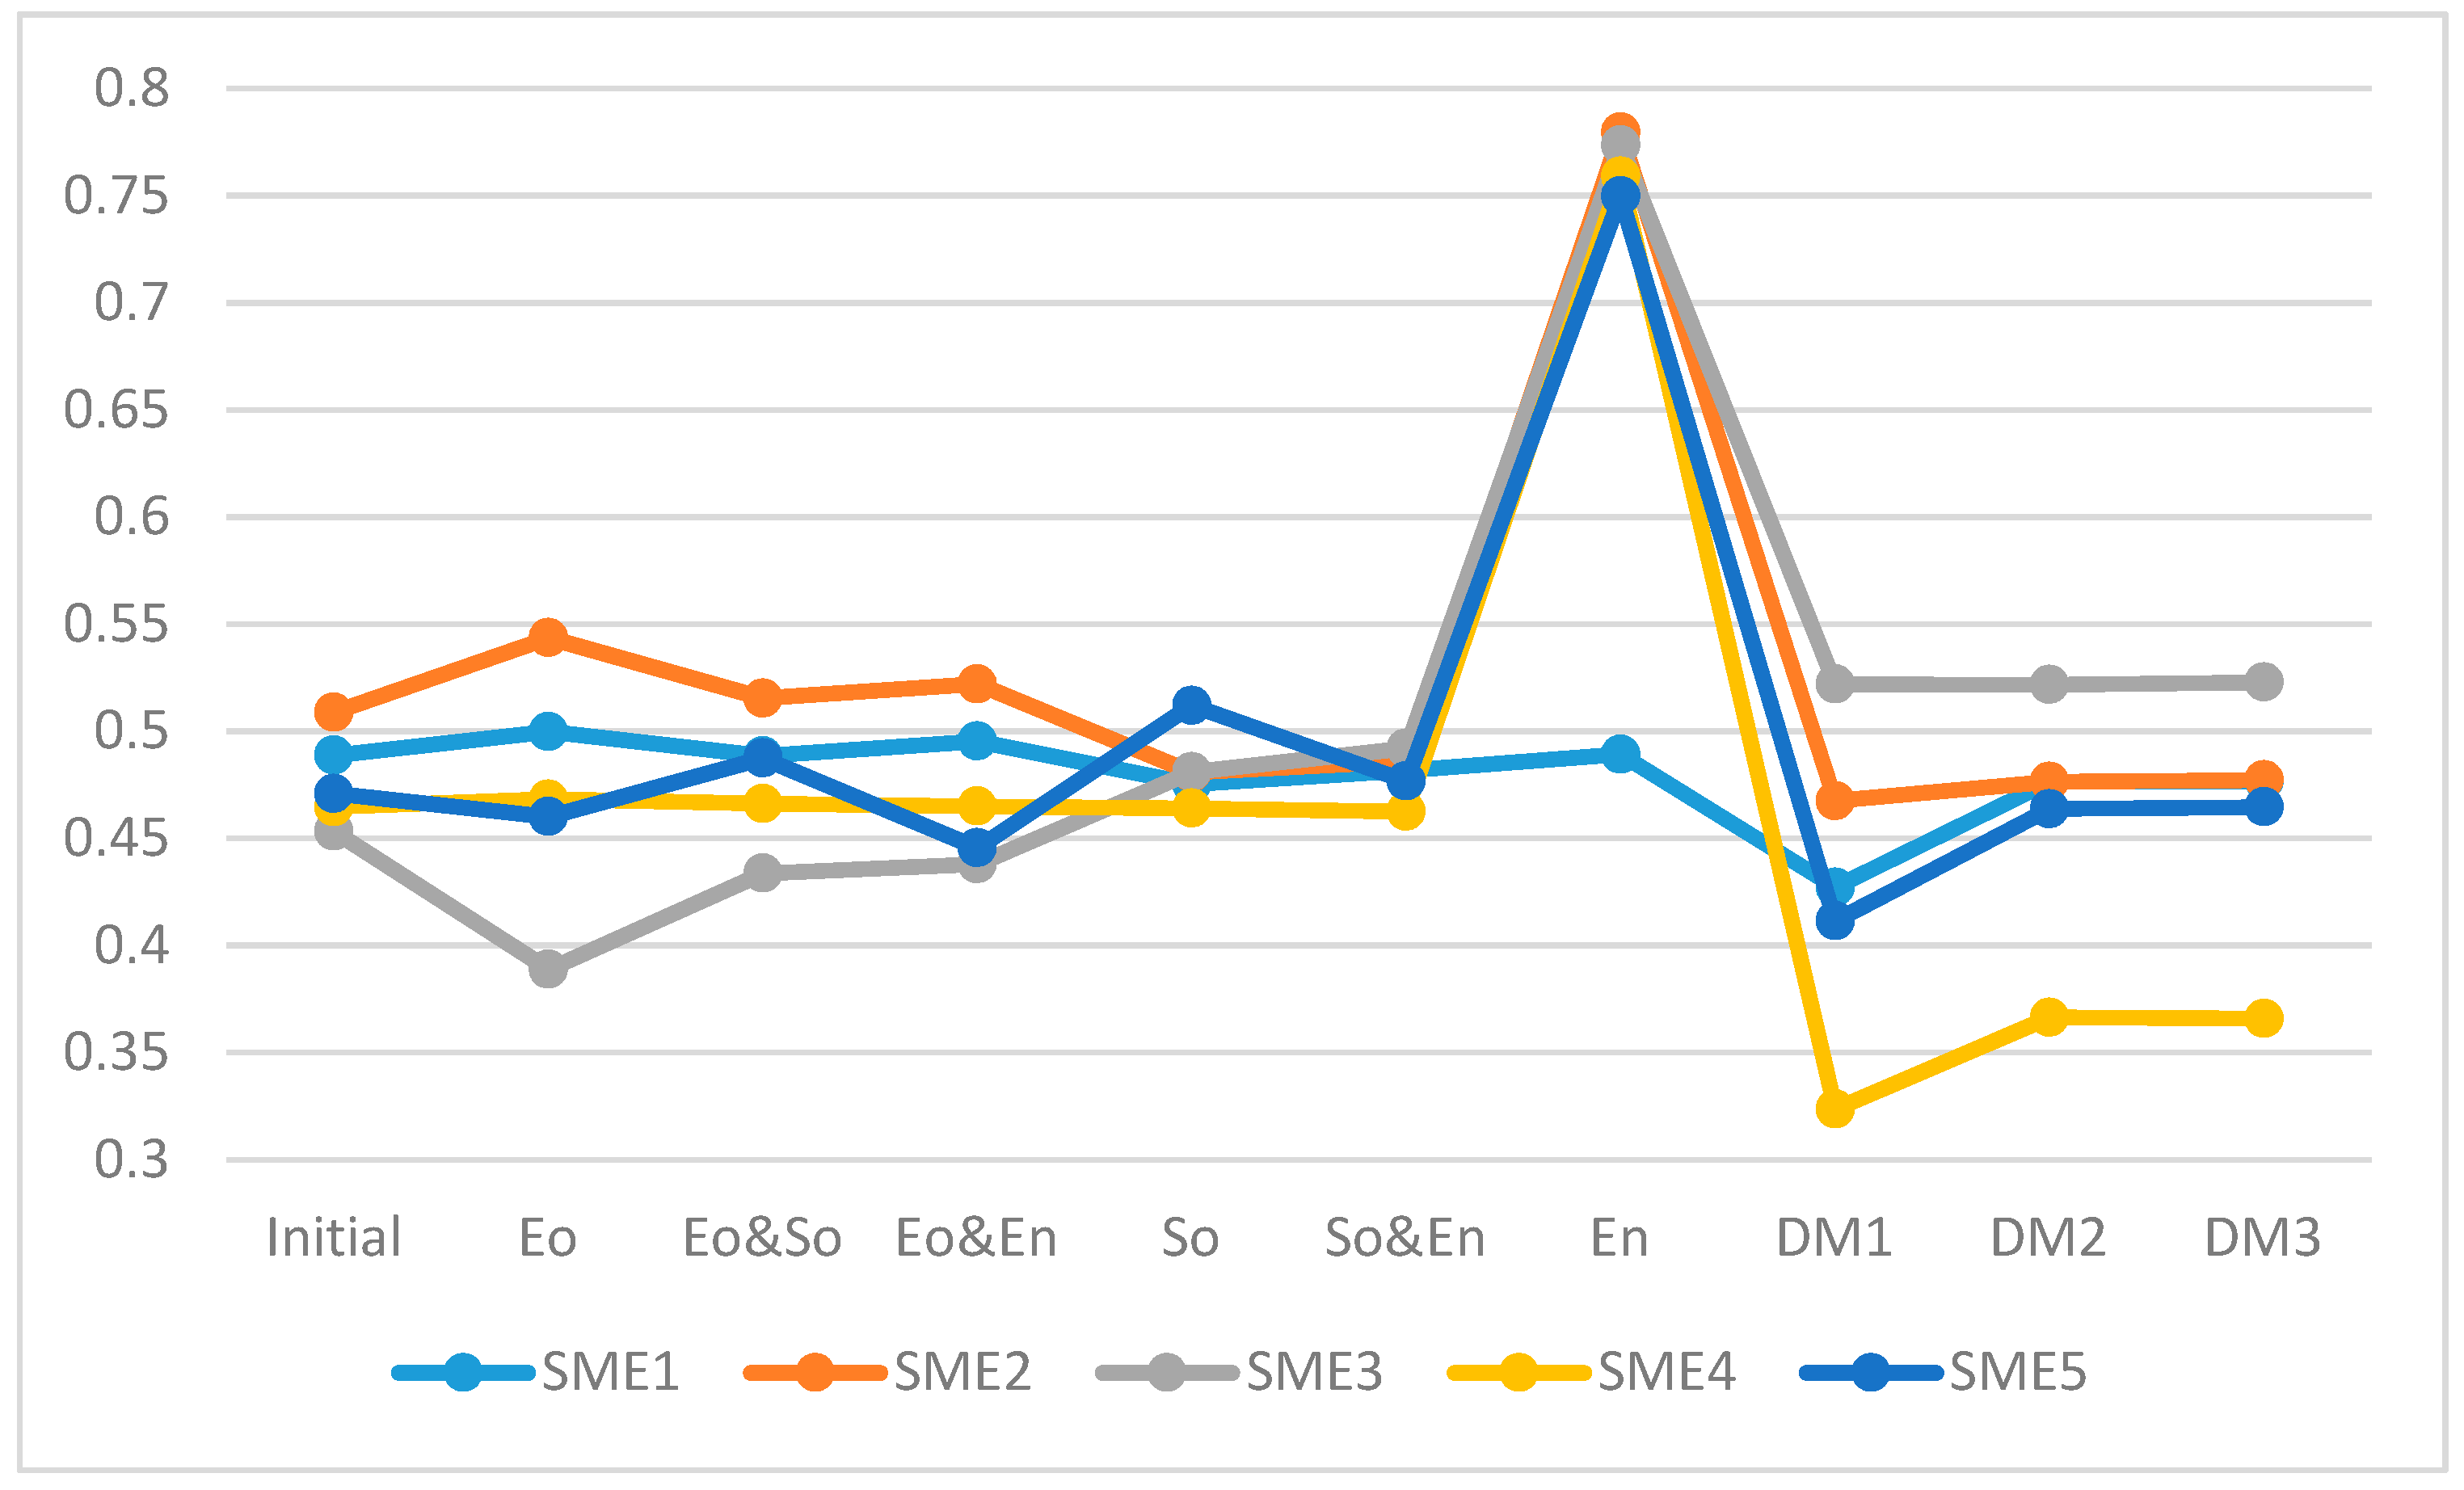
Table 12 lists the specific details of nine different evaluation criteria, and
Figure 5 shows a graphical representation of the evaluation results under different evaluation criteria, of which conditions, 1, 4, and 6 only consider a single economic, social, and environmental indicator and the scores of three decision makers. An analysis of the changes in the SME rankings indicated that using traditional single economic indicators to evaluate SME financing decisions can introduce considerable risk. Conditions 2, 3, and 5 take account of the economic and social indicators, the economic and environmental indicators, the social and environmental indicators, and the scores of the three decision makers. As can be seen, the SME rankings have changed because the focus of the evaluation indicators is different and the investment options are also different. Conditions 7, 8, and 9 analyze the SME supply chain financing evaluation index system scores based on the triple bottom line theory. Again, the SME rankings have changed, indicating that expert decision-making has certain subjectivity. To reduce the decision-making risk, the number of experts should be appropriately increased. Based on the sensitivity analysis, it can be seen that the types of standards in the decision-making process and the number of experts and their professional judgment on the standards are sensitive to the evaluation results; therefore, they should be carefully selected. By conducting a comprehensive and scientific evaluation of the SME supply chain financing based on the triple bottom line theory, the risks of supply chain financial decision-making can be further reduced.
5. Conclusions
With a focus on sustainable development, the environment needed for SME supply chain financing performance evaluations has changed. Current performance evaluation systems are based on economic benefits and financial indicators; however, when considering sustainability, additional non-financial indicators such as social contributions and environmental protection need to be considered. To this end, this paper took a sustainable development research perspective to develop an SME supply chain financing evaluation system that included the three aspects of the triple bottom line theory: The economy, society, and the environment. Therefore, a new SME supply chain financing performance evaluation index was developed that can assist future decision makers make financing decisions based on sustainable development policies based on an objective analysis and scientific rigor.
(1) To ensure sustainable development, when commercial banks are deciding on SME supply chain financing, they need to fully consider all stakeholders. This means they need to consider not only the financial indicators that reflect economic interests, but other non-financial indicators that reflect the long term social and environmental impacts. To reflect the social and environmental impacts, the non-financial indicators of influence should be based on current and future societal development aspirations using a more scientific, efficient approach. SME’s who do not follow this new approach should face the risk of having their investments contracts reduced or even terminated. If this type of approach were taken, the commercial bank investment risks from supply chain financing could be significantly reduced.
(2) Based on the triple bottom line theory, SMEs can benchmark and compare themselves and develop better products and processes to improve their sustainability performances. Such measures could encourage firms to take longer term approaches when adopting financing strategies for SME developments. Such a holistic approach could, in turn, help to reduce the negative externalities generated in the society and on the environment.
(3) The research perspective for SME supply chain financing performance evaluations has changed with more scientific development concepts gradually becoming the guiding ideology so that the SME supply chain financing evaluations are not only based on profitability, but also based on the “triple bottom line”, which can result in a win-win situation for the economy, the society, and the environment.
In general, our proposed SME supply chain financing evaluation model based on the “triple bottom line” theory enriches the SME supply chain financing evaluation theory and expands the application range of the “triple bottom line” theory in SME supply chain financing decision-making. However, this paper still suffers from limitations and extends future research directions as follows:
(1) The SME supply chain financing evaluation model adopted in this paper is still unable to avoid subjectivity in the determination of the weight of each index, so further research is needed.
(2) When selecting the indicators based on the triple bottom line, this paper is more general. Therefore, in the future research, for sustainable development, SME supply chain financing assessments and the related indicators should be dynamically adjusted, quantified, and calculated based on the development of different regions and different industries and related policies.


