Article

An Asymmetric Nash Bargaining Model for Carbon Emission Quota Allocation among Industries: Evidence from Guangdong Province, China

School of Business Administration, South China University of Technology, Guangzhou 510640, China
*
Authors to whom correspondence should be addressed.
Sustainability 2018, 10(11), 4210; https://doi.org/10.3390/su10114210
Submission received: 2 October 2018 / Revised: 24 October 2018 / Accepted: 9 November 2018 / Published: 15 November 2018
(This article belongs to the Section Environmental Sustainability and Applications)

Abstract

:
As the most cost-effective mechanism, an emissions trading scheme (ETS) plays an important role in mitigating global warming, whilst any such scheme requires the initial allocation of quotas. Current allocation methods, however, pay little attention to the interests of abatement entities, which will hinder the long-term sustainable goals. To mobilize the enthusiasm of different abatement entities, this study proposes a multiplayer asymmetric Nash bargaining model, ensuring that all entities can obtain more quotas after negotiation. To demonstrate the advantages of the proposed method, this study selects Guangdong where the principal allocation method is the grandfathering approach as an illustrative case and develops three preference cases including balanced weighting, economic-oriented weighting, and emission-oriented weighting. The empirical results show that the proposed method not only reflects the “polluter pays principle”, but also helps to save emission reduction costs. In further analysis, this study considers both free allocation ratio and ETS coverage, providing inspirations for policy makers to develop new ETS regulations. In general, the proposed method not only assists policy makers of Guangdong in improving the current ETS deficiencies but also can be generalized into other regions.

1. Introduction

Currently, more than 25 billion tons of carbon dioxides associated with human activities are released annually, leading to a series of ecological and environmental issues [1,2]. For this reason, the development of reasonable policies in energy consumption management and the changing from conventional fuel to biofuel are stringent necessity [1]. In terms of energy consumption management policies, the emissions trading scheme (ETS) has been widely adopted by many countries due to its cost-effective [2]. As the world’s largest emitter of greenhouse gas, China planned to establish a unified national ETS at the end of 2017 [3]. Although China has completed the preliminary construction of the national ETS so far, only the power industry is covered. Other industries with global environmental governance problems, such as industrial and transportation sectors [4], are still in the preparatory stage. To accumulate experience for the national ETS, seven pilot ETSs including two provinces (Guangdong and Hubei) and five cities (Shenzhen, Beijing, Chongqing, Tianjin, and Shanghai) have been established since 2013 [5]. Additionally, as the core component of the ETS, the initial allocation of carbon emission quotas has attracted attentions from both policy makers and academics [6].
Theoretically and practically, the allocation methods including grandfathering [2], benchmarking [7], indicator approach [8], and optimization approach [9] are widely used and investigated. In the context of China’s initial quota allocation, most of the pilot ETSs adopt the grandfathering approach while a few of the pilot ETSs employ the benchmarking approach [10]. Although these allocation methods assigned the initial quotas based on different principles, these methods essentially have commonality with the mandatory commands of the government and ignore the interests of abatement entities. From the perspective of individual rationality, each abatement entity hopes to obtain more initial quotas because the transaction cost (e.g., negotiation cost) in reality is not zero. To make up for the deficiency of the widely used methods, the Shapley value approach was developed to consider different abatement entities’ interests [11]. While the Shapley value approach has the merits of alliance profit allocation, it is under the assumption of cooperation between alliance partners. Practically, it is difficult to determine the alliance profits of various stakeholders when less cooperation is formed. Moreover, it is unfair in the competitive context of carbon emission quotas allocation if alliance cooperation is allowed.
To fill the current research gaps, this paper aims to propose a balanced way for the carbon emission quotas allocation, which can be used to reallocate the initial quotas and enhance the initiatives of abatement entities. Technically, this paper develops a multiplayer asymmetric Nash bargaining model from the perspective of negotiation [12,13]. On the one hand, the form of the Nash bargaining model ensures the increased benefits of each participant through negotiation [14]. On the other hand, three bargaining power cases including balanced weighting, economic-oriented weighting, and emission-oriented weighting increase the generalizability of the model. To verify the advantages of the proposed method, Guangdong is used as an illustrative case to compare the proposed method with the grandfathering approach. The empirical results show that the proposed method not only reflects the “polluter pays principle”, but also helps to save emission reduction costs. Furthermore, both free allocation ratio and ETS coverage are considered in this study, which provides inspirations for policy makers to develop new ETS regulations. Remarkably, in this paper, carbon emissions are the abbreviation of carbon dioxide emissions.
There are three major contributions of this study. Firstly, this study proposes a new method for the allocation of carbon emission quotas, which makes up the deficiency of the existing literature. Secondly, because fewer variables and parameters are needed, the proposed method can be easily implemented in other regions or economies. Last but not least, analyzing the case of Guangdong pilot ETS not only assists policy makers of Guangdong in establishing an effective ETS but also provides references for other regions’ ETSs. The rest of the paper is structured as follows. Section 2 reviews the literature. Section 3 introduces data definitions and methodologies. Section 4 provides the results and discussions. Section 5 highlights policy implications and Section 6 summarizes the conclusions.

2. Literature Review

The related previous literature can be classified into three categories. The first category is related to the initial allocation methods. The second category is related to how the free allocation ratio affects the ETS. The last category is related to the ETS coverage.
For the first category, different allocation methods emerge in the literature such as indicator approach, optimization approach, game theory, and hybrid approaches [15]. These approaches investigate the allocation of carbon emission quotas based on different perspective or principles, such as egalitarianism [16], minimizing abatement costs [17] or maximizing profits [11], as well as improving allocation efficiency [18]. Currently, the grandfathering approach and benchmarking approach are widely used in European Union Emission Trading System (EU ETS) and China’s ETS [8,9], which are based on the historical carbon emission of each company and the benchmark of each industry, respectively [2,10]. Although the above approaches provide some insights for policy makers, their common feature is that none of them are based on the interests of participants except the Shapley value approach [19]. However, it is difficult to determine alliance profits of the Shapley value approach in practice, and the alliance cooperation may cause unfair competition. To overcome this limitation, this paper proposes a multiplayer asymmetric Nash bargaining model from the perspective of negotiation [12,13]. Compared with the Shapley value approach, the Nash bargaining model is a nonalliance cooperation game, and thus it can reflect the fairness of the negotiation process [20]. Moreover, it is easier to implement in practice because the Nash bargaining model does not need to calculate the alliance interests.
For the second category, most existing literature related to allocation methods usually assumed that the initial quota was completely free [21]. Only a few studies explored the impact of different free allocation ratios on the ETS. Daskalakis and Markellos [22] argued that free allocation was suitable for the ETS at the infant stage in order to reduce the resistance from companies. However, Ausubel and Cramton [23] insisted that auction had more advantages than free allocation only if the profits of the auction were not wasted. Moreover, other scholars argued that free allocation and high emission caps were not appropriate for the long-term development of the ETS [24,25], due to ignoring the abatement efforts of each entity [26] and violating the “polluter pays principle” [10]. Although the above scholars pointed out the flaws of free allocation, they did not give a definite and clear free allocation ratio to the current ETS. In terms of China’s ETS, the ratio of free quota to auction are 95:5 or 97:3 [2]. However, the experience of the EU ETS showed that a high free allocation ratio would lead to windfall profit for those industries with high historical carbon emissions [7]. Therefore, it is necessary to determine a reasonable free allocation ratio according to the real circumstance of various regions. Although Li and Jia [27] used a CGE model and established 10 scenarios to explore the impact of different free allocation ratios on the ETS, their work did not highlight the specific free allocation methods. This study fills the gaps by introducing different free allocation ratios for the different free allocation methods.
For the third category, different from foreign studies dealing with industrial carbon allocation issues [28,29], the existing literature in China mainly concentrated on the allocation of initial quotas at the provincial level [30,31], and seldom considered at the industrial level [32,33]. Moreover, several Chinese studies simply allocated carbon emission quotas to different industries without further analyzing the emission reduction potential of the industry [18]. Currently, the Chinese government is planning to cover eight key emission reduction industries in the national ETS [34]. Therefore, it is necessary to evaluate the effectiveness of ETS coverage and to assign the quotas at the industry level. Fan et al. [10] investigated the ETS coverage from the perspective of cost savings. Their results revealed that when the ETS coverage reached a certain extent, the contributions of increasing coverage to cost savings were no longer significant. Therefore, to clarify the responsibilities and obligations of each industry, this study uses the concept of carbon reduction labelling [35] to classify all industries into different categories.
Based on the above literature review, it can be concluded that the existing literature investigated the above three interrelated issues in isolation. However, the initial allocation method is the basis for the ETS [2,10], and different initial allocation methods will have different impacts on free allocation ratio and ETS coverage. Therefore, this study systematically integrates the above three interrelated issues, which not only fills the gaps in the existing literature but also provides a new allocation method for policy makers.

3. Methodology and Data

3.1. Overview of the Case Study

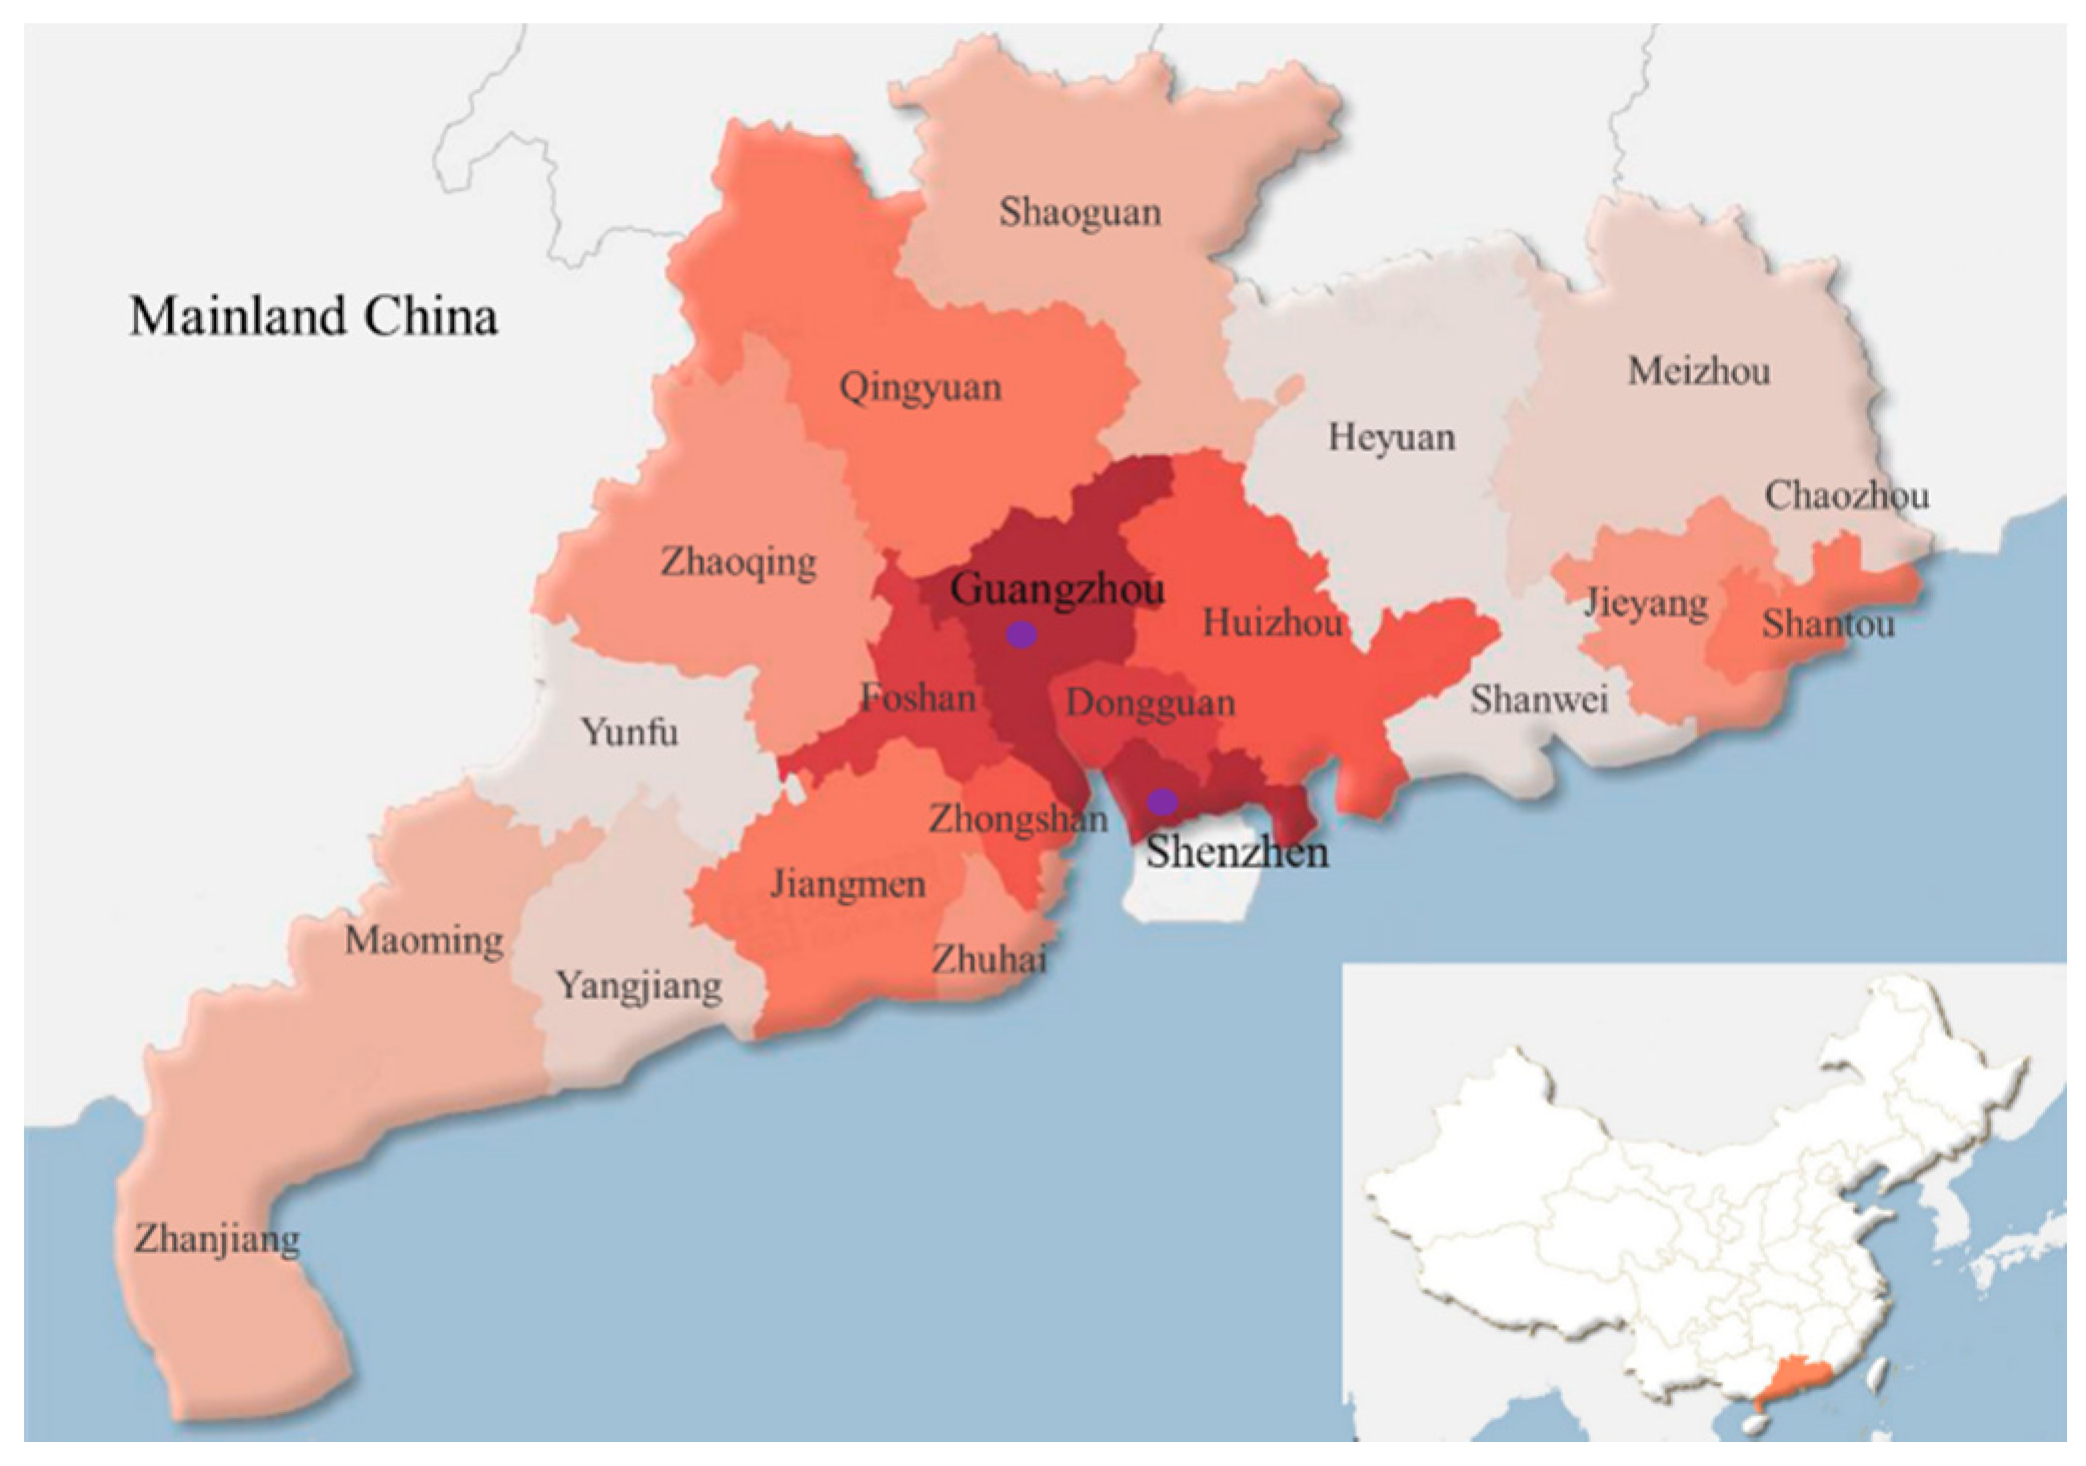
Guangdong has the jurisdiction of two sub-provincial cities and 19 prefecture-level cities located in the southern coast of mainland China (see Figure 1). Since 1989, the gross domestic product (GDP) of Guangdong has ranked the first in the country for years, becoming China’s largest economic province and accounting for one-eighth of the national total economic output [36]. However, there are large development gaps of various industries in Guangdong. For example, in 2015 the industrial added value of communication equipment, computers, and other electronic equipment was 6499.71 one hundred million Yuan, while the figure of chemical fibers was 33.16 one hundred million Yuan [37]. Moreover, as in China as a whole, the energy structures of both are dominated by coal. In 2015, the proportions of coal, crude oil, and electricity in the primary energy consumption of Guangdong were 42.3%, 27.3%, and 24.0%, respectively [37].
As a province with the highest economic level, Guangdong owns two pilot ETSs including Guangdong and Shenzhen [38] and has the largest transaction amount in 2014 [2]. Moreover, the ETS of Guangdong is characterized by an auction element, which is different from other pilot ETSs in China [10]. Nonetheless, the proportion of the auction is still low, only 3–5%. Therefore, a reasonable allocation of quotas is of great significance for Guangdong. Based on the above reasons, this paper selects Guangdong as an illustrative case, the empirical results not only assists policy makers of Guangdong in developing new ETS regulations but also provides references for other region’s ETS.

3.2. Data Collection

According to the classification of the Guangdong Statistical Yearbook 2016, this study regards mining and quarrying as one industry and integrates manufacture of automobile and manufacture of railway, ship, aeronautics and other transport equipment together. The same approach is applied in handicraft and other manufactures, recycling, and disposal of waste and manufacture of metal products, machinery & equipment maintenance. Other industries in the tertiary industry and nonproduction consumption are not covered in this study because they have fewer carbon emissions or do not create GDP. Finally, 36 target industries are obtained, as shown in Table 1. In addition, the added value data of various industries in 2015 are sourced from Guangdong Statistical Yearbook 2016.
Since the Chinese government did not report the industries’ carbon emission data directly, this study uses the comprehensive factor method [11,39] to calculate the historical carbon emissions of each industry in Guangdong, as shown in Equation (1).
  Q i = K × C E i  
where Q i and C E i represent the carbon emissions and total energy consumption of industry i, K is the carbon emission coefficient of standard coal. China Development and Reform Commission suggests that the carbon content of a unit of standard coal is 67% [11], which means that per ton of standard coal emits 0.67 tons of carbon, equivalent to 2.457 tons of carbon dioxide (1 × 0.67 × 44/12 = 2.457). Because energy consumption data in Guangdong is now reported in units of standard coal, the main role of the carbon emission coefficient is to convert units from standard coal to carbon dioxide. Finally, energy consumption data of various industries are sourced from Guangdong Statistical Yearbook 2005–2016.
Remarkably, although Guangdong has published the Guangdong Statistical Yearbook 2017, implying that the value-added and energy consumption data of various industries in 2016 are available, the main development plan of Guangdong or China (e.g., 13th Five-Year Plan) is drafted based on the level of 2015. Hence, the data of added value and energy consumption collected in this paper is up to 2015. In accordance with the announcement of the Energy Bureau of Guangdong, the province’s total energy consumption grew 2.3% per year during the 13th Five-Year Plan period [40]. Therefore, carbon emission quotas and total increment quotas of Guangdong from 2015 to 2020 can be calculated as follows.
  Q ( 2020 ) = ( 1 + 2.3 % ) 5 Q ( 2015 )  
  Δ Q = Q ( 2020 ) Q ( 2015 )  
where Q ( 2020 ) and Q ( 2015 ) are the total carbon emission quotas of 36 industries of Guangdong in 2020 and 2015, respectively.

3.3. Asymmetric Nash Bargaining Model

As one of the most popular benefit coordination solutions, the traditional Nash bargaining model [12] is extended to an asymmetric Nash bargaining model [13] by taking the different bargaining power of each party into consideration, which is shown in Equation (4).
  ( u 1 ( x * ) , , u n ( x * ) ) = arg max i = 1 n ( u i ( x ) d i ) r i  
  s . t .   { ( u 1 ( x * ) , , u n ( x * ) ) ( d 1 , , d n ) ( u 1 ( x * ) , , u n ( x * ) )   ϵ   S  
where u i ( x ) is the utility function of the decision maker i , d i is the start point of bargaining, S is the bargaining field, and r i is the bargaining power of decision maker i and 1 n r i = 1 . The constraint conditions represent that each party’s individual rationality should be ensured.
Borrowing Harsanyi and Selten’s [13] model, this study can get the following specific Nash bargaining model for the carbon emission quota allocation among 36 industries in Guangdong. To ensure the initiatives of the industries in the negotiation, the carbon emission quotas of each industry through negotiation should be not less than that of before negotiation. The specific model is shown in Equation (5).
  ( Q 1 ( 2020 ) * , , Q i ( 2020 ) * ) = arg max i = 1 36 ( Q i ( 2020 ) Q i ( 2015 ) ) r i  
  s . t .   { Q i ( 2020 ) Q i ( 2015 ) i = 1 36 Q i ( 2020 ) = Q ( 2020 ) i = 1 36 r i = 1  
where Q i ( 2020 ) is the carbon emission quotas of i th industry in 2020; Q i ( 2015 ) is actual carbon emissions of i th industry in 2015, Q ( 2020 ) is the total carbon emission quotas of 36 industries of Guangdong in 2020, and r i is the bargaining power of i th industry.
Now the problem is to determine the bargaining power of each industry. The present studies have discussed different principles for emissions allocation, such as grandfathering, equity, efficiency and feasibility [15]. Regarding the carbon emission allocation among industries, Lee et al. [41] proposed two allocation models, one was based on the level of economic development and the other was based on the level of carbon emissions. However, a single indicator often leads to different or even contradictive allocation results, and thus it is very difficult to reach a consensus among various entities [8]. Currently, pilot in Guangdong ETSs mainly adopt the grandfathering approach that employs carbon emissions as an indicator. Hence, to overcome the limitation of a single indicator and in accordance with Guangdong’s local political, economic and industrial differences, this study adopts composite indicator approach to calculate the bargaining power of each industry. Both efficiency and feasibility principles are taken into consideration, while GDP and historical carbon emissions, two of the most frequently considered indicators in literature and practice [8,10,15], are selected as proxies for each of the two principles. The reason for joining GDP indicator to form the bargaining power is that the main task of China is still to promote economic development [38]. Moreover, as the beginning of the 13th Five-Year Plan (2016–2020), the year 2015 is set to be the base year. Therefore, the bargaining power of each industry can be expressed in Equation (6).
  r i = Q i ( 2015 ) Q ( 2015 ) × α + G D P i ( 2015 ) G D P ( 2015 ) × β  
where Q i ( 2015 ) is the carbon emissions of i th industry in 2015, Q ( 2015 ) is the total carbon emissions of 36 industries of Guangdong in 2015, G D P i ( 2015 ) is the GDP of i th industry in 2015, G D P ( 2015 ) is the total GDP of 36 industries of Guangdong in 2015. α and β are the weights of historical carbon emissions and GDP indicator, respectively, and the sum of them equals one.
Moreover, this study weights each indicator in three preference cases.
Case 1: Balanced weighting. It denotes that the decision maker has no preferences for principles of efficiency and feasibility. The two indicators, GDP and historical carbon emissions, are allocated with equal weight values of 0.5.
Case 2: Economic-oriented weighting. It denotes that the decision maker has a different preference for efficiency and economic development and allocates higher weight to GDP indicator, 0.7, and lower weight to historical carbon emissions indicator, 0.3.
Case 3: Emission-oriented weighting. It denotes that the decision maker has a preference for feasibility and allocates higher weight to historical carbon emissions indicator, 0.7, and lower weight to GDP indicator, 0.3.
The weighting allocations of the three preference cases are shown in Table 2.
Using MATLAB R2016a to perform the Lagrange multiplier method, this paper applies Mathematical Induction to obtain the solutions of Equation (5), as shown in Equation (7).
Q i ( 2020 ) * = { Q ( 2020 ) × r i + k = i n 1 ( Q i ( 2015 ) × r ( k + 1 ) Q ( k + 1 ) ( 2015 ) × r i ) ; i = 1 Q ( 2020 ) × r i j = 1 i 1 ( Q j ( 2015 ) × r i Q i ( 2015 ) × r j ) + k = i n 1 ( Q i ( 2015 ) × r ( k + 1 ) Q ( k + 1 ) ( 2015 ) × r i ) ;   i = 2 , , n 1 Q ( 2020 ) × r i j = 1 i 1 ( Q j ( 2015 ) × r i Q i ( 2015 ) × r j ) ; i = n
Obviously, from Equation (7), it is easy to prove that Q i ( 2020 ) * is an increasing function of its carbon emissions in the base year Q i ( 2015 ) , the total carbon emissions of 36 industries of Guangdong in 2020 Q ( 2020 ) , as well as its bargaining power r i . In fact, the solutions of Equation (5) can be simplified to Q i ( 2020 ) * = Q i ( 2015 ) + r i ( Q ( 2020 ) Q ( 2015 ) ) . The reason is that the problem in Equation (5) determines Q i ( 2020 ) * as the solution to a mathematical programming problem. Inspection of this problem reveals that the objective is a linear expenditure system utility function. The constraints include Q i ( 2020 ) Q i ( 2015 ) , and given that Q ( 2020 ) = ( 1 + 2.3 % ) 5 Q ( 2015 ) > Q ( 2015 ) , it is well-known that the lower bounds will be satisfied with strict inequality. Other constraints such as i = 1 36 Q i ( 2020 ) = Q ( 2020 ) can be regarded as a budget constraint where all the prices have value one. Given these observations, the solutions can be quite simply. Because the percentage error of the above two calculation methods is less than 1%, for simplicity, this study only shows the final allocation results.
Finally, to make a comparison, the results allocated by the grandfathering approach are given by Equation (8):
  Q G i ( 2020 ) = Q ( 2020 ) × Q i ( 2015 ) i = 1 36 Q i ( 2015 )  
where Q G i ( 2020 ) is the carbon emission quotas of industry i by using the grandfathering approach, the year 2015 is set to be the base year.
4. Results and Discussions

4.1. Allocated Results by Different Approaches

This study obtains the carbon emission quotas for each industry in Guangdong by 2020 under the Nash bargaining model with three preference cases. Ranking the industries by the carbon emission quotas in 2020 in the Balanced weighting case from large to small, the allocation results are presented in Table 3. Moreover, the result allocated by the grandfathering approach is also shown in Table 3 for comparison.
From Table 3, it shows that the allocation results for 36 industries of Guangdong under three preference cases are quite different. In general, the nonmetal industry is allocated to the most carbon emission quotas, followed by the transport industry under all three preference cases and the grandfathering approach, while the tobacco industry is allocated the smallest. The top two industries (nonmetal and transport) are allocated up to 26.77% (26.41%, 27.11%) of total carbon emissions in 2020 under the balanced weighting case (economic-oriented weighting case, emission-oriented weighting case) and 27.77% under the grandfathering approach. While the smallest one, tobacco industry, is only allocated to 0.07%, 0.09%, 0.06% and 0.04% of total carbon emissions under the balanced weighting, economic-oriented weighting, emission-oriented weighting cases, and grandfathering approach, respectively.
The results in Table 3 also indicate that the emission-oriented weighting case is conducive to the industries with high historical carbon emissions. Traditional manufacturing industries (e.g., nonmetal, petro, and “rawchem”), transport industries (e.g., transport) and energy supply industries (e.g., power, water) will be assigned more carbon emission quotas under the emission-oriented weighting case, which will help to mitigate their pressures to reduce emissions. While the economic-oriented weighting case is beneficial to the industries with higher GDP and fewer carbon emissions, like high-tech manufacturing industries (e.g., “commeqip”, “elecmach”), emerging manufacturing industries (e.g., “raileqip”, “genemach”) and service industries (e.g., retail). Therefore, if the economic-oriented weighting case is implemented in practice, it will be conducive to eliminate the declining industries and promote the development of high-tech manufacturing industries, emerging industries, and service industries, thus promote the adjustment of industrial structure and achieve the environmental protection and economic development at the same time. The balanced weighting case integrates the traditional industries’ carbon emission reduction pressure and the development potential of emerging industries. Consequently, the allocation results are between the above two cases.
Moreover, this study shows that the allocation results under the grandfathering approach are similar to that of the emission-oriented weighting case, which assigns a higher weight to historical carbon emissions indicator than GDP indicator. Compared with the emission-oriented weighting case, the grandfathering approach magnifies the weight of historical carbon emissions indicator but ignores the impact of GDP. For instance, the tobacco industry is assigned 26.45 ten thousand tons carbon emission quotas under the grandfathering approach, decreasing nearly 36.03% compared with that of the emission-oriented weighting case. If the government still uses the grandfathering approach to allocate the carbon emission quotas, the tobacco industry will be faced with enormous development pressure. In short, although the grandfathering approach can mitigate the reduction pressure of some industries with high carbon emission in the short term, it is not conducive to the adjustment of industrial structure and economically sustainable development in the long term.

4.2. Allocated Results for Different Free Allocation Ratios

In accordance with the previous empirical literature related to the ETS of China, many scholars assumed that the carbon emission quotas were 100% free allocation to avoid the impact of carbon market on various industries and to reduce the resistance from various industries [8,21]. However, other scholars proposed that 100% free allocation might be inefficient, because of information asymmetry and violating the “polluter pays principle” [10]. Hintermann [26] also showed that due to the existing of market power, some firms might obtain more quotas than their actual demand under the full free allocation and sell excess quotas to drive up the carbon price.
As the world’s largest ETS, the EU ETS employed a 95% free allocation ratio in Phase I (2005–2007) and 90% free allocation ratio in Phase II (2008–2012). In Phase III (2013–2020), all quotas for the power industry were auctioned, while the overall free allocation ratio was about 50% [42,43]. Different from the EU ETS, Guangdong currently adopts 95% or 97% free allocation ratio to allocate the initial quotas and the remaining quotas are auctioned. Based on the above reasons, in this section, this study mainly explores the impact of 95% and 90% free allocation ratios on the allocation results under three preference cases. Additionally, a sensitivity analysis of different free allocation ratio will be provided to show the universality of the proposed method.

4.2.1. The Results of 95% Free Allocation Ratio

It is well known that economic growth is usually accompanied by more carbon emissions. Although the Chinese government has pledged to reach the peak of carbon emissions by 2030 and part of the heavy chemical industries will reach the peak after 2020 [2], boosting economic growth remains the top priority. Additionally, some studies have proved that China will not reach the peak before 2020, carbon emission quotas before 2020 are linked to the carbon intensity target, and the period from 2020 to 2030 is the transition period from the intensity target to the absolute total emissions target [10]. Therefore, this study assumes that the absolute carbon emissions of 36 industries in Guangdong grow from 2015 to 2020, and carbon emission decoupling phenomenon will not occur before 2020. Recall that Δ Q i represents the carbon emission increment quotas of industry i from 2015 to 2020. If Δ Q i > 0 , then the free initial carbon emission quotas of industry i in 2020 is larger than its emissions in 2015, indicating that the industry still has some emissions space to stimulate economic growth without paying for its initial carbon emission quotas. On the contrary, Δ Q i < 0 represents that the free initial carbon emission quotas of industry i in 2020 is less than its emissions in 2015. For the sake of analysis, this study defines the industry i with Δ Q i < 0 as compulsory payment industry, while the industry i with Δ Q i > 0 as potential payment industry.
The results shown in Table 3 are allocated by the 100% free allocation ratio. Considering the reality of Guangdong, this study first adopts 95% free allocation ratio to allocate carbon emission quotas among 36 industries in Guangdong. Using the results in Table 3, the carbon emission quotas of 36 industries in 2020 under a 95% free allocation ratio can be calculated. It suggests that only three industries (paper, ferrous, “chemfibe”) need to pay for their initial carbon emission quotas under the economic-oriented weighting case if the carbon emission quotas in 2020 are 95% free allocated, as shown in Table 4. However, if the Balanced weighting case or the Emission-oriented weighting case are adopted, none of the industry belongs to compulsory payment industries. Therefore, 95% free allocation ratio cannot reflect the “polluter pays principle”. Most industries with high historical carbon emissions do not take an exemplary role in reduction emissions actions, and they might even benefit from the 95% free allocation ratio when their actual emissions in 2020 are less than the obtained quotas.

4.2.2. The Results of 90% Free Allocation Ratio

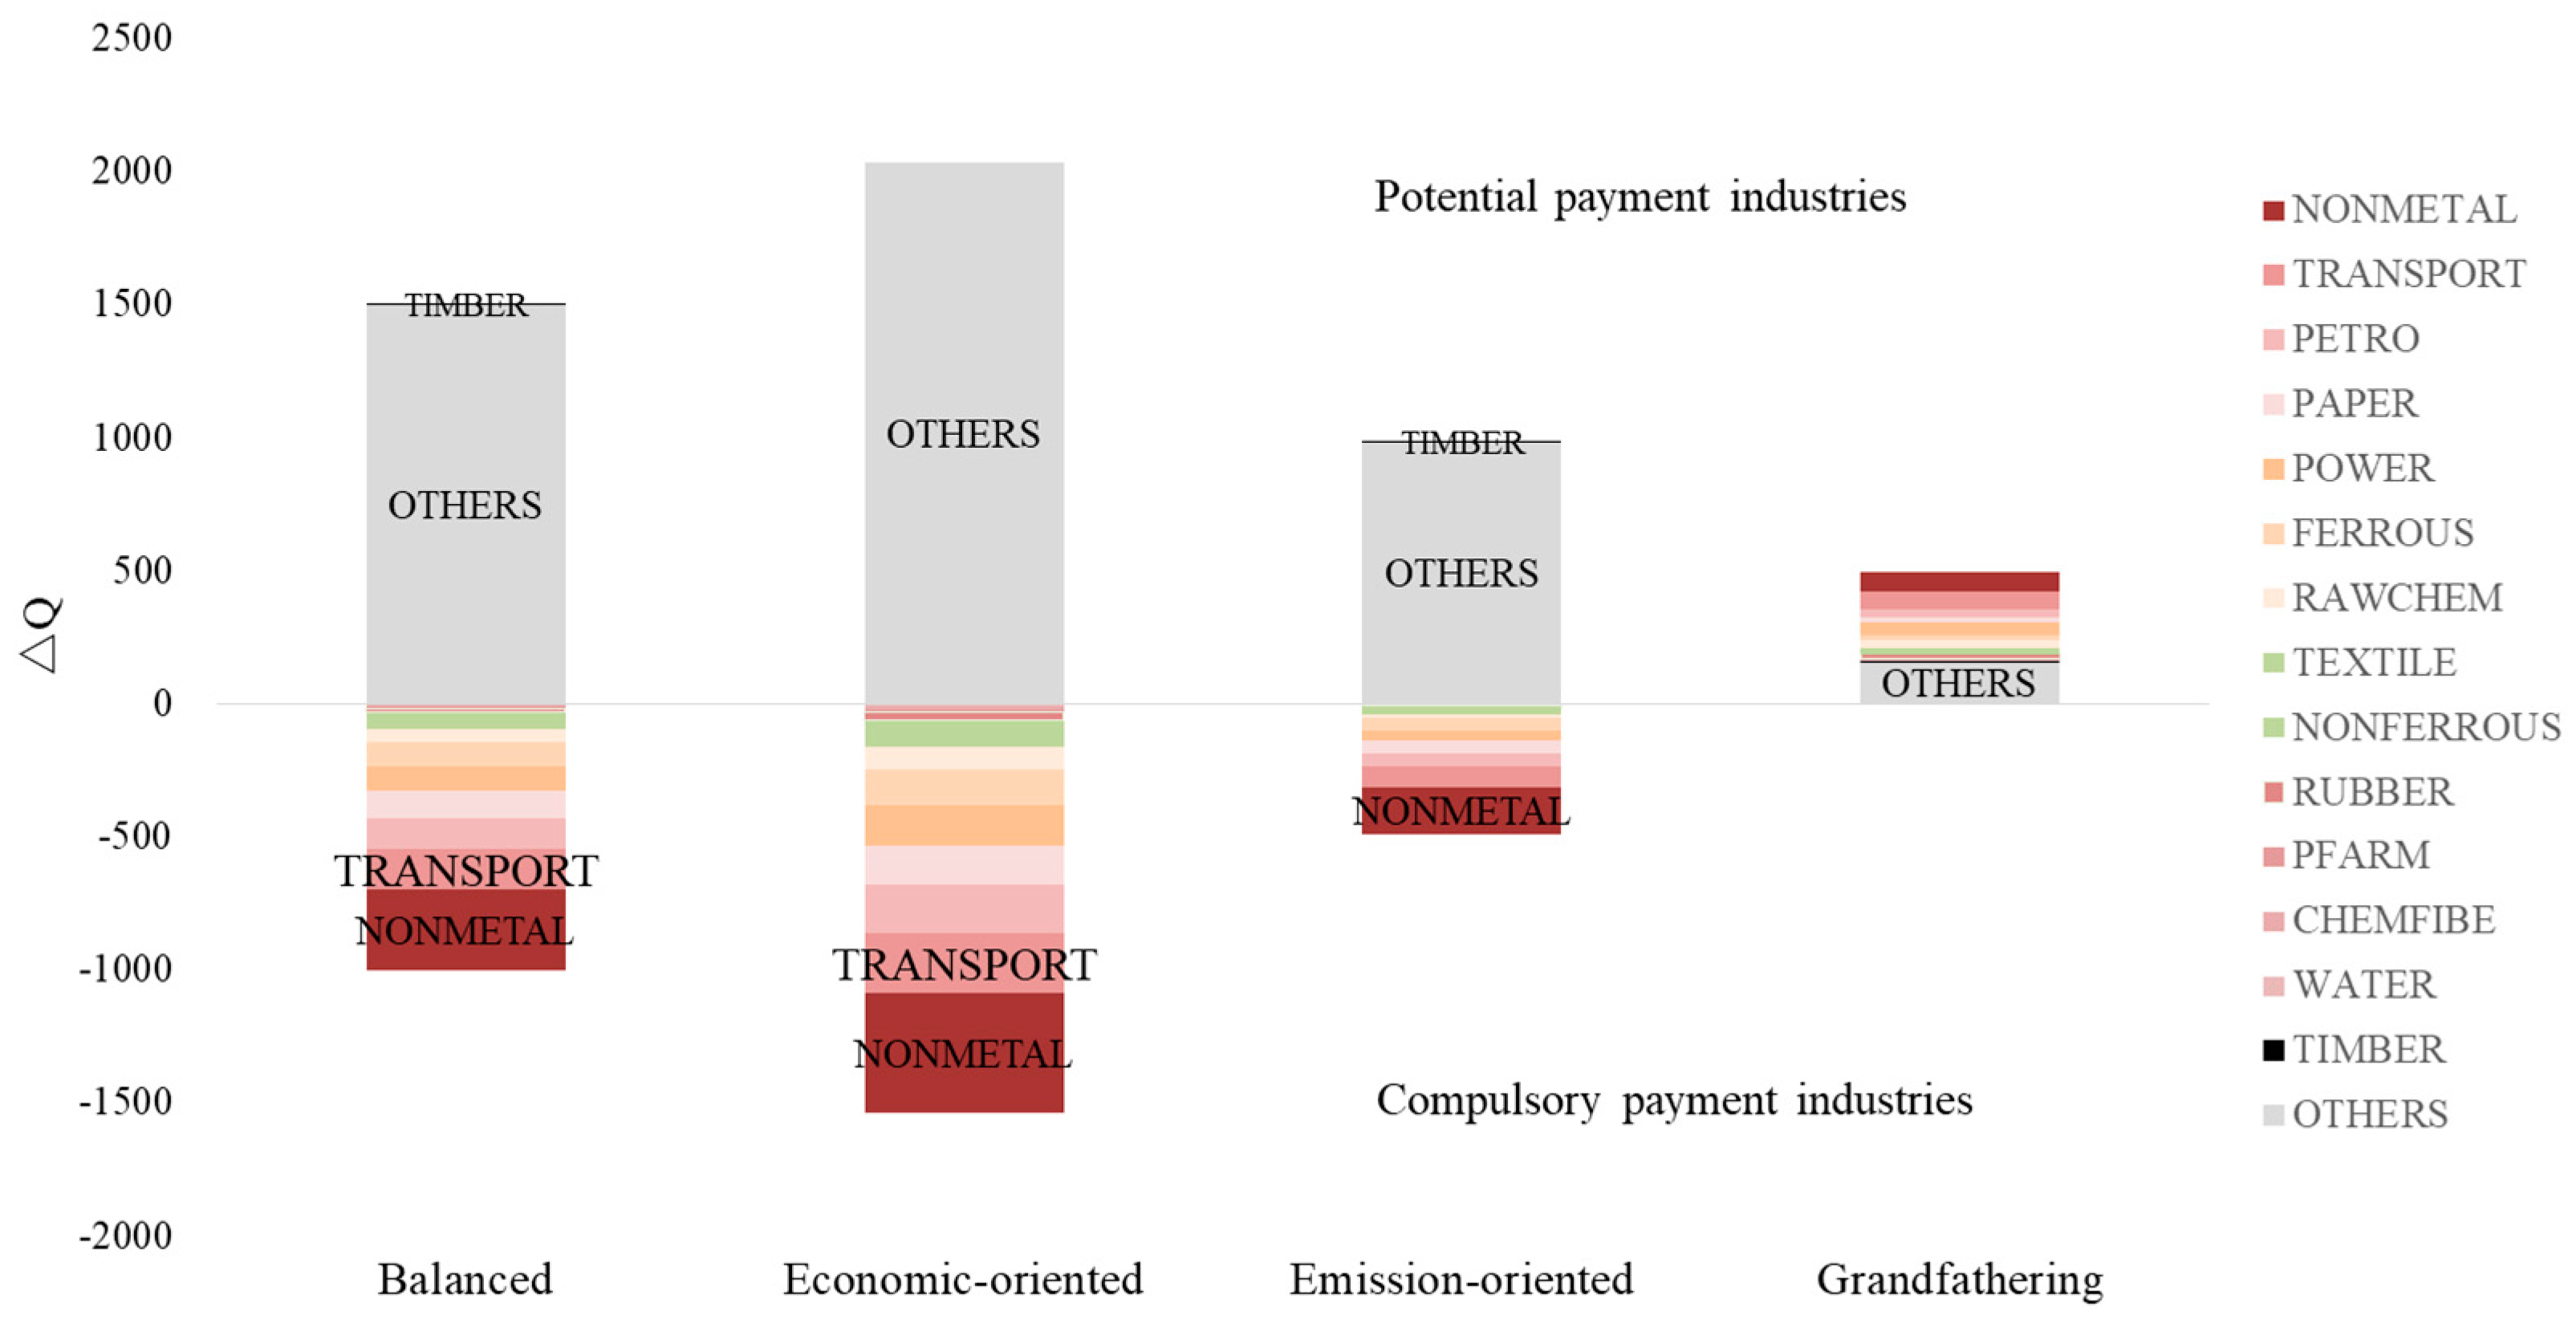
Following EU ETS’s 90% free allocation ratio, this paper obtains the allocation results as shown in Figure 2. This study suggests that if a 90% free allocation ratio is adopted, none of the industries belongs to the compulsory payment industries with the grandfathering approach by 2020. With the Nash bargaining model, however, thirteen industries belong to the compulsory payment industries in both the balanced weighting and emission-oriented weighting cases, while fourteen industries belong to compulsory payment industries in the economic-oriented weighting case, by adding in the additional timber industry.
By comparing the results of three preference cases in the Nash bargaining model and the grandfathering approach, this study shows that the economic-oriented weighting case is more likely to stimulate the development of the ETS and to enhance trading behavior, thus better reflecting the “polluter pays principle”. When the carbon price is fixed, the shortage volume under the Economic-oriented weighting case is the most, indicating that traditional manufacturing industries (e.g., petro, ferrous), the industries with high historical carbon emission (e.g., transport, nonmetal) and the energy supply industries (e.g., power, water) must pay more for their initial carbon emission quotas. Table 5 shows the carbon intensity of the above fourteen compulsory payment industries in 2015. An interesting finding is that the carbon intensities of the above fourteen compulsory payment industries under the economic-oriented weighting case are larger than the average carbon intensity of 36 industries, implicating that the above fourteen industries have more potentiality and low-cost to reduce emissions than others [10].

4.2.3. Sensitivity Analysis of Different Free Allocation Ratio

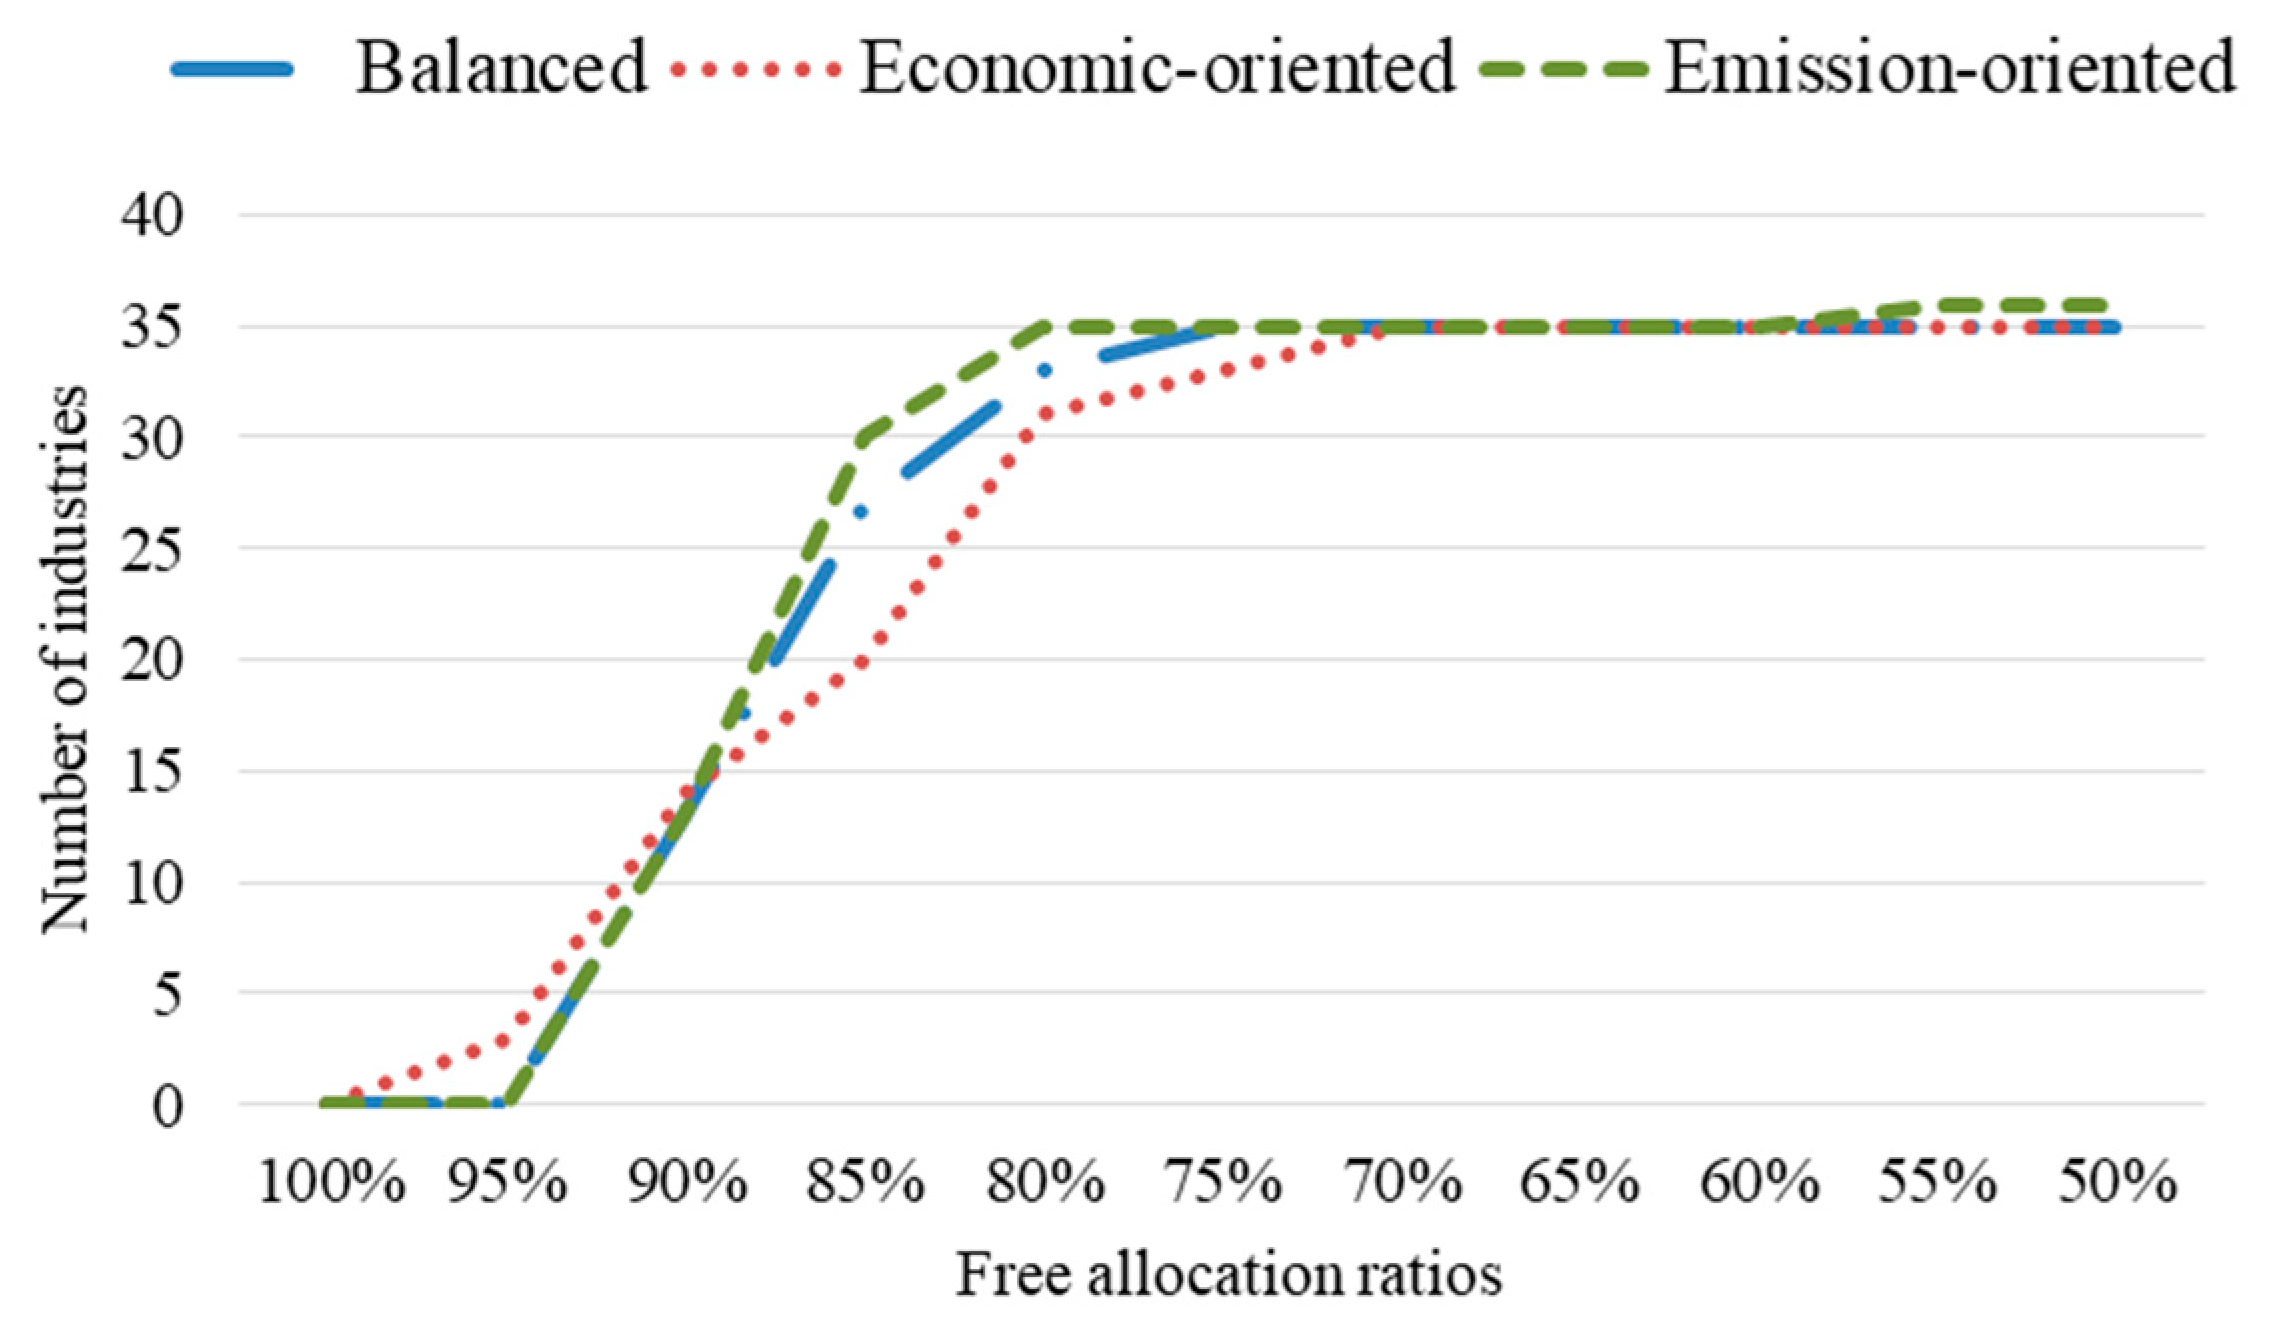
Figure 3 shows how the number of compulsory payment industry varies with different free allocation ratio. It is worth noting that when the free distribution ratio is above 95%, the number of compulsory payment industries is less than 3 (only occurs in the emission-oriented weighting case). By contrast, when the free distribution ratio is below 80%, almost all industries have become compulsory payment industries regardless of the preference cases. Different from the above two extreme scenarios, the number of compulsory payment industries depicts a linearly increasing trend in all three preference cases when the free allocation ratio is between 95% and 90% (as discussed in Section 4.2). This linear trend, however, will be broken when the free allocation ratio is in the range of 90% to 80%. Specifically, the number of compulsory payment industries has increased from 13 to 33 for the balanced weighting case, from 14 to 31 for the economic-oriented weighting case, and from 13 to 35 for the emission-oriented weighting case. Overall, this interval (i.e., 90%–80%) needs a special attention because it will involve the interests of most industries.
Through Figure 3, this study finds that China’s free allocation ratio cannot be directly reduced to 50%, which is the ratio that the EU ETS expects to achieve in the third phase. The reason is that China’s first priority is to promote economic growth, and thus carbon emission reduction actions should not be the main burden affecting the development of various industries [38]. Conversely, maintaining the current 95% free distribution ratio is also unjustified because those industries with high carbon intensity will have sufficient quotas, which may hinder the goal of low-cost emission reduction. In accordance with the characteristics of various industries and national strategic planning for key emission reduction industries, this study argues that a 90% free allocation ratio may be an appropriate option in the next phase of Guangdong’s ETS. The detailed analysis will be described in the following section.

4.3. Carbon Reduction Labelling

Currently, the Chinese government is preparing to establish a unified national ETS by the end of 2017, within which eight key emission reduction industries (petrochemical, chemical, building materials, steel, nonferrous metals, papermaking, electricity, and aviation) are included [34]. To link the results of this study with the national policy, Table 6 explains the relationship between the eight key emission reduction industries and the 36 industries studied.
Cui et al. [44] established a formula to reflect the relationship between provincial/municipal marginal abatement costs and national marginal abatement costs in China, and proved that the marginal abatement cost of provinces/cities with high carbon intensity was less than those provinces/cities with low carbon intensities. The above estimated marginal abatement costs have been recognized and applied by many scholars, such as Fan et al. [10], Li et al. [38] and Chang et al. [45]. From the results in Table 3, Table 5 and Table 6, it can be found that the carbon intensity of eight key emission reduction industries in 2015 is higher than the average level of 36 industries, indicating that the marginal abatement cost of eight key emission reduction industries will be less than other industries. Meanwhile, the proportion of carbon emissions of eight key emission reduction industries in 36 industries in 2015 is 63.34%, while the figure in 2020 becomes 61.23%, 60.39%, 62.05% under three preference cases (balanced, economic-oriented, emission-oriented) and 63% under the grandfathering approach, respectively. Therefore, compared with the grandfathering approach, the Nash bargaining model can reduce the proportion of carbon emissions of eight key emission reduction industries and promote them to take more responsibility for emission reductions. It cannot only reflect the “polluter pays principle”, but also reduce the total abatement cost of 36 industries in Guangdong. Finally, this argument is consistent with the Chinese government’s target on the promotion of the industrial structure transformation and improving the unreasonable emission structure.
To make carbon reductions more efficient, some scholars have proposed the concept of carbon reduction labeling. Zhao et al. [33] classified all industries in China into four categories: compulsory reduction industries, key reduction industries, encouraging reduction industries and voluntary reduction industries. According to the symbol of carbon emission increment quotas under 90% free allocation ratio and the cluster analysis of between-groups linkage (Pearson correlation), this study obtains three categories for the 36 industries and defines them as compulsory reduction industries, key reduction industries and encouraging reduction industries, as shown in Table 7.
From the clustering results, it suggests that there are twelve industries falling into compulsory reduction industries and two falling into key reduction industries. The remaining 22 industries fall into the encouraging reduction industries. Among them, eight key emission reduction industries announced by the Chinese government belong to either compulsory reduction industries or key reduction industries. This is the main reason why this paper suggests that the decision maker in Guangdong should consider the 90% free allocation ratio. Besides these eight industries, three more industries, “pfarm”, textile and water industries also belong to these two categories.
The classification results are also compared with Zhao et al. [33] who classified the industries based on the national level. Eight industries including petro, “rawchem”, “chemfibe”, rubber, nonmetal, ferrous, power, and transport belong to the compulsory reduction industries, which are consistent with the classification results reported by Zhao et al. [33]. However, due to the unique characteristics of Guangdong, there are four additional industries falling in the compulsory reduction industries category, including textile, pfarm, paper and nonferrous industries. The reason is explained as follows. First, textile and pfarm are the traditional pillar industries in Guangdong and their carbon emission intensity in 2015 (2.98 and 1.92, shown in Table 5) are higher than the average level of Guangdong (1.25). Second, paper is the industry with good prospects for development in Guangdong, and its carbon emission intensity in 2015 (6.41, shown in Table 5) is much higher than the average level. Third, firms of the nonferrous industry are mainly in Guangdong and Hubei [46], and thus Guangdong’s nonferrous industry emits far more carbon emissions than any other Chinese province. Finally, the water industry is classified as the key reduction industries in Guangdong, which does not appear in Zhao et al.’s [33] study.

5. Policy Implications

Based on the findings, this study suggests some useful policy implications for government decision makers. Firstly, with the experience of seven pilot ETSs, the allocation of initial carbon emission quotas should be gradually changed from the grandfathering approach to a more scientific allocation method, such as game theory. Due to the uncertainty of information at the beginning of ETS, the use of the grandfathering approach can mitigate the reduction pressure for firms with large historical carbon emissions. However, EU ETS’s experience shows that the grandfathering approach is not a suitable method for the long-term development of ETS. With the development of the ETS, game theory becomes an appropriate allocation approach because it can reflect the negotiation process of various entities and balance the interests of all parties. The results of this study show that the Nash bargaining model can promote the adjustment of industrial structure and meet the carbon emission reduction target with less abatement cost, thus help to achieve the triple bottom line of the economy, environment, and society in the long term. In fact, Shenzhen has adopted dynamic competition game to allocation the initial quotas in 2013, which sets a precedent for game theory.
Moreover, current free allocation ratio cannot effectively promote firms to reduce emissions, and thus properly decreasing free allocation ratio not only reflects the “polluter pays principle”, but also mobilizes the enthusiasm of each entity to reduce carbon emissions. At the initial stage, the free allocation ratio is usually set very high, even 100%, in order to reduce the difficulty of policy implementation. However, with the maturity of ETS, full free allocation might be inefficient because it ignores the emission reduction efforts of each participant and violates the “polluter pays principle”. Properly reducing free allocation ratio will promote the entity with higher historical carbon emissions and carbon emission intensity to pay for its initial carbon emission quotas partially by auction or fixed price purchase, thus achieve the adjustment of industrial structure and long-term development goals. Simultaneously, the government could take some protective measures against the entity with large carbon emissions, such as technology support and taxation adjustment, to reduce abatement costs.
Thirdly, policy makers should determine ETS coverage based on the actual situation of each region, rather than adopting uniform standards for all regions. China has a vast territory and the distribution of the industries is unbalanced. Different regions have different economic and energy structure, while the major pillar industries of the regions are quite different. Using a uniform standard would be detrimental to the development of various regions. In terms of the classification results of carbon reduction labeling, the textile industry and processing of farm and sideline food industry should be included in Guangdong’s pilot ETS in addition to the eight key emission reduction industries prescribed by the Chinese government. Although the production and supply of water industry is labeled as a key reduction industry in Guangdong, the government should strengthen its energy efficiency rather than directly regulate it. If the government controls its carbon emissions in a short period of time, it will inevitably have a greater impact on the people’s daily life.
Last but not least, the government should develop different emission reduction requirements for different industries considering their emission reduction potential, economic development level, and energy efficiency. For the compulsory reduction industries and the key reduction industries, emission reduction pressures and costs are the main considerations for policy makers. Free allocation ratio should not be too large or too small. For the encouraging reduction industries, there is no need for them to reduce emissions compulsively, but protecting the environment is the responsibility of each industry. If the current voluntary emission reduction can be used in the future, those industries will be more likely to reduce emissions. In fact, the Guangdong Provincial Development and Reform Commission has published the Pu Hui Certified Emission Reduction policy since 2017 and encourages relevant enterprises and individuals to participate voluntarily in implementing low carbon behaviors, such as reducing greenhouse gas emissions and increasing green carbon sinks [47].

6. Conclusions

To achieve the carbon emission reduction target and build an effective ETS, setting a scientific and reasonable allocation approach among different industries has become a key task for China, even for the world. By proposing a multiplayer asymmetric Nash bargaining model, this paper takes both the efficiency principle and feasibility principle into account, and three preference cases are established to make the proposed method more universal. To show the advantages of the proposed method, Guangdong is used as an example. Moreover, based on different allocation results, the impact of different free allocation ratios are discussed, and three categories for different industries are suggested, as well as the implications for policy makers are provided. The main conclusions of this paper include three aspects.
First, within the same carbon emission caps, the Nash bargaining model can promote the adjustment of industrial structure and meet the carbon emission reduction target with less abatement cost, and thus it helps to achieve the triple bottom line of economy, environment, and society in the long term. The emission-oriented weighting case is conducive to the industries with high historical carbon emissions, while the economic-oriented weighting case is beneficial to the industries with higher GDP and fewer carbon emissions, like high-tech manufacturing industries, Emerging manufacturing industries and service industries. Second, policy makers of Guangdong should appropriately reduce free allocation ratio in 2020, the initial carbon emission quotas for 90% free allocation ratio and the remaining for auction or fixed price purchase may be a better choice. The results show that under 90% free allocation ratio, all industries with carbon intensity higher than the average level of 36 industries must pay for their initial carbon emission quotas, which can not only reflect the “polluter pays principle”, but also mobilize the enthusiasm of the industries to reduce carbon emissions. Third, the carbon reduction labelling results show that in addition to the eight key emission reduction industries proposed by the Chinese government, textile industry and processing of farm and sideline food industry should be classified as compulsory reduction industries and included in Guangdong pilot ETS, which is based on the real industrial characteristics of Guangdong.
This study helps to enrich the allocation method of carbon emission quotas at the industry level, especially when taking the negotiation process situation among different industries and different preference of policy makers on efficiency and feasibility principles into consideration. The allocation results echo the “polluter pays principle” and overcome the shortcoming of the present adopted the grandfathering approach emphasizing on historical carbon emissions, thus promote the adjustment of industrial structure and achieve the triple bottom line of economy, environment, and society in the long term. Although this study uses Guangdong as an example, it is easy to apply the proposed method to other economies in the world, because Guangdong is a representative of high energy consumption and uneven development regions. Finally, this study provides some suggestions for the improvement of future national ETS by studying the free allocation ratio and ETS coverage systematically.
There are several limitations to this study. First, this study assumes that carbon emission decoupling phenomenon in Guangdong will not occur before 2020. There may be some extreme cases that the assumptions may not be met. Second, this study shows that reducing the proportion of free allocation ratio and increasing the proportion of auction can promote industries to reduce emissions. Therefore, to minimize the social total emission reduction costs, it is a good choice to investigate the relationship between free allocation ratio and emissions caps in the future work. Third, the presence of carbon leakage or other factors will affect the allocation results, which is also a valuable research direction in the future. Finally, this study explains that the Nash bargaining model can save abatement costs but does not calculate how much can be saved. Thus, it will be interesting to use empirical data to calculate the exact cost savings and show the relationship between environmental protection and economic development.

Author Contributions

Lead author F.Y. developed the asymmetric Nash bargaining model and analyzed the data. L.L. contributed to the literature review, the sample selection, the data collection, and the preparation of the manuscript. Z.W. and Y.L. contributed to review this paper and edited the English.

Funding

This research was funded by National Natural Science Foundation of China [grant numbers 71371006, 71471066, 71771090, 71420107024]; and Science and Technology Program of Guangzhou, China [grant number 201707010362].

Acknowledgments

The authors thank the anonymous reviewers for their constructive comments to improve the quality of this work, and thanks the editors for their patience and responsibility.

Conflicts of Interest

The authors declare no conflicts of interest.

References

  1. Iodice, P.; Langella, G.; Amoresano, A.; Senatore, A. Comparative Exergetic Analysis of Solar Integration and Regeneration in Steam Power Plants. J. Energy Eng. 2017, 143, 04017042. [Google Scholar] [CrossRef]
  2. Liu, L.; Chen, C.; Zhao, Y.; Zhao, E. China’s carbon-emissions trading: Overview, challenges and future. Renew. Sustain. Energy Rev. 2015, 49, 254–266. [Google Scholar] [CrossRef]
  3. Fredrik, A. International trade and carbon emissions: The role of Chinese institutional and policy reforms. J. Environ. Manag. 2017, 205, 29. [Google Scholar] [CrossRef]
  4. Iodice, P.; Senatore, A. Road Transport Emission Inventory in a Regional Area by Using Experimental Two-Wheelers Emission Factors. In Proceedings of the World Congress on Engineering, London, UK, 3–5 July 2013; pp. 681–685. [Google Scholar]
  5. Ji, J.; Zhang, Z.; Yang, L. Comparisons of initial carbon allowance allocation rules in an O2O retail supply chain with the cap-and-trade regulation. Int. J. Prod. Econ. 2017, 187, 68–84. [Google Scholar] [CrossRef]
  6. Rui, Q.; Xu, J.; Zeng, Z. Carbon emission allowance allocation with a mixed mechanism in air passenger transport. J. Environ. Manag. 2017, 200, 204–216. [Google Scholar] [CrossRef]
  7. Xiong, L.; Shen, B.; Qi, S.; Price, L.; Ye, B. The allowance mechanism of China’s carbon trading pilots: A comparative analysis with schemes in EU and California. Appl. Energy 2017, 185, 1849–1859. [Google Scholar] [CrossRef]
  8. Li, L.; Li, Y.; Ye, F.; Zhang, L. Carbon dioxide emissions quotas allocation in the Pearl River Delta region: Evidence from the maximum deviation method. J. Clean. Prod. 2018, 177, 207–217. [Google Scholar] [CrossRef]
  9. Xiong, S.; Tian, Y.; Ji, J.; Ma, X. Allocation of Energy Consumption among Provinces in China: A Weighted ZSG-DEA Model. Sustainability 2017, 9, 2115. [Google Scholar] [CrossRef]
  10. Fan, Y.; Mo, J.L.; Zhu, L. China Carbon Market: Policy Design and Socio-Economic Impact; Science Press: Beijing, China, 2016. [Google Scholar]
  11. Liao, Z.; Zhu, X.; Shi, J. Case study on initial allocation of Shanghai carbon emission trading based on Shapley value. J. Clean. Prod. 2015, 103, 338–344. [Google Scholar] [CrossRef]
  12. Nash, J.F. The bargaining problem. Econometrica 1950, 18, 155–162. [Google Scholar] [CrossRef]
  13. Harsanyi, J.C.; Selten, R. A generalized Nash solution for two-person bargaining games with incomplete information. Manag. Sci. 1971, 18, 80–106. [Google Scholar] [CrossRef]
  14. Jiang, N.; Zhang, L.L.; Yu, Y. Optimizing Cooperative Advertizing, Profit Sharing, and Inventory Policies in a VMI Supply Chain: A Nash Bargaining Model and Hybrid Algorithm. IEEE Trans. Eng. Manag. 2015, 62, 449–461. [Google Scholar] [CrossRef]
  15. Zhou, P.; Wang, M. Carbon dioxide emissions allocation: A review. Ecol. Econ. 2016, 125, 47–59. [Google Scholar] [CrossRef]
  16. Li, J.; Huang, X.; Yang, H.; Chuai, X.; Wu, C. Convergence of carbon intensity in the Yangtze River Delta, China. HAB Int. 2017, 60, 58–68. [Google Scholar] [CrossRef]
  17. Liu, H.; Lin, B. Cost-based modelling of optimal emission quota allocation. J. Clean. Prod. 2017, 149, 472–484. [Google Scholar] [CrossRef]
  18. Zhang, Y.; Hao, J. Carbon emission quota allocation among China’s industrial sectors based on the equity and efficiency principles. Ann. Oper. Res. 2017, 255, 117–140. [Google Scholar] [CrossRef]
  19. Zhang, Y.; Wang, A.; Da, Y. Regional allocation of carbon emission quotas in China: Evidence from the Shapley value method. Energy Policy 2014, 74, 454–464. [Google Scholar] [CrossRef]
  20. Liu, D.; Lv, W.; Li, H.; Tang, J. Bargaining model of labor disputes considering social mediation and bounded rationality. Eur. J. Oper. Res. 2017, 262, 1064–1071. [Google Scholar] [CrossRef]
  21. Han, R.; Tang, B.; Fan, J.; Liu, L.; Wei, Y. Integrated weighting approach to carbon emission quotas: An application case of Beijing-Tianjin-Hebei region. J. Clean. Prod. 2016, 131, 448–459. [Google Scholar] [CrossRef]
  22. Daskalakis, G.; Markellos, N.R. Are electricity risk premia affected by emission allowance prices? Evidence from the EEX, Nord Pool and Powernext. Energy Policy 2009, 37, 2594–2604. [Google Scholar] [CrossRef]
  23. Ausubel, L.M.; Cramton, P. Virtual power plant auctions. UTI Policy 2010, 18, 201–208. [Google Scholar] [CrossRef]
  24. Yu, J.; Mallory, M.L. An optimal hybrid emission control system in a multiple compliance period model. Resour. Energy Econ. 2015, 39, 16–28. [Google Scholar] [CrossRef]
  25. Hasegawa, M.; Salant, S. Cap-and-trade programs under delayed compliance: Consequences of interim injections of permits. J. Pubic Econ. 2014, 119, 24–34. [Google Scholar] [CrossRef]
  26. Hintermann, B. Market Power in Emission Permit Markets: Theory and Evidence from the EU ETS. Environ. Resour. Econ. 2017, 66, 89–112. [Google Scholar] [CrossRef] [Green Version]
  27. Li, W.; Jia, Z. The impact of emission trading scheme and the ratio of free quota: A dynamic recursive CGE model in China. Appl. Energy 2016, 174, 1–14. [Google Scholar] [CrossRef]
  28. Lee, J.; Yu, J. Market analysis during the first year of Korea emission trading scheme. Energies 2017, 10, 1974. [Google Scholar] [CrossRef]
  29. Lennox, J.A.; Van Nieuwkoop, R. Output-based allocations and revenue recycling: Implications for the New Zealand Emissions Trading Scheme. Energy Policy 2010, 38, 7861–7872. [Google Scholar] [CrossRef]
  30. Wang, X.; Tang, X.; Zhang, B.; Mclellan, B.; Lv, Y. Provincial carbon emissions reduction allocation plan in china based on consumption perspective. Sustainability 2018, 10, 1342. [Google Scholar] [CrossRef]
  31. Chang, K.; Chang, H. Cutting CO2 intensity targets of interprovincial emissions trading in China. Appl. Energy 2016, 163, 211–221. [Google Scholar] [CrossRef]
  32. Yang, B.; Liu, C.; Su, Y.; Jing, X. The allocation of carbon intensity reduction target by 2020 among industrial sectors in China. Sustainability 2017, 9, 148. [Google Scholar] [CrossRef]
  33. Zhao, R.; Min, N.; Geng, Y.; He, Y. Allocation of carbon emissions among industries/sectors: An emissions intensity reduction constrained approach. J. Clean. Prod. 2017, 142, 3083–3094. [Google Scholar] [CrossRef]
  34. Wu, R.; Dai, H.; Geng, Y.; Xie, Y.; Masui, T.; Tian, X. Achieving China’s INDC through carbon cap-and-trade: Insights from Shanghai. Appl. Energy 2016, 184, 1114–1122. [Google Scholar] [CrossRef]
  35. Liu, T.; Wang, Q.; Su, B. A review of carbon labeling: Standards, implementation, and impact. Renew. Sustain. Energy Rev. 2016, 53, 68–79. [Google Scholar] [CrossRef]
  36. National Bureau of Statistics of China, China Statistical Yearbook 2016; China Statistics Press: Beijing, China, 2017. Available online: http://www.stats.gov.cn/tjsj/ndsj/2017/indexch.htm (accessed on 31 May 2017).
  37. Bureau of Statistics of Guangdong Province, Guangdong Statistical Yearbook 2016; China Statistics Press: Beijing, China, 2016. Available online: http://www.gdstats.gov.cn/tjnj/2016/directory.html (accessed on 31 April 2016).
  38. Li, L.; Ye, F.; Li, Y.; Tan, K.H. A bi-objective programming model for carbon emission quota allocation: Evidence from the Pearl River Delta region. J. Clean. Prod. 2018, 205, 163–178. [Google Scholar] [CrossRef]
  39. Zhao, X.; Cai, Q.; Zhang, S.; Luo, K. The substitution of wind power for coal-fired power to realize China’s CO2, emissions reduction targets in 2020 and 2030. Energy 2016, 120, 164–178. [Google Scholar] [CrossRef]
  40. China Carbon Trading Network. Total Energy Consumption Control Program of Guangdong Province 2017. Available online: http://www.tanjiaoyi.com/article-20616-1.html (accessed on 19 February 2017).
  41. Lee, C.F.; Lin, S.J.; Lewis, C. Analysis of the impacts of combining carbon taxation and emission trading on different industry sectors. Energy Policy 2008, 36, 722–729. [Google Scholar] [CrossRef]
  42. Sartor, O.; Palliere, C.; Lecourt, S. Benchmark-based allocations in EU ETS Phase 3: An early assessment. Clim. Policy 2014, 14, 507–524. [Google Scholar] [CrossRef]
  43. Salant, S.W. What ails the European Union’s emissions trading system? J. Environ. Econ. Manag. 2016, 80, 6–19. [Google Scholar] [CrossRef]
  44. Cui, L.B.; Fan, Y.; Zhu, L.; Bi, Q.H. How will the emissions trading scheme save cost for achieving China’s 2020 carbon intensity reduction target? Appl. Energy 2014, 136, 1043–1052. [Google Scholar] [CrossRef]
  45. Chang, K.; Zhang, C.; Chang, H. Emissions reduction allocation and economic welfare estimation through interregional emissions trading in China: Evidence from efficiency and equity. Energy 2016, 113, 1125–1135. [Google Scholar] [CrossRef]
  46. Liu, Y.; Tan, X.; Yu, Y.; Qi, S. Assessment of impacts of Hubei Pilot emission trading schemes in China—A CGE-analysis using TermCO2 model. Appl. Energy 2017, 189, 762–769. [Google Scholar] [CrossRef]
  47. China Carbon Trading Network. The Interim Management Method of PHCER Announced by Guangdong Provincial Development and Reform Commission 2017. Available online: http://www.tanjiaoyi.com/article-21012-1.html (accessed on 30 March 2017).
Figure 1. The geographical position of Guangdong.
Sustainability 10 04210 g001
Figure 2. The compulsory payment industries under 90% free allocation ratio (ten thousand tons).
Sustainability 10 04210 g002
Figure 3. Number of compulsory payment industry.
Sustainability 10 04210 g003
Table 1. Names of industries.
NumberName of IndustryAbbreviation
1ConstructionCONSTRU
2Farming, Forestry, Animal Husbandry, and FisheryFARM
3Leather, Fur, Feather, Down, and Related ProductsLEATHER
4Manufacture of Communication Equipment, Computers, and Other Electronic EquipmentCOMMEQIP
5Manufacture of Cultural, Educational, Sports and Entertainment ArticlesCULTARTI
6Manufacture of Chemical FibersCHEMFIBE
7Manufacture of Electrical Machinery and EquipmentELECMACH
8Manufacture of FoodFOOD
9Manufacture of FurnitureFURNI
10Manufacture of General-purpose MachineryGENEMACH
11Manufacture of Instruments and MetersINSTU
12Manufacture of MedicinesMEDICINES
13Manufacture of Railway, Ship, Aeronautics, Automobile and Other Transport equipmentRAILEQIP
14Manufacture of Raw Chemical Materials and ChemicalRAWCHEM
15Manufacture of Special-purpose MachinerySPECMACH
16Manufacture of Textile Garments, Footwear, and HeadgearTEXTGARM
17Manufacture of Wine, Beverage, and Refined TeaWINE
18Metal ProductsMETAL
19Mining and QuarryingMINING
20Nonmetal Mineral ProductsNONMETAL
21Other Manufactures and waste recyclingOTHERMAN
22Processing of Farm and Sideline FoodPFARM
23Papermaking and Paper ProductsPAPER
24Petroleum Refining, Coking, and Nuclear Fuel ProcessingPETRO
25Printing and Record Medium ReproductionPRINT
26Production and Supply of Electric Power and Heat PowerPOWER
27Production and Supply of GasGAS
28Production and Supply of WaterWATER
29Rubber and Plastic ProductsRUBBER
30Smelting and Pressing of Ferrous MetalsFERROUS
31Smelting and Pressing of Nonferrous MetalsNONFERROUS
32Textile IndustryTEXTILE
33Tobacco ProductsTOBACCO
34Timber Processing, Bamboo, Cane, Palm Fiber & StrawTIMBER
35Transport, Storage, Postal and Telecommunication ServicesTRANSPORT
36Wholesale and Retail Trade and Catering ServicesRETAIL
Table 2. Weights of indicators under three preference cases in the Nash bargaining model.
ParameterCase 1: BalancedCase 2: Economic-OrientedCase 3: Emission-Oriented
α 0.50.30.7
β 0.50.70.3
α + β 111
Table 3. Carbon emission quotas for each industry in 2020 (ten thousand tons).
Name of Industry (Abbr.)BalancedEconomic-OrientedEmission-OrientedGrandfathering
NONMETAL9351.979190.469499.509774.49
TRANSPORT8435.018357.068516.398678.27
POWER5665.515599.815730.215816.93
RETAIL4415.214579.844257.903978.42
PETRO4061.673987.654133.914223.75
COMMEQIP3922.764039.613813.203624.08
RAWCHEM3716.923676.753756.973802.28
PAPER2911.442856.132968.423047.42
FERROUS2627.682578.992677.992752.58
RUBBER2144.792129.452157.742179.18
CONSTRU2101.132135.522067.992020.97
TEXTILE1896.621871.901920.301961.72
ELECMACH1857.941908.521809.071742.32
METAL1609.801614.711603.121598.21
FARM1575.741658.881494.801383.16
NONFERROUS1254.011241.551266.091287.45
PFARM949.28943.39956.45966.10
RAILEQIP882.74915.97849.69801.55
TEXTGARM878.34886.65866.99848.74
CULTARTI619.93628.97609.95592.46
LEATHER566.17574.67557.14541.63
MINING544.44551.88538.02528.20
GENEMACH537.39549.06524.30502.28
SPECMACH516.27527.08506.25489.00
FOOD459.24469.51450.90438.98
MEDICINES441.84449.08438.35433.45
WATER390.68383.69391.54396.87
PRINT371.66374.46369.85368.35
FURNI336.60347.03329.53321.05
TIMBER325.97321.74326.12325.87
WINE294.02296.24291.45285.16
OTHERMAN263.72268.29260.37251.20
INSTU201.36203.70197.09192.84
CHEMFIBE195.84191.63199.62204.27
GAS80.6084.3275.2068.06
TOBACCO49.4659.5741.3526.45
Total66,453.7566,453.7566,453.7566,453.75
Table 4. The compulsory payment industries under 95% free allocation (ten thousand tons).
Name of Industry (Abbr.)BalancedEconomic-OrientedEmission-Oriented Q i ( 2015 )
PAPER2765.872713.322820.002719.91
FERROUS2496.302450.042544.092456.75
CHEMFIBE186.04182.05189.64182.32
Note: The results under three preference cases are computed by multiplying the results of Table 3 by 95%.
Table 5. Carbon intensity of the compulsory payment industries in 2015.
Industry (Abbr.)Carbon Intensity (Tons per Ten Thousand RMB)
NONMETAL7.06
FERROUS6.74
PAPER6.41
CHEMFIBE5.50
PETRO4.65
TEXTILE2.98
POWER2.69
TRANSPORT2.64
NONFERROUS2.42
RAWCHEM2.28
WATER2.11
PFARM1.92
RUBBER1.69
TIMBER1.41
The average carbon intensity of 36 industries1.25
Table 6. The classification of eight key emission reduction industries.
Eight Key Emission Reduction IndustriesIndustries Studied in This Paper (Abbr.)
PetrochemicalPETRO
ChemicalRAWCHEM, RUBBER, CHEMFIBE
Building MaterialsNONMETAL, TIMBER
SteelFERROUS
Nonferrous MetalsNONFERROUS
PapermakingPAPER
ElectricityPOWER
AviationTRANSPORT
Note: The classification comes from Wind information.
Table 7. Carbon reduction labeling based on industries clustering result.
Carbon Reduction LabelingIndustries (Abbr.)
Compulsory reduction industriesPFARM, TEXTILE, PAPER, PETRO, RAWCHEM, CHEMFIBE,
RUBBER, NONMETAL, FERROUS, NONFERROUS, POWER, TRANSPORT
Key reduction industriesTIMBER, WATER
Encouraging reduction industriesFARM, MINING, FOOD, WINE, TOBACCO, TEXTGARM, LEATHER, FURNI, PRINT, CULTARTI, METAL, GENEMACH, SPECMACH, RAILEQIP, ELECMACH, COMMEQIP, INSTU, OTHERMAN, GAS, CONSTRU, RETAIL, MEDICINES