Vegetation Cover Drives Arthropod Communities in Mediterranean/Subtropical Green Roof Habitats

Abstract
:1. Introduction
2. Methods
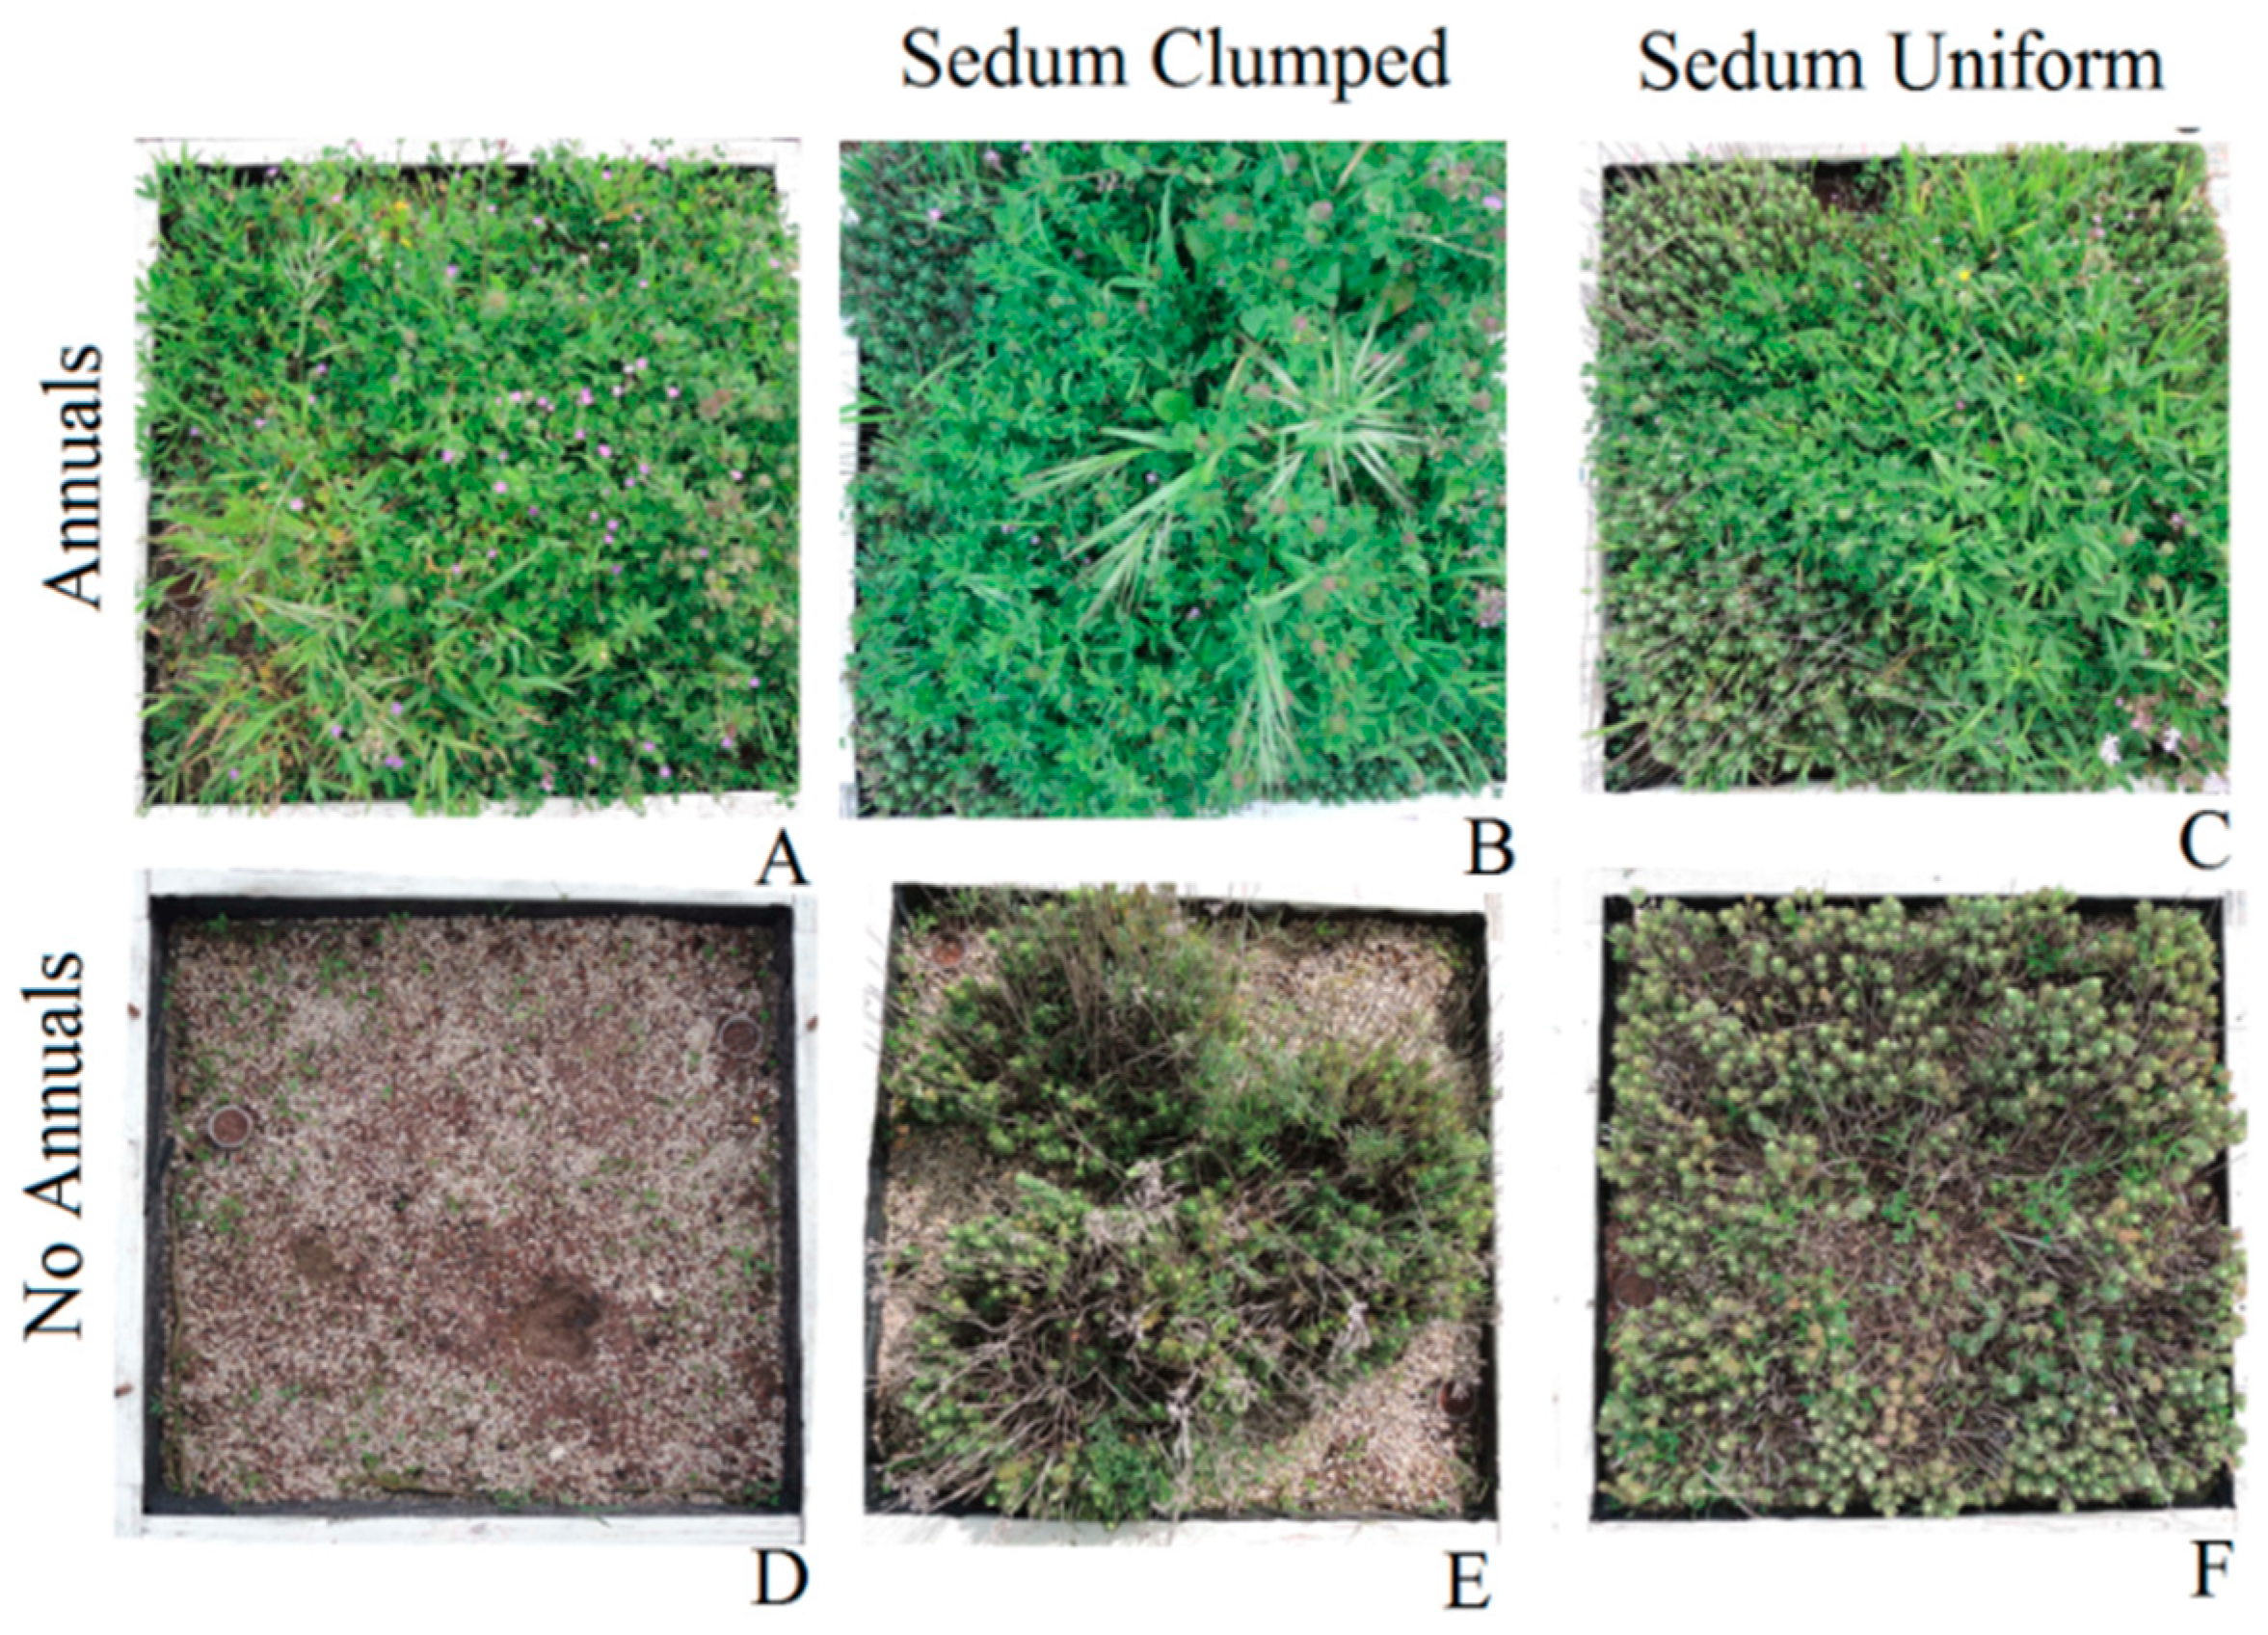
2.1. Experimental Design
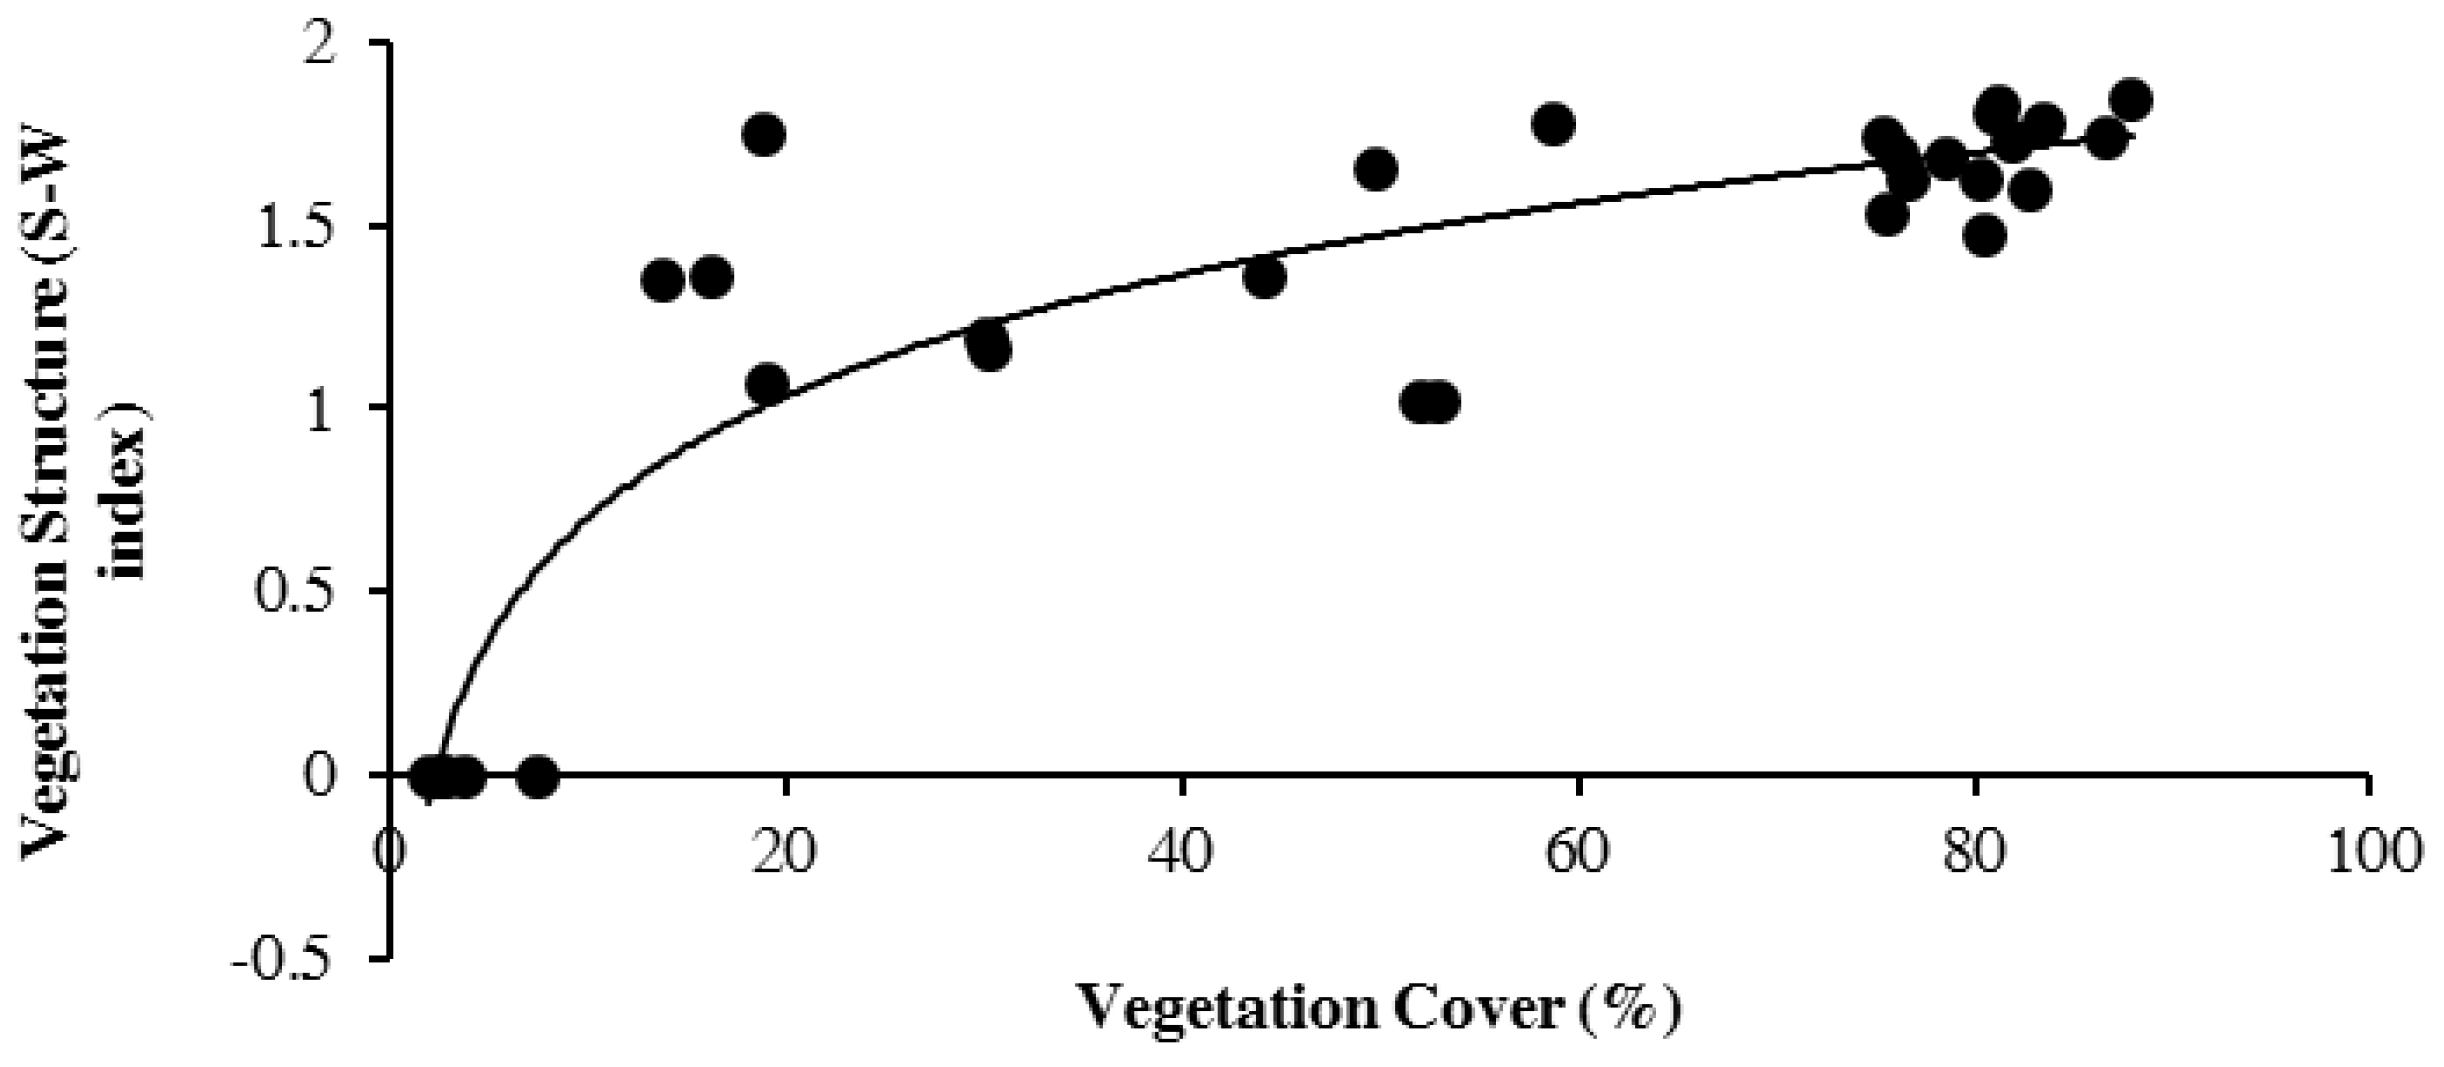
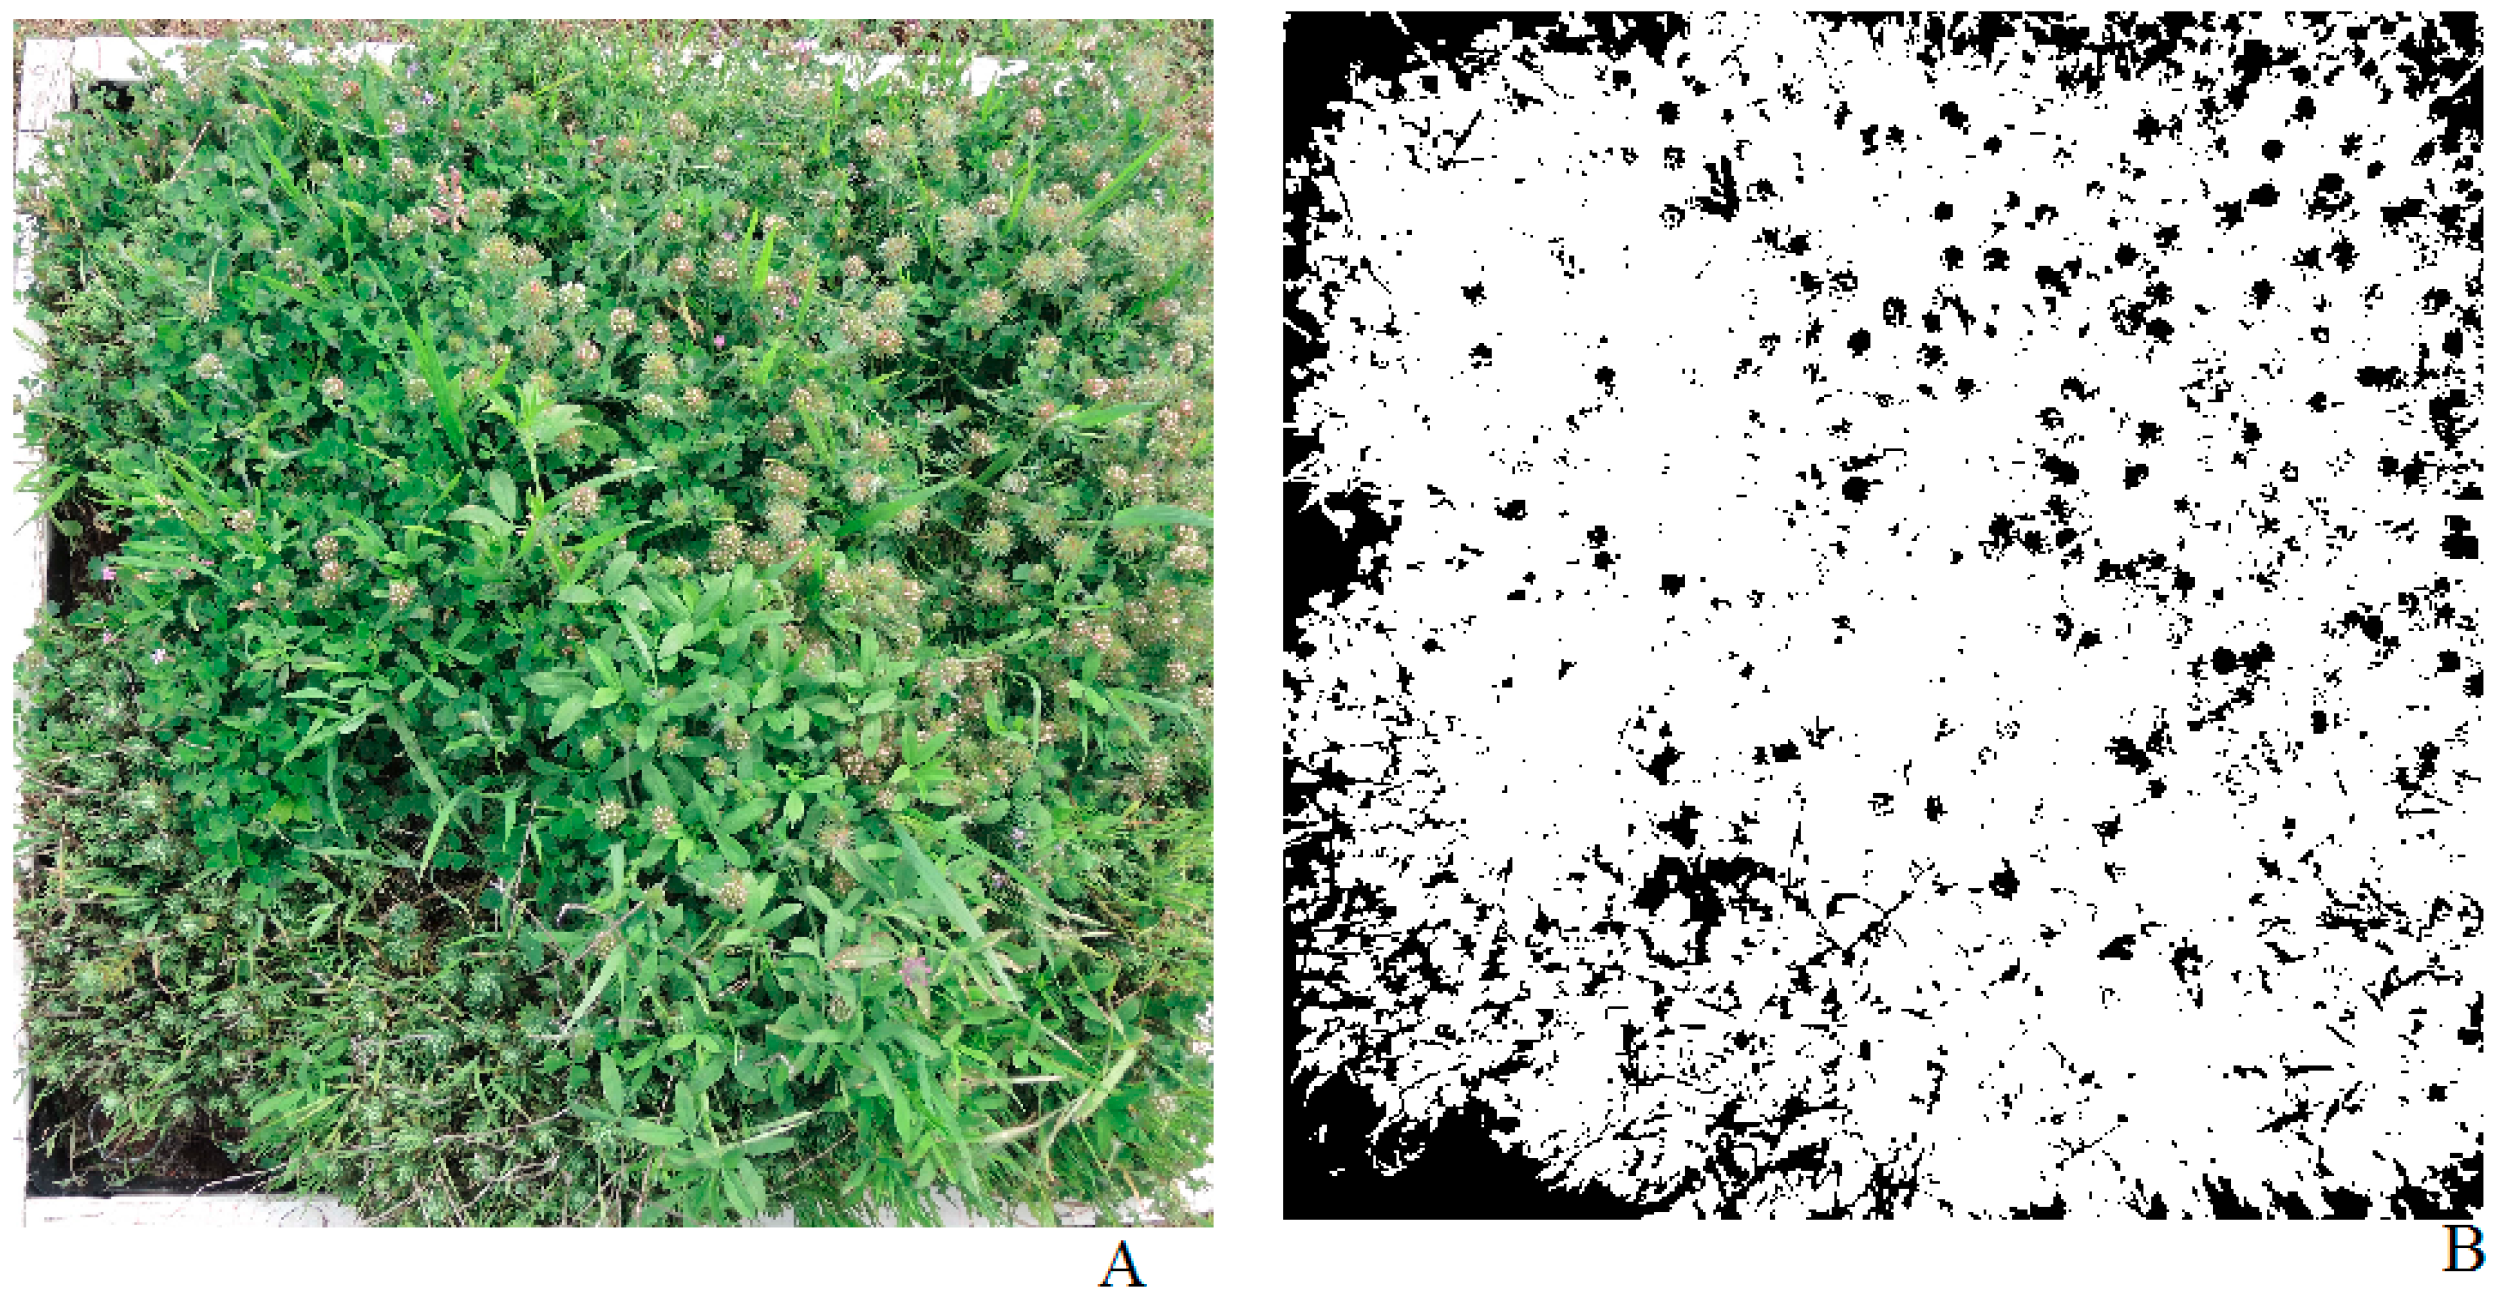
2.2. Vegetation Cover and Vegetation Structure Analysis
2.3. Substrate Temperature and Relative Substrate Moisture
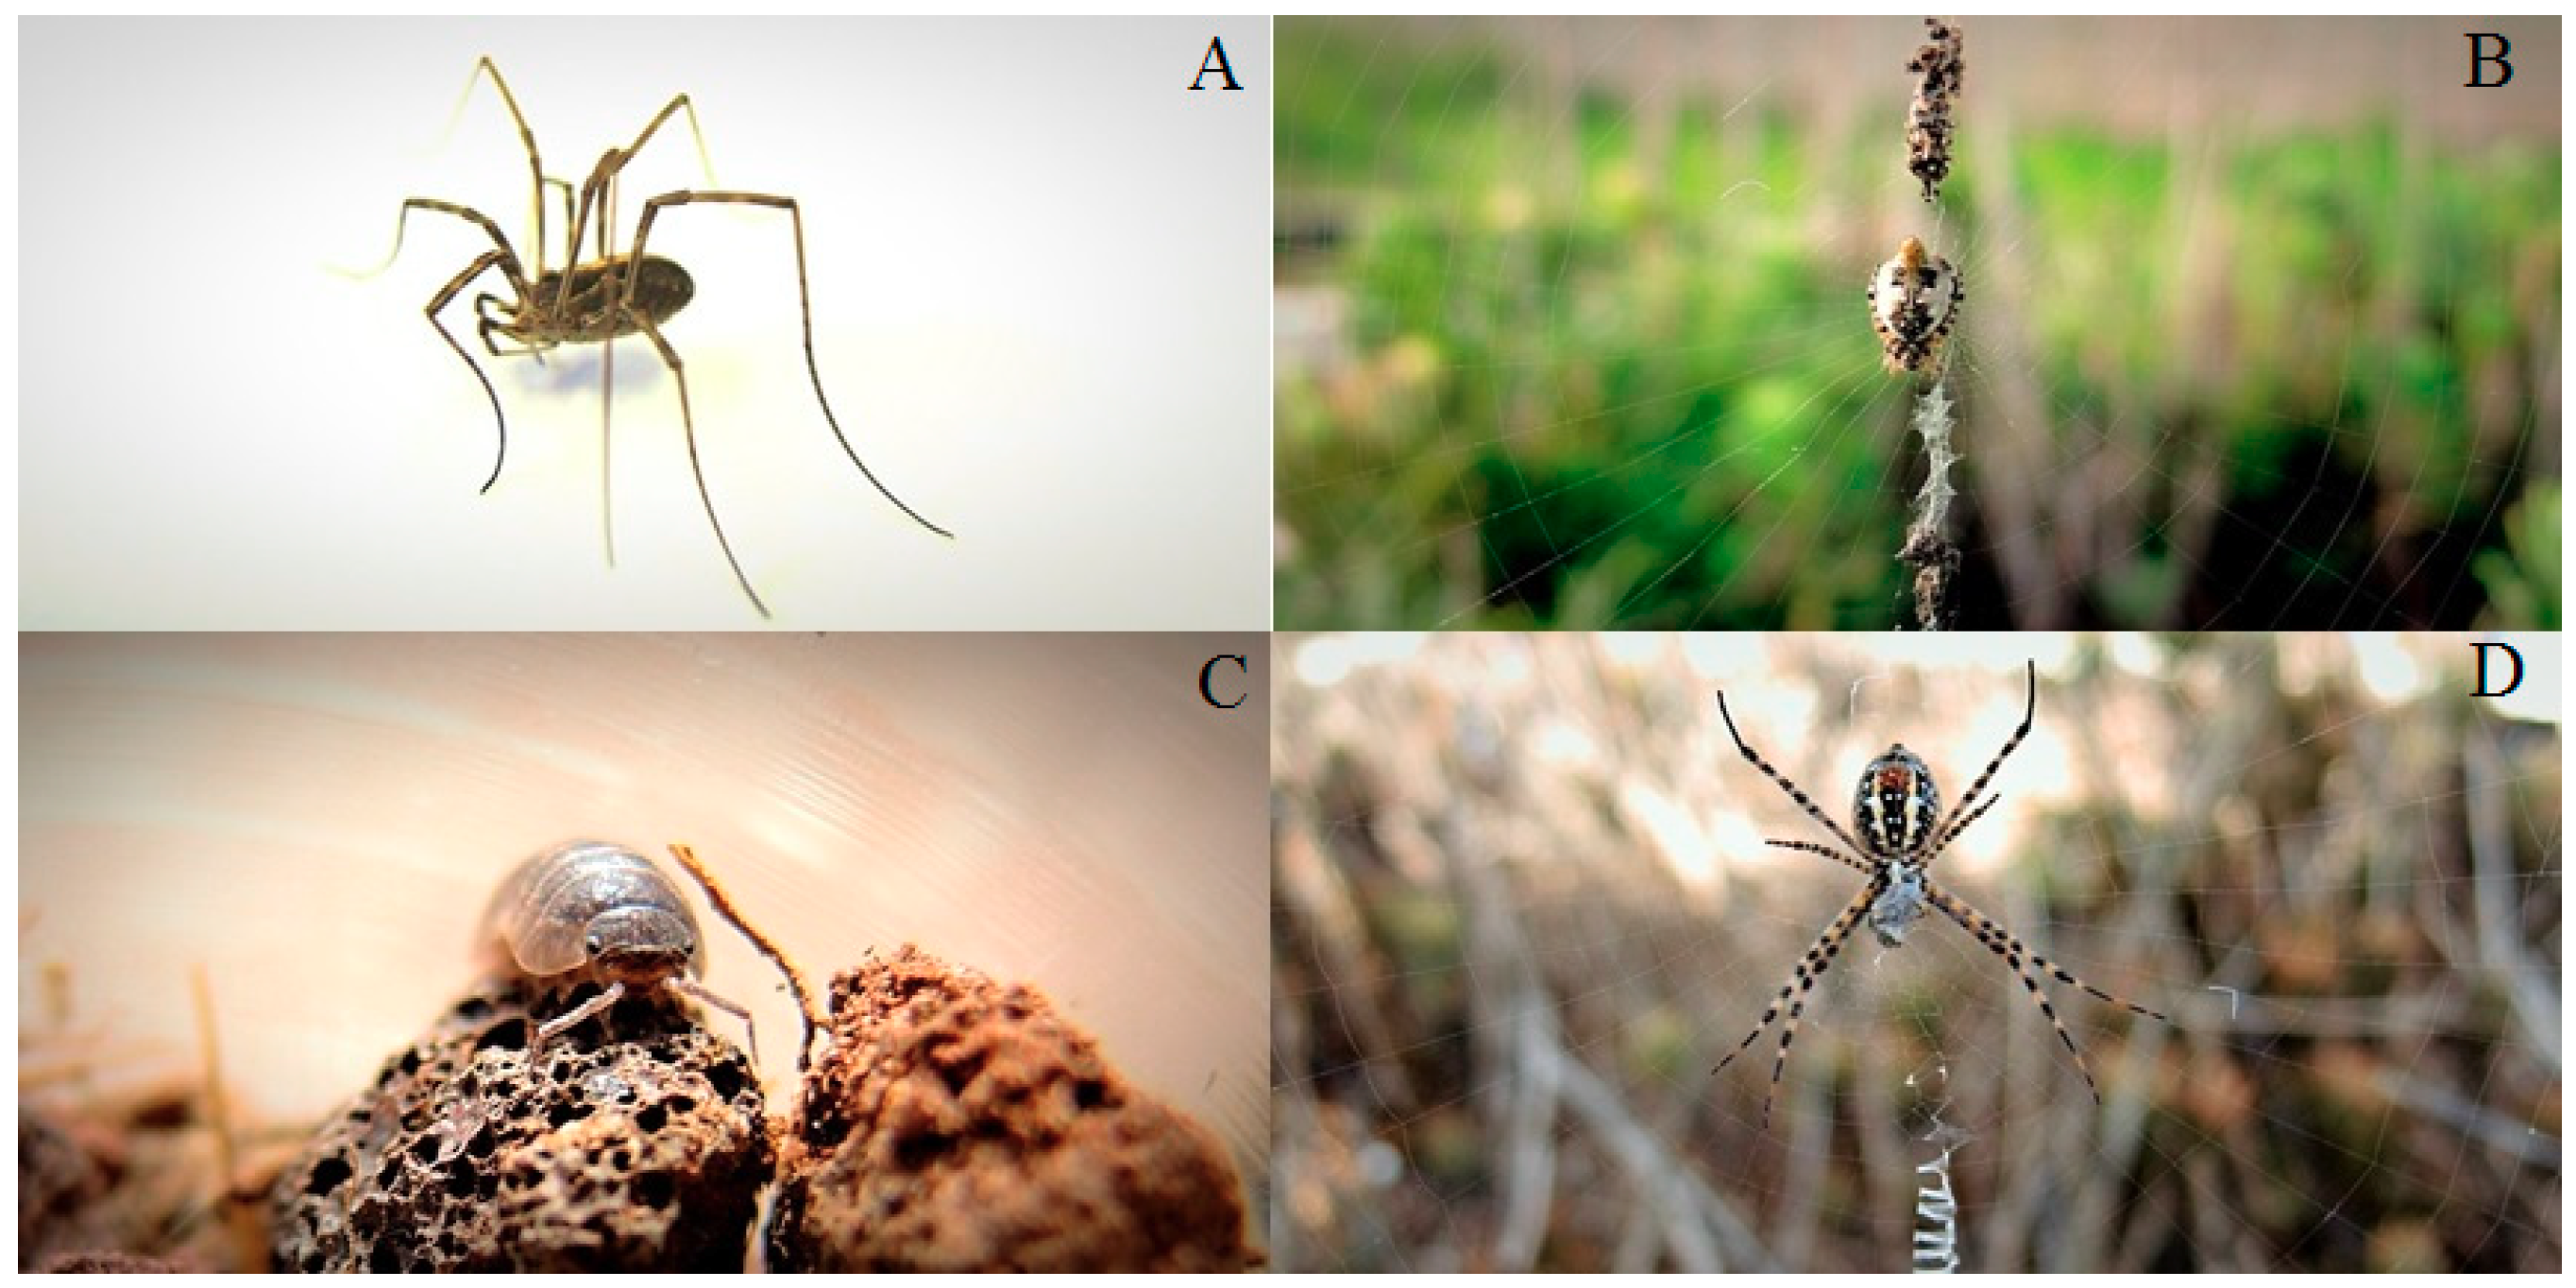
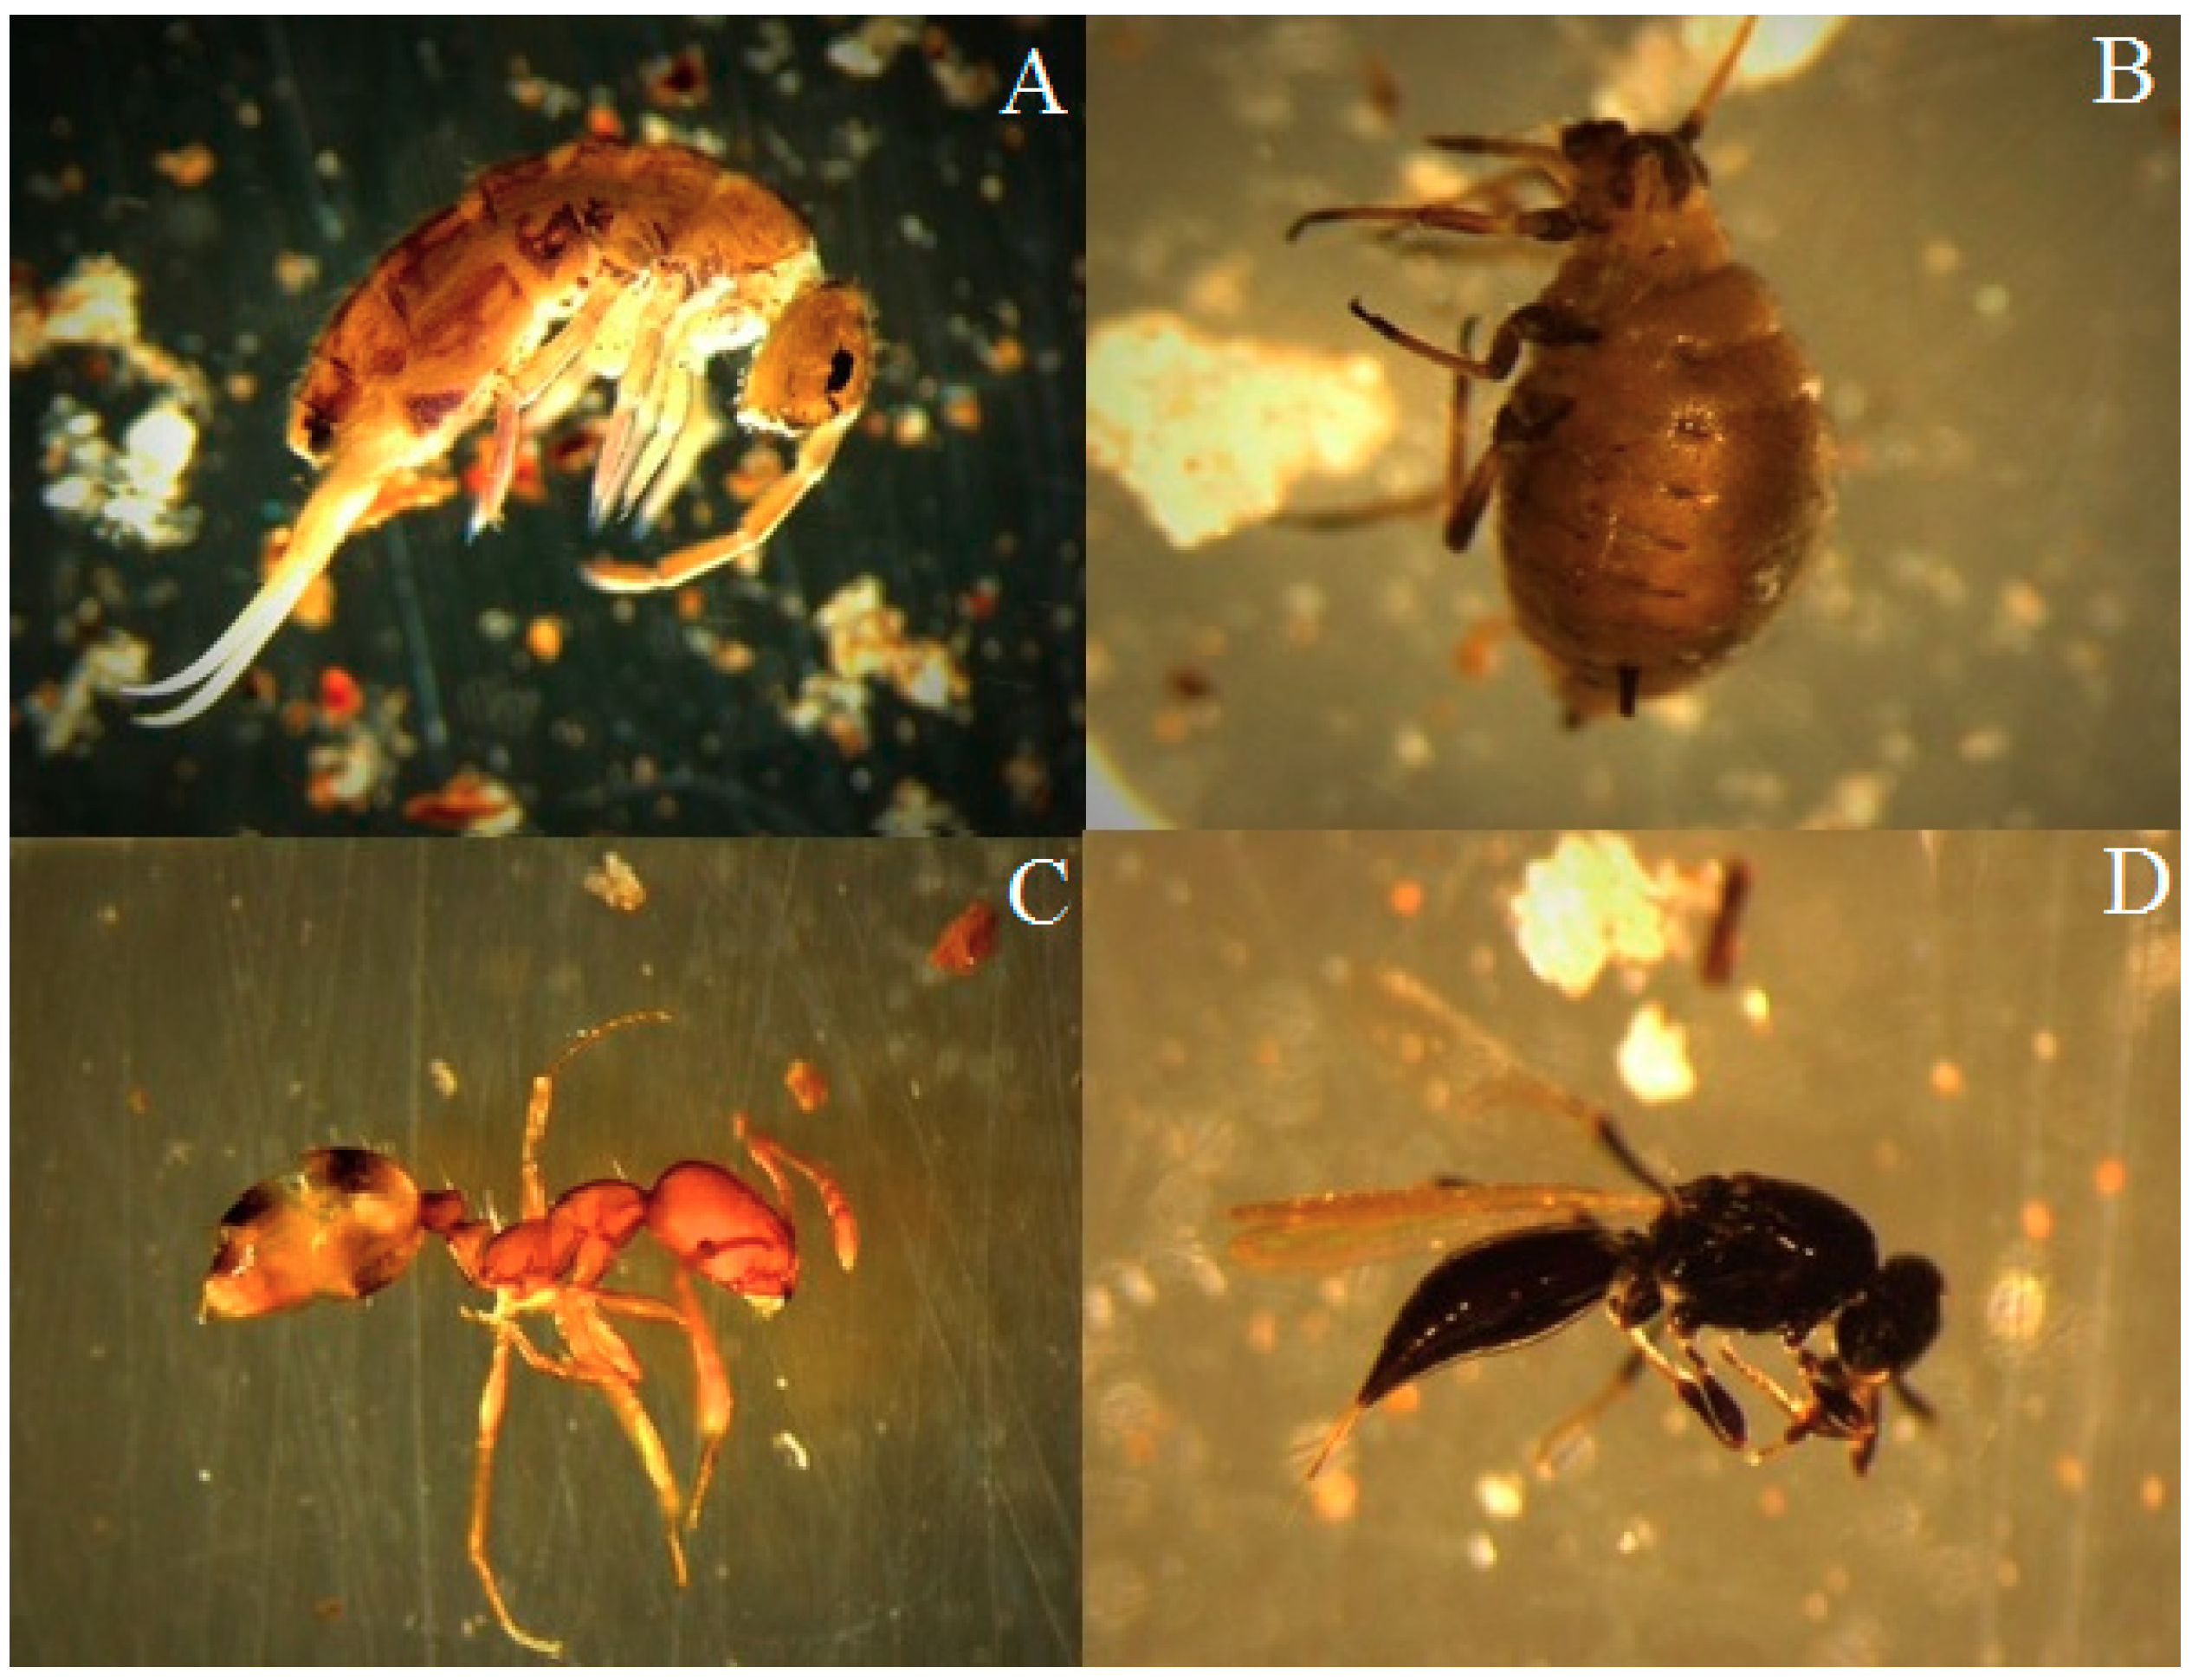
2.4. Arthropod Sampling
2.5. Data Analysis
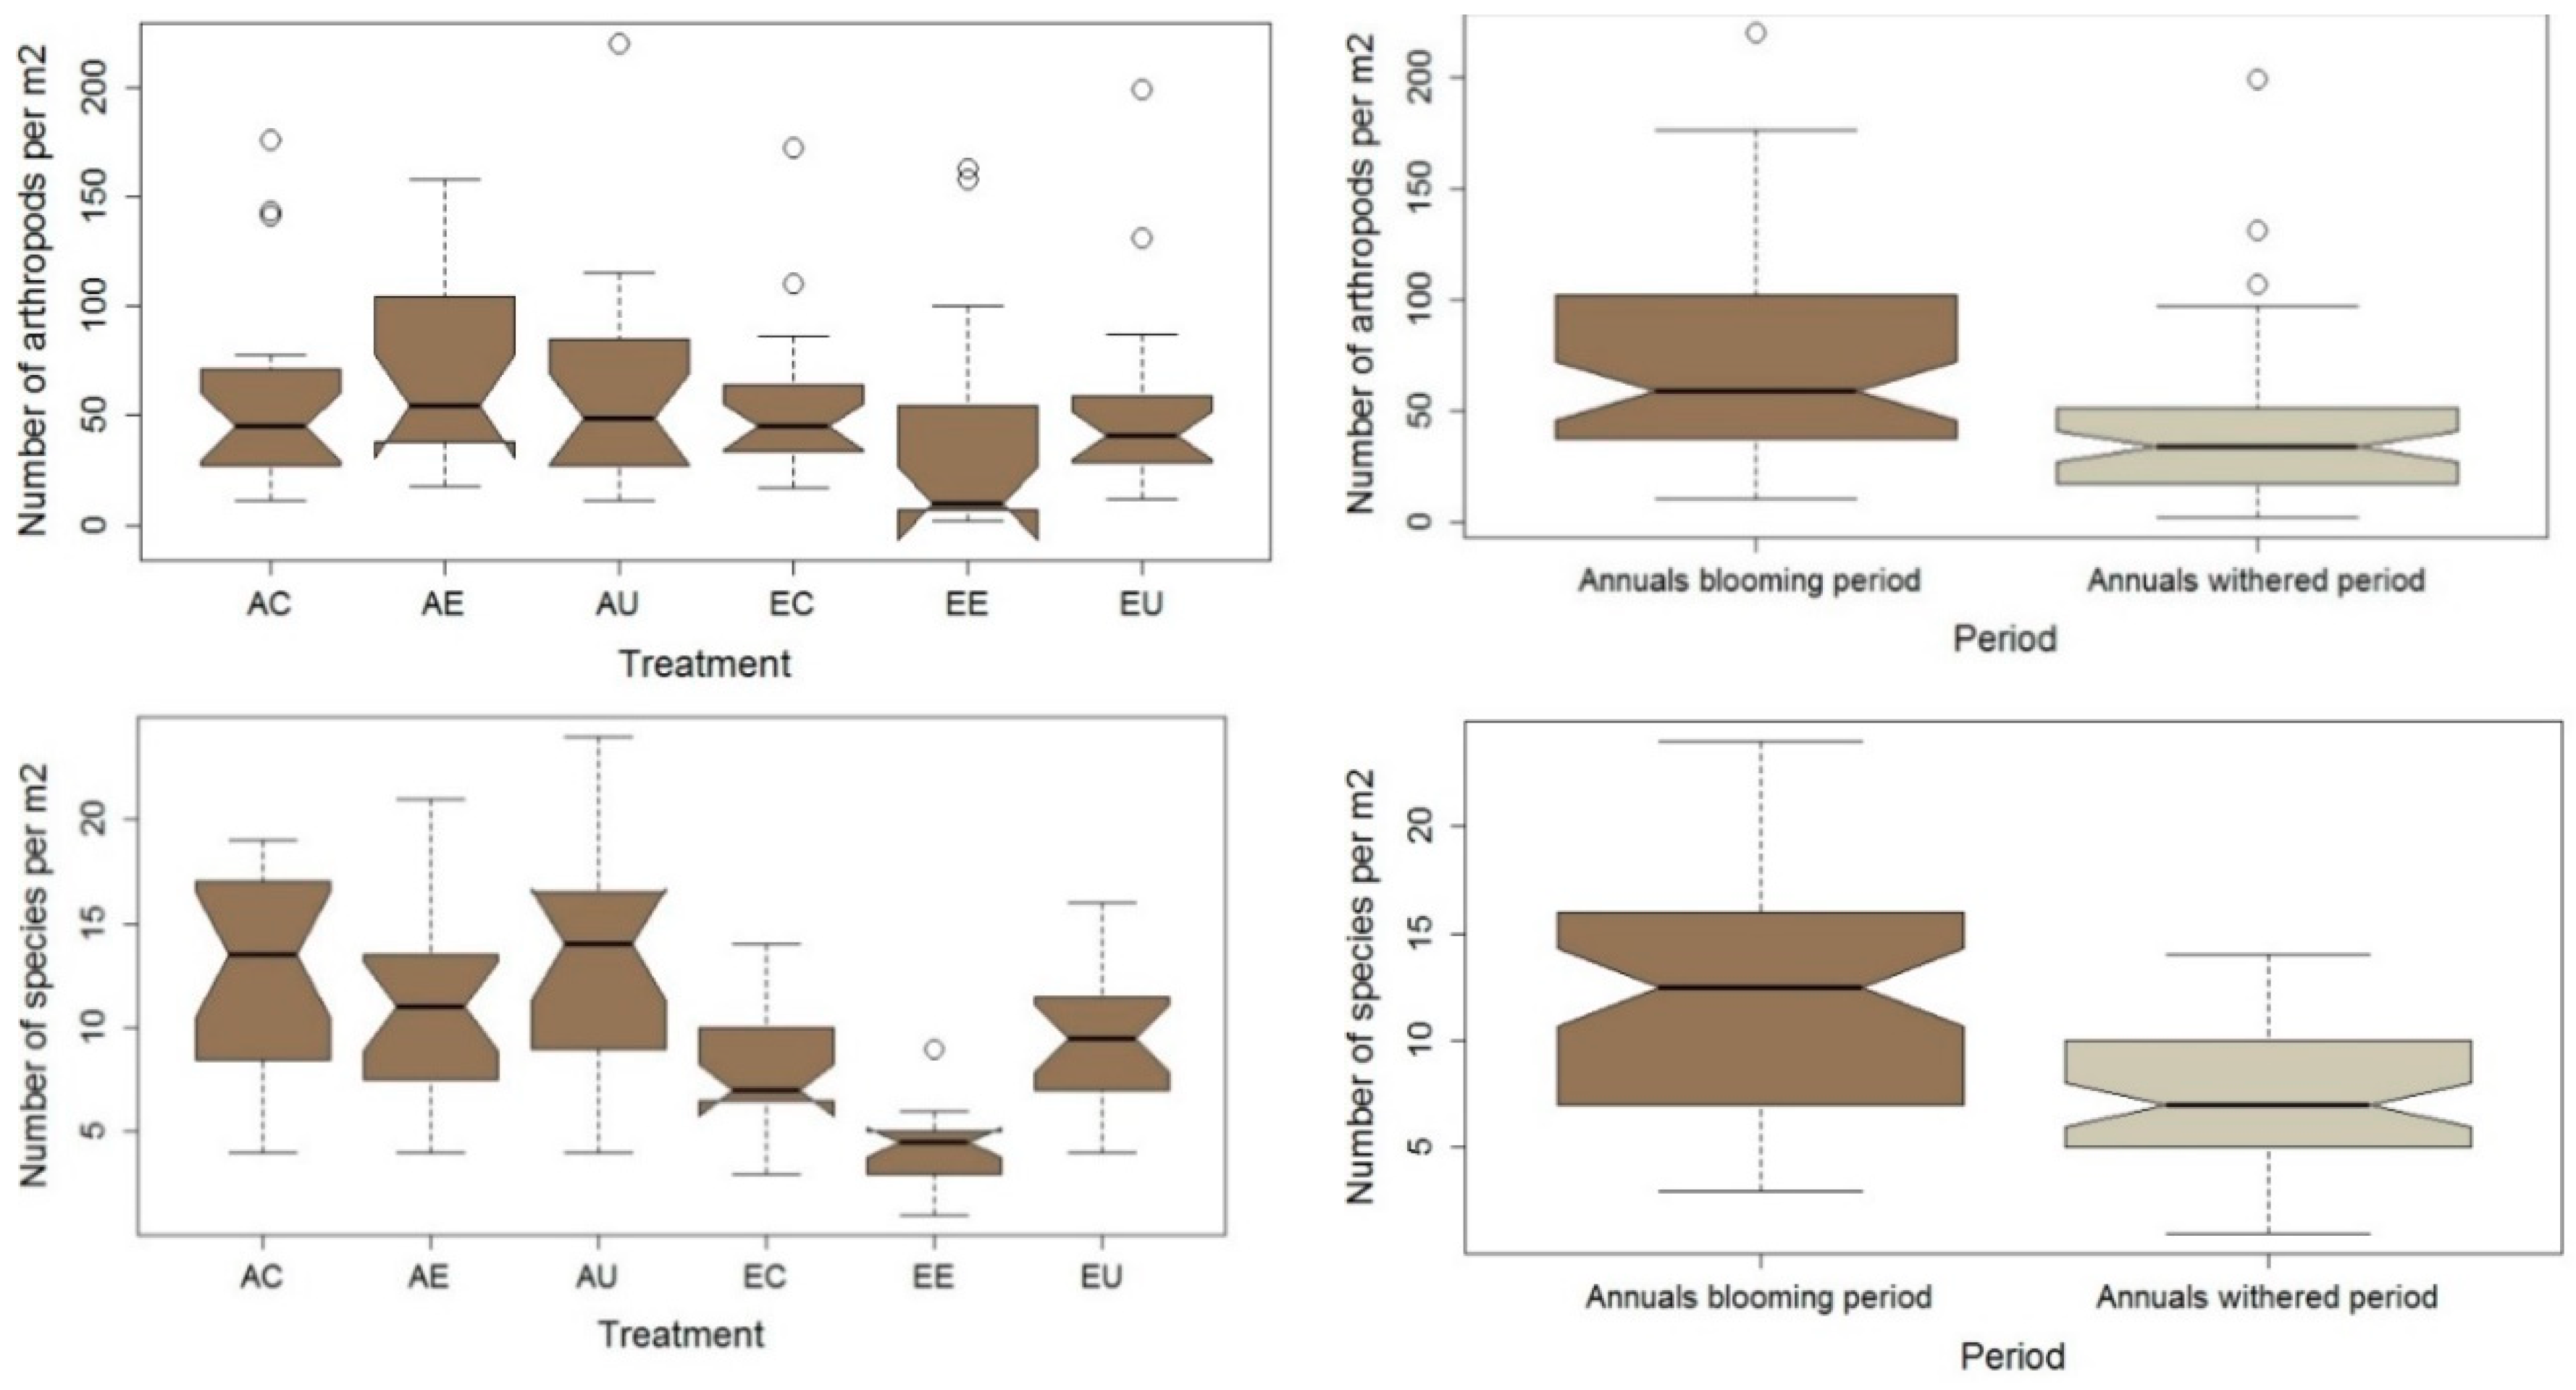
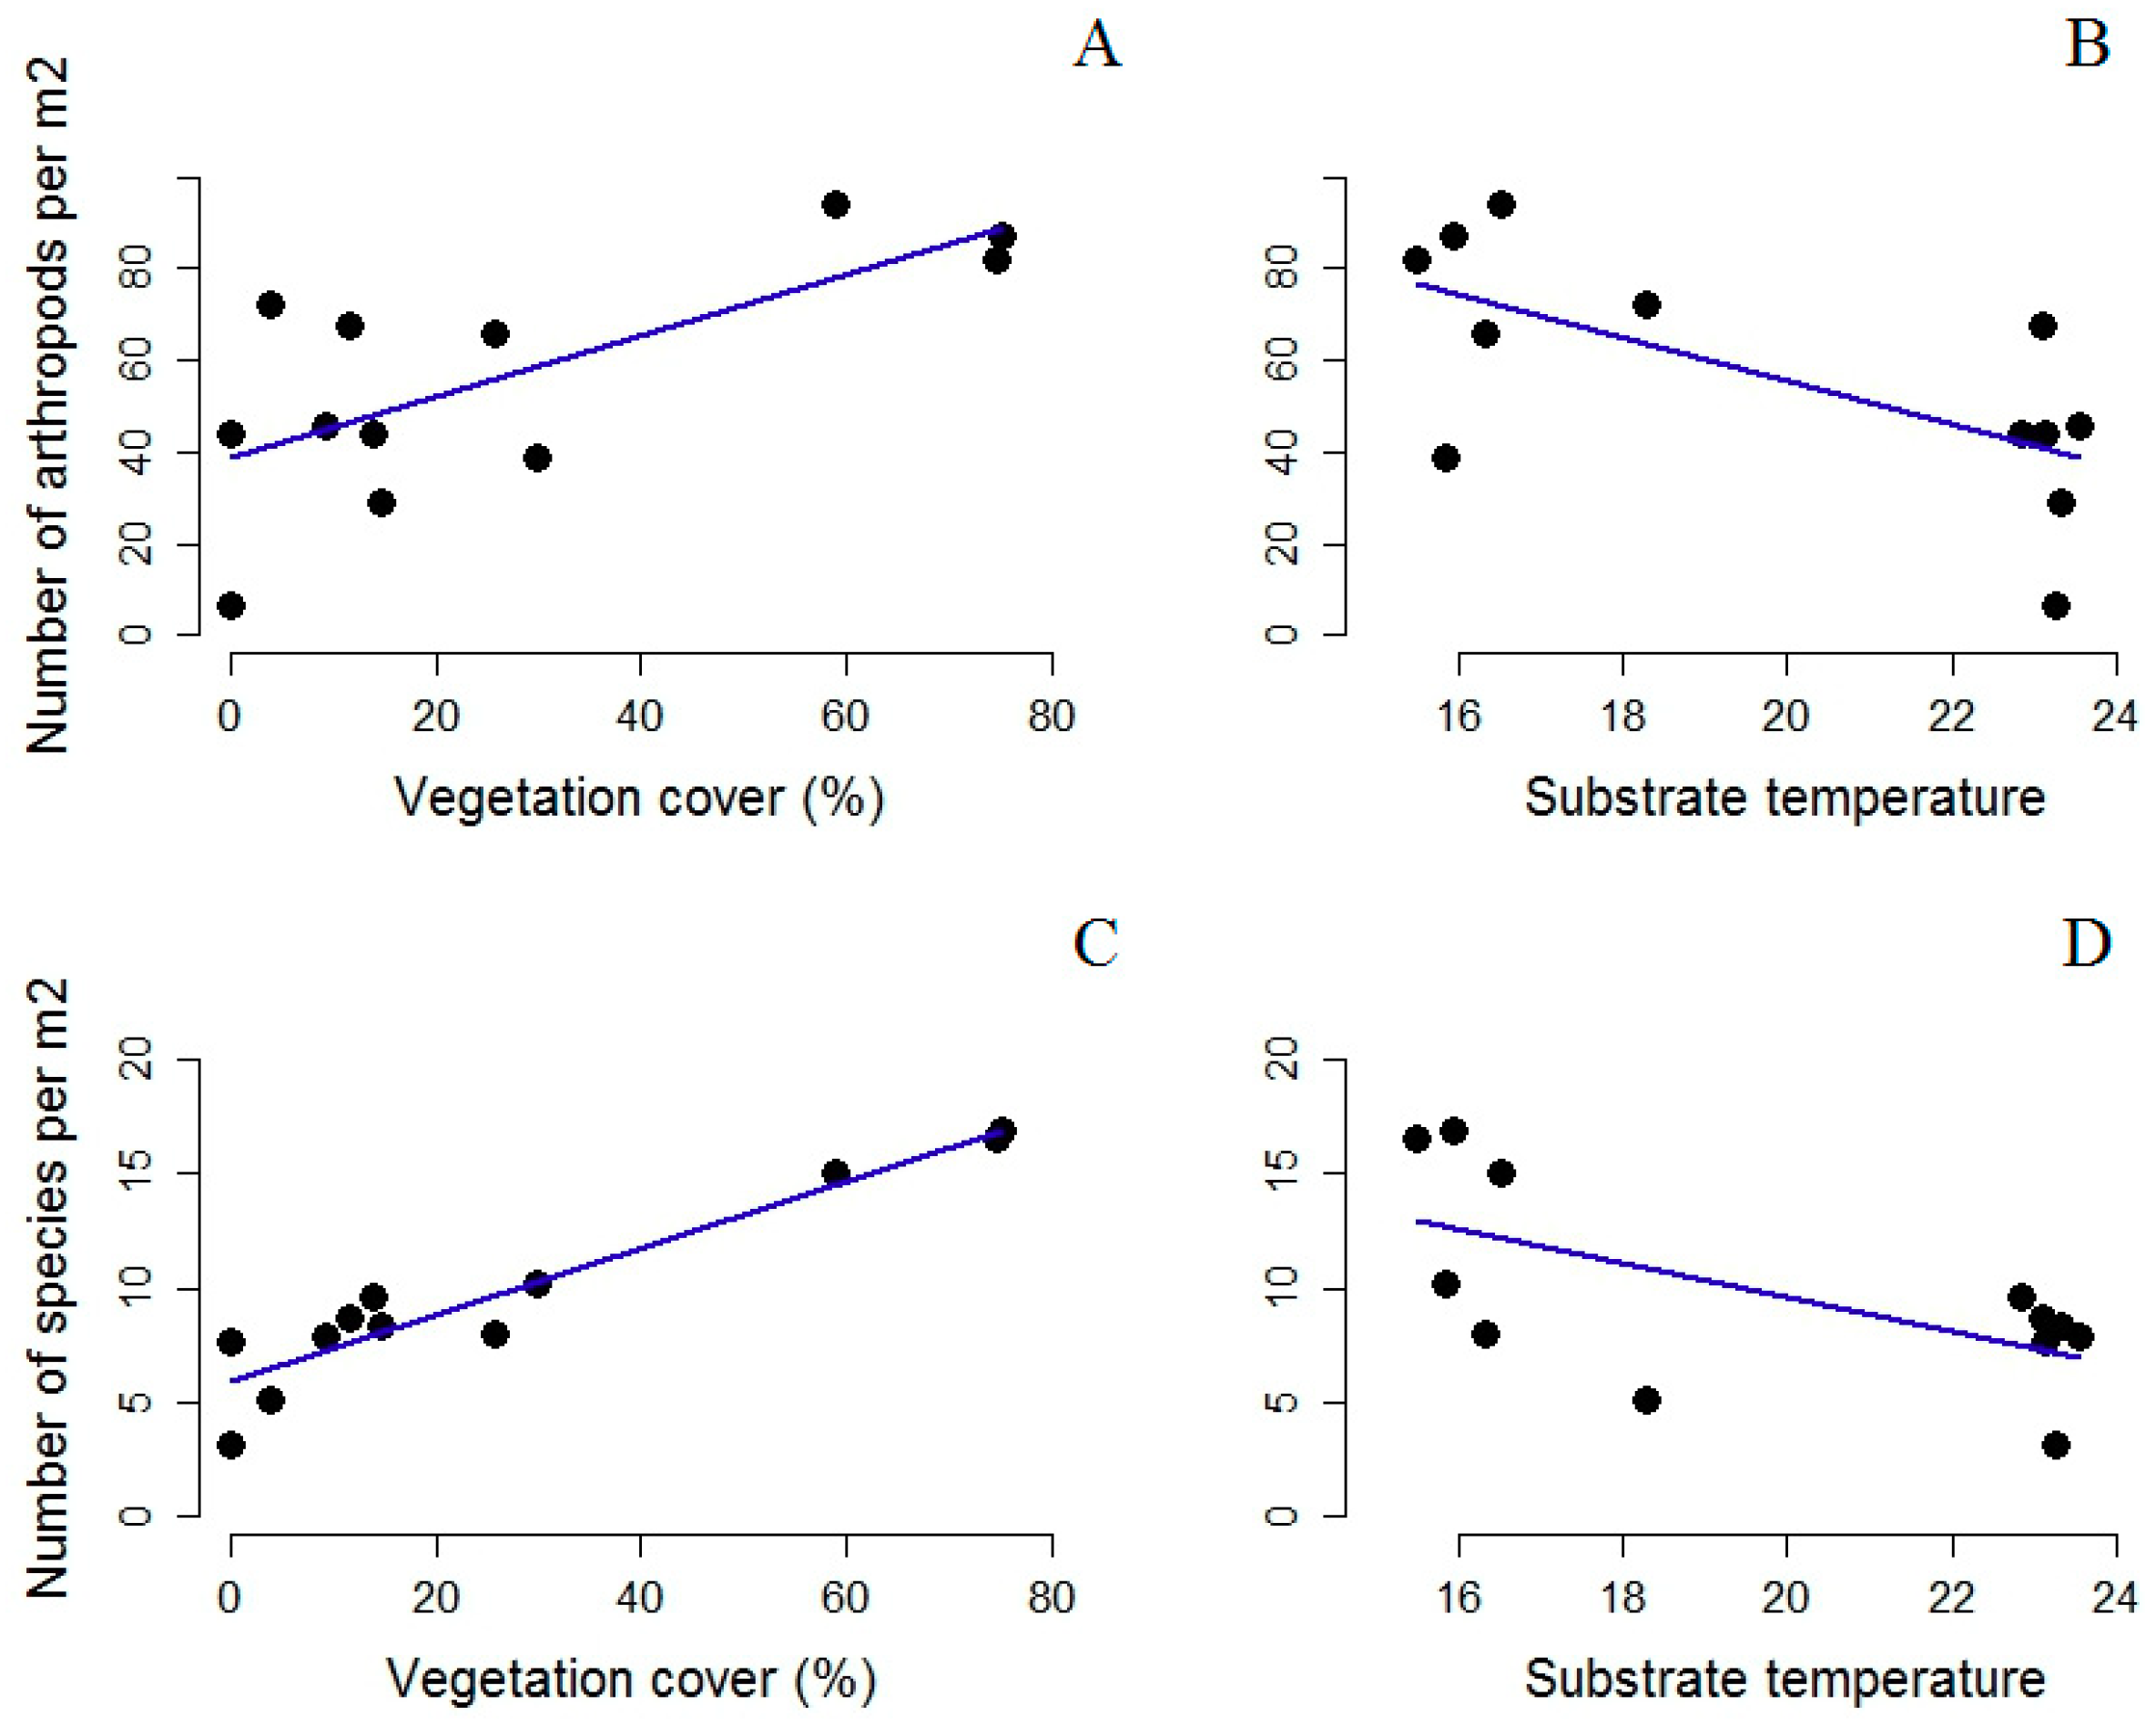
3. Results
4. Discussion
Plant Selection and Temporal Variation
Author Contributions
Funding
Acknowledgments
Conflicts of Interest
References
- Ripple, W.J.; Wolf, C.; Newsome, T.M.; Galetti, M.; Alamgir, M.; Crist, E.; Mahmoud, M.I.; Laurance, W.F.; 15,364 Scientist Signatories from 184 Countries. World scientists’ warning to humanity: A second notice. BioScience 2017, 67, 1026–1028. [Google Scholar] [CrossRef]
- Aronson, M.F.; La Sorte, F.A.; Nilon, C.H.; Katti, M.; Goddard, M.A.; Lepczyk, C.A.; Warren, P.S.; Williams, N.S.; Cilliers, S.; Clarkson, B.; et al. A global analysis of the impacts of urbanization on bird and plant diversity reveals key anthropogenic drivers. Proc. R. Soc. B 2014, 281. [Google Scholar] [CrossRef] [PubMed]
- Shwartz, A.; Turbé, A.; Julliard, R.; Simon, L.; Prévot, A.C. Outstanding challenges for urban conservation research and action. Glob. Environ. Chang. 2014, 28, 39–49. [Google Scholar] [CrossRef]
- Jules, E.S. Dangers in dividing conservation biology and agroecology. Conserv. Biol. 1997, 11, 1272–1273. [Google Scholar]
- Marzluff, J.M. Worldwide urbanization and its effects on birds. In Avian Ecology and Conservation in an Urbanizing World; Springer: Boston, MA, USA, 2001; pp. 19–47. [Google Scholar]
- Wolff, P.J.; DeGregorio, B.A.; Rodriguez-Cruz, V.; Mulero-Oliveras, E.; Sperry, J.H. Bird Community Assemblage and Distribution in a Tropical, Urban Ecosystem of Puerto Rico. Trop. Conserv. Sci. 2018, 11. [Google Scholar] [CrossRef] [Green Version]
- Kadas, G. Rare invertebrates colonizing green roofs in London. Urban Habitat. 2006, 4, 66–86. [Google Scholar]
- Kyrö, K.; Brenneisen, S.; Kotze, D.J.; Szallies, A.; Gerner, M.; Lehvävirta, S. Local habitat characteristics have a stronger effect than the surrounding urban landscape on beetle communities on green roofs. Urban For. Urban Green. 2018, 29, 122–130. [Google Scholar] [CrossRef]
- McKinney, M.L. Urbanization as a major cause of biotic homogenization. Biol. Conserv. 2006, 127, 247–260. [Google Scholar] [CrossRef]
- Cardoso, P.; Erwin, T.L.; Borges, P.A.; New, T.R. The seven impediments in invertebrate conservation and how to overcome them. Biol. Conserv. 2011, 144, 2647–2655. [Google Scholar] [CrossRef] [Green Version]
- González-Megías, A.; Gómez, J.M.; Sánchez-Piñero, F. Spatio-temporal change in the relationship between habitat heterogeneity and species diversity. Acta Oecol. 2011, 37, 179–186. [Google Scholar] [CrossRef]
- Perner, J.; Wytrykush, C.; Kahmen, A.; Buchmann, N.; Egerer, I.; Creutzburg, S.; Odat, N.; Audorff, V.; Weisser, W.W. Effects of plant diversity, plant productivity and habitat parameters on arthropod abundance in montane European grasslands. Ecography 2005, 28, 429–442. [Google Scholar] [CrossRef]
- Collins, R.; Schaafsma, M.; Hudson, M.D. The value of green walls to urban biodiversity. Land Use Policy 2017, 64, 114–123. [Google Scholar] [CrossRef] [Green Version]
- Salman, N.A.I.; Schindler, B.; Agra, H.; Bawab, O.; Friedman-Heiman, A.; Kadas, G.J.; Seifan, M.; Blaustein, L. Green roof research towards enhancing urban biodiversity, storm-water retention and air pollution abatement. CAB Rev. 2018, 13, 1–14. [Google Scholar]
- MacIvor, J.S.; Ksiazek, K. Invertebrates on green roofs. In Green Roof Ecosystems; Springer: Cham, Switzerland, 2015; pp. 333–355. [Google Scholar]
- MacIvor, J.S.; Lundholm, J. Insect species composition and diversity on intensive green roofs and adjacent level-ground habitats. Urban Ecosyst. 2011, 14, 225–241. [Google Scholar] [CrossRef]
- Williams, N.S.; Lundholm, J.; Scott MacIvor, J. Do green roofs help urban biodiversity conservation? J. Appl. Ecol. 2014, 51, 1643–1649. [Google Scholar] [CrossRef] [Green Version]
- Getter, K.L.; Rowe, D.B. The role of extensive green roofs in sustainable development. HortScience 2006, 41, 1276–1285. [Google Scholar]
- Boivin, M.A.; Lamy, M.P.; Gosselin, A.; Dansereau, B. Effect of artificial substrate depth on freezing injury of six herbaceous perennials grown in a green roof system. HortTechnology 2001, 11, 409–412. [Google Scholar]
- Lundholm, J.T. Green roofs and facades: A habitat template approach. Urban Habitat. 2006, 4, 87–101. [Google Scholar]
- Cook-Patton, S.C.; Bauerle, T.L. Potential benefits of plant diversity on vegetated roofs: A literature review. J. Environ. Manag. 2012, 106, 85–92. [Google Scholar] [CrossRef] [PubMed]
- Köhler, M. Long-term vegetation research on two extensive green roofs in Berlin. Urban Habitat. 2006, 4, 3–26. [Google Scholar]
- Durhman, A.K.; Rowe, D.B.; Rugh, C.L. Effect of substrate depth on initial growth, coverage, and survival of 25 succulent green roof plant taxa. HortScience 2007, 42, 588–595. [Google Scholar]
- Sayed, O.H. Crassulacean acid metabolism 1975–2000, a check list. Photosynthetica 2001, 39, 339–352. [Google Scholar] [CrossRef]
- Emilsson, T. Vegetation development on extensive vegetated green roofs: Influence of substrate composition, establishment method and species mix. Ecol. Eng. 2008, 33, 265–277. [Google Scholar] [CrossRef] [Green Version]
- Dirks, I.; Raviv, B.; Shelef, O.; Hill, A.; Eppel, A.; Aidoo, M.K.; Hoefgen, B.; Rapaport, T.; Gil, H.; Geta, E.; et al. Green roofs: What can we learn from desert plants? Isr. J. Ecol. Evol. 2016, 62, 58–67. [Google Scholar] [CrossRef]
- Snodgrass, E.C.; Snodgrass, L.L. Green Roof Plants: A Resource and Planting Guide; (No. 04; SB419. 5, S5.); Timber Press: Portland, OR, USA, 2006. [Google Scholar]
- Vasl, A.; Shalom, H.; Kadas, G.J.; Blaustein, L. Sedum—Annual plant interactions on green roofs: Facilitation, competition and exclusion. Ecol. Eng. 2017, 108, 318–329. [Google Scholar] [CrossRef]
- Butler, C.; Orians, C.M. Sedum cools soil and can improve neighboring plant performance during water deficit on a green roof. Ecol. Eng. 2011, 37, 1796–1803. [Google Scholar] [CrossRef]
- Dunnett, N.; Nagase, A.; Booth, R.; Grime, P. Influence of vegetation composition on runoff in two simulated green roof experiments. Urban Ecosyst. 2008, 11, 385–398. [Google Scholar] [CrossRef]
- Heinze, W. Results of an experiment on extensive growth of vegetation on roofs. Rasen Grünflachen Begrünungen 1985, 16, 80–88. [Google Scholar]
- Schrader, S.; Böning, M. Soil formation on green roofs and its contribution to urban biodiversity with emphasis on Collembolans. Pedobiologia 2006, 50, 347–356. [Google Scholar] [CrossRef]
- Van Mechelen, C.; Dutoit, T.; Hermy, M. Vegetation development on different extensive green roof types in a Mediterranean and temperate maritime climate. Ecol. Eng. 2015, 82, 571–582. [Google Scholar] [CrossRef]
- Velázquez, J.; Anza, P.; Gutiérrez, J.; Sánchez, B.; Hernando, A.; García-Abril, A. Planning and selection of green roofs in large urban areas. Application to Madrid metropolitan area. Urban For. Urban Green. 2018. [Google Scholar] [CrossRef]
- Gaston, K.J. Species-range size distributions: Products of speciation, extinction and transformation. Philos. Trans. R. Soc. Lond. B Biol. Sci. 1998, 353, 219–230. [Google Scholar] [CrossRef]
- Vasl, A. The Effects of Selected Biotic and Abiotic Factors on Extensive Green Roof Plant Community Structure, Haifa, Israel. Ph.D. Thesis, University of Haifa, Haifa, Israel, 2016. [Google Scholar]
- Agra, H.; Klein, T.; Vasl, A.; Shalom, H.; Kadas, G.; Blaustein, L. Sedum-dominated green-roofs in a semi-arid region increase CO2 concentrations during the dry season. Sci. Total Environ. 2017, 584, 1147–1151. [Google Scholar] [CrossRef] [PubMed]
- Oberndorfer, E.; Lundholm, J.; Bass, B.; Coffman, R.R.; Doshi, H.; Dunnett, N.; Gaffin, S.; Köhler, M.; Liu, K.K.; Rowe, B. Green roofs as urban ecosystems: Ecological structures, functions, and services. BioScience 2007, 57, 823–833. [Google Scholar] [CrossRef]
- Patrignani, A.; Ochsner, T.E. Canopeo: A powerful new tool for measuring fractional green canopy cover. Agron. J. 2015, 107, 2312–2320. [Google Scholar] [CrossRef]
- MacArthur, R.H.; MacArthur, J.W. On bird species diversity. Ecology 1961, 42, 594–598. [Google Scholar] [CrossRef]
- Shannon, C.E.; Weaver, W. The Mathematical Theory of Communication; University of Illinois Press: Urbana, IL, USA, 1963. [Google Scholar]
- Harvey-Clark, C. IACUC challenges in invertebrate research. ILAR J. 2011, 52, 213–220. [Google Scholar] [CrossRef] [PubMed]
- Oliver, I.; Beattie, A.J. Invertebrate morphospecies as surrogates for species: A case study. Conserv. Biol. 1996, 10, 99–109. [Google Scholar] [CrossRef]
- Team, R.C. R: A Language and Environment for Statistical Computing; R Development Core Team: Vienna, Austria, 2013. [Google Scholar]
- Liu, R.; Pen-Mouratov, S.; Steinberger, Y. Shrub cover expressed as an ‘arthropod island’ in xeric environments. Arthropod-Plant Interact. 2016, 10, 393–402. [Google Scholar] [CrossRef]
- Greenstone, M.H. Determinants of web spider species diversity: Vegetation structural diversity vs. prey availability. Oecologia 1984, 62, 299–304. [Google Scholar] [CrossRef] [PubMed]
- Docherty, M.; Leather, S.R. Structure and abundance of arachnid communities in Scots and lodgepole pine plantations. For. Ecol. Manag. 1997, 95, 197–207. [Google Scholar] [CrossRef]
- Evers, J. Stoffhaushalt und Waldbautechnik bei Erstaufforstungen ehemals landwirtschaftlicher Nutzflächen. Landesanst. Ökologie Bodenordn. For. Nordrh.-Westfal. 2001, 19, 1–241. [Google Scholar]
- Groner, E.; Ayal, Y. The interaction between bird predation and plant cover in determining habitat occupancy of darkling beetles. Oikos 2001, 93, 22–31. [Google Scholar] [CrossRef]
- Lundholm, J.; MacIvor, J.S.; MacDougall, Z.; Ranalli, M. Plant species and functional group combinations affect green roof ecosystem functions. PLoS ONE 2010, 5, e9677. [Google Scholar] [CrossRef] [PubMed]


| Species | Family |
|---|---|
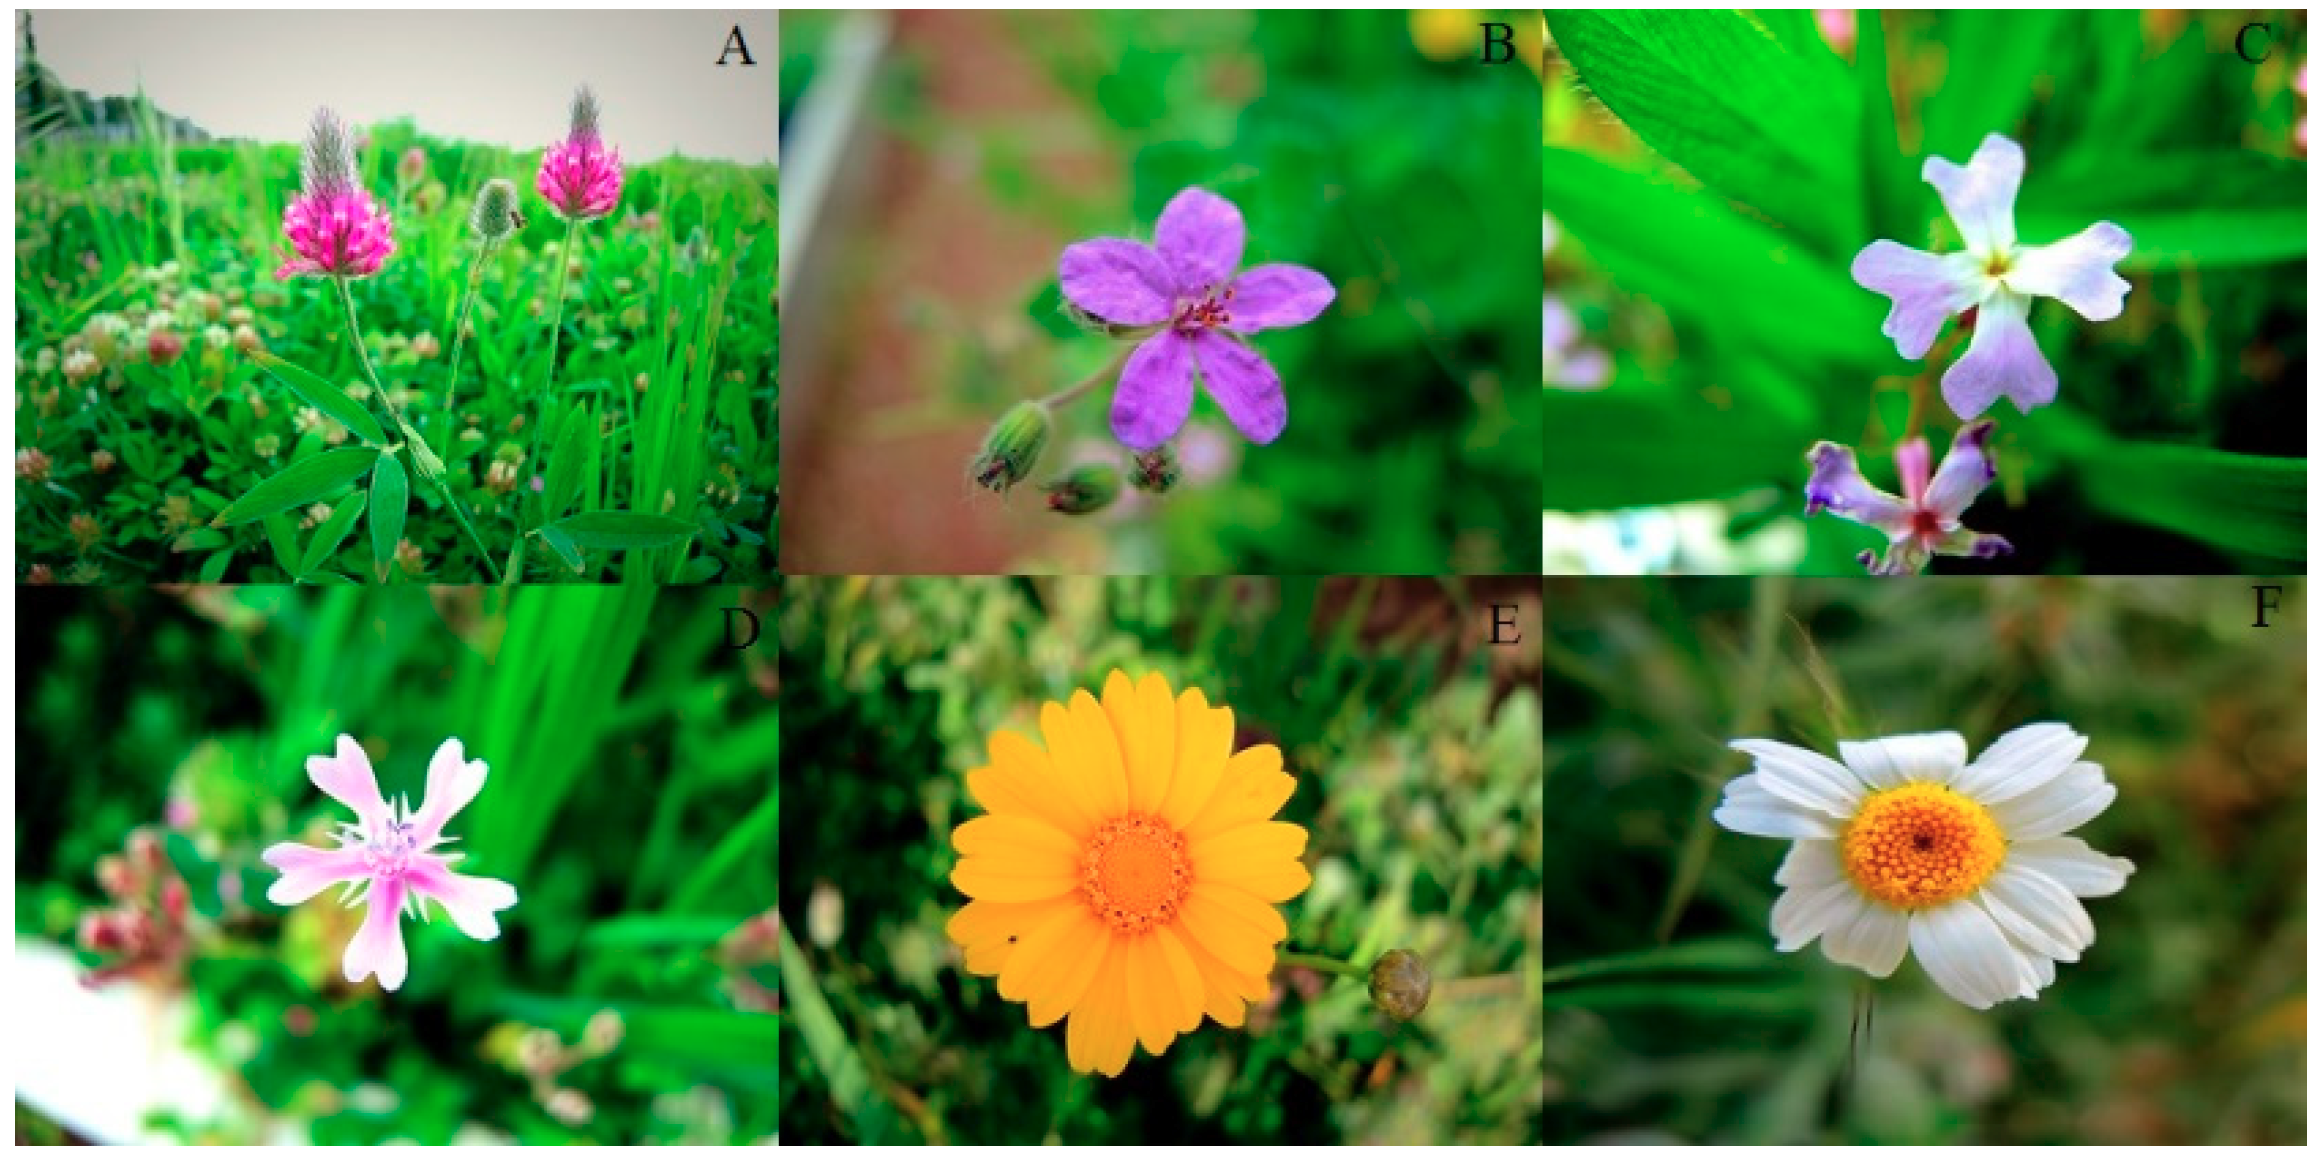
| Trifolium purpureum Loisel. | Papilionaceae |
| Erodium malacoides (L.) L’Her. | Geraniaceae |
| Ricotia lunaria (L.) DC. | Cruciferae |
| Silene aegyptiaca (L.) L. f. | Caryophyllaceae |
| Chrysanthemum coronarium (L.) NN Tzvel. | Compositae |
| Anthemis pseudocotula Boiss. | Compositae |
| Stipa capensis Thunb. | Gramineae |
| Trifolium stellatum L. | Papilionaceae |
| Triticum dicoccoides (Koern. Ex Asch. & Graebn.) Schweinf. | Gramineae |
| Malva parviflora L. | Malvaceae |
| Hordeum glaucum Steud. | Gramineae |
| Avena sterilis L. | Gramineae |
| Hordeum geniculatum All. | Gramineae |
| Sedum sediforme (Jacq.) Pau | Crassulaceae |
| Substrate Temperature (°C) | Vegetation Cover (%) | Substrate Moisture (%) | ||||||||||
|---|---|---|---|---|---|---|---|---|---|---|---|---|
| Min | Max | Median | SV | Min | Max | Median | SV | Min | Max | Median | SV | |
| All | 13.30 | 29.10 | 18.30 | 4.80 | 0.00 | 87.96 | 14.39 | 28.35 | −9.50 | 62.40 | 2.00 | 20.71 |
| AC | 13.9 | 27.7 | 5.03 | 4.85 | 6.59 | 81.06 | 13.95 | 31.50 | −9.1 | 39.5 | −0.20 | 16.50 |
| AE | 13.7 | 28 | 4.88 | 4.82 | 0 | 87.96 | 14.49 | 34.16 | −5.3 | 50 | 1.10 | 19.60 |
| AU | 13.8 | 27.9 | 5.17 | 4.60 | 5.95 | 83.39 | 14.49 | 32.15 | −6.9 | 56.5 | 2.80 | 20.75 |
| EC | 13.3 | 29.1 | 4.98 | 4.64 | 1.55 | 49.8 | 14.28 | 13.79 | −9.5 | 56.2 | 2.70 | 20.81 |
| EE | 16.5 | 29 | 4.41 | 4.58 | 0.01 | 7.4 | 14.39 | 2.23 | −7.4 | 62.4 | 2.75 | 26.69 |
| EU | 14.6 | 28 | 4.74 | 4.78 | 4.47 | 52.97 | 14.39 | 13.62 | −9.5 | 42.9 | 0.95 | 19.63 |
| A: blooming period | 13.30 | 22.20 | 16.20 | 1.88 | 1.97 | 87.96 | 44.45 | 29.86 | −5.30 | 62.40 | 23.85 | 18.72 |
| A: withered period | 17.10 | 29.10 | 23.35 | 4.38 | 0.00 | 23.35 | 7.17 | 7.34 | −9.50 | 7.90 | −4.35 | 3.86 |
| df | Sum sq. | Mean sq. | F-Value | Pr (>F) | |
|---|---|---|---|---|---|
| Arthropod abundance | |||||
| Period | 1 | 34,206 | 34,206 | 22.964 | <0.0001 |
| Treatment | 5 | 10,129 | 2026 | 1.360 | 0.245 |
| Period: Treatment | 5 | 29,992 | 5998 | 4.027 | 0.002 |
| Residuals | 108 | 160,868 | 1490 | ||
| Species richness | |||||
| Period | 1 | 580.8 | 580.8 | 77.211 | <0.00 |
| Treatment | 5 | 1136.5 | 227.3 | 30.217 | < 000 |
| Period: Treatment | 5 | 324.8 | 65.0 | 8.636 | <0.001 |
| Residuals | 108 | 812.4 | 7.5 |
| Annuals Blooming-Withered Period | ||||
|---|---|---|---|---|
| diff | Lower | Upper | p adj | |
| Arthropod abundance | −33.766 | −47.733 | −19.799 | <0.0001 |
| Species richness | −4.4 | −5.392 | −3.407 | 0 |
| Treatments | diff | lwr | upr | p adj |
|---|---|---|---|---|
| EE-AC | −8.50 | −11.02 | −5.98 | 0.00 ** |
| EE-AE | −7.25 | −9.77 | −4.73 | 0.00 ** |
| EE-AU | −8.95 | −11.47 | −6.43 | 0.00 ** |
| EU-EE | 5.35 | 2.83 | 7.87 | 0.00 ** |
| EC-AU | −5.10 | −7.62 | −2.58 | 0.00 ** |
| EC-AC | −4.65 | −7.17 | −2.13 | 0.00 ** |
| EE-EC | −3.85 | −6.37 | −1.33 | 0.00 ** |
| EU-AU | −3.60 | −6.12 | −1.08 | 0.00 ** |
| EC-AE | −3.40 | −5.92 | −0.88 | 0.00 ** |
| EU-AC | −3.15 | −5.67 | −0.63 | 0.01 ** |
| EU-AE | −1.90 | −4.42 | 0.62 | 0.25 |
| AU-AE | 1.70 | −0.82 | 4.22 | 0.37 |
| EU-EC | 1.50 | −1.02 | 4.02 | 0.52 |
| AE-AC | −1.25 | −3.77 | 1.27 | 0.70 |
| AU-AC | 0.45 | −2.07 | 2.97 | 1.00 |
© 2018 by the authors. Licensee MDPI, Basel, Switzerland. This article is an open access article distributed under the terms and conditions of the Creative Commons Attribution (CC BY) license (http://creativecommons.org/licenses/by/4.0/).
Share and Cite
Salman, I.N.A.; Blaustein, L. Vegetation Cover Drives Arthropod Communities in Mediterranean/Subtropical Green Roof Habitats. Sustainability 2018, 10, 4209. https://doi.org/10.3390/su10114209
Salman INA, Blaustein L. Vegetation Cover Drives Arthropod Communities in Mediterranean/Subtropical Green Roof Habitats. Sustainability. 2018; 10(11):4209. https://doi.org/10.3390/su10114209
Chicago/Turabian StyleSalman, Ibrahim N. A., and Leon Blaustein. 2018. "Vegetation Cover Drives Arthropod Communities in Mediterranean/Subtropical Green Roof Habitats" Sustainability 10, no. 11: 4209. https://doi.org/10.3390/su10114209
APA StyleSalman, I. N. A., & Blaustein, L. (2018). Vegetation Cover Drives Arthropod Communities in Mediterranean/Subtropical Green Roof Habitats. Sustainability, 10(11), 4209. https://doi.org/10.3390/su10114209