Critical Barriers to Implementation of Reverse Logistics in the Manufacturing Industry: A Case Study of a Developing Country


Abstract
:1. Introduction
2. Literature Review
2.1. Reverse Logistics and Pakistani Context
2.2. Manufacturing Industry in Pakistan
2.3. Barriers to RL
2.4. Structural Equation Modeling and Delphi Method in Supply Chain Management
2.5. Research Gap
- Lack of qualitative and quantitate studies focusing on identification and verification of RL barriers in developing countries
- The need to address the research gap on developing RL infrastructure in the Pakistani context due to the following factors: implementation of the new environmental policy (National Policy on Solid Waste Management 2016), green marketing, social issues, economic issues, environmental standards, and new rules of Pakistan Environmental Protection Agency (PAK-EPA). On the other hand, deficiencies in logistics infrastructure is a big challenge for Pakistani manufacturing companies.
- More specifically, companies perceive RL as an unexplored part of supply chain management and one of the most difficult and significant initiatives to implement in the green supply chain management field.
- There is wide applicability of SEM and DM in the supply chain management field. According to previous literature review, several studies have focused on exploring the barriers in developed countries and supplier selection. To the best of our knowledge, no one has used the combined methodologies of SEM and DM for RL barriers analysis.
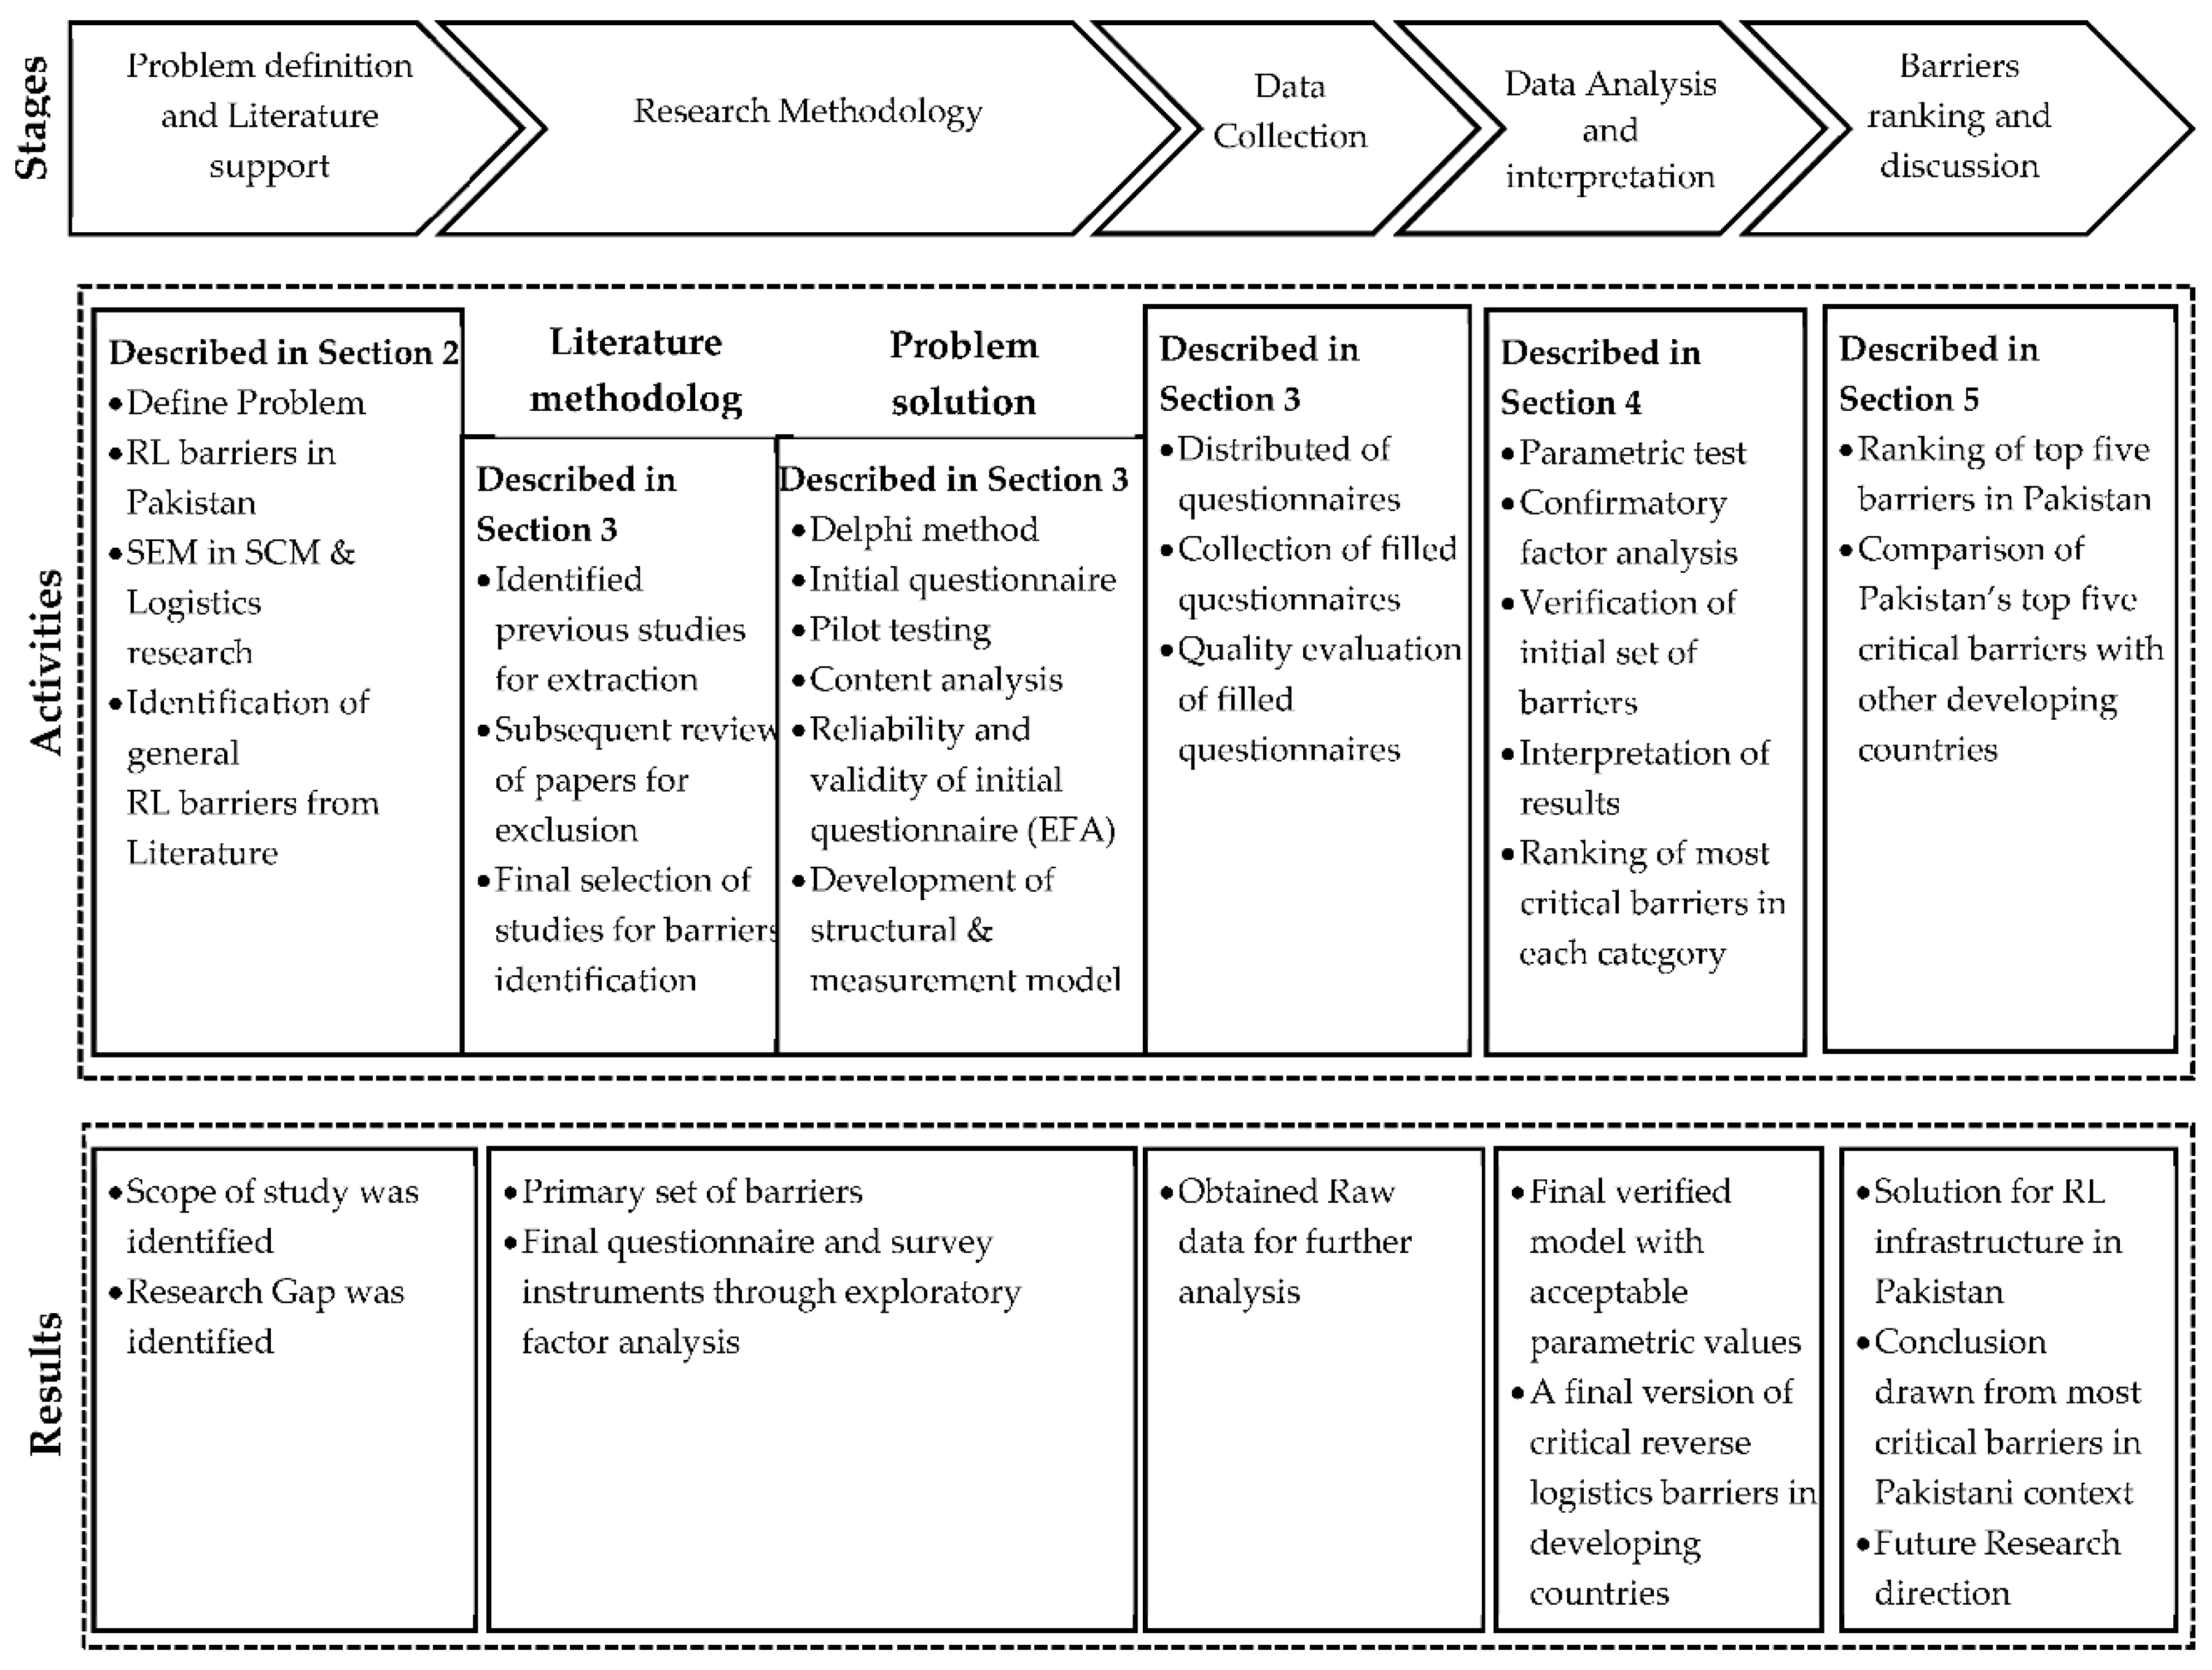
3. Research Methodology
3.1. Problem Description
3.2. Barrier Identification
- Financial and economic-related barriers (FERB): this category offers information about financial and economic-related barriers; for example, those related to investments, loans, adaptation costs and return and funding, among others.
- Knowledge and experience-related barriers (KERB): this group contains information about barriers related to professional skills, training, and experience of employees; responsibilities of professionals, and RL awareness among companies.
- Law and regulation-related barriers (LRRB): this category includes the barriers related to laws and regulations concerning the reverse flow of products, political commitment, and government policies.
- Management-related barriers (MRB): in this category, barriers related to management, such as the manager’s importance to RL is compared with other organizational issues and top management commitment to RL logistics activities.
- Infrastructure and technology-related barriers (ITRB): this category includes issues related to infrastructure and technology, such as lack of logistics infrastructure, issues related to lack of technical human skill and lack of technology, and information system for the improvement of RL within the country.
- Environment-related barriers (ERB): this category refers to issues related to environmental protection and sustainable development within the country.
- Market-related barriers (MB): this category deal with barriers related to market competition and uncertainty, undeveloped recovery marketplaces, and lack of community pressure on manufacturers to protect the environment.
- Policy-related barriers (PRB): this category contains information about barriers that are related to policies, such as lack of corporate, social and ethical responsibilities; lack of clarity regarding sustainability, and company policies against RL.
3.3. Literature Review Methodology (Steps 1 and 2)
3.4. Developing the Survey Questionnaire
- Q1.
- Which barriers would need to be resolved on priority in order to implement RL in your industry?
- Q2.
- Follow up questions were asked about the addition and deletion of selected barriers.
- Q3.
- Please highlight barriers faced by your company that are not in the list.
(Average percentage response rate expected)]
- (1)
- The company should be operating in Pakistan.
- (2)
- The company should be large, facing the described barriers, and have available resources.
- (3)
- An RL program should be implemented or available for implementation within the company.
- (4)
- The company should agree to participate in this research and answer all the questions in the questionnaire.
4. Results
5. Discussions
Comparison of Findings with Brazil, China, and India
6. Conclusions
7. Practical Implications and Future Research Direction
Author Contributions
Funding
Conflicts of Interest
References
- Van Wassenhove, L.N.; Besiou, M. Complex problems with multiple stakeholders: How to bridge the gap between reality and OR/MS? J. Bus. Econ. 2013, 83, 87–97. [Google Scholar] [CrossRef]
- Tseng, S.-C.; Hung, S.-W. A strategic decision-making model considering the social costs of carbon dioxide emissions for sustainable supply chain management. J. Environ. Manag. 2014, 133, 315–322. [Google Scholar] [CrossRef] [PubMed]
- Ravi, V.; Shankar, R. Analysis of interactions among the barriers of reverse logistics. Technol. Forecast. Soc. Chang. 2005, 72, 1011–1029. [Google Scholar] [CrossRef]
- Fleischmann, M.; Krikke, H.R.; Dekker, R.; Flapper, S.D.P. A characterisation of logistics networks for product recovery. Omega 2000, 28, 653–666. [Google Scholar] [CrossRef]
- Nikolaou, I.E.; Evangelinos, K.I.; Allan, S. A reverse logistics social responsibility evaluation framework based on the triple bottom line approach. J. Clean. Prod. 2013, 56, 173–184. [Google Scholar] [CrossRef]
- Flapper, S.; Gayon, J.-P.; Vercraene, S. Control of a production–inventory system with returns under imperfect advance return information. Eur. J. Oper. Res. 2012, 218, 392–400. [Google Scholar] [CrossRef] [Green Version]
- Rubio, S.; Chamorro, A.; Miranda, F.J. Characteristics of the research on reverse logistics (1995–2005). Int. J. Prod. Res. 2008, 46, 1099–1120. [Google Scholar] [CrossRef] [Green Version]
- Bouzon, M.; Govindan, K.; Rodriguez, C.M.T.; Campos, L.M. Identification and analysis of reverse logistics barriers using fuzzy Delphi method and AHP. Resour. Conserv. Recycl. 2016, 108, 182–197. [Google Scholar] [CrossRef]
- Rogers, D.T.-L.; Tibben-Lembke, R. RS Going Backwards: Reverse Logistics Trends and Practices. Reverse Logistics Executive Council; University of Nevada, Reno, Center for Logistics Management: Reno, Nevada, 1998. [Google Scholar]
- Sharma, S.; Panda, B.; Mahapatra, S.; Sahu, S. Analysis of barriers for reverse logistics: An Indian perspective. Int. J. Model. Optim. 2011, 1, 101. [Google Scholar] [CrossRef]
- Ilgin, M.A.; Gupta, S.M. Environmentally conscious manufacturing and product recovery (ECMPRO): A review of the state of the art. J. Environ. Manag. 2010, 91, 563–591. [Google Scholar] [CrossRef] [PubMed]
- Govindan, K.; Palaniappan, M.; Zhu, Q.; Kannan, D. Analysis of third party reverse logistics provider using interpretive structural modeling. Int. J. Prod. Econ. 2012, 140, 204–211. [Google Scholar] [CrossRef]
- Chan, F.T.; Kai Chan, H. A survey on reverse logistics system of mobile phone industry in Hong Kong. Manag. Decis. 2008, 46, 702–708. [Google Scholar] [CrossRef]
- Govindan, K.; Soleimani, H. A review of reverse logistics and closed-loop supply chains: A Journal of Cleaner Production focus. J. Clean. Prod. 2017, 142, 371–384. [Google Scholar] [CrossRef]
- BDA. The Full Cost of Landfill Disposal in Australia; Department of the Environment, Water, Heritage and the Arts: Canberra, Australia, 2009.
- Guide, V.D.R.; Wassenhove, L.N. Business Aspects of Closed-Loop Supply Chains; Carnegie Mellon University Press: Pittsburgh, PA, USA, 2003; Volume 2. [Google Scholar]
- Gunasekaran, A.; Spalanzani, A. Sustainability of manufacturing and services: Investigations for research and applications. Int. J. Prod. Econ. 2012, 140, 35–47. [Google Scholar] [CrossRef]
- Prakash, C.; Barua, M. Integration of AHP-TOPSIS method for prioritizing the solutions of reverse logistics adoption to overcome its barriers under fuzzy environment. J. Manuf. Syst. 2015, 37, 599–615. [Google Scholar] [CrossRef]
- Tsai, W.-H.; Chou, W.-C.; Hsu, W. The sustainability balanced scorecard as a framework for selecting socially responsible investment: An effective MCDM model. J. Oper. Res. Soc. 2009, 60, 1396–1410. [Google Scholar] [CrossRef]
- Gunasekaran, A.; Ngai, E.W. The future of operations management: An outlook and analysis. Int. J. Prod. Econ. 2012, 135, 687–701. [Google Scholar] [CrossRef]
- Jindal, A.; Sangwan, K.S. Development of an interpretive structural model of barriers to reverse logistics implementation in Indian industry. In Glocalized Solutions for Sustainability in Manufacturing; Springer: Berlin/Heidelberg, Germany, 2011; pp. 448–453. [Google Scholar]
- Guide, V.D.R., Jr.; Van Wassenhove, L.N. OR FORUM—The evolution of closed-loop supply chain research. Oper. Res. 2009, 57, 10–18. [Google Scholar] [CrossRef]
- Miao, Z.; Cai, S.; Xu, D. Exploring the antecedents of logistics social responsibility: A focus on Chinese firms. Int. J. Prod. Econ. 2012, 140, 18–27. [Google Scholar] [CrossRef]
- Shaik, M.N.; Abdul-Kader, W. Comprehensive performance measurement and causal-effect decision making model for reverse logistics enterprise. Comput. Ind. Eng. 2014, 68, 87–103. [Google Scholar] [CrossRef]
- Alfonso-Lizarazo, E.H.; Montoya-Torres, J.R.; Gutiérrez-Franco, E. Modeling reverse logistics process in the agro-industrial sector: The case of the palm oil supply chain. Appl. Math. Model. 2013, 37, 9652–9664. [Google Scholar] [CrossRef]
- Hung Lau, K.; Wang, Y. Reverse logistics in the electronic industry of China: A case study. Supply Chain Manag. Int. J. 2009, 14, 447–465. [Google Scholar] [CrossRef]
- Zhu, Q.; Geng, Y. Drivers and barriers of extended supply chain practices for energy saving and emission reduction among Chinese manufacturers. J. Clean. Prod. 2013, 40, 6–12. [Google Scholar] [CrossRef]
- Abdulrahman, M.D.; Gunasekaran, A.; Subramanian, N. Critical barriers in implementing reverse logistics in the Chinese manufacturing sectors. Int. J. Prod. Econ. 2014, 147, 460–471. [Google Scholar] [CrossRef] [Green Version]
- US CIA. The World Factbook. Available online: https://www.cia.gov/library/publications/resources/the-world-factbook/geos/pk.html (accessed on 25 March 2018).
- Zahidi, F. Solid Waste Management in Pakistan. ALJAZEERA News, 17 February 2016. [Google Scholar]
- Puertas, R.; Martí, L.; García, L. Logistics performance and export competitiveness: European experience. Empirica 2014, 41, 467–480. [Google Scholar] [CrossRef]
- Arkader, R.; Ferreira, C.F. Category management initiatives from the retailer perspective: A study in the Brazilian grocery retail industry. J. Purch. Supply Manag. 2004, 10, 41–51. [Google Scholar] [CrossRef]
- De Sousa Jabbour, A.B.L.; Jabbour, C.J.C.; Govindan, K.; Kannan, D.; Salgado, M.H.; Zanon, C.J. Factors affecting the adoption of green supply chain management practices in Brazil: Empirical evidence. Int. J. Environ. Stud. 2013, 70, 302–315. [Google Scholar] [CrossRef]
- Stock, J.R. Reverse Logistics: White Paper; Council of Logistics Management: Oak Brook, IL, USA, 1992. [Google Scholar]
- De Sousa Jabbour, A.B.L.; Jabbour, C.J.C.; Sarkis, J.; Govindan, K. Brazil’s new national policy on solid waste: Challenges and opportunities. Clean Technol. Environ. Policy 2014, 16, 7–9. [Google Scholar] [CrossRef]
- Haq, R. Pakistan is the World’s Fastest Growing Steel Producer. Available online: http://www.pakalumni.com/profiles/blogs/pakistan-is-the-world-s-fastest-growing-steel-producer (accessed on 7 April 2018).
- Mubashir, A.A. Plastics Industry. Available online: http://www.pitad.org.pk/Publications/29-Pakistan%20Trade%20Liberalization%20Sectoral%20Study%20on%20Plastic%20Industry.pdf (accessed on 7 April 2018).
- Automotive Industry Portal MarkLines. Pakistan—Flash Report, Sales Volume. Available online: https://www.marklines.com/en/statistics/flash_sales/salesfig_pakistan_2018 (accessed on 7 April 2018).
- Walker, H.; Di Sisto, L.; McBain, D. Drivers and barriers to environmental supply chain management practices: Lessons from the public and private sectors. J. Purch. Supply Manag. 2007, 14, 69–85. [Google Scholar] [CrossRef]
- Meehan, J.; Muir, L. SCM in Merseyside SMEs: Benefits and barriers. TQM J. 2008, 20, 223–232. [Google Scholar] [CrossRef]
- Dashore, K.; Sohani, N. Green supply chain management: A hierarchical framework for barriers. J. Sustain. Dev. 2008, 5, 2011. [Google Scholar]
- Manzouri, M.; Rahman, M.N.A.; Arshad, H.; Ismail, A.R. Barriers of supply chain management implementation in manufacturing companies: A comparison between Iranian and Malaysian companies. J. Chin. Inst. Ind. Eng. 2010, 27, 456–472. [Google Scholar] [CrossRef]
- Mudgal, R.K.; Shankar, R.; Talib, P.; Raj, T. Modelling the barriers of green supply chain practices: An Indian perspective. Int. J. Logist. Syst. Manag. 2010, 7, 81–107. [Google Scholar] [CrossRef]
- Giunipero, L.C.; Hooker, R.E.; Denslow, D. Purchasing and supply management sustainability: Drivers and barriers. J. Purch. Supply Manag. 2012, 18, 258–269. [Google Scholar] [CrossRef]
- Al Zaabi, S.; Al Dhaheri, N.; Diabat, A. Analysis of interaction between the barriers for the implementation of sustainable supply chain management. Int. J. Adv. Manuf. Technol. 2013, 68, 895–905. [Google Scholar] [CrossRef]
- Govindan, K.; Kaliyan, M.; Kannan, D.; Haq, A.N. Barriers analysis for green supply chain management implementation in Indian industries using analytic hierarchy process. Int. J. Prod. Econ. 2014, 147, 555–568. [Google Scholar] [CrossRef]
- Jayant, A.; Azhar, M. Analysis of the barriers for implementing green supply chain management (GSCM) practices: An interpretive structural modeling (ISM) Approach. Procedia Eng. 2014, 97, 2157–2166. [Google Scholar] [CrossRef]
- Chileshe, N.; Rameezdeen, R.; Hosseini, M.R.; Lehmann, S. Barriers to implementing reverse logistics in South Australian construction organisations. Supply Chain Manag. Int. J. 2015, 20, 179–204. [Google Scholar] [CrossRef]
- Shaharudin, M.R.; Zailani, S.; Tan, K.C. Barriers to product returns and recovery management in a developing country: Investigation using multiple methods. J. Clean. Prod. 2015, 96, 220–232. [Google Scholar] [CrossRef]
- Wang, Z.; Mathiyazhagan, K.; Xu, L.; Diabat, A. A decision making trial and evaluation laboratory approach to analyze the barriers to Green Supply Chain Management adoption in a food packaging company. J. Clean. Prod. 2016, 117, 19–28. [Google Scholar] [CrossRef]
- Bouzon, M.; Govindan, K.; Rodriguez, C.M.T. Evaluating barriers for reverse logistics implementation under a multiple stakeholders’ perspective analysis using grey decision making approach. Resour. Conserv. Recycl. 2018, 128, 315–335. [Google Scholar] [CrossRef]
- Byrne, B.M. Structural equation modeling: Perspectives on the present and the future. Int. J. Test. 2001, 1, 327–334. [Google Scholar]
- Baumgartner, H.; Homburg, C. Applications of structural equation modeling in marketing and consumer research: A review. Int. J. Res. Mark. 1996, 13, 139–161. [Google Scholar] [CrossRef]
- Fornell, C.; Larcker, D.F. Evaluating structural equation models with unobservable variables and measurement error. J. Mark. Res. 1981, 39–50. [Google Scholar] [CrossRef]
- Garver, M.S.; Mentzer, J.T. Logistics research methods: Employing structural equation modeling to test for construct validity. J. Bus. Logist. 1999, 20, 33. [Google Scholar]
- Wisner, J.D. A structural equation model of supply chain management strategies and firm performance. J. Bus. Logist. 2003, 24, 1–26. [Google Scholar] [CrossRef]
- Blunch, N. Introduction to Structural Equation Modeling Using IBM SPSS Statistics and AMOS; Sage: Thousand Oaks, CA, USA, 2012. [Google Scholar]
- Auramo, J.; Aminoff, A.; Punakivi, M. Research agenda for e-business logistics based on professional opinions. Int. J. Phys. Distrib. Logist. Manag. 2002, 32, 513–531. [Google Scholar] [CrossRef]
- Akkermans, H.A.; Bogerd, P.; Yücesan, E.; Van Wassenhove, L.N. The impact of ERP on supply chain management: Exploratory findings from a European Delphi study. Eur. J. Oper. Res. 2003, 146, 284–301. [Google Scholar] [CrossRef] [Green Version]
- Ogden, J.A.; Petersen, K.J.; Carter, J.R.; Monczka, R.M. Supply management strategies for the future: A Delphi study. J. Supply Chain Manag. 2005, 41, 29–48. [Google Scholar] [CrossRef]
- Seuring, S.; Müller, M. Core issues in sustainable supply chain management—A Delphi study. Bus. Strategy Environ. 2008, 17, 455–466. [Google Scholar] [CrossRef]
- Lee, A.H.; Kang, H.-Y.; Hsu, C.-F.; Hung, H.-C. A green supplier selection model for high-tech industry. Expert Syst. Appl. 2009, 36, 7917–7927. [Google Scholar] [CrossRef]
- Heiko, A.; Darkow, I.-L. Scenarios for the logistics services industry: A Delphi-based analysis for 2025. Int. J. Prod. Econ. 2010, 127, 46–59. [Google Scholar]
- Jayaram, J.; Avittathur, B. Green supply chains: A perspective from an emerging economy. Int. J. Prod. Econ. 2015, 164, 234–244. [Google Scholar] [CrossRef]
- Rao, P.; Holt, D. Do green supply chains lead to competitiveness and economic performance? Int. J. Oper. Prod. Manag. 2005, 25, 898–916. [Google Scholar] [CrossRef]
- Min, S.; Mentzer, J.T.; Ladd, R.T. A market orientation in supply chain management. J. Acad. Mark. Sci. 2007, 35, 507. [Google Scholar] [CrossRef]
- Juga, J.; Juntunen, J.; Grant, D.B. Service quality and its relation to satisfaction and loyalty in logistics outsourcing relationships. Manag. Serv. Qual. Int. J. 2010, 20, 496–510. [Google Scholar] [CrossRef]
- Jun, M.; Shengrong, L. Evaluation on virtual Logistics enterprises competitiveness based on SEM. In Proceedings of the 2011 International Conference on Management Science and Industrial Engineering (MSIE), Harbin, China, 8–11 January 2011; pp. 902–904. [Google Scholar]
- Hazen, B.T.; Wu, Y.; Cegielski, C.G.; Jones-Farmer, L.A.; Hall, D.J. Consumer reactions to the adoption of green reverse logistics. Int. Rev. Retail Distrib. Consum. Res. 2012, 22, 417–434. [Google Scholar] [CrossRef]
- Lin, R.-J.; Sheu, C. Why do firms adopt/implement green practices?—An institutional theory perspective. Procedia-Soc. Behav. Sci. 2012, 57, 533–540. [Google Scholar] [CrossRef]
- Kye, D.; Lee, J.; Lee, K.-D. The perceived impact of packaging logistics on the efficiency of freight transportation (EOT). Int. J. Phys. Distrib. Logist. Manag. 2013, 43, 707–720. [Google Scholar] [CrossRef]
- Chin, T.A.; Tat, H.H.; Sulaiman, Z. Green supply chain management, environmental collaboration and sustainability performance. Procedia CIRP 2015, 26, 695–699. [Google Scholar] [CrossRef]
- Kohn, J.W.; McGinnis, M.A.; Kara, A. A structural equation model assessment of logistics strategy. Int. J. Logist. Manag. 2011, 22, 284–305. [Google Scholar] [CrossRef]
- Tian, Y.; Ellinger, A.E.; Chen, H. Third-party logistics provider customer orientation and customer firm logistics improvement in China. Int. J. Phys. Distrib. Logist. Manag. 2010, 40, 356–376. [Google Scholar] [CrossRef]
- MacCarthy, B.L.; Atthirawong, W. Factors affecting location decisions in international operations—A Delphi study. Int. J. Oper. Prod. Manag. 2003, 23, 794–818. [Google Scholar] [CrossRef]
- Huscroft, J.R.; Hazen, B.T.; Hall, D.J.; Skipper, J.B.; Hanna, J.B. Reverse logistics: Past research, current management issues, and future directions. Int. J. Logist. Manag. 2013, 24, 304–327. [Google Scholar] [CrossRef]
- Kumar, V.; Holt, D.; Ghobadian, A.; Garza-Reyes, J. Developing green supply chain management taxonomy-based decision support system. Int. J. Prod. Res. 2015, 53, 6372–6389. [Google Scholar] [CrossRef]
- Chiou, T.-Y.; Chan, H.K.; Lettice, F.; Chung, S.H. The influence of greening the suppliers and green innovation on environmental performance and competitive advantage in Taiwan. Transp. Res. Part E Logist. Transp. Rev. 2011, 47, 822–836. [Google Scholar] [CrossRef]
- Kumar, S.; Putnam, V. Cradle to cradle: Reverse logistics strategies and opportunities across three industry sectors. Int. J. Prod. Econ. 2008, 115, 305–315. [Google Scholar] [CrossRef]
- El-Nakib, I. Reverse logistics: A comparison of electronic waste recycling between Switzerland and Egypt. In Proceedings of the Global Conference on Operations and Supply Chain Management—GCOM, Bandung, Indonesia, 12–13 March 2012. [Google Scholar]
- Carter, C.R.; Ellram, L.M. Reverse logistics: A review of the literature and framework for future investigation. J. Bus. Logist. 1998, 19, 85. [Google Scholar]
- Chkanikova, O.; Mont, O. Corporate supply chain responsibility: Drivers and barriers for sustainable food retailing. Corp. Soc. Responsib. Environ. Manag. 2015, 22, 65–82. [Google Scholar] [CrossRef]
- Fawcett, S.E.; Magnan, G.M.; McCarter, M.W. Benefits, barriers, and bridges to effective supply chain management. Supply Chain Manag. Int. J. 2008, 13, 35–48. [Google Scholar] [CrossRef]
- González-Torre, P.; Alvarez, M.; Sarkis, J.; Adenso-Díaz, B. Barriers to the implementation of environmentally oriented reverse logistics: Evidence from the automotive industry sector. Br. J. Manag. 2010, 21, 889–904. [Google Scholar] [CrossRef]
- Tan, A.; Hosie, P. Reverse logistics operations in Singapore to support Asia Pacific regions. Int. J. Electron. Cust. Relatsh. Manag. 2010, 4, 196–208. [Google Scholar] [CrossRef]
- Prakash, C.; Barua, M.K.; Pandya, K.V. Barriers analysis for reverse logistics implementation in Indian electronics industry using fuzzy analytic hierarchy process. Procedia-Soc. Behav. Sci. 2015, 189, 91–102. [Google Scholar] [CrossRef]
- Balasubramanian, S. A hierarchical framework of barriers to green supply chain management in the construction sector. J. Sustain. Dev. 2012, 5, 15. [Google Scholar] [CrossRef]
- Bag, S.; Anand, N. Modelling barriers of sustainable supply chain network design using interpretive structural modelling: An insight from food processing sector in India. Int. J. Autom. Logist. 2015, 1, 234–255. [Google Scholar] [CrossRef]
- Revell, A.; Rutherfoord, R. UK environmental policy and the small firm: Broadening the focus. Bus. Strategy Environ. 2003, 12, 26. [Google Scholar] [CrossRef]
- Sharma, B.; Singh, M.; Neha. Modeling the knowledge sharing barriers using an ISM approach. In Proceedings of the International Conference on Information and Knowledge Management, Maui, HI, USA, 29 October–2 November 2012; pp. 233–238. [Google Scholar]
- Ngai, E.; Lai, K.-H.; Cheng, T. Logistics information systems: The Hong Kong experience. Int. J. Prod. Econ. 2008, 113, 223–234. [Google Scholar] [CrossRef]
- Yusuf, I.; Raouf, A. Reverse logistics: An empirical study for operational framework. Proc. Pakistan Acad. Sci. 2013, 50, 201–210. [Google Scholar]
- Zhu, Q.; Sarkis, J.; Cordeiro, J.J.; Lai, K.-H. Firm-level correlates of emergent green supply chain management practices in the Chinese context. Omega 2008, 36, 577–591. [Google Scholar] [CrossRef]
- Ojha, D.; Gianiodis, P.T.; Manuj, I. Impact of logistical business continuity planning on operational capabilities and financial performance. Int. J. Logist. Manag. 2013, 24, 180–209. [Google Scholar] [CrossRef]
- Andiç, E.; Yurt, Ö.; Baltacıoğlu, T. Green supply chains: Efforts and potential applications for the Turkish market. Resour. Conserv. Recycl. 2012, 58, 50–68. [Google Scholar] [CrossRef]
- Wooi, G.C.; Zailani, S. Green supply chain initiatives: Investigation on the barriers in the context of SMEs in Malaysia. Int. Bus. Manag. 2010, 4, 20–27. [Google Scholar]
- Gorane, S.; Kant, R. Modelling the SCM implementation barriers: An integrated ISM-fuzzy MICMAC approach. J. Model. Manag. 2015, 10, 158–178. [Google Scholar] [CrossRef]
- Archer, N.; Wang, S.; Kang, C. Barriers to the adoption of online supply chain solutions in small and medium enterprises. Supply Chain Manag. Int. J. 2008, 13, 73–82. [Google Scholar] [CrossRef]
- Ou, C.S.; Liu, F.C.; Hung, Y.C.; Yen, D.C. A structural model of supply chain management on firm performance. Int. J. Oper. Prod. Manag. 2010, 30, 526–545. [Google Scholar] [CrossRef]
- Wilson, S.; Platts, K. How do companies achieve mix flexibility? Int. J. Oper. Prod. Manag. 2010, 30, 978–1003. [Google Scholar] [CrossRef]
- Vinodh, S.; Kuttalingam, D. Computer-aided design and engineering as enablers of agile manufacturing: A case study in an Indian manufacturing organization. J. Manuf. Technol. Manag. 2011, 22, 405–418. [Google Scholar] [CrossRef]
- Starostka-Patyk, M.; Zawada, M.; Pabian, A.; Abed, M. Barriers to reverse logistics implementation in enterprises. In Proceedings of the 2013 International Conference on Advanced Logistics and Transport (ICALT), Sousse, Tunisia, 29–31 May 2013; pp. 506–511. [Google Scholar]
- Muduli, K.; Govindan, K.; Barve, A.; Geng, Y. Barriers to green supply chain management in Indian mining industries: A graph theoretic approach. J. Clean. Prod. 2013, 47, 335–344. [Google Scholar] [CrossRef]
- Yu, L. Logistics barriers to international operations: A case study of Japanese firm in China. In Proceedings of the International Conference on Economics and Finance Research IPEDR, Singapore, 26–28 February 2011. [Google Scholar]
- Perron, G.M. Barriers to Environmental Performance Improvements in Canadian SMEs; Dalhousie University: Halifax, NS, Canada, 2005. [Google Scholar]
- Luthra, S.; Kumar, S.; Garg, D.; Haleem, A. Barriers to renewable/sustainable energy technologies adoption: Indian perspective. Renew. Sustain. Energy Rev. 2015, 41, 762–776. [Google Scholar] [CrossRef]
- Liu, X.; Yang, J.; Qu, S.; Wang, L.; Shishime, T.; Bao, C. Sustainable production: Practices and determinant factors of green supply chain management of Chinese companies. Bus. Strategy Environ. 2012, 21, 1–16. [Google Scholar] [CrossRef]
- Singh, M.; Kant, R. Knowledge management barriers: An interpretive structural modeling approach. Int. J. Manag. Sci. Eng. Manag. 2008, 3, 141–150. [Google Scholar] [CrossRef]
- Asad Sadi, M.; Al-Dubaisi, A.H. Barriers to organizational creativity: The marketing executives’ perspective in Saudi Arabia. J. Manag. Dev. 2008, 27, 574–599. [Google Scholar] [CrossRef]
- Janse, B.; Schuur, P.; de Brito, M.P. A reverse logistics diagnostic tool: The case of the consumer electronics industry. Int. J. Adv. Manuf. Technol. 2010, 47, 495–513. [Google Scholar] [CrossRef]
- Subrahmanya Bhat, K.; Rajashekhar, J. An empirical study of barriers to TQM implementation in Indian industries. TQM J. 2009, 21, 261–272. [Google Scholar] [CrossRef]
- Holloway, J.; de Waal, A.A.; Counet, H. Lessons learned from performance management systems implementations. Int. J. Prod. Perform. Manag. 2009, 58, 367–390. [Google Scholar]
- Longinidis, P.; Gotzamani, K. ERP user satisfaction issues: Insights from a Greek industrial giant. Ind. Manag. Data Syst. 2009, 109, 628–645. [Google Scholar] [CrossRef]
- Amaral, P.; Sousa, R. Barriers to internal benchmarking initiatives: An empirical investigation. Benchmark. Int. J. 2009, 16, 523–542. [Google Scholar] [CrossRef]
- Hillary, R. Environmental management systems and the smaller enterprise. J. Clean. Prod. 2004, 12, 561–569. [Google Scholar] [CrossRef]
- Daugherty, P.J.; Autry, C.W.; Ellinger, A.E. Reverse logistics: The relationship between resource commitment and program performance. J. Bus. Logist. 2001, 22, 107–123. [Google Scholar] [CrossRef]
- Beamon, B.M. Designing the green supply chain. Logist. Inf. Manag. 1999, 12, 332–342. [Google Scholar] [CrossRef] [Green Version]
- Shen, L.-Y.; Tam, V.W. Implementation of environmental management in the Hong Kong construction industry. Int. J. Proj. Manag. 2002, 20, 535–543. [Google Scholar] [CrossRef]
- Theyel, G. Management practices for environmental innovation and performance. Int. J. Oper. Prod. Manag. 2000, 20, 249–266. [Google Scholar] [CrossRef]
- Srivastava, S.K. Network design for reverse logistics. Omega 2008, 36, 535–548. [Google Scholar] [CrossRef]
- Pokharel, S.; Mutha, A. Perspectives in reverse logistics: A review. Resour. Conserv. Recycl. 2009, 53, 175–182. [Google Scholar] [CrossRef]
- Inderfurth, K. Impact of uncertainties on recovery behavior in a remanufacturing environment: A numerical analysis. Int. J. Phys. Distrib. Logist. Manag. 2005, 35, 318–336. [Google Scholar] [CrossRef]
- Abraham, N. The apparel aftermarket in India—A case study focusing on reverse logistics. J. Fash. Mark. Manag. Int. J. 2011, 15, 211–227. [Google Scholar] [CrossRef]
- Ahi, P.; Searcy, C. A comparative literature analysis of definitions for green and sustainable supply chain management. J. Clean. Prod. 2013, 52, 329–341. [Google Scholar] [CrossRef]
- Linstone, H.A.; Turoff, M. The Delphi Method: Techniques and Applications; Addison-Wesley: Reading, MA, USA, 1975; Volume 29. [Google Scholar]
- Okoli, C.; Pawlowski, S.D. The Delphi method as a research tool: An example, design considerations and applications. Inf. Manag. 2004, 42, 15–29. [Google Scholar] [CrossRef] [Green Version]
- Saunders, M.L.; Lewis, P.P.; Thornhill, A. Research Methods for Business Students; Pearson Education: London, UK, 2009; Volume 4. [Google Scholar]
- Weston, R.; Gore, P.A., Jr. A brief guide to structural equation modeling. Couns. Psychol. 2006, 34, 719–751. [Google Scholar] [CrossRef]
- Tavakol, M.; Dennick, R. Making sense of Cronbach’s alpha. Int. J. Med. Educ. 2011, 2, 53. [Google Scholar] [CrossRef] [PubMed]
- Jolliffe, I.T. Principal Component Analysis and Factor Analysis. In Principal Component Analysis; Springer: Berlin/Heidelberg, Germany, 1986; pp. 115–128. [Google Scholar]
- Tabachnick, B.; Fidell, L. Using Multivariate Statistics, 3rd ed.; Harper Collins College Publishers: Northridge, CA, USA, 1996. [Google Scholar]
- Costello, A.B.; Osborne, J.W. Best practices in exploratory factor analysis: Four recommendations for getting the most from your analysis. Pract. Assess. Res. Eval. 2005, 10, 1–9. [Google Scholar]
- Hair, J.F.; Black, W.C.; Babin, B.J.; Anderson, R.E.; Tatham, R.L. Multivariate Data Analysis; Prentice Hall: Upper Saddle River, NJ, USA, 1998; Volume 5. [Google Scholar]
- Kaiser, H.F. The application of electronic computers to factor analysis. Educ. Psychol. Meas. 1960, 20, 141–151. [Google Scholar] [CrossRef]
- Jöreskog, K.G. A general method for analysis of covariance structures. Biometrika 1970, 57, 239–251. [Google Scholar] [CrossRef]
- Bentler, P.M.; Weeks, D.G. Linear structural equations with latent variables. Psychometrika 1980, 45, 289–308. [Google Scholar] [CrossRef]
- Ollé, C.; Borrego, Á. Librarians’ perceptions on the use of electronic resources at Catalan academic libraries: Results of a focus group. New Libr. World 2010, 111, 46–54. [Google Scholar] [CrossRef] [Green Version]
- Mak, B.L.; Sockel, H. A confirmatory factor analysis of IS employee motivation and retention. Inf. Manag. 2001, 38, 265–276. [Google Scholar] [CrossRef] [Green Version]
- Bagozzi, R.P. Causal Models in Marketing; Wiley: Hoboken, NJ, USA, 1980. [Google Scholar]
- Kim, Y.M. Validation of psychometric research instruments: The case of information science. J. Assoc. Inf. Sci. Technol. 2009, 60, 1178–1191. [Google Scholar] [CrossRef]
- Hair, J.; Black, W.; Babin, B.; Anderson, R. Multivariate Data Analysis; Prentice-Hall: Upper Saddle River, NJ, USA, 2010. [Google Scholar]
- Darko, A.; Chan, A.P.C. Strategies to promote green building technologies adoption in developing countries: The case of Ghana. Build. Environ. 2018, 130, 74–84. [Google Scholar] [CrossRef]
- Chan, A.P.; Lam, P.T.; Chan, D.W.; Cheung, E.; Ke, Y. Critical success factors for PPPs in infrastructure developments: Chinese perspective. J. Constr. Eng. Manag. 2010, 136, 484–494. [Google Scholar] [CrossRef]
- Bagaya, O.; Song, J. Empirical study of factors influencing schedule delays of public construction projects in Burkina Faso. J. Manag. Eng. 2016, 32, 05016014. [Google Scholar] [CrossRef]


| Research Objectives | Author | Analysis Method |
|---|---|---|
| Understanding the customer’s behavior toward adaptation of green logistics practices | [69] | SEM |
| Obtaining initial indicators to check the impact of logistics packaging on transportation efficiency freight | [71] | SEM |
| Evaluating most critical and core problems in sustainable supply chain management (SCM) | [61] | DM |
| Evaluation of competitiveness of logistics companies using Structural Equation Modeling | [68] | SEM |
| Comprehensive long-term planning for logistics service industry, a Delphi method analysis for 2025 | [63] | DM |
| Purpose of this study was to check the relationship between market orientation, supply chain orientation, and supply chain management | [66] | SEM |
| Development of most important strategies in supply chain management for future forecasting with the help of the Delphi technique | [60] | DM |
| Purpose of this study was to evaluate the selection of a green supplier for the high-tech industry | [62] | DM |
| The main purpose of this paper was to evaluate three strategies: market strategy, process strategy, and information strategy of logistics with the help of Structural Equation Modeling | [73] | SEM |
| The objective of this paper was to check the impact of enterprise resource planning on SCM with the help of the Delphi Method | [59] | DM |
| The objective of this study was to investigate the service quality that influences third-party logistics provider relationship and shipper satisfaction | [67] | SEM |
| The aim of this study observes the relationship between 3PL, customer relation and logistics firm improvement | [74] | SEM |
| A Delphi Method based study to identify the factors affecting location decision in international operations | [75] | DM |
| The purpose of this study was to evaluate the potential connection between green SCM initiative as an environmental improvement option, competitiveness, and economic performance among South Asian firms | [65] | SEM |
| The purpose of this paper was to motivate Malaysian manufacturing companies to adopt GSCM activities to protect the environment | [72] | SEM |
| Identification of most critical issues in reverse logistics faced by professionals in time management activities | [76] | DM |
| Influence of institutional theory on adoption of green supply chain practices in the manufacturing industry | [70] | SEM |
| The development of a comprehensive model-based decision for GSCM using SEM and securing better understanding among managers on internal and external factors | [77] | SEM |
| Professionals opinions toward electronics business logistics companies | [58] | DM |
| The aim of this study was to fill the gap by provision of empirical evidence to manufacturing companies for implementation of green supply chain management to protect the environment | [78] | SEM |
| Development of green supply chain management strategies from companies’ sustainable strategies and emerging economy perspective | [64] | DM |
| Code | Barriers | References |
|---|---|---|
| FERB | 1 Financial & Economical Related Barriers | |
| FERB1 | Lack of initial capital | [13,28,43,44,51,81,82,83] |
| FERB2 | Non-availability of bank loans to encourage green products/processes | [26] |
| FERB3 | Higher costs of adopting RL | [21,28,48,84,85] |
| FERB4 | Lack of funds for product return monitoring systems | [28,86] |
| FERB5 | High investments and less return-on-investments | [26,86] |
| FERB6 | Expenditure on collecting used products | [18,26] |
| KERB | 2 Knowledge & Experience Related Barriers | |
| KERB1 | Lack of skilled professionals in RL | [28,46,82,87,88,89] |
| KERB2 | Lack of knowledge, training and experience in RL | [45,46,87,90,91] |
| KERB3 | Lack of awareness about RL practices | [10,26,43,48,82,84,92] |
| KERB4 | Immaturity and low investment in knowledge management and information systems | [8,48,83,93,94] |
| KERB5 | Wrong forecasting | [49,95,96] |
| KERB6 | Lack of responsiveness about RL | [97,98,99,100,101] |
| LRRB | 3 Law & Regulation Related Barriers | |
| LRRB1 | Lack of government supportive policies for RL | [86,102] |
| LRRB2 | Changing regulations due to changing political climate | [103] |
| LRRB3 | Lack of regulatory restrictions | [26,104,105] |
| LRRB4 | Lack of enforceable laws on products’ return of end-of-life | [18,28] |
| LRRB5 | Customers are not informed to returned use products | [3,18] |
| LRRB6 | Lack of political commitment | [106] |
| MRB | 4 Management Related Barriers | |
| MRB1 | Lack of commitment from top management | [41,44,47,48,49,87,97,107,108,109] |
| MRB2 | Lack of management initiatives | [41,82] |
| MRB3 | Lack of cooperation with RL professionals | [28,87] |
| MRB4 | Lack of coordination with 3PL providers | [18,26] |
| MRB5 | Lack of waste management practices | [8,28,110] |
| MRB6 | Poor organizational culture | [41,47,97,109,111] |
| MRB7 | Resistance to change | [97,112,113,114] |
| ITRB | 5 Infrastructure & Technology Related barriers | |
| ITRB1 | Lack of new technology and information systems | [41,46,84,87,105] |
| ITRB2 | Lack of logistics infrastructure facilities | [104] |
| ITRB3 | Lack of human resources | [3,46,48,105,115,116] |
| ITRB4 | Lack of technology for waste management and recycling | [22,28,45,87,117] |
| ITRB5 | Deficiency of road conditions | [104] |
| ITRB6 | Poor service quality of local 3PL provider | [104] |
| ERB | 6 Environmental Related Barriers | |
| ERB1 | Lack of environmental law awareness | [46,51,118] |
| ERB2 | Complexity in measuring and monitoring suppliers’ environmental practices | [46] |
| ERB3 | Lack of effective environmental measure | [46,65] |
| ERB4 | Difficulty in identifying environmental opportunities | [46,119] |
| ERB5 | Lack of international or U.S environmental standards | [28,44,51] |
| ERB6 | No specific environmental goals | [26,119] |
| MB | 7 Market-Related Barriers | |
| MB1 | Market competition and uncertainty | [26,43] |
| MB2 | Lack of community pressure | [40,103,120] |
| MB3 | Marketing of remanufactured product | [26,86,120,121] |
| MB4 | Uncertain quality and quantity of return | [21,26,40,86,120] |
| MB5 | Uncertain return and demand | [86,121,122] |
| MB6 | Undeveloped recovery marketplaces | [51,102,123] |
| PRB | 8 Policy Related Barriers | |
| PRB1 | Lack of corporate social responsibility and ethical standards | [26,43,51,87] |
| PRB2 | Companies policies against RL | [51,90,102] |
| PRB3 | Lack of clarity regarding sustainability | [45,86] |
| PRB4 | Limited forecasting and planning in RL | [18,28,51] |
| Demographic | Count | Percentage |
|---|---|---|
| Gender | ||
| Male | 454 | 83 |
| Female | 93 | 17 |
| Age group | ||
| 20–35 years | 197 | 36 |
| 36–50 years | 279 | 51 |
| >50 years | 73 | 13 |
| Education | ||
| Bachelor | 317 | 58 |
| Master | 211 | 39 |
| Ph.D. | 19 | 3 |
| Industry category | ||
| Textile mills | 73 | 13 |
| Food industry | 59 | 11 |
| Plastic bags manufacturing | 41 | 7 |
| Apparel mills | 25 | 5 |
| Beverage companies | 82 | 15 |
| Paper manufacturing | 27 | 5 |
| Rubber and plastics mills | 34 | 6 |
| Coal and petroleum companies | 28 | 5 |
| Electronic products manufacturing | 49 | 9 |
| Lubricants companies | 58 | 11 |
| Fertilizer companies | 50 | 9 |
| Government Employees (PAK-EPA, SDPI) | 21 | 4 |
| Work status | ||
| Top level | 46 | 8 |
| Middle level | 322 | 59 |
| Low level | 179 | 33 |
| Total | 547 | 100 |
| Factors | Reliability | 1 | 2 | 3 | 4 | 5 | 6 | 7 | 8 |
|---|---|---|---|---|---|---|---|---|---|
| FERB1 | 0.875 | 0.876 | |||||||
| FERB3 | 0.822 | ||||||||
| FERB4 | 0.650 | ||||||||
| FERB5 | 0.802 | ||||||||
| FERB6 | 0.729 | ||||||||
| KERB1 | 0.751 | 0.872 | |||||||
| KERB2 | 0.742 | ||||||||
| KERB5 | 0.837 | ||||||||
| KERB6 | 0.591 | ||||||||
| LRRB1 | 0.834 | 0.856 | |||||||
| LRRB2 | 0.638 | ||||||||
| LRRB3 | 0.683 | ||||||||
| LRRB4 | 0.801 | ||||||||
| LRRB5 | 0.848 | ||||||||
| MRB1 | 0.764 | 0.825 | |||||||
| MRB3 | 0.788 | ||||||||
| MRB5 | 0.674 | ||||||||
| MRB6 | 0.863 | ||||||||
| MRB7 | 0.502 | ||||||||
| ITRB1 | 0.837 | 0.855 | |||||||
| ITRB2 | 0.729 | ||||||||
| ITRB3 | 0.866 | ||||||||
| ITRB4 | 0.710 | ||||||||
| ITRB5 | 0.696 | ||||||||
| ITRB6 | 0.830 | ||||||||
| ERB1 | 0.712 | 0.832 | |||||||
| ERB2 | 0.783 | ||||||||
| ERB3 | 0.670 | ||||||||
| ERB4 | 0.598 | ||||||||
| ERB5 | 0.580 | ||||||||
| ERB6 | 0.709 | ||||||||
| MB1 | 0.845 | 0.641 | |||||||
| MB2 | 0.865 | ||||||||
| MB4 | 0.780 | ||||||||
| MB6 | 0.804 | ||||||||
| PRB1 | 0.796 | 0.829 | |||||||
| PRB2 | 0.867 | ||||||||
| PRB3 | 0.297 | ||||||||
| PRB4 | 0.785 |
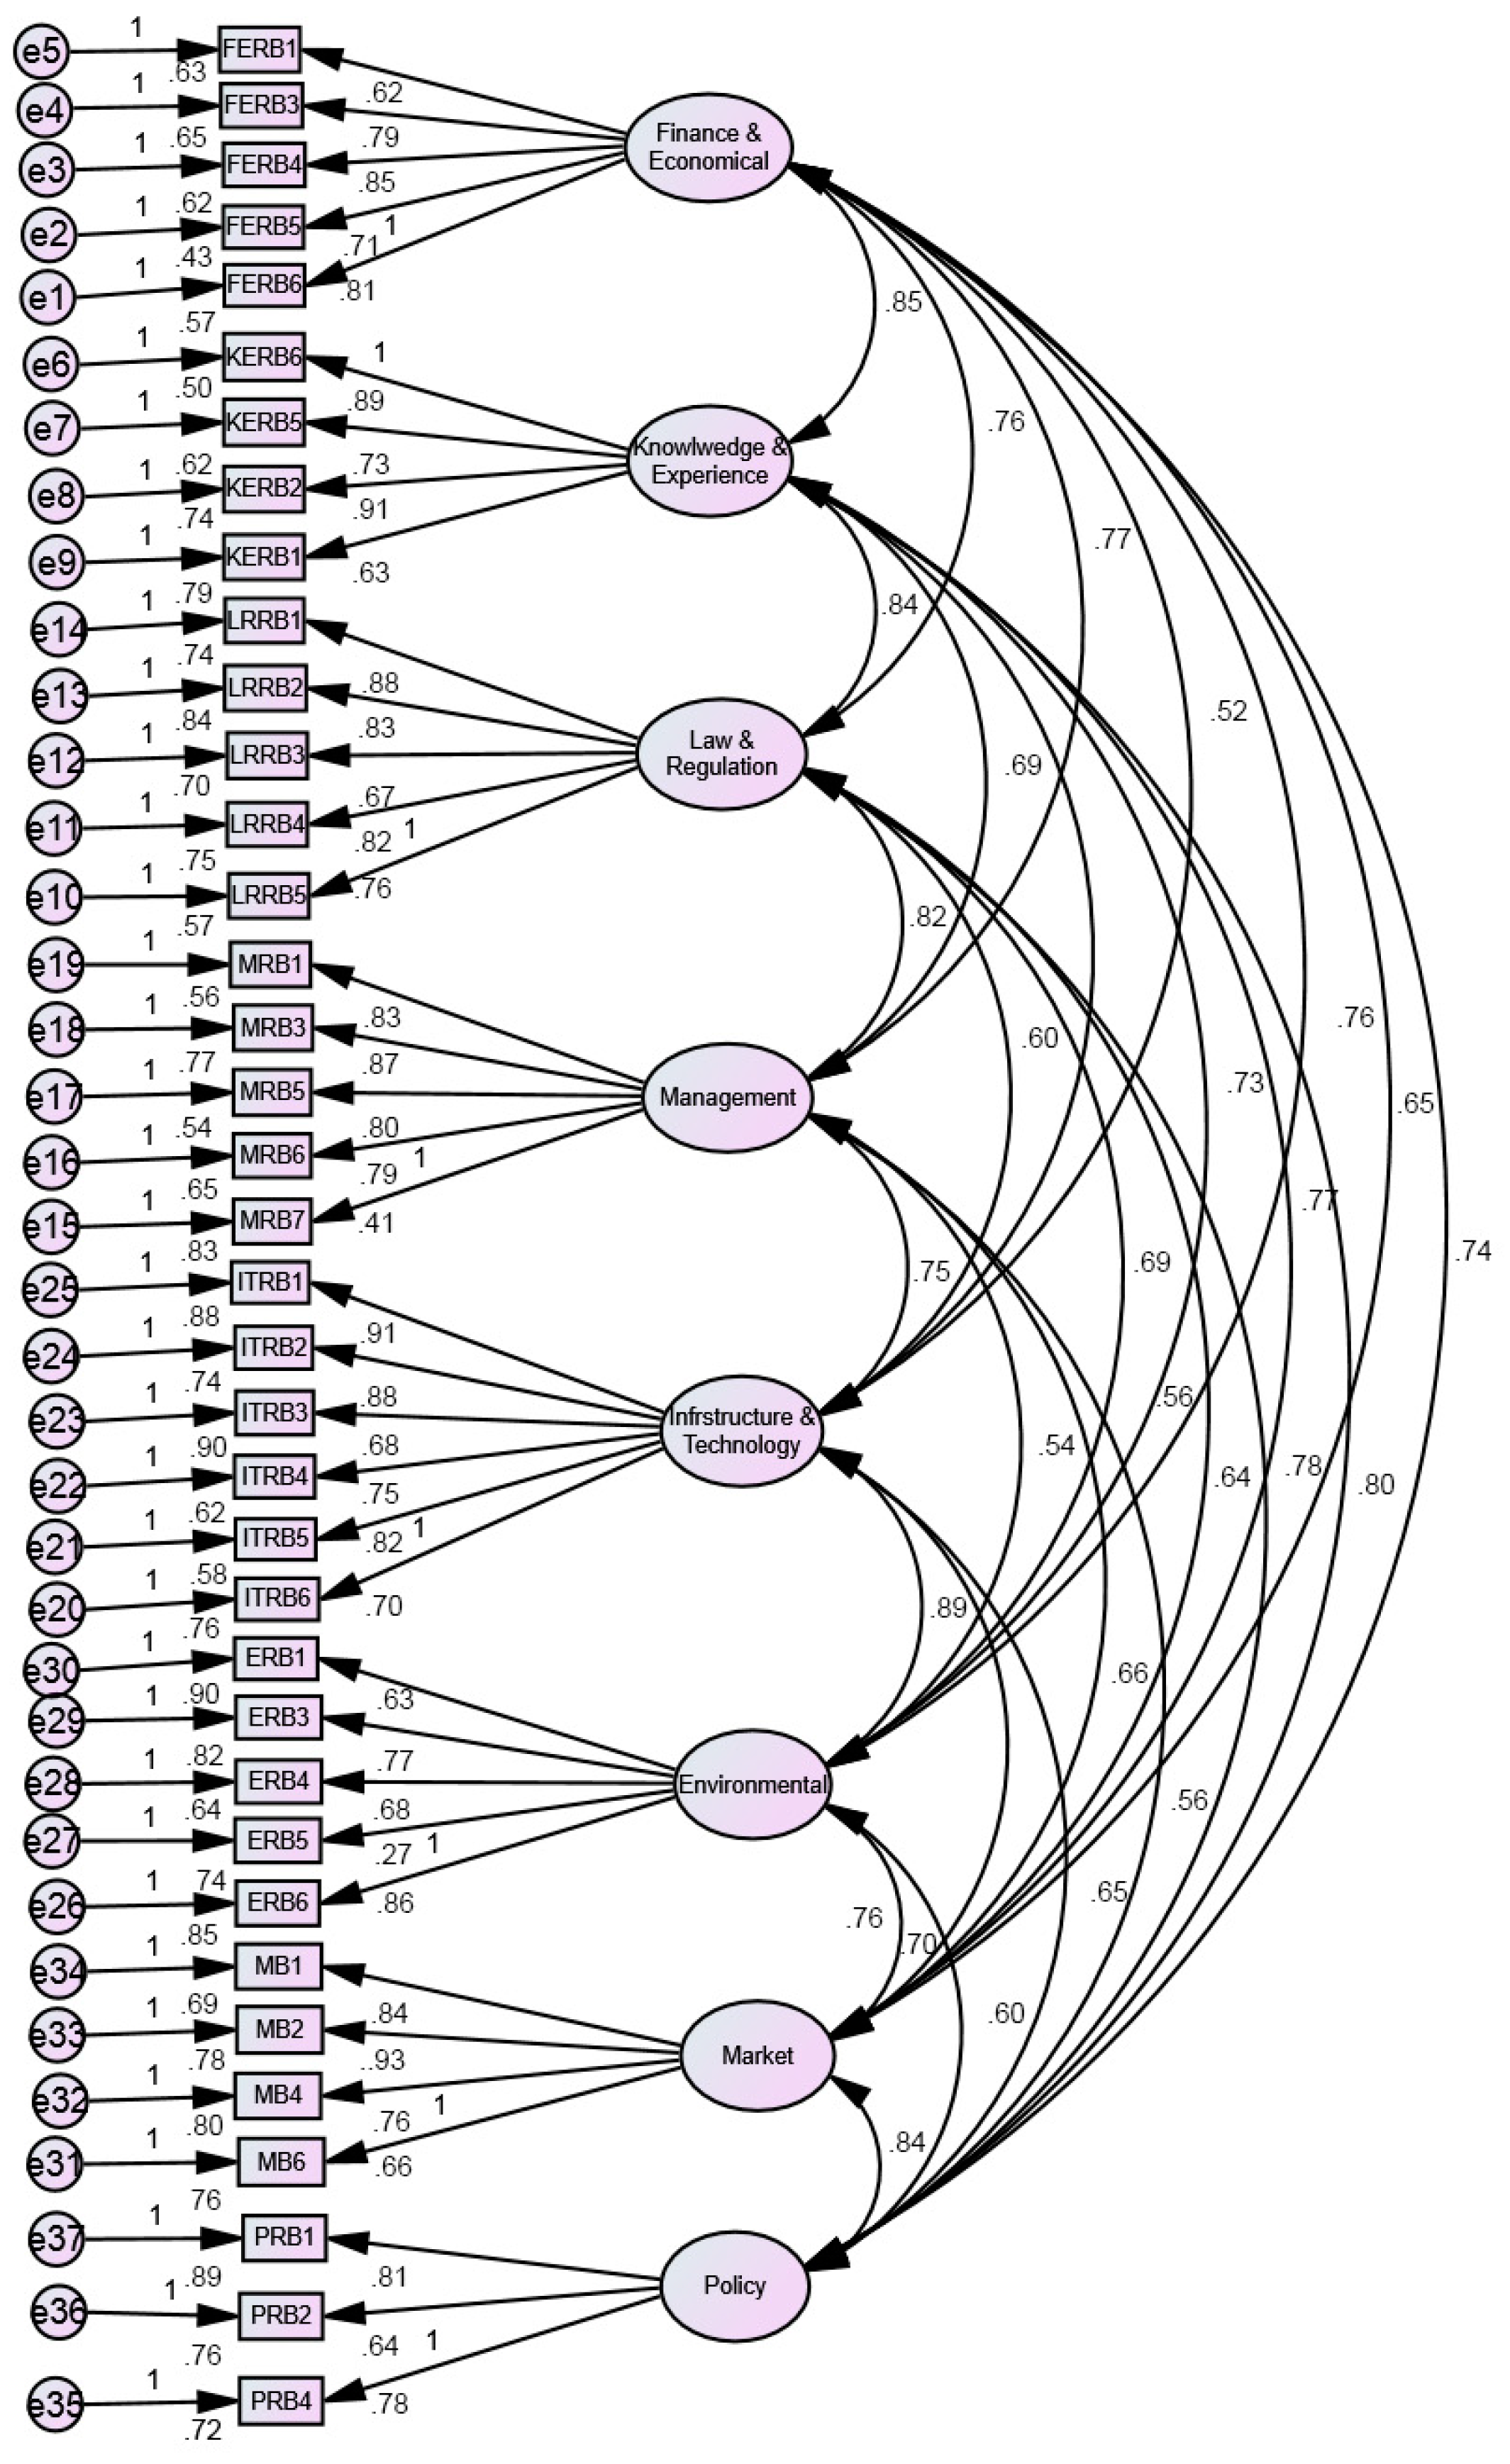
| Variables | Composite Reliability 1 | Average Variance Extracted 2 | Fit Indices 3,4,5 | Statistics | Recommended Criteria |
|---|---|---|---|---|---|
| Financial & Economical | 0.85 | 0.654 | NFI | 0.96 | >0.90 |
| Knowledge & Experience | 0.89 | 0.601 | NNFI | 0.94 | >0.90 |
| Law & Regulation | 0.78 | 0.587 | CFI | 0.96 | >0.90 |
| Management | 0.80 | 0.642 | GFI | 0.94 | >0.90 |
| Infrastructure & Technology | 0.86 | 0.596 | AGFI | 0.92 | >0.90 |
| Environmental | 0.87 | 0.548 | RMSEA | 0.054 | >0.08 |
| Market | 0.76 | 0.662 | SRMR | 0.049 | >0.08 |
| Policy | .082 | 0.648 |
| Brazil a | China b | India c |
|---|---|---|
| The financial burden of tax | Lack of initial capital | Limited forecasting & planning |
| Limited forecasting and planning | Low commitment | Customer perception about RL |
| Uncertainty related to economic issues | Lack of enforceable laws and directives on take-back of end-of-life | Lack of organization personnel resources |
| Complexity in operation | Lack of coordination with 3PL providers | Lack of top management commitment |
| Lack of taxation knowledge on returned products | Lack of funds for return monitoring systems | Lack of a system to monitor returns |
| Top Five Barriers to RL Implementation in Pakistan’s Manufacturing Industry | Current Study | Brazil a | China b | India c |
|---|---|---|---|---|
| Lack of initial capital | √ (rank 1) | – (rank 12) | √ (rank 1) | √ (rank 5) |
| Lack of skilled professionals in RL | √ (rank 2) | – (rank 11) | – (rank 10) | – (rank 7) |
| Company policies against RL | √ (rank 3) | REJ * | – (rank 7) | – (rank 37) |
| Lack of new technology and information system | √ (rank 4) | – (rank 22) | – (rank 8) | – (rank 6) |
| Lack of community pressure | √ (rank 5) | NL ** | – (rank 15) | – (rank 22) |
© 2018 by the authors. Licensee MDPI, Basel, Switzerland. This article is an open access article distributed under the terms and conditions of the Creative Commons Attribution (CC BY) license (http://creativecommons.org/licenses/by/4.0/).
Share and Cite
Waqas, M.; Dong, Q.-l.; Ahmad, N.; Zhu, Y.; Nadeem, M. Critical Barriers to Implementation of Reverse Logistics in the Manufacturing Industry: A Case Study of a Developing Country. Sustainability 2018, 10, 4202. https://doi.org/10.3390/su10114202
Waqas M, Dong Q-l, Ahmad N, Zhu Y, Nadeem M. Critical Barriers to Implementation of Reverse Logistics in the Manufacturing Industry: A Case Study of a Developing Country. Sustainability. 2018; 10(11):4202. https://doi.org/10.3390/su10114202
Chicago/Turabian StyleWaqas, Muhammad, Qian-li Dong, Naveed Ahmad, Yuming Zhu, and Muhammad Nadeem. 2018. "Critical Barriers to Implementation of Reverse Logistics in the Manufacturing Industry: A Case Study of a Developing Country" Sustainability 10, no. 11: 4202. https://doi.org/10.3390/su10114202