Combination of Tree Configuration with Street Configuration for Thermal Comfort Optimization under Extreme Summer Conditions in the Urban Center of Shantou City, China


Abstract
1. Introduction
2. Material and Methods
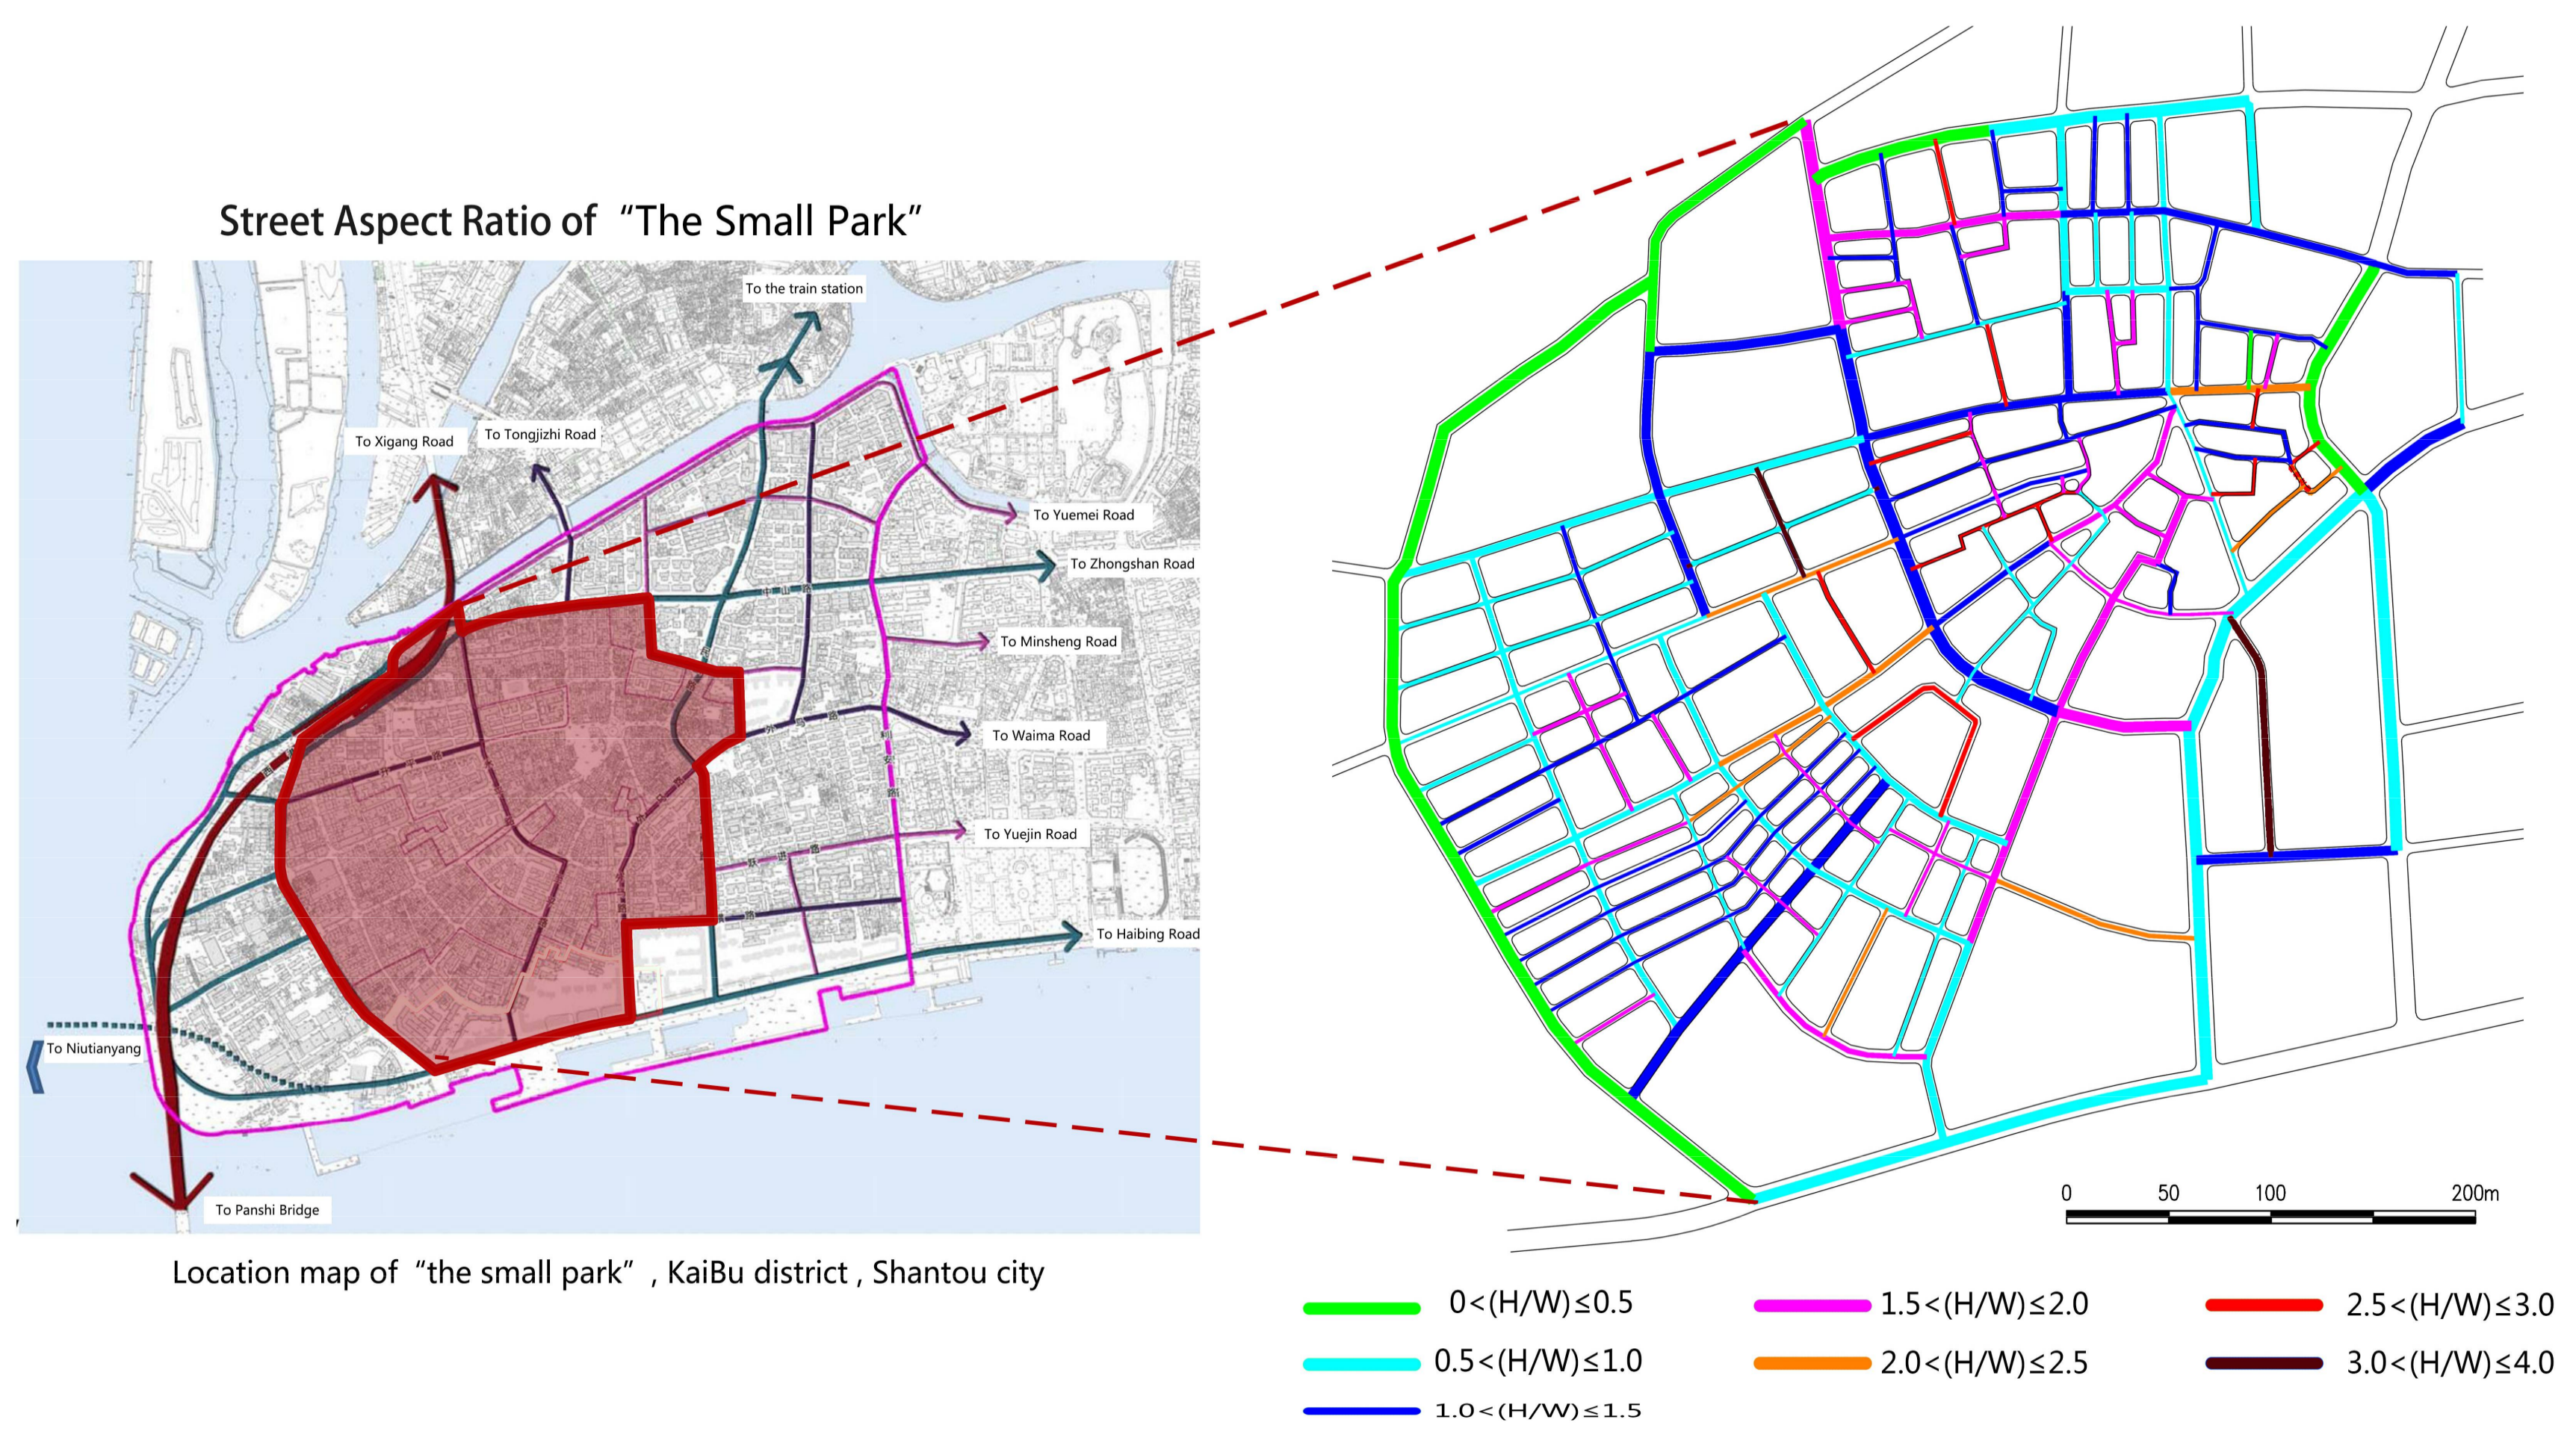
2.1. Study Area
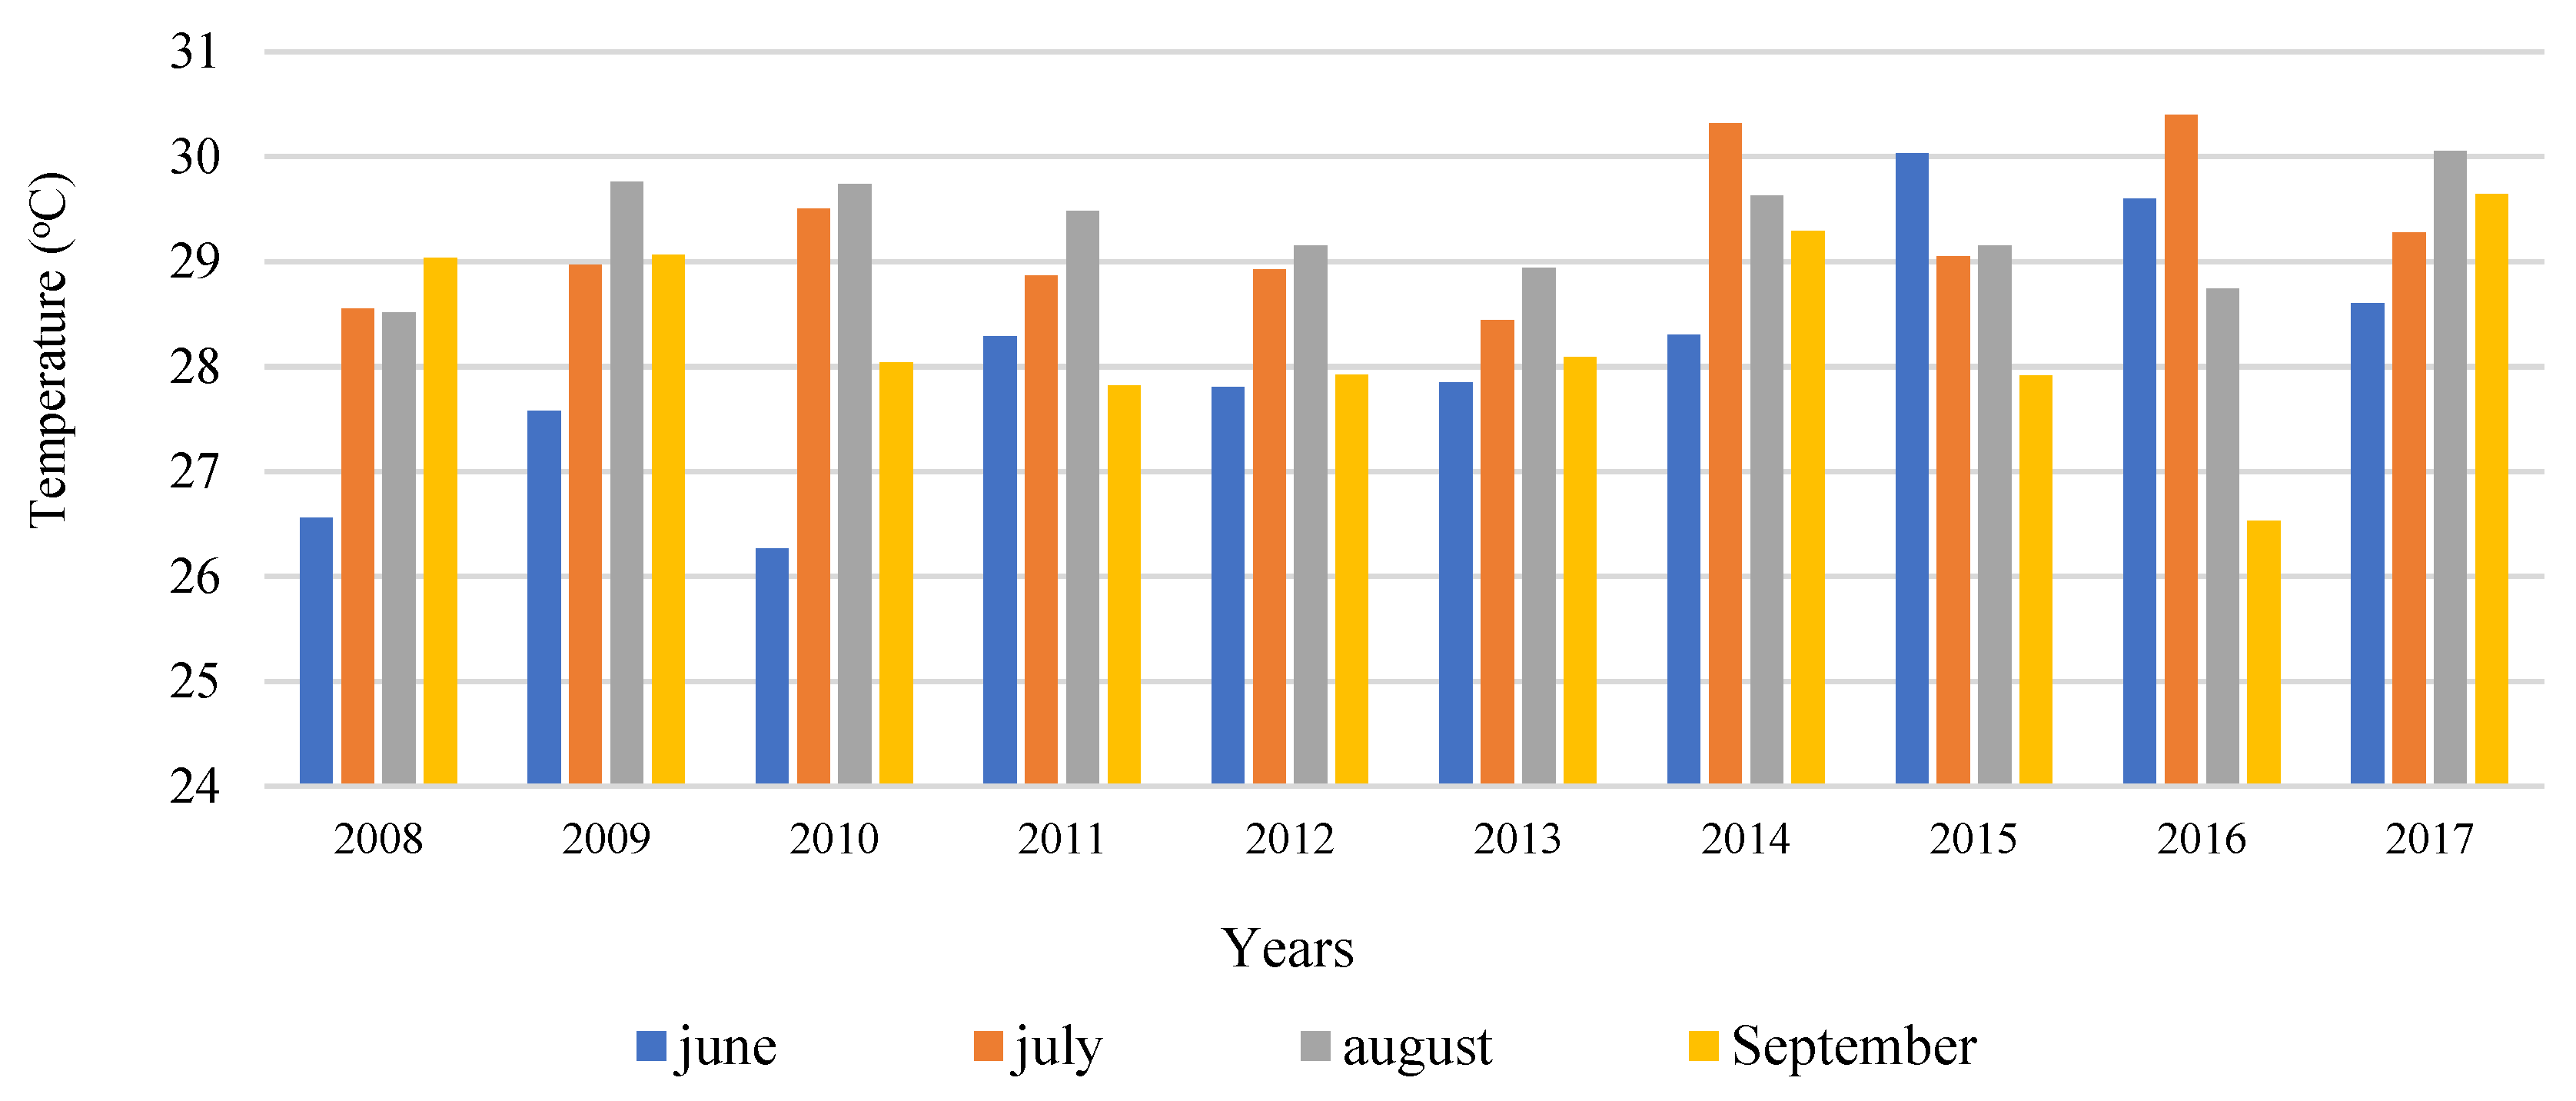
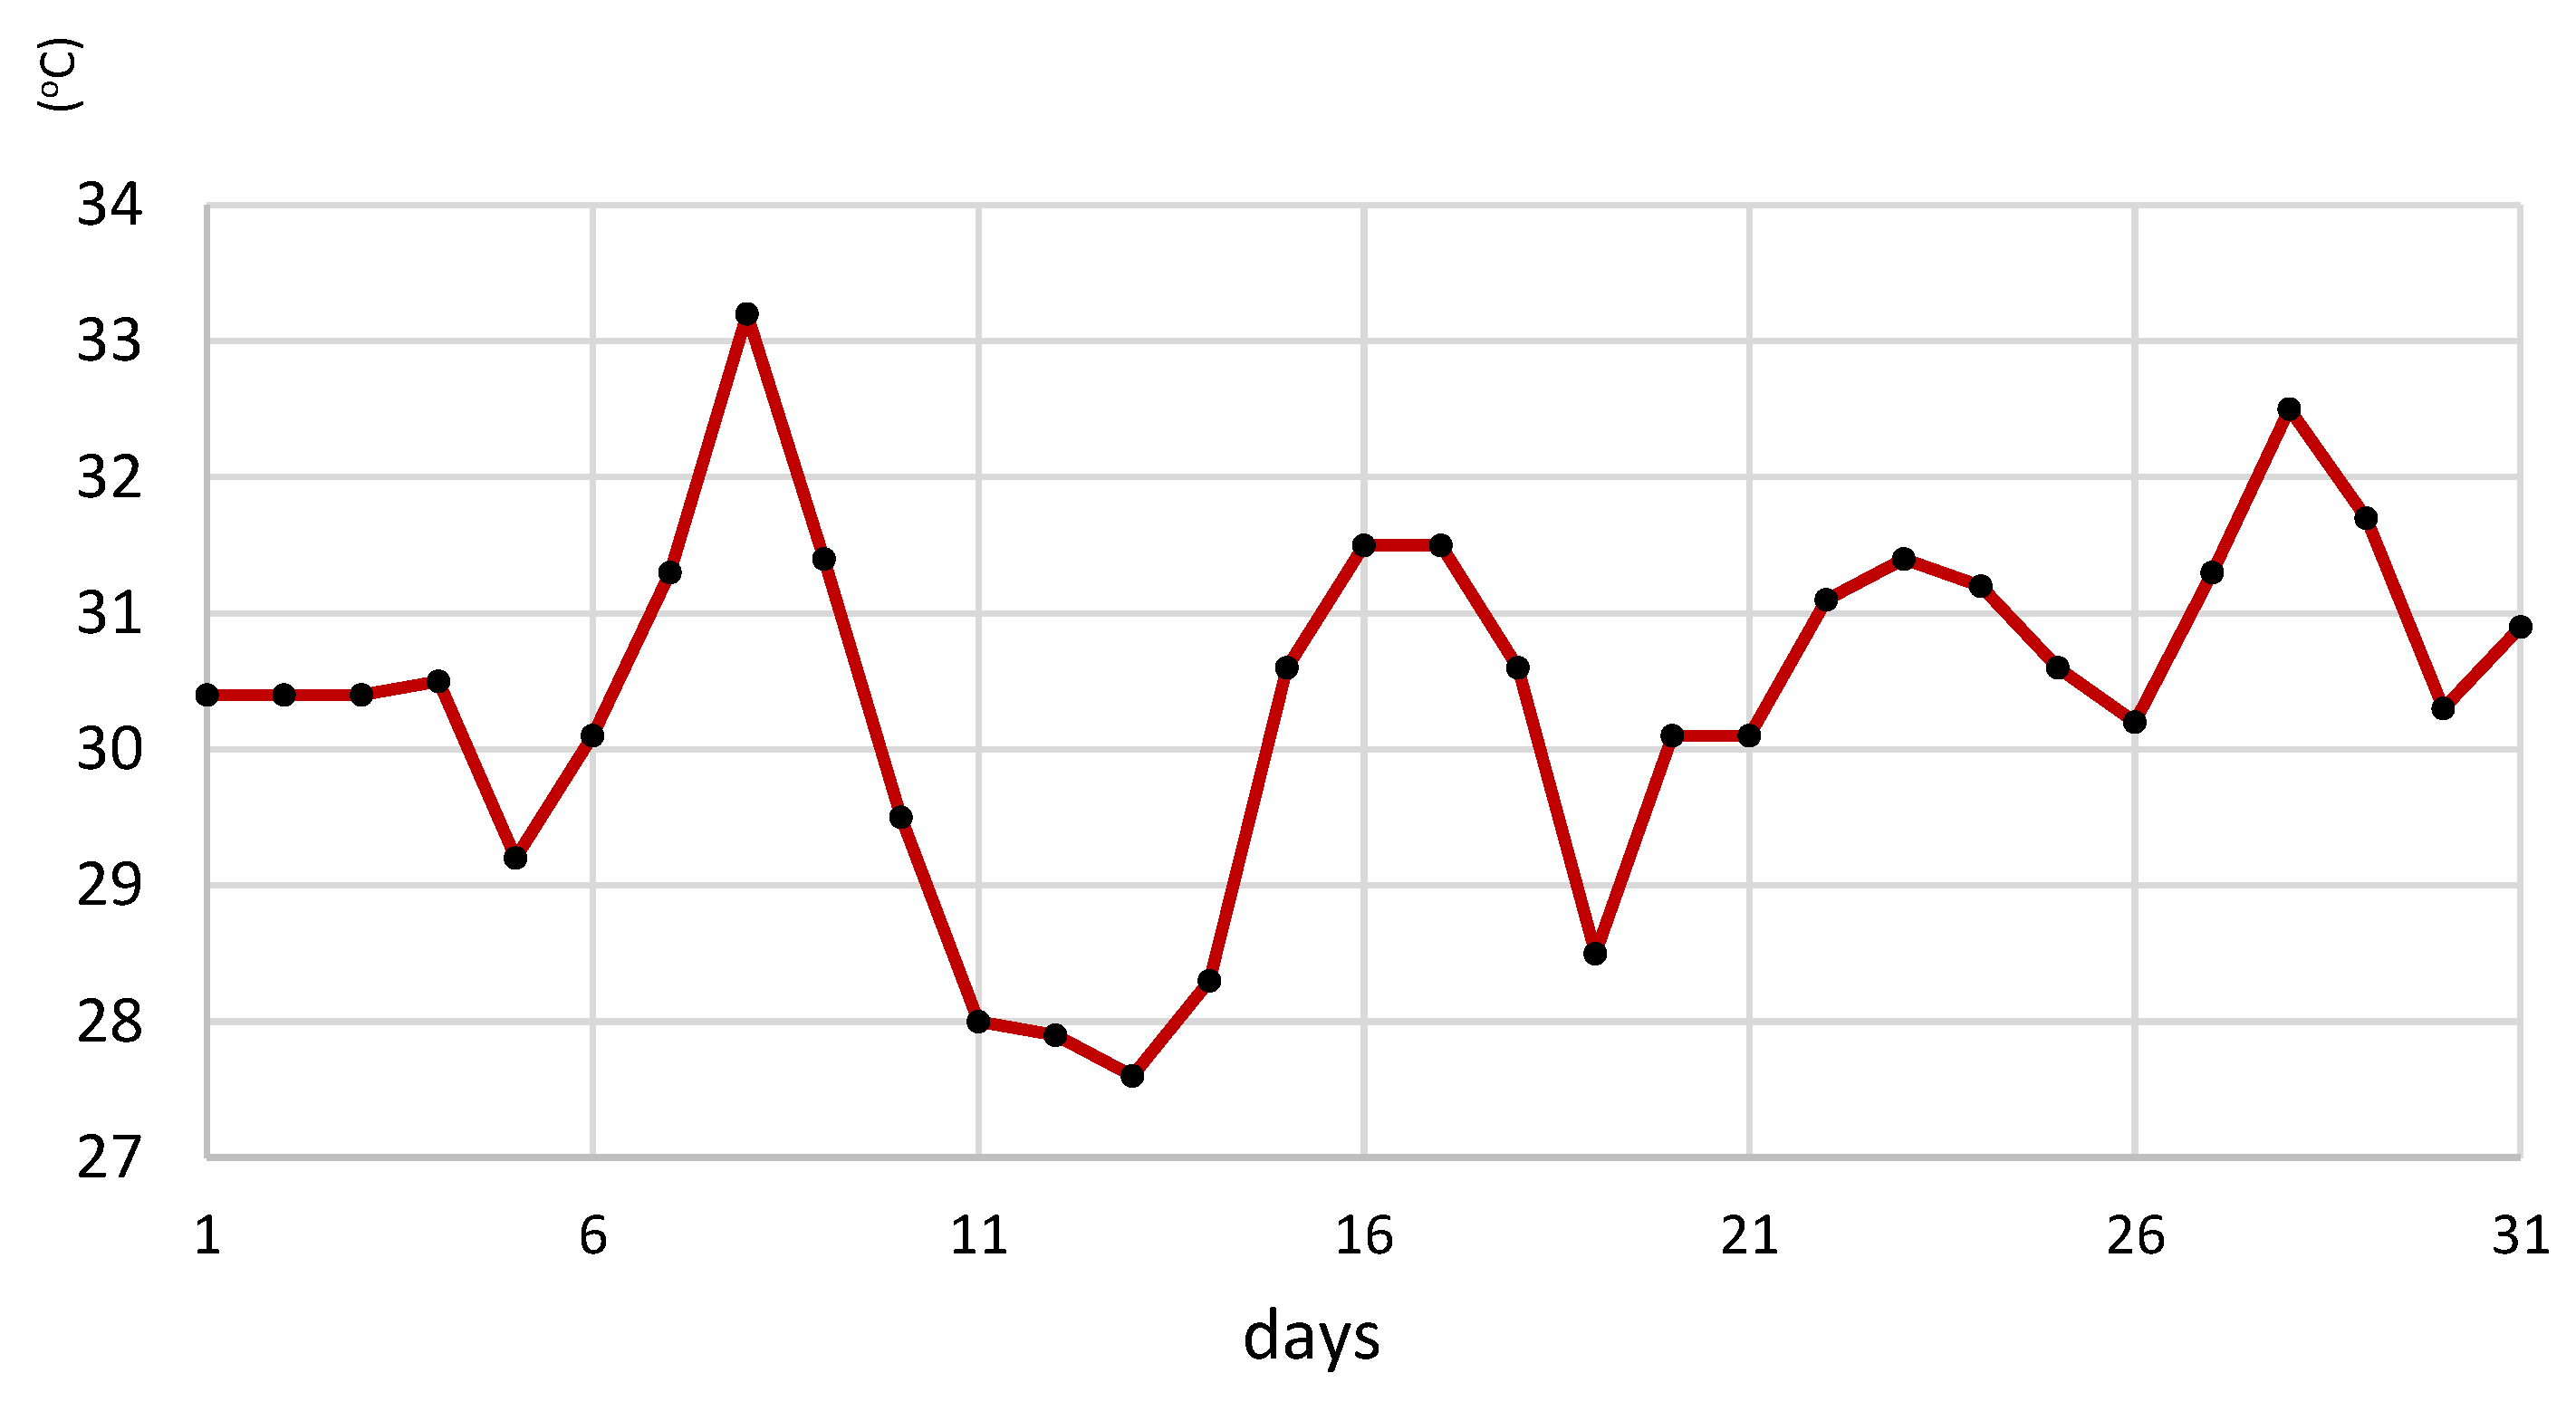
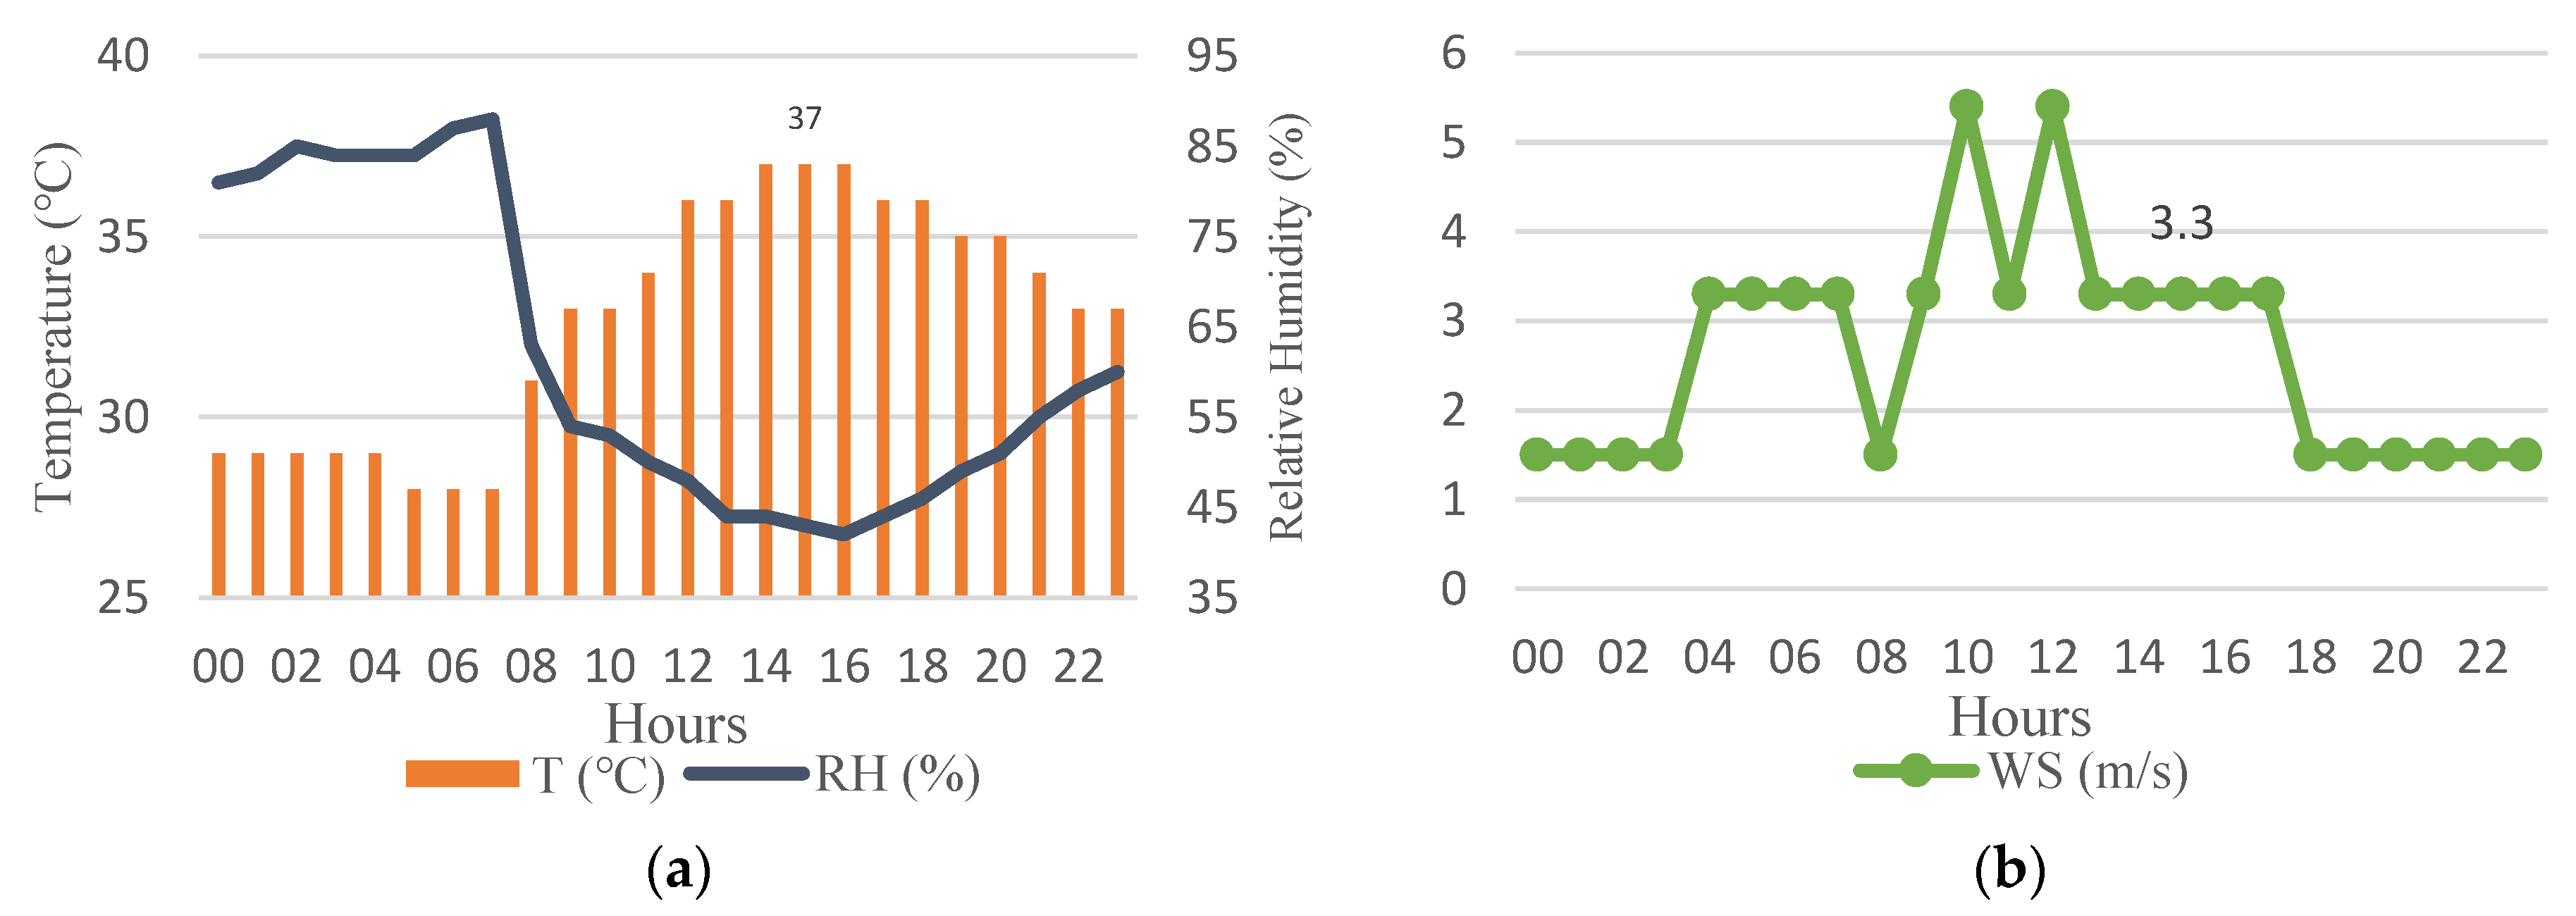
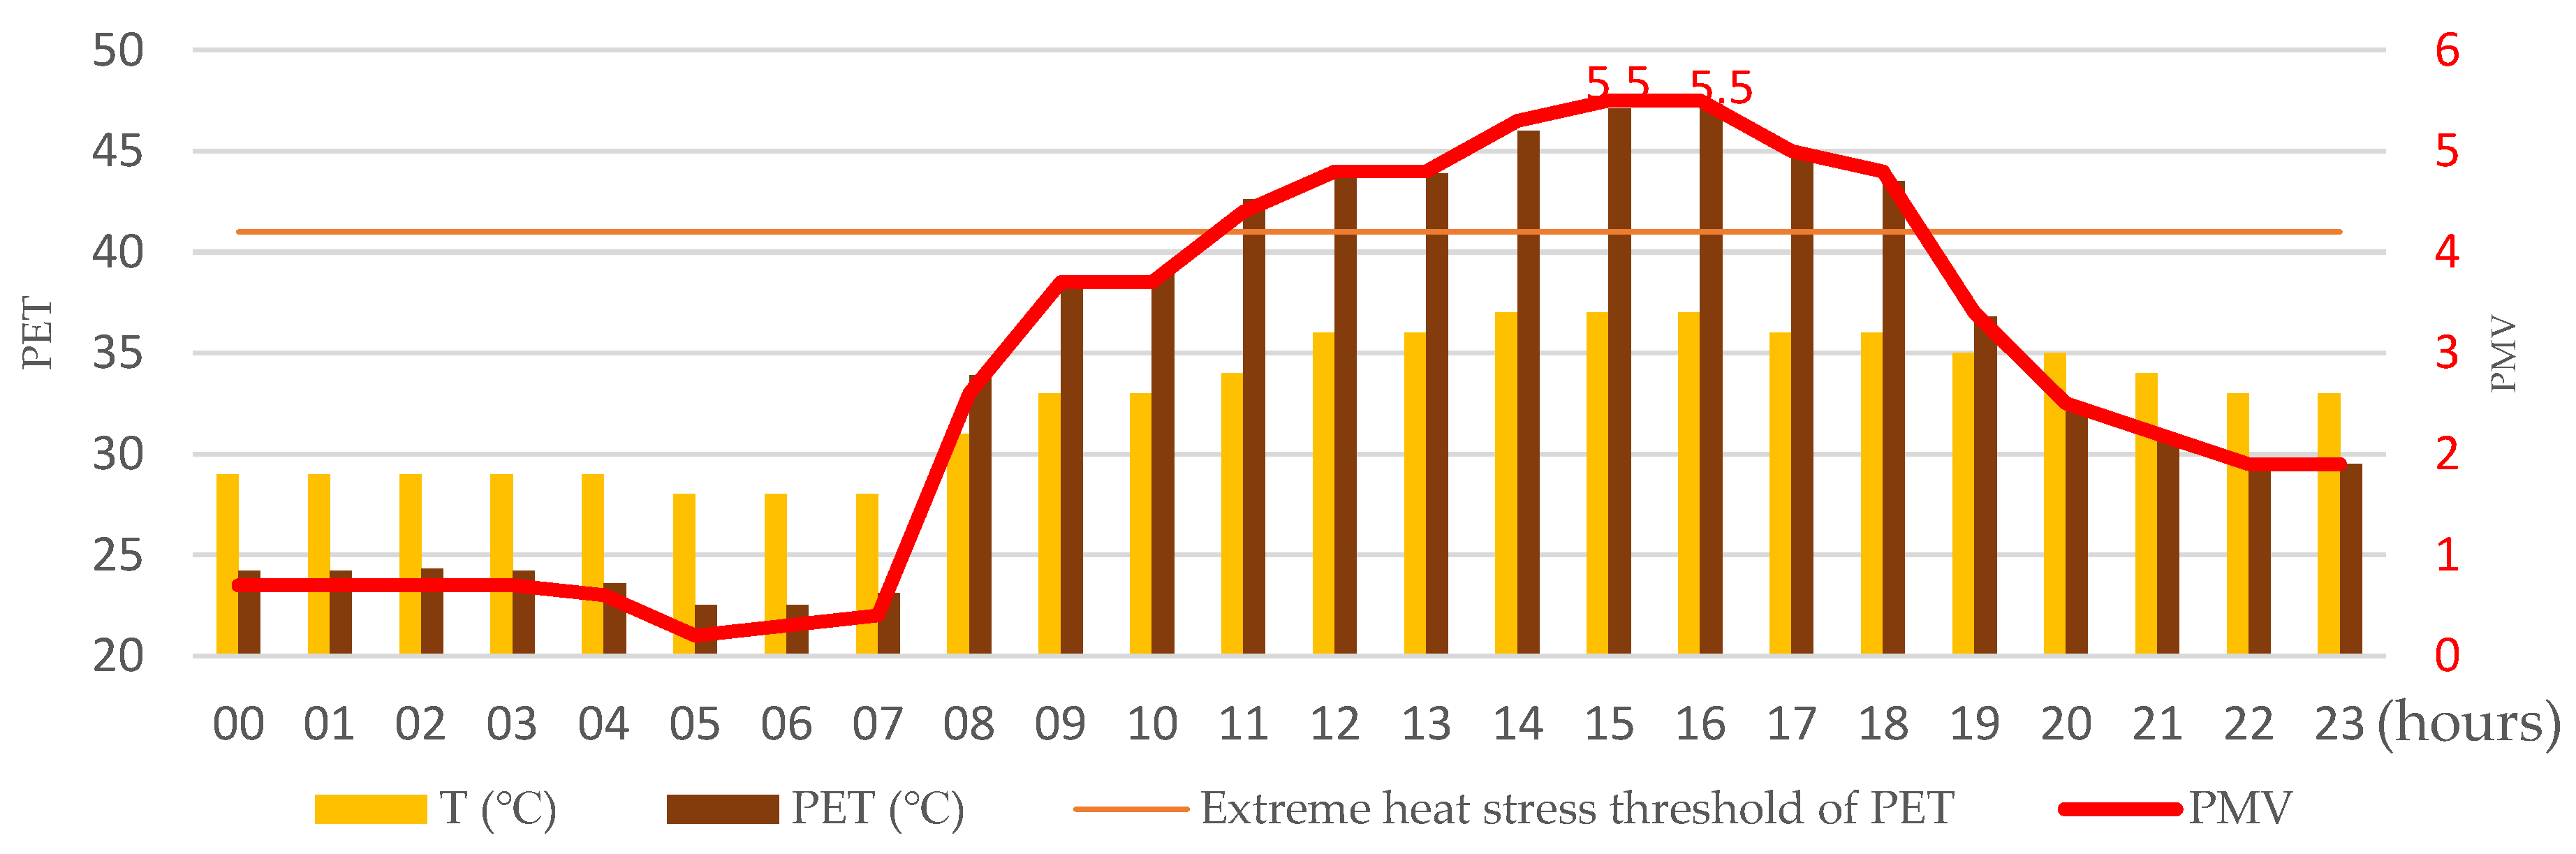
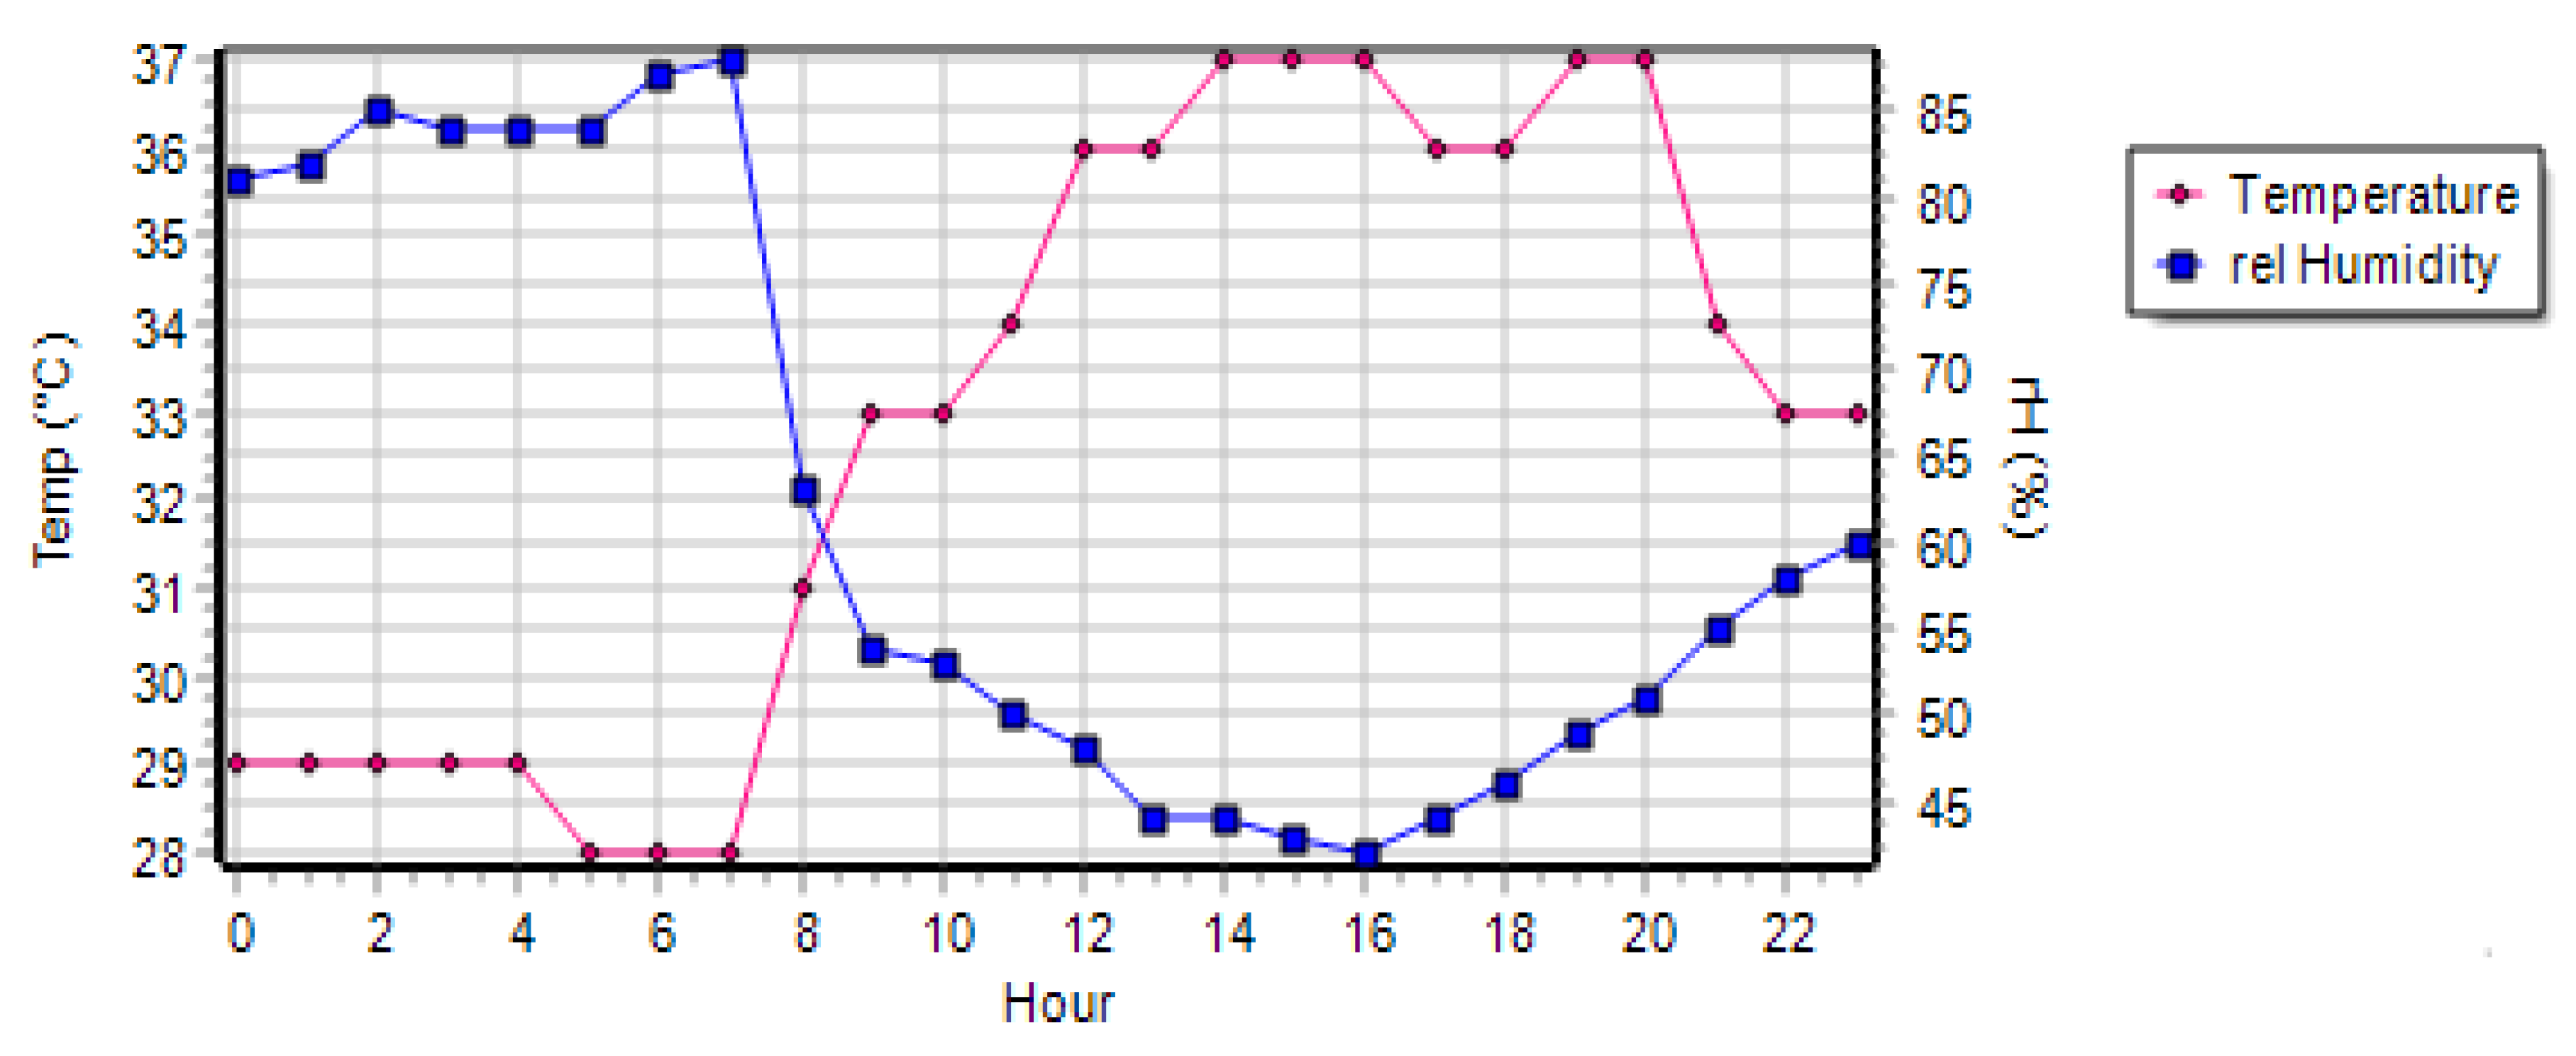
2.2. Data
2.3. Thermal Comfort Evaluation
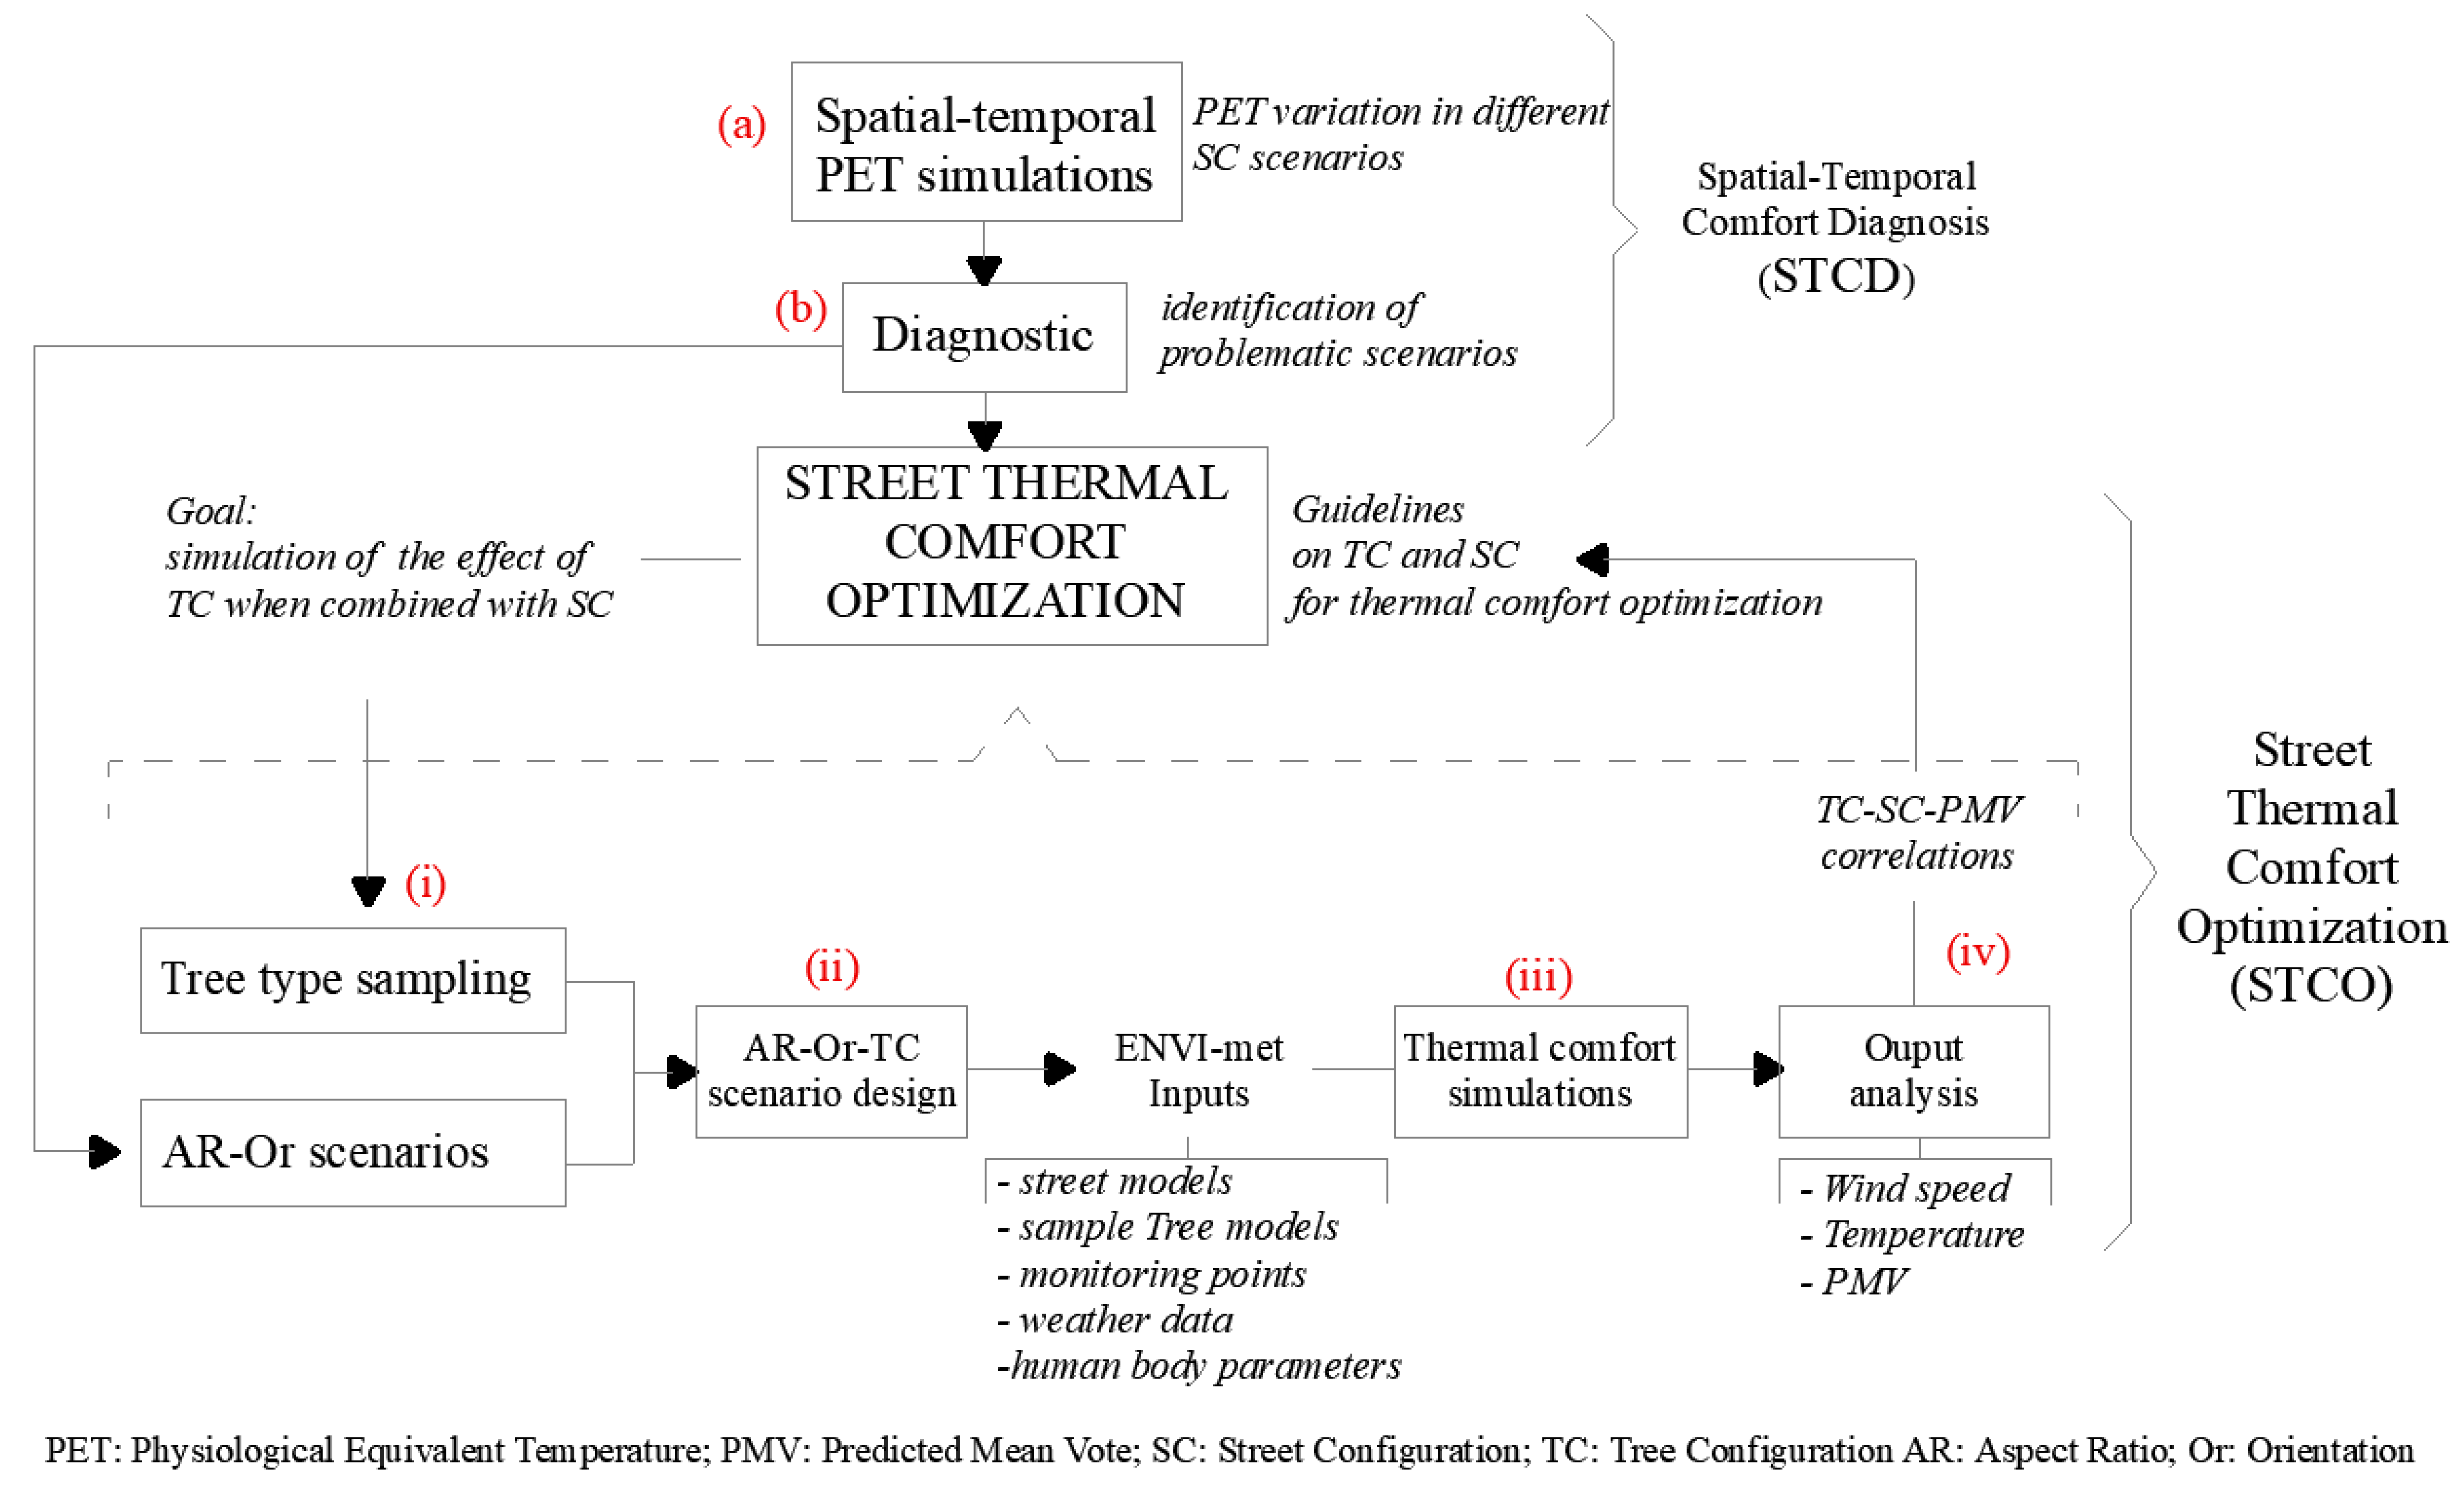
2.4. Tree and Street Configuration Analytical Framework
- (i)
- a Spatial–Temporal Comfort Diagnosis (STCD) that simulates thermal comfort for as many SC scenarios as identified in the study area, and diagnose the problematic scenarios;
- (ii)
- a Street Thermal Comfort Optimization (STCO) where the problematic SC scenarios are combined with TC scenarios to determine the optimal options for pedestrian outdoor comfort.
2.4.1. Spatial–Temporal Comfort Diagnosis (STCD)
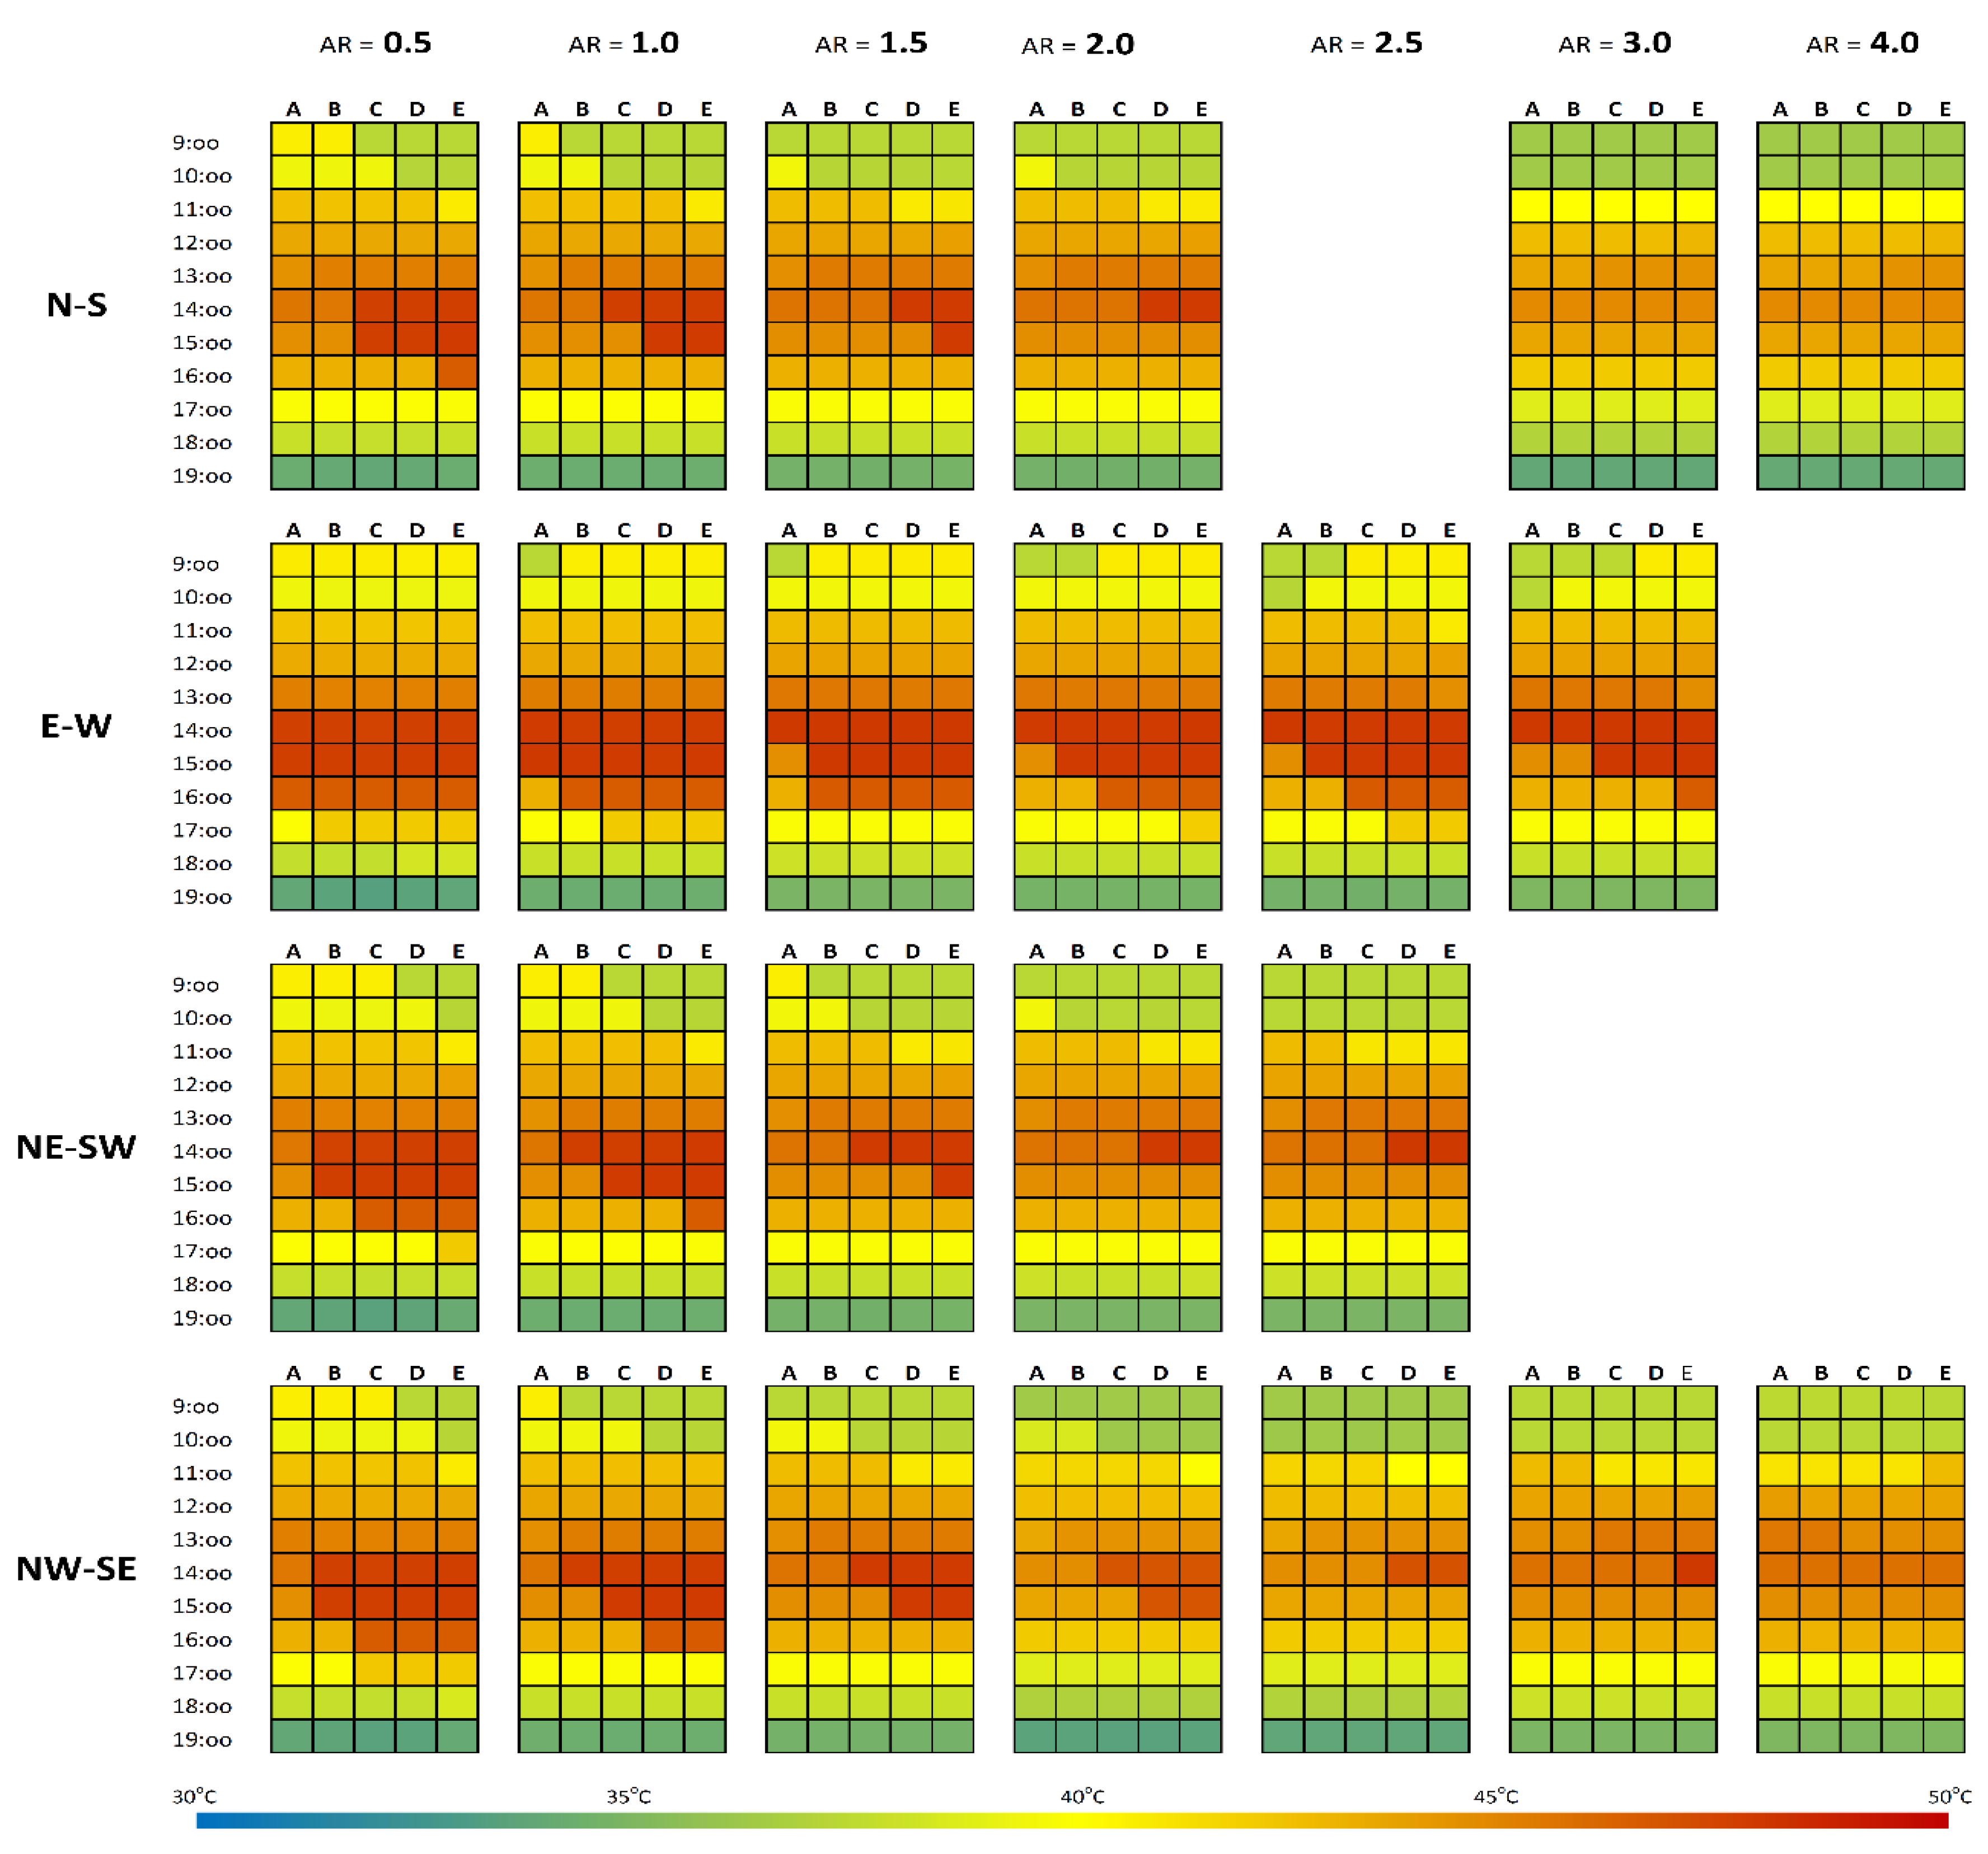
Spatial–Temporal PET Simulations (a)
The Diagnosis (b)
2.4.2. Street Thermal Comfort Optimization
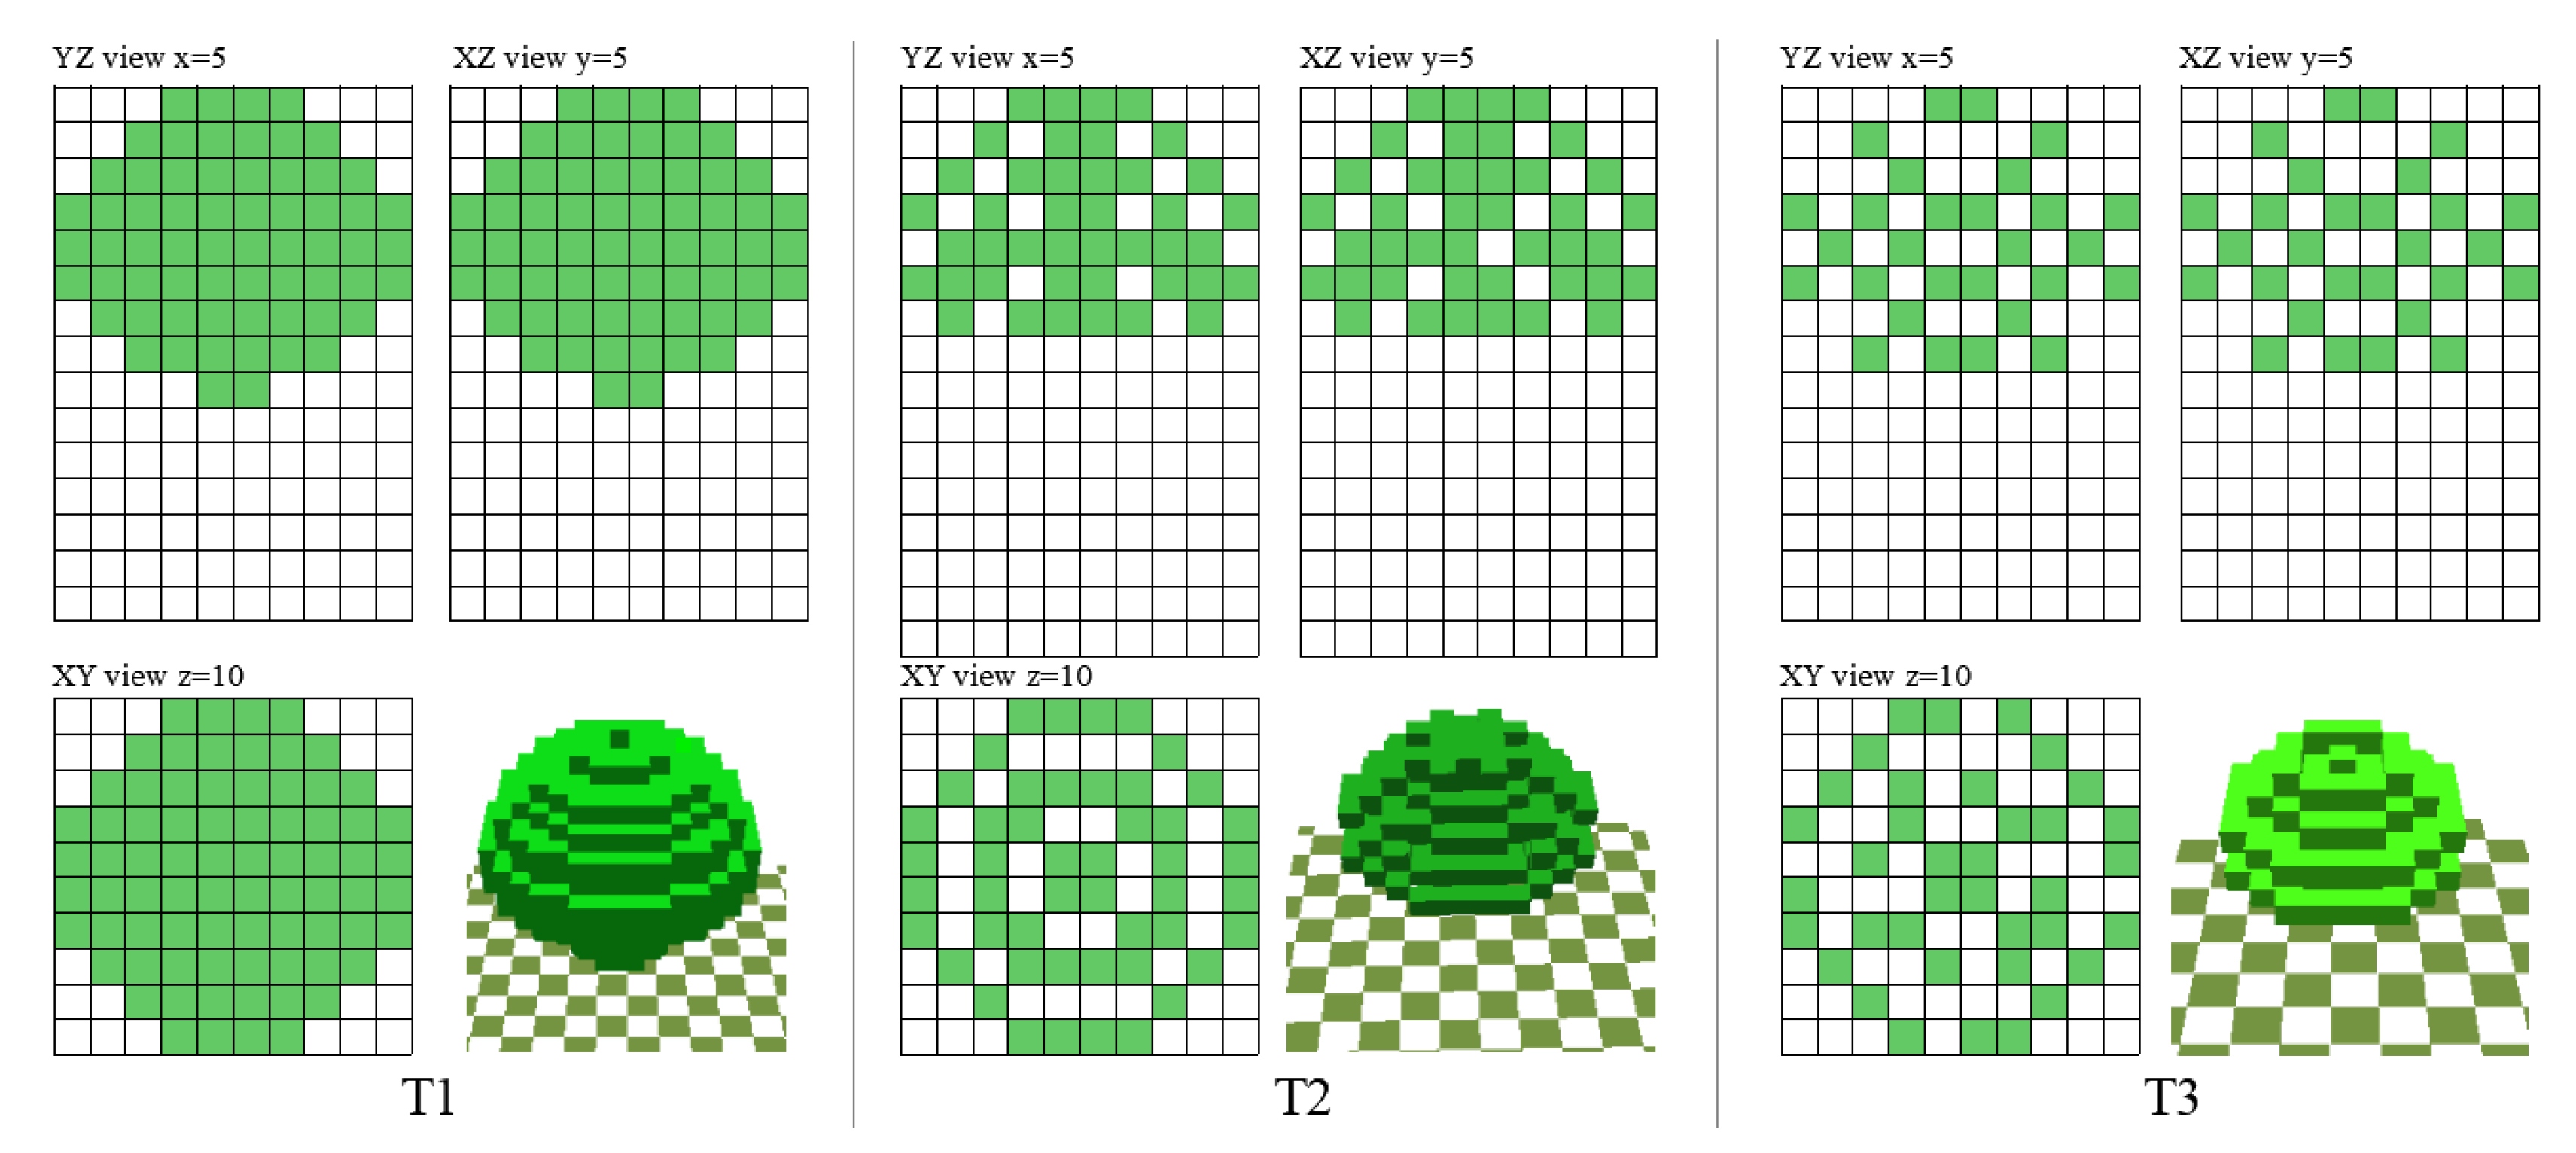
Tree Type Sampling (i)
Or/AR/TC Scenario Design (ii)
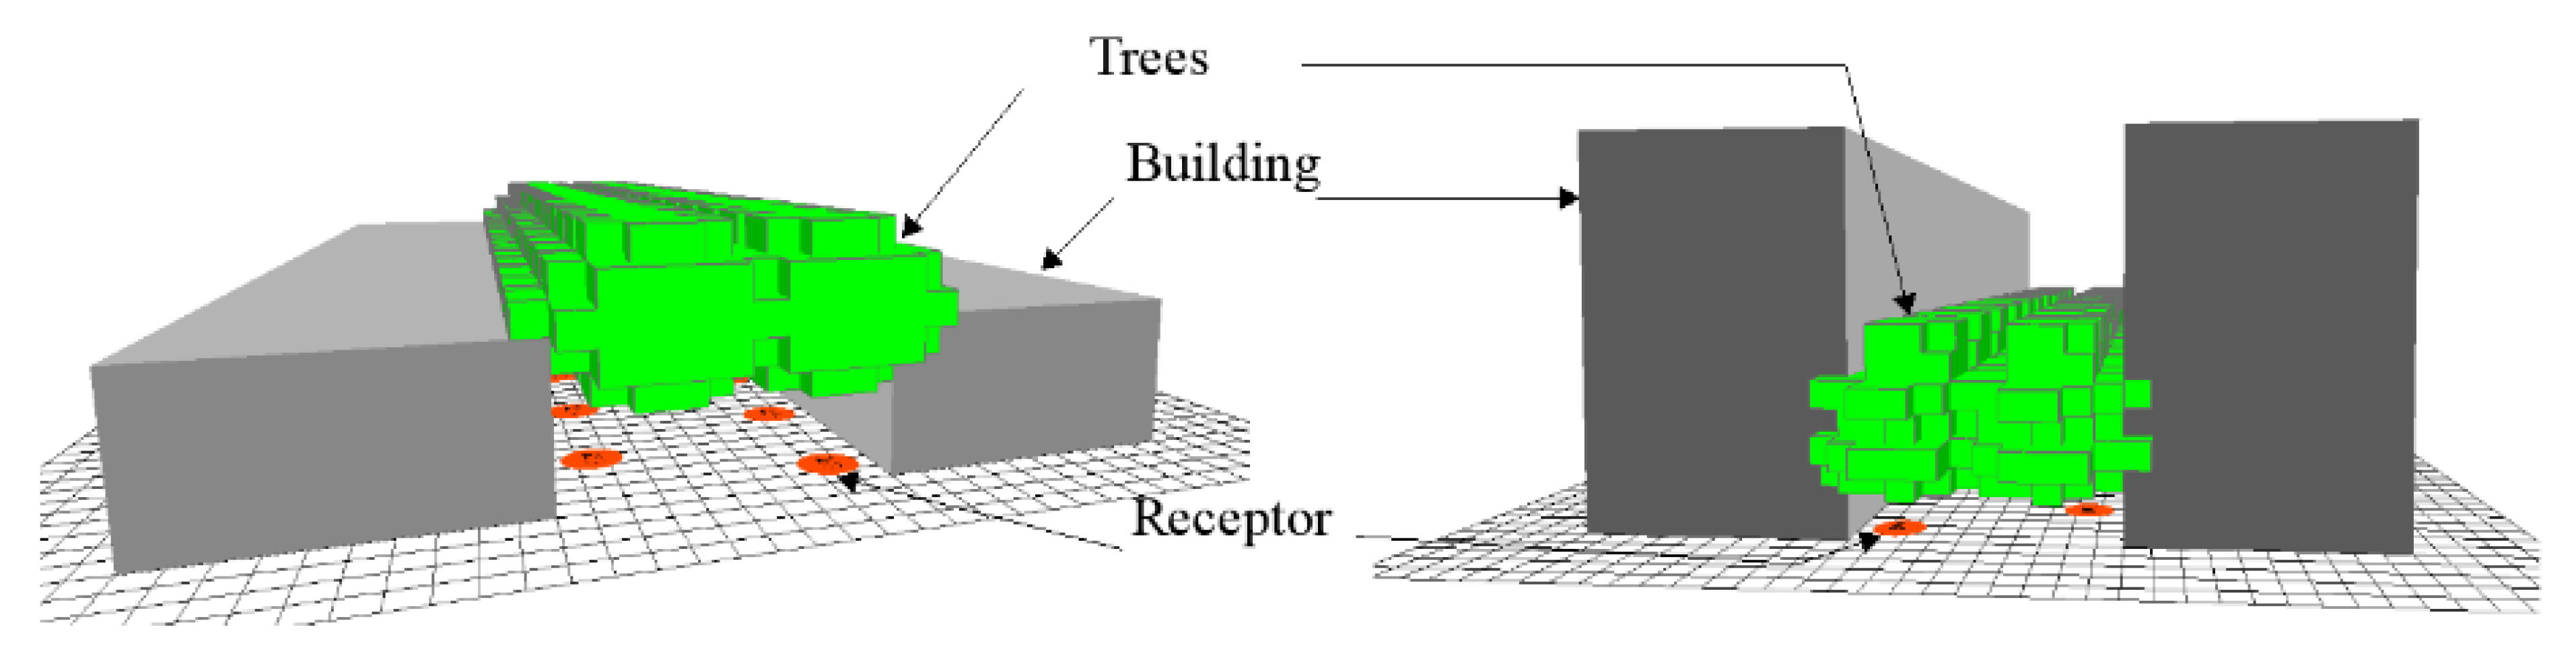
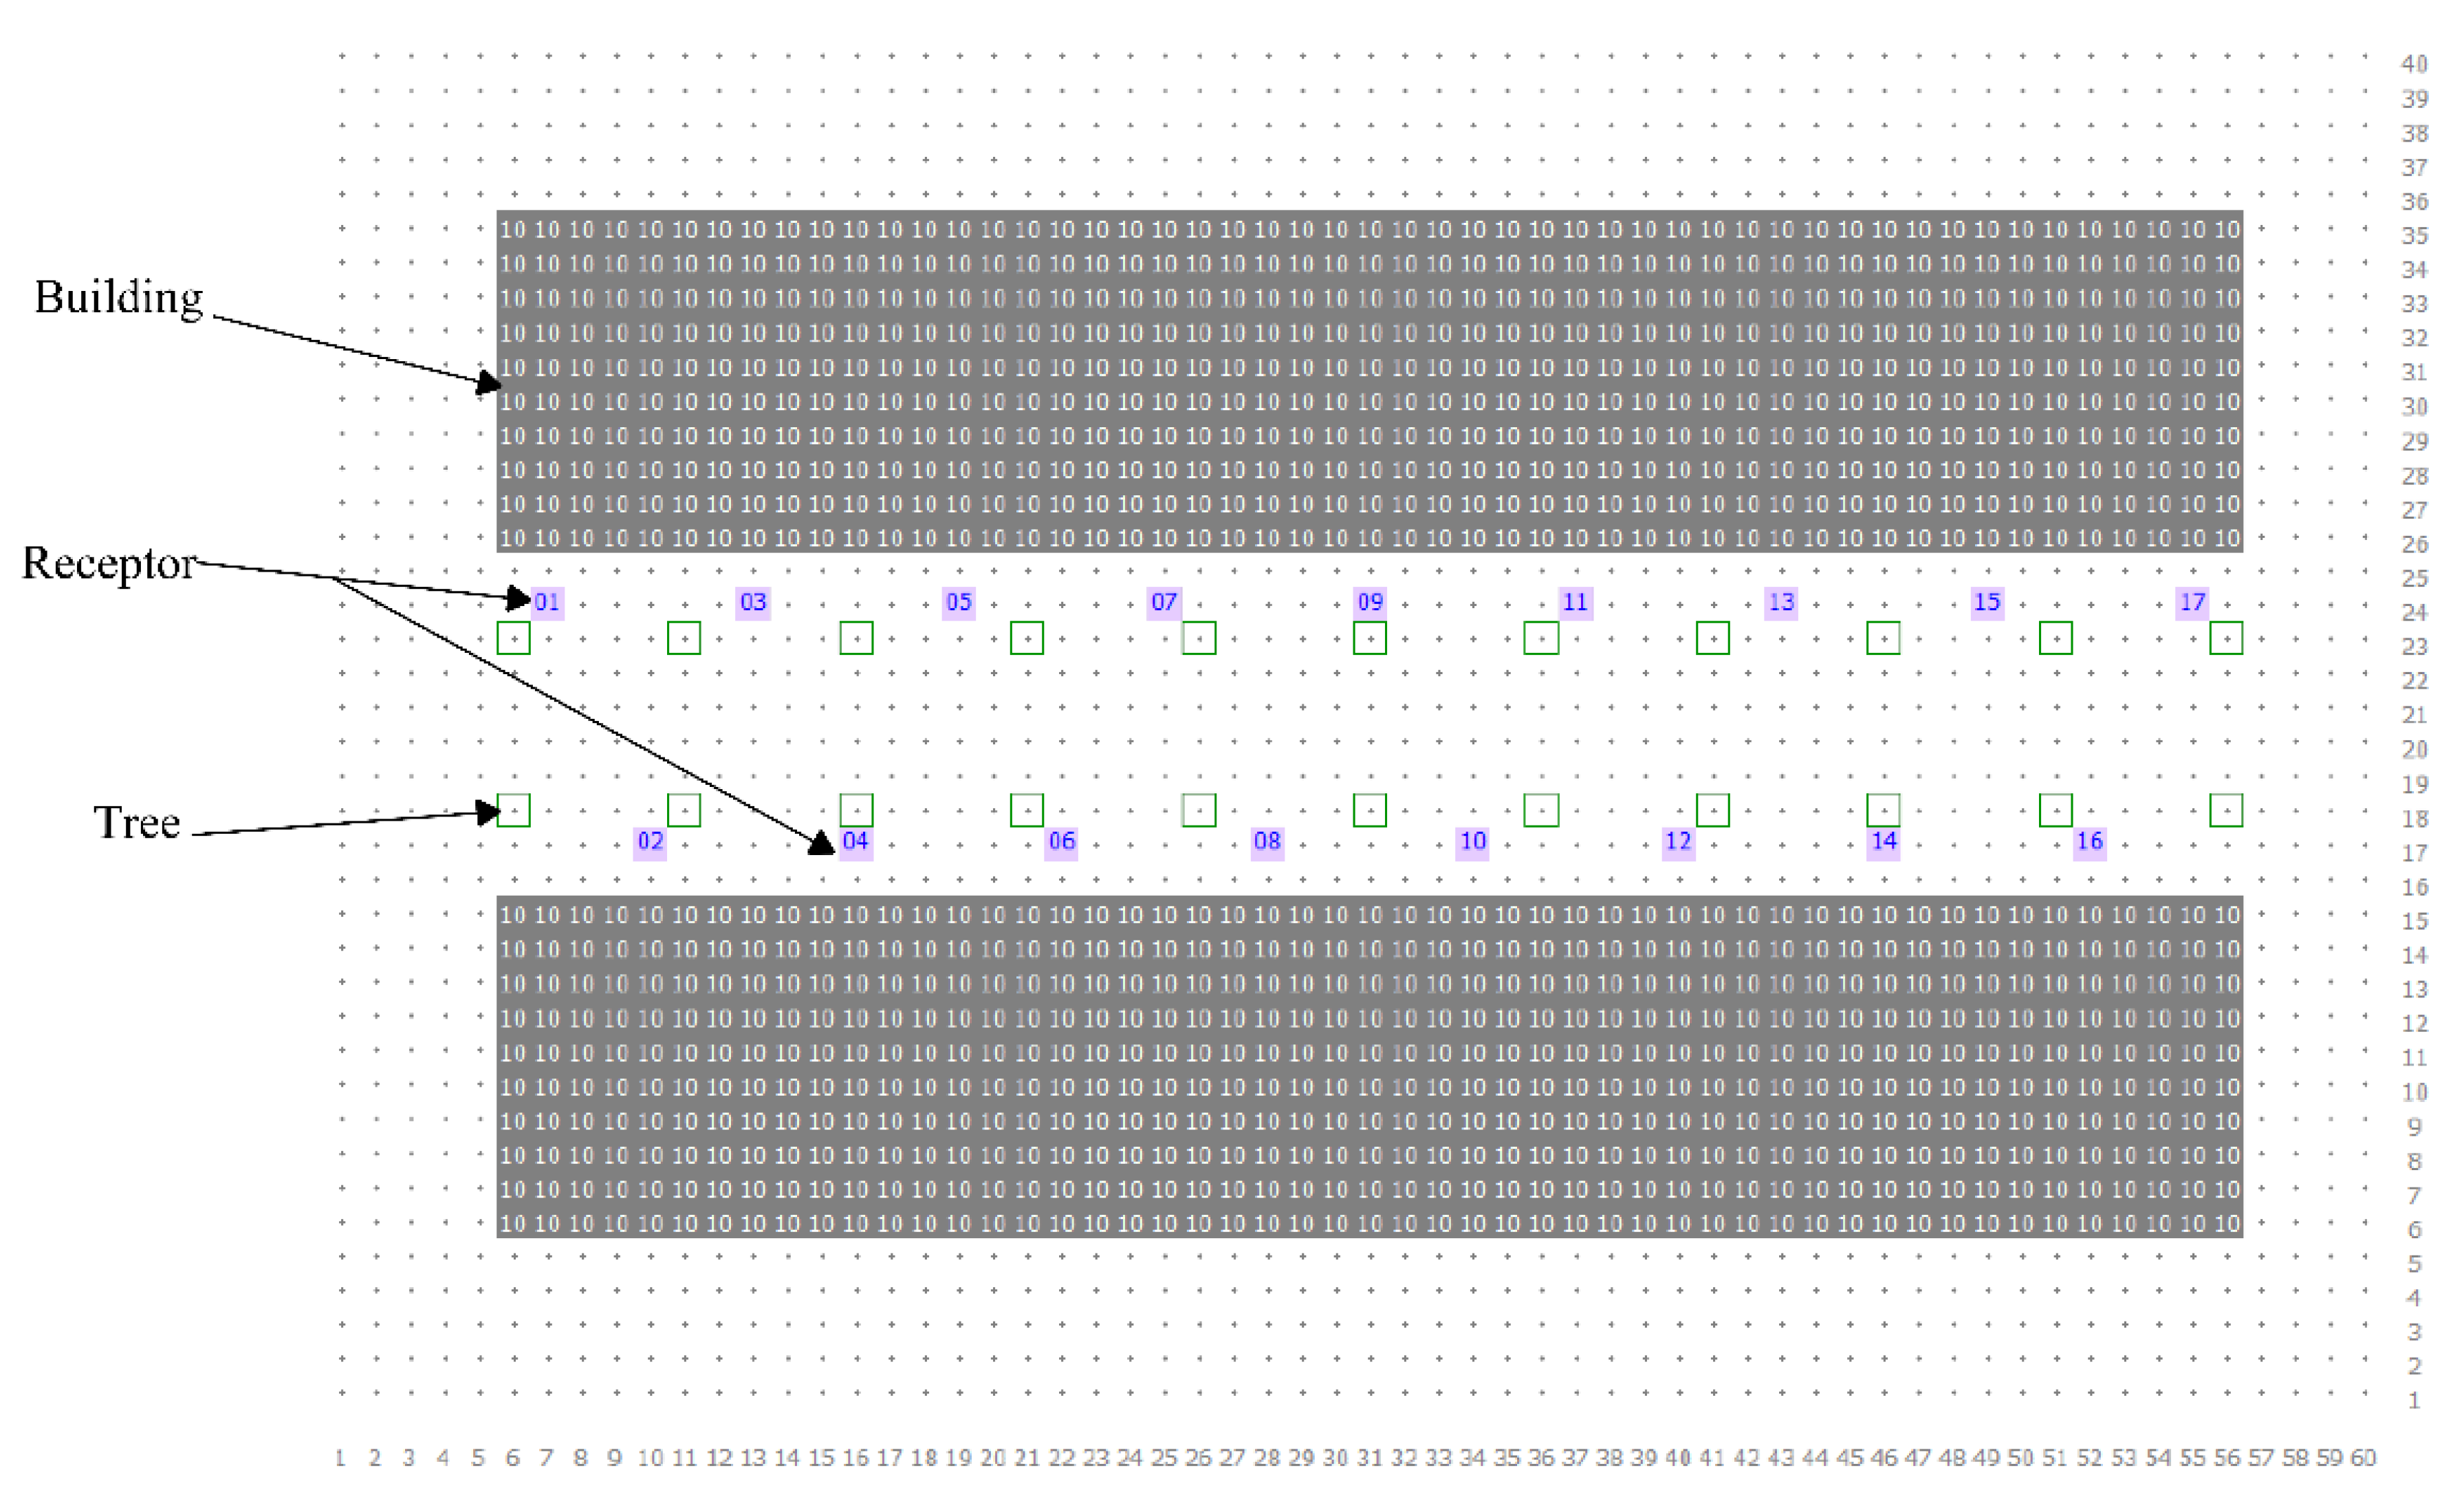
Thermal Comfort Simulations (iii): ENVI-Met Inputs
Output Analysis and Street Tree Guidelines (iv)
3. Results
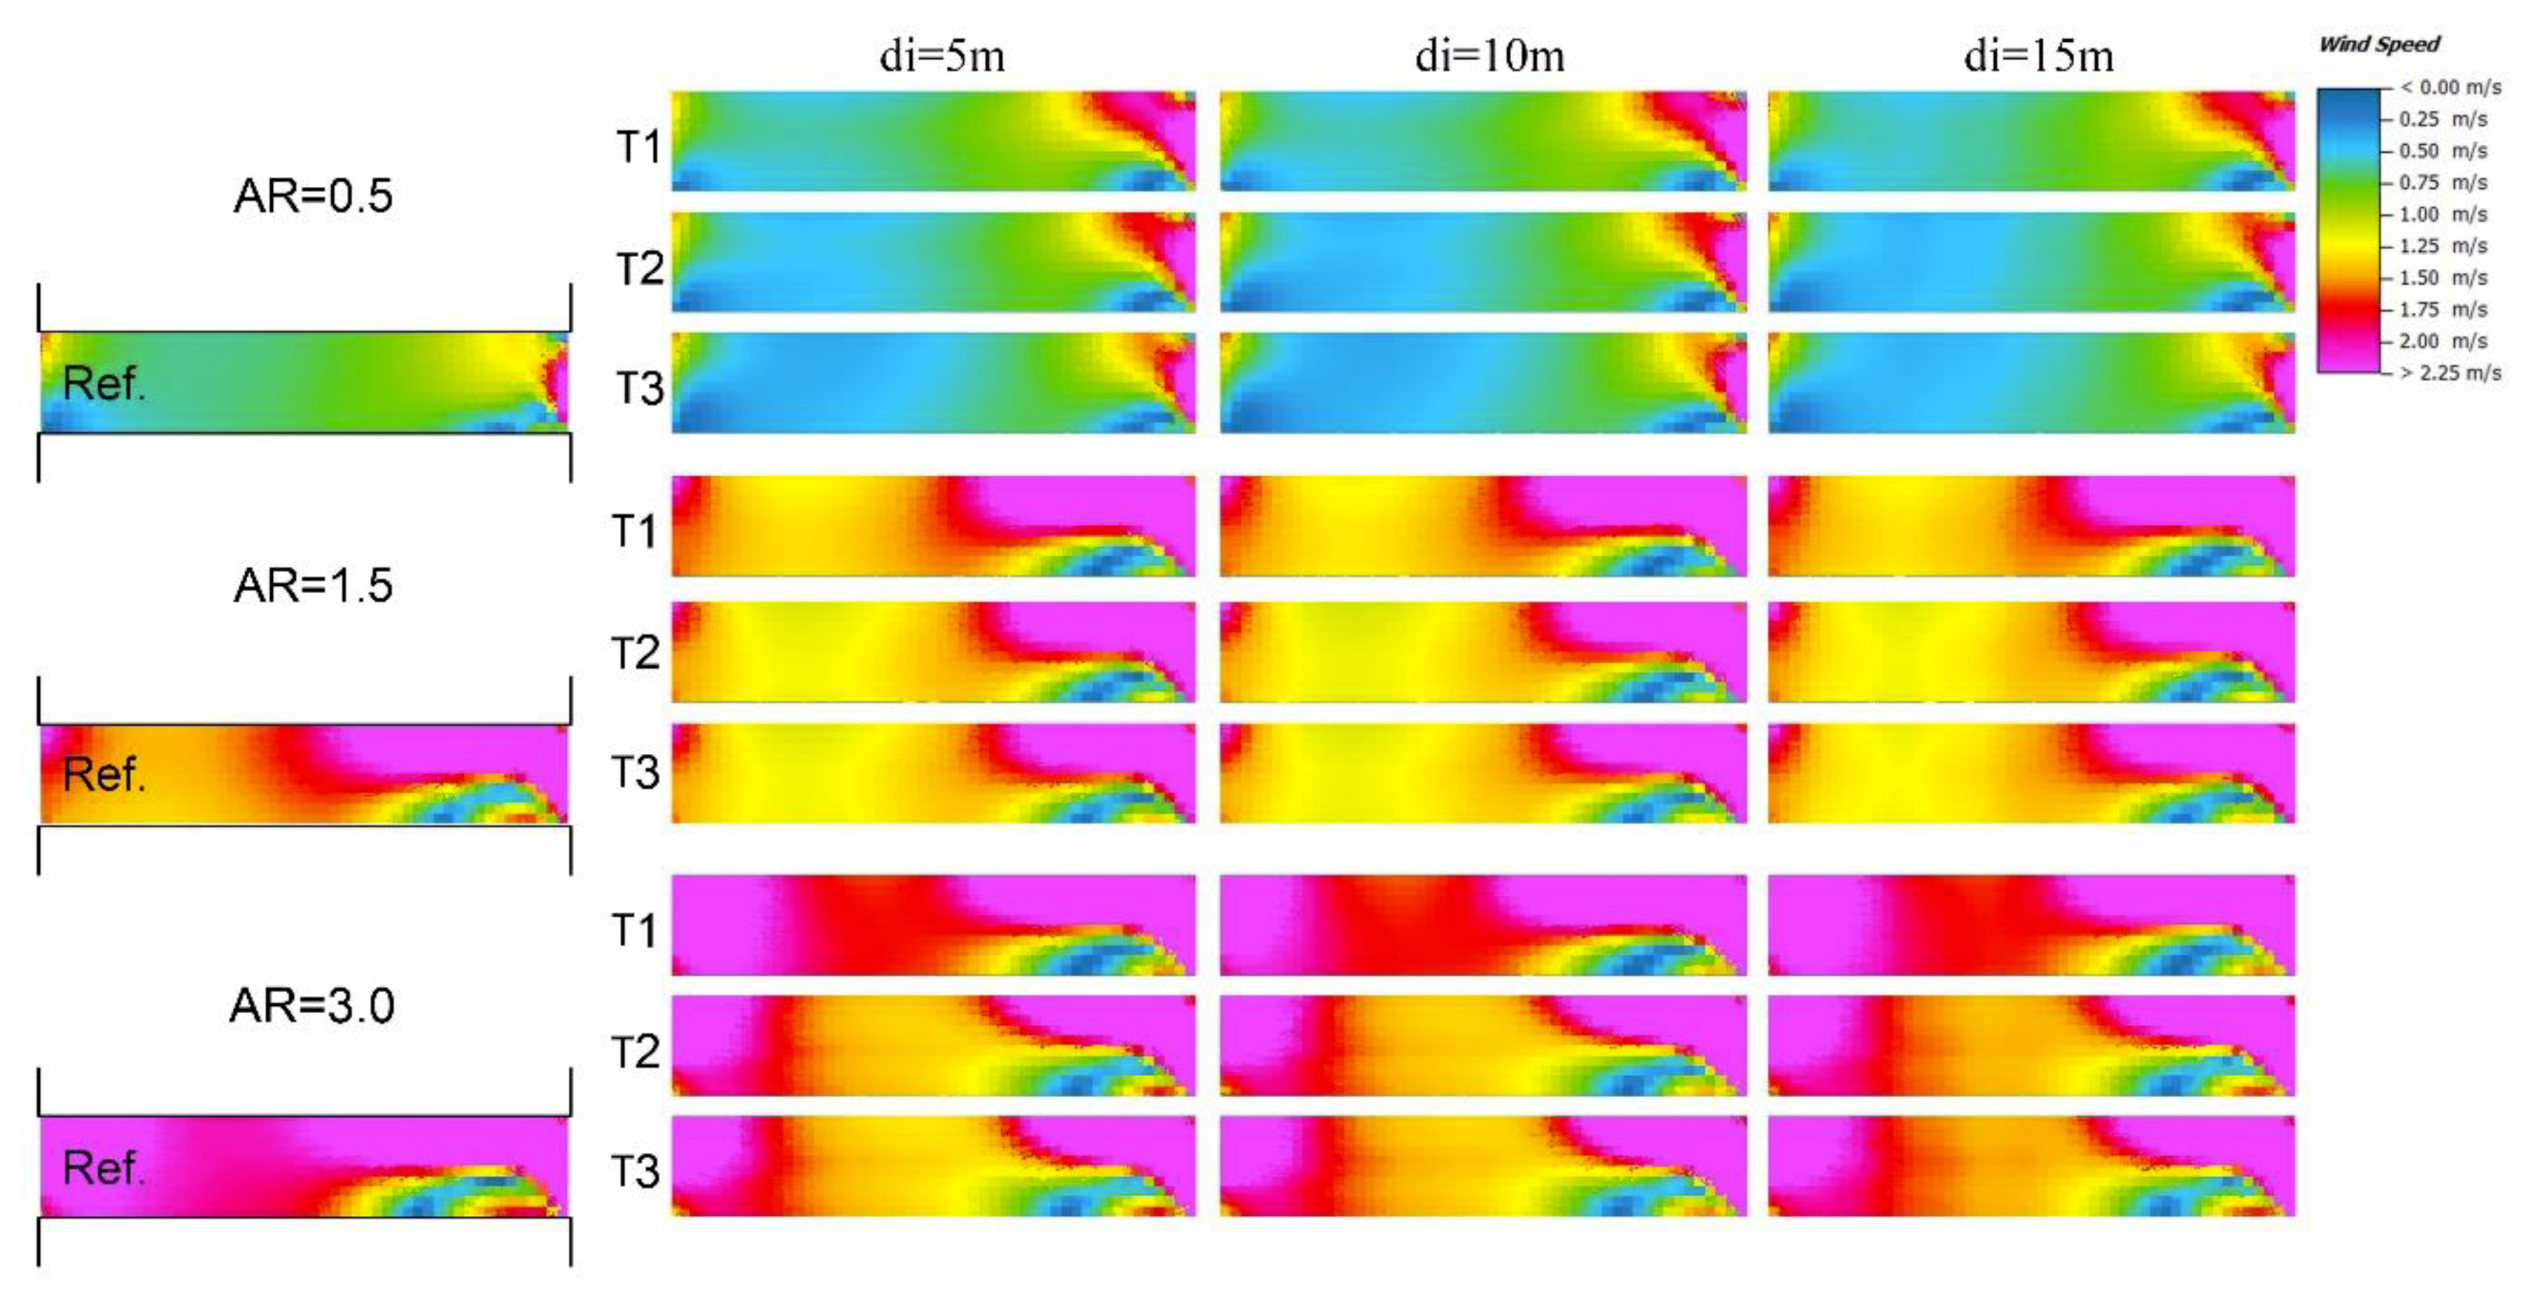
3.1. Wind Speed
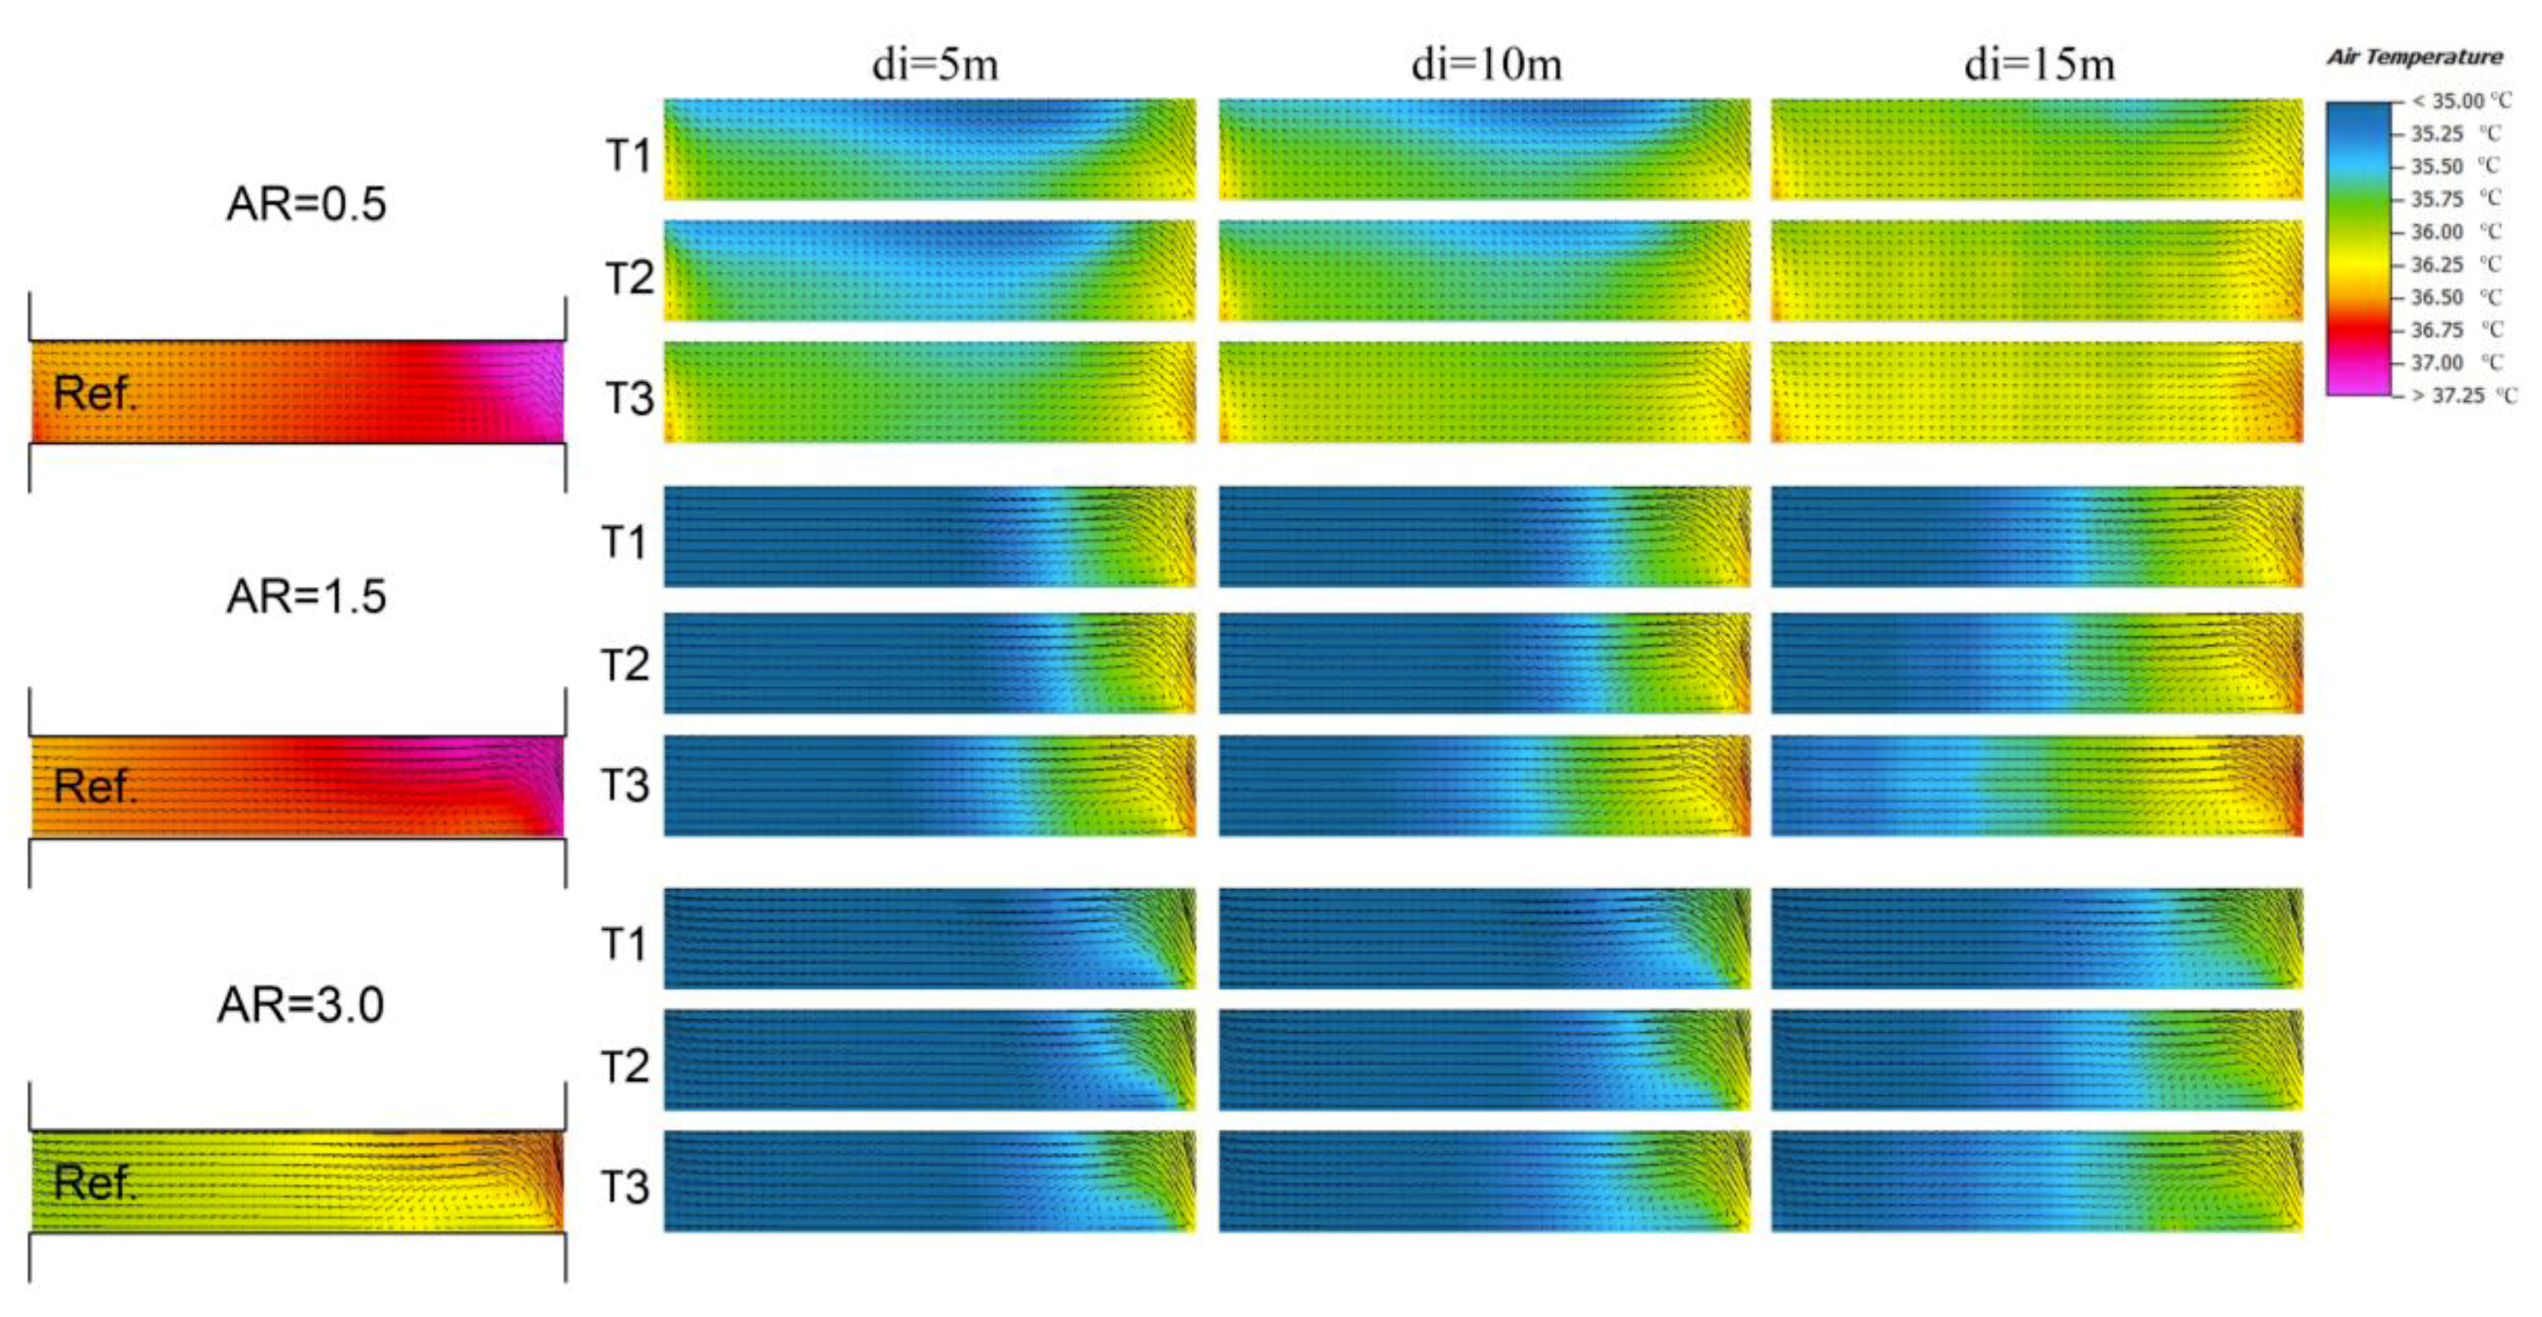
3.2. Air Temperature
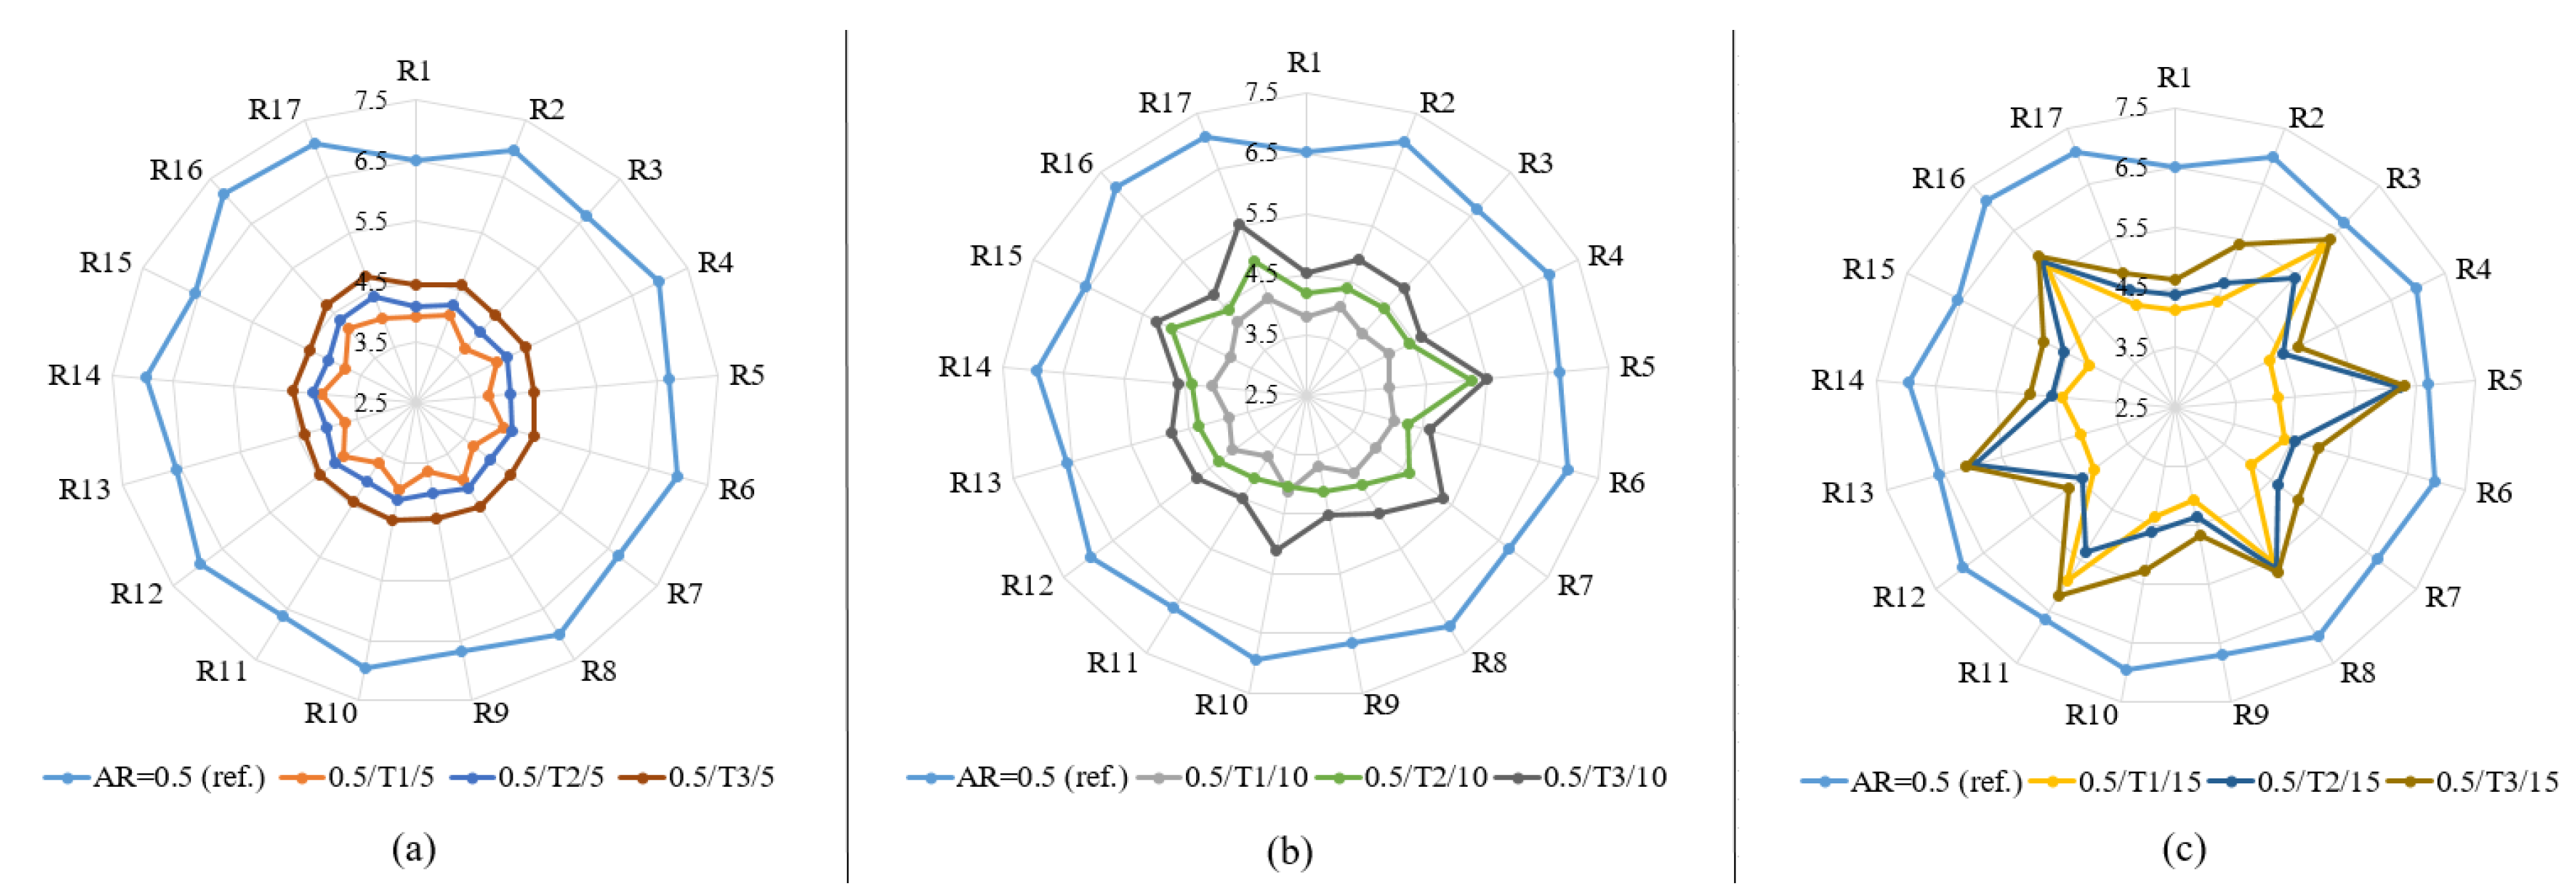
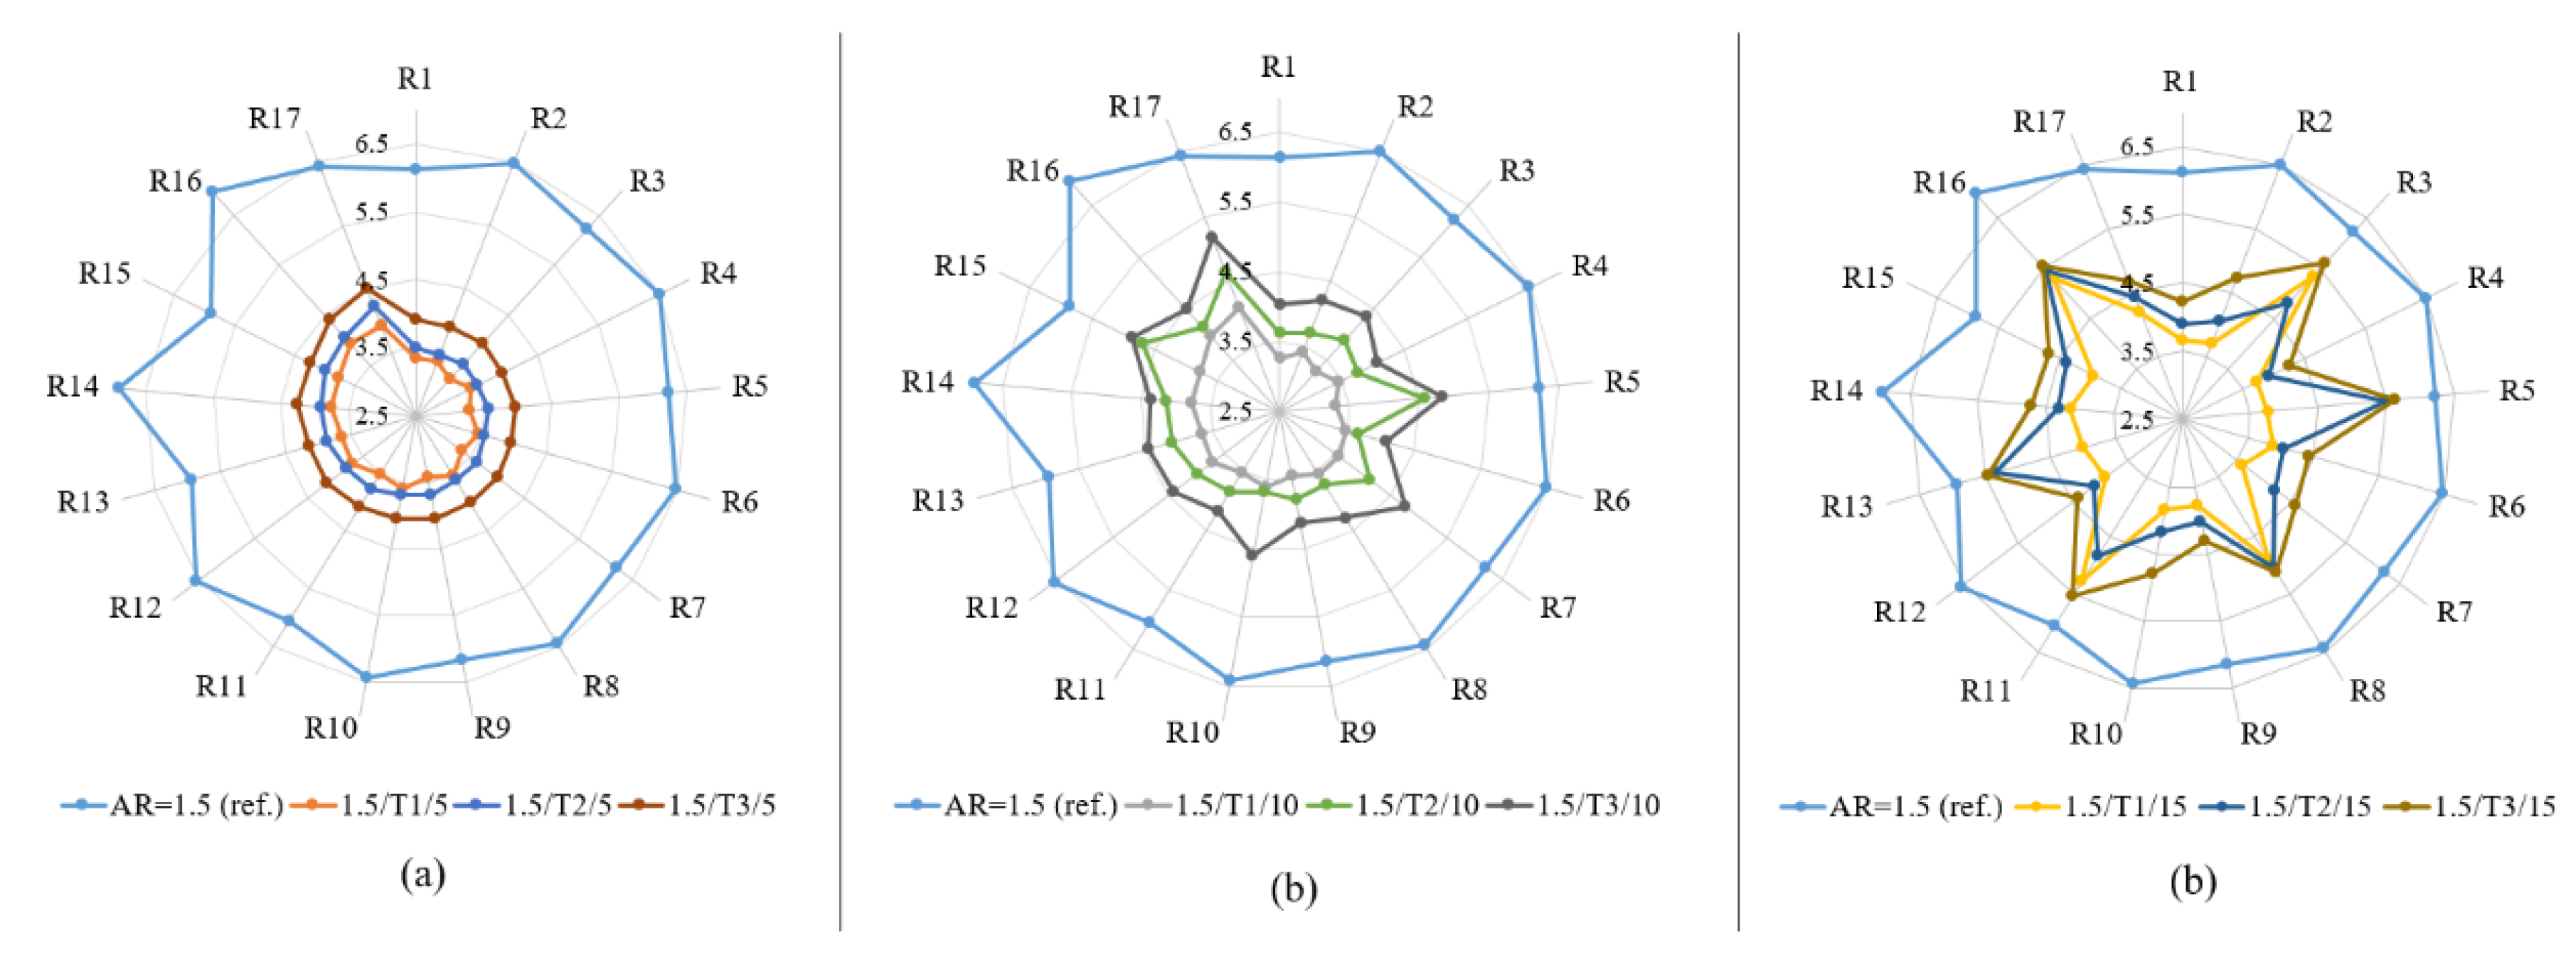
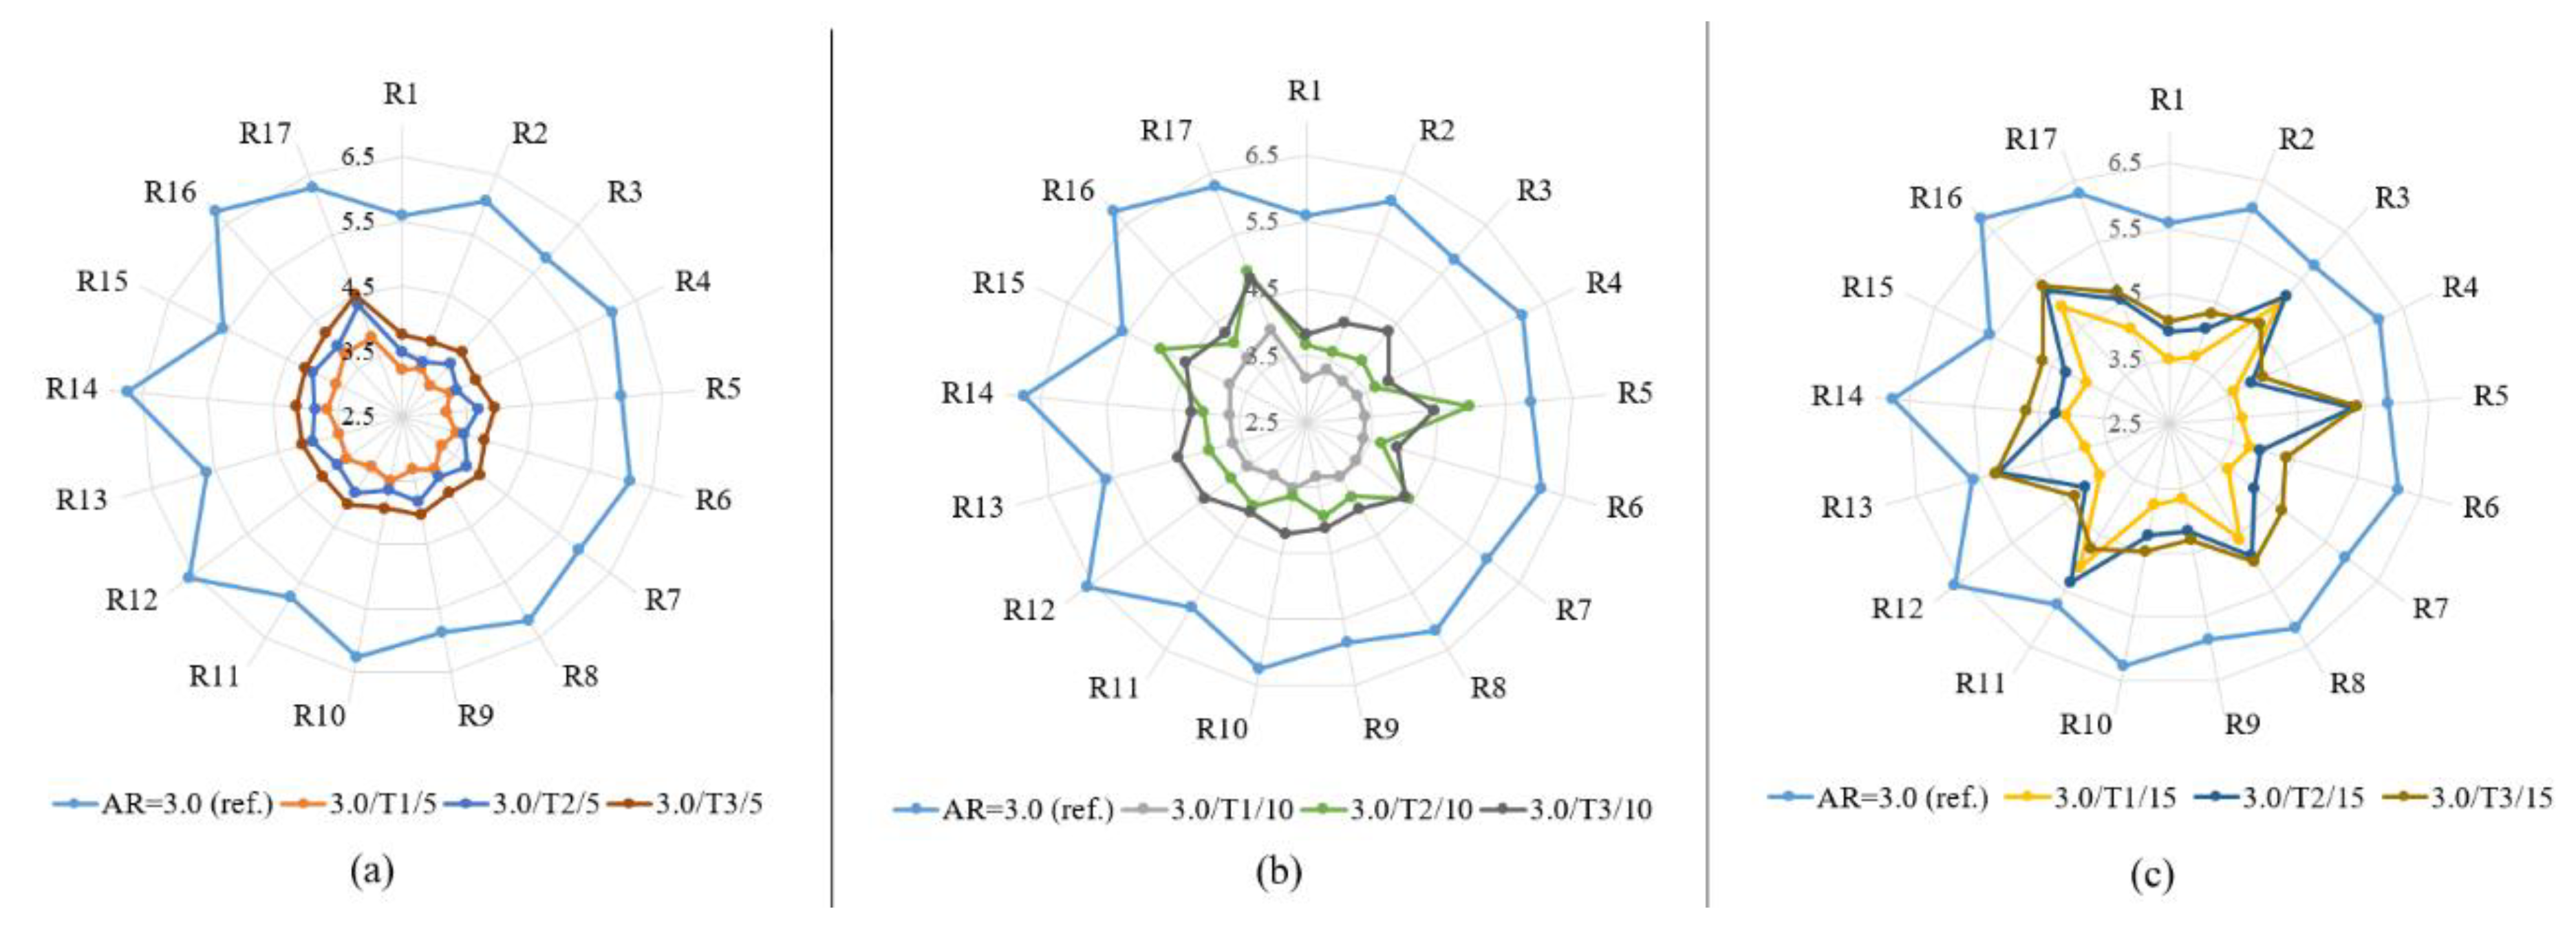
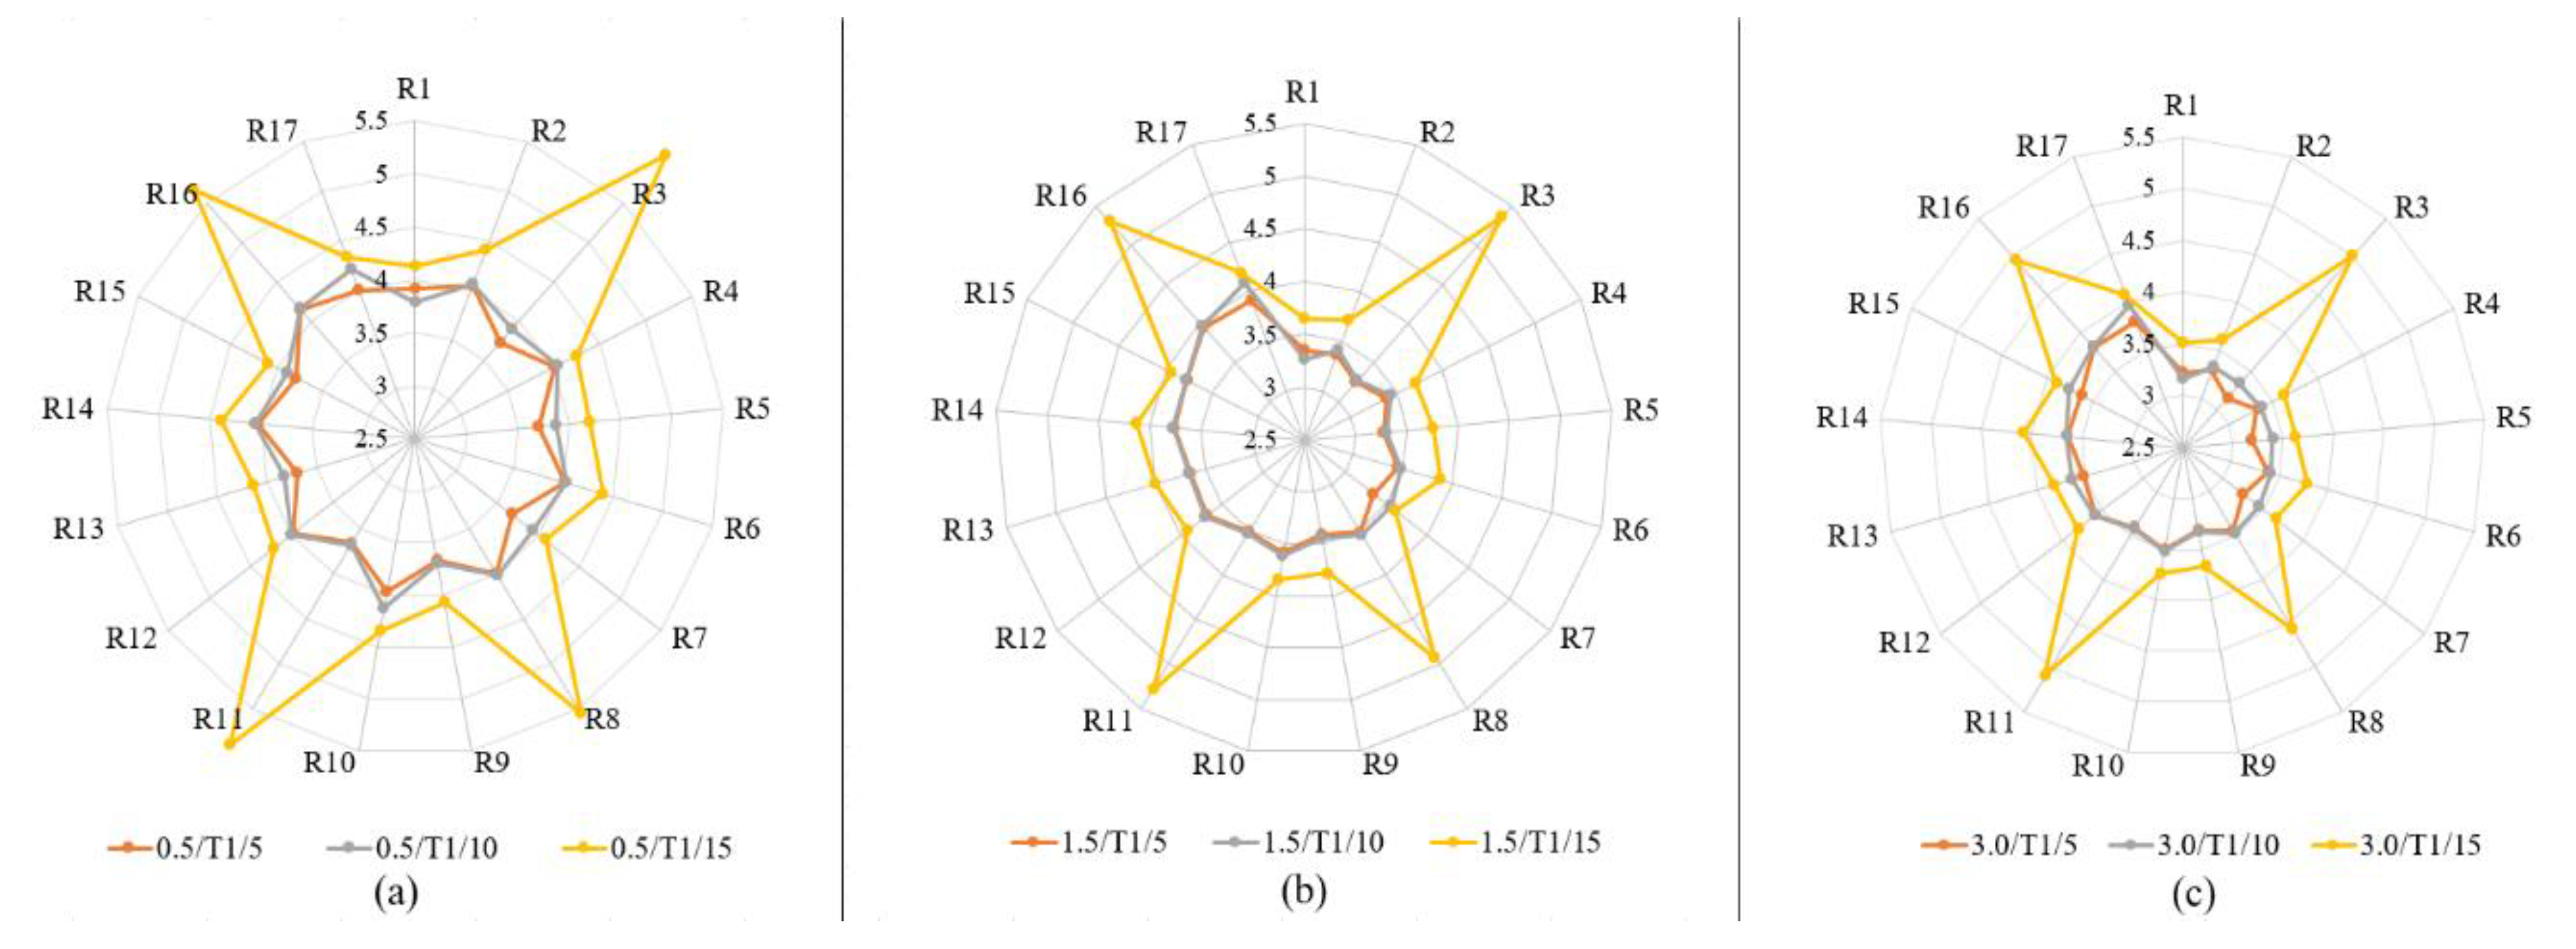
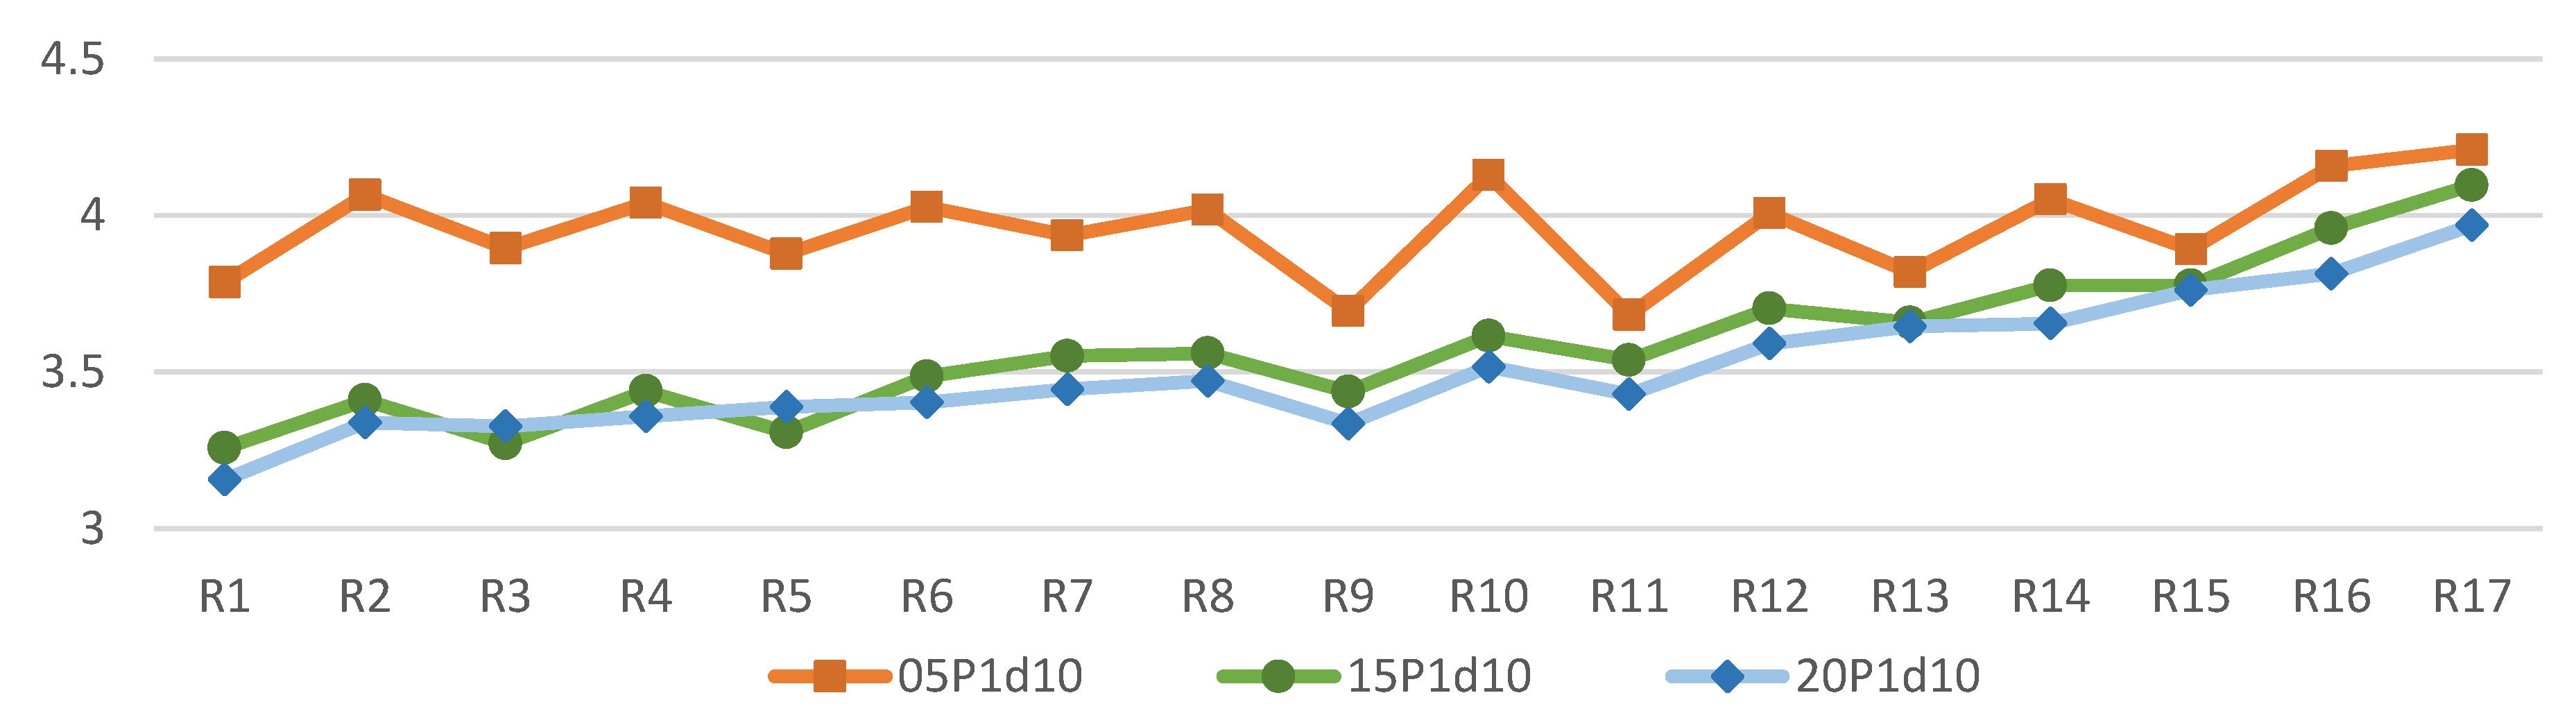
3.3. Predicted Mean Vote
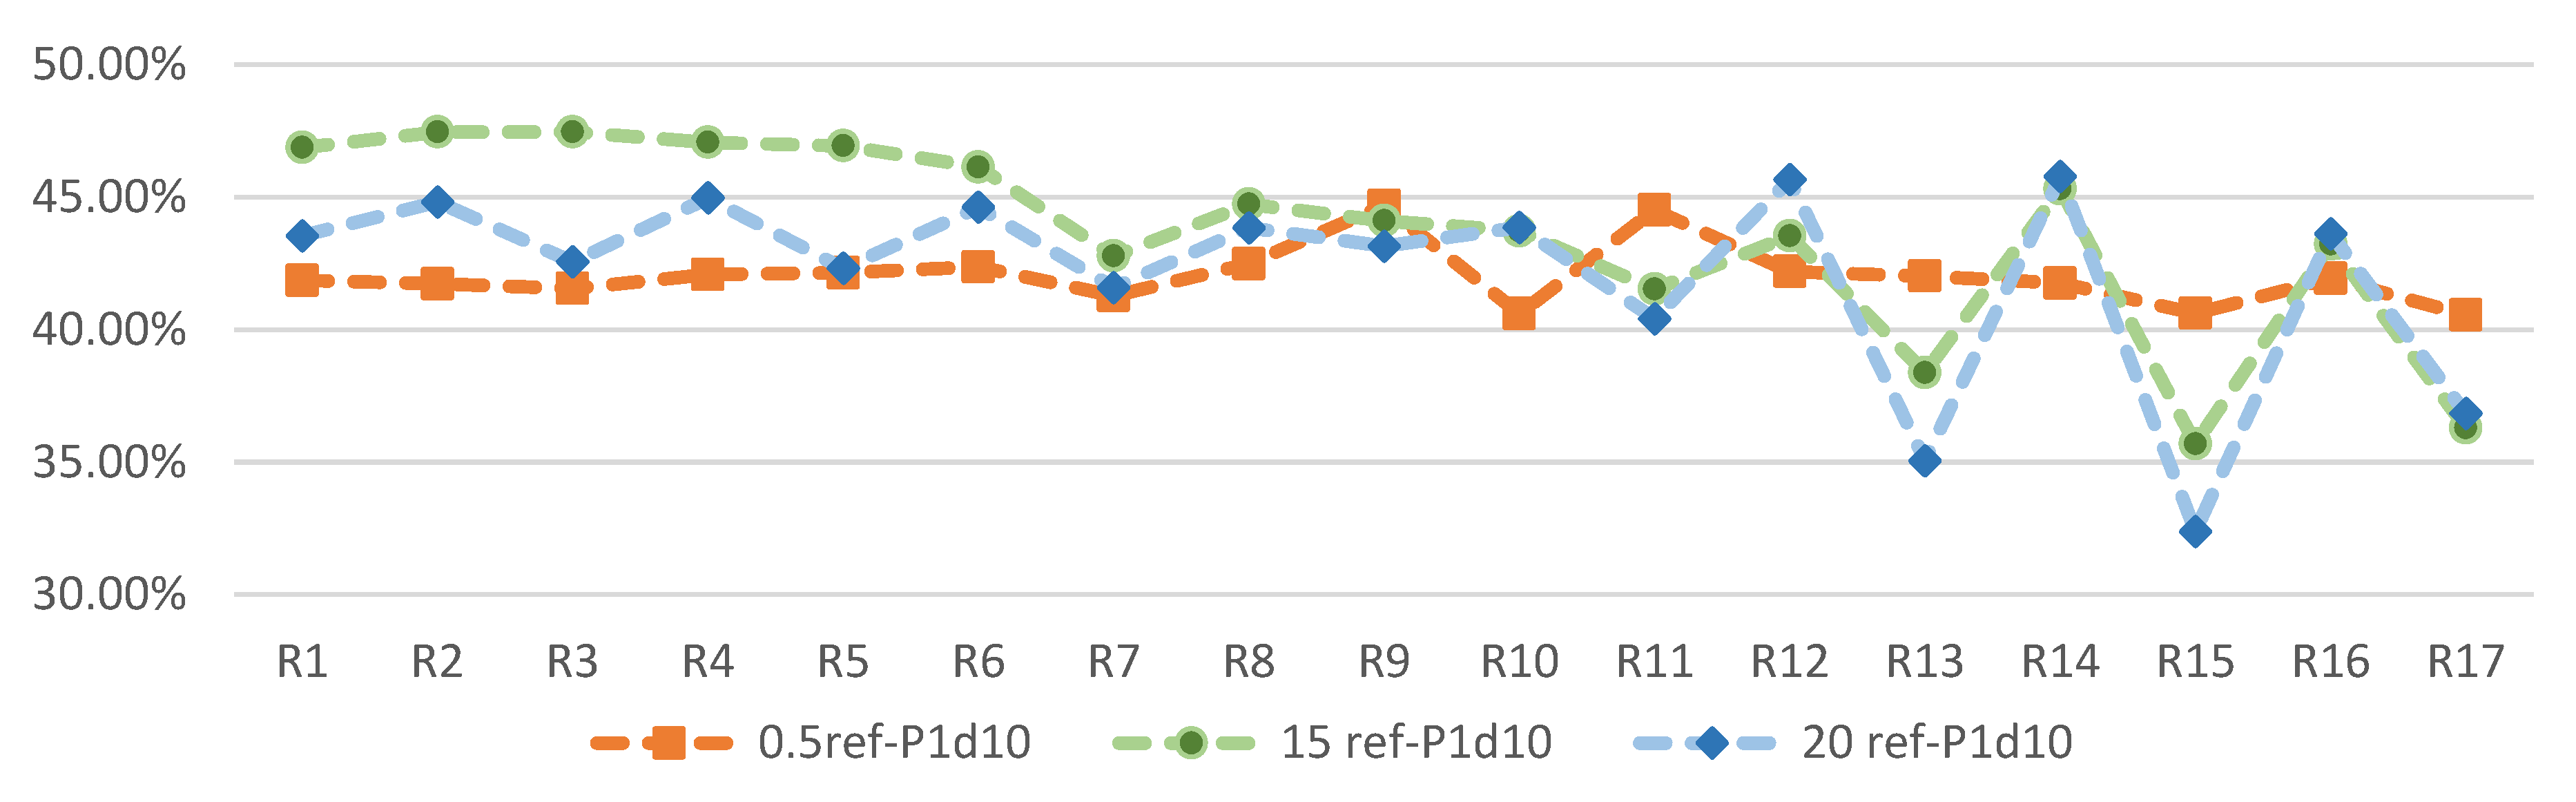
3.4. Heat Mitigation Rate (HMR)
3.5. Summary and Discussions
4. Conclusions
Author Contributions
Funding
Acknowledgments
Conflicts of Interest
References
- Emmanuel, M.R. An Urban Approach to Climate-Sensitive Design: Strategies for the Tropics; Taylor & Francis: London, UK, 2005. [Google Scholar]
- Solomon, S. Climate Change 2007: The Physical Science Basis: Working Group I Contribution to the Fourth Assessment Report of the IPCC; Cambridge University Press: Cambridge, UK, 2007. [Google Scholar]
- Johansson, E.; Thorsson, S.; Emmanuel, R.; Krüger, E. Instruments and methods in outdoor thermal comfort studies—The need for standardization. Urban Clim. 2014, 10, 346–366. [Google Scholar] [CrossRef]
- Ahmad, K.; Khare, M.; Chaudhry, K.K. Wind tunnel simulation studies on dispersion at urban street canyons and intersections—A review. J. Wind Eng. Ind. Aerodyn. 2005, 93, 697–717. [Google Scholar] [CrossRef]
- Vardoulakis, S.; Fisher, B.E.; Pericleous, K.; Gonzalez-Flesca, N. Modelling air quality in street canyons: A review. Atmos. Environ. 2003, 37, 155–182. [Google Scholar] [CrossRef]
- Ali-Toudert, F.; Mayer, H. Numerical study on the effects of aspect ratio and orientation of an urban street canyon on outdoor thermal comfort in hot and dry climate. Build. Environ. 2006, 41, 94–108. [Google Scholar] [CrossRef]
- Rodríguez Algeciras, J.A.; Consuegra, L.G.; Matzarakis, A. Spatial-temporal study on the effects of urban street configurations on human thermal comfort in the world heritage city of Camagüey-Cuba. Build. Environ. 2016, 101, 85–101. [Google Scholar] [CrossRef]
- Lamarca, C.; Qüense, J.; Henríquez, C. Thermal comfort and urban canyons morphology in coastal temperate climate, Concepción, Chile. Urban Clim. 2018, 23, 159–172. [Google Scholar] [CrossRef]
- Silva, J.P. Solar radiation and street temperature as function of street orientation. An analysis of the status quo and simulation of future sccenarios towards sustainability in Bahrain. In E3S Web of Conferences; EDP Sciences: Les Ulis, France, 2017; Volume 23, p. 02002. [Google Scholar]
- Qaid, A.; Ossen, D.R. Effect of asymmetrical street aspect ratios on microclimates in hot, humid regions. Int. J. Biometeorol. 2014, 59, 657–677. [Google Scholar] [CrossRef] [PubMed]
- ASHRAE. ANSI/ASHRAE Standard 55-2013, Thermal Environmental Conditions for Human Occupancy; ASHRAE: Atlanta, GA, USA, 2013. [Google Scholar]
- Freire, R.Z.; Oliveira, G.H.C.; Mendes, N. Predictive controllers for thermal comfort optimization and energy savings. Energy Build. 2008, 40, 1353–1365. [Google Scholar] [CrossRef]
- Korkas, C.D.; Baldi, S.; Michailidis, I.; Kosmatopoulos, E.B. Occupancy-based demand response and thermal comfort optimization in microgrids with renewable energy sources and energy storage. Appl. Energy 2016, 163, 93–104. [Google Scholar] [CrossRef]
- He, S.; Yang, X. Coupling relationship between summer microclimate and spatial layout of street canyons in the white stupa temple area of Beijing. J. Landsc. Res. 2018, 10, 83–89. [Google Scholar] [CrossRef]
- Givoni, B. Impact of planted areas on urban environmental quality: A review. Atmos. Environ. Part B Urban Atmos. 1991, 25, 289–299. [Google Scholar] [CrossRef]
- Gill, S.; Handley, J.; Ennos, A.; Pauleit, S. Adapting cities for climate change: The role of the green infrastructure. Built Environ. 2007, 33, 115–133. [Google Scholar] [CrossRef]
- Fahmy, M.; Sharples, S.; Yahiya, M. LAI based tree sselection for mid latitude urban developments: A micro climatic study in Cairo, Egypt. Build. Environ. 2010, 45, 345–357. [Google Scholar] [CrossRef]
- Wong, N.H.; Yu, C. Study of green areas and urban heat island in a tropical city. Habitat Int. 2005, 29, 547–558. [Google Scholar] [CrossRef]
- Akbari, H.; Pomerantz, M.; Taha, H. Cool surfaces and shade trees to reduce energy use and improve air quality in urban areas. Sol. Energy 2001, 70, 295–310. [Google Scholar] [CrossRef]
- Picot, X. Thermal comfort in urban spaces: Impact of vegetation growth: Case study: Piazza della Scienza, Milan, Italy. Energy Build. 2004, 36, 329–334. [Google Scholar] [CrossRef]
- Jamei, E.; Rajagopalan, P.; Seyedmahmoudian, M.; Jamei, Y. Review on the impact of urban geometry and pedestrian level greening on outdoor thermal comfort. Renew. Sustain. Energy Rev. 2016, 54, 1002–1017. [Google Scholar] [CrossRef]
- Ali-Toudert, F.; Mayer, H. Effects of asymmetry, galleries, overhanging façades and vegetation on thermal comfort in urban street canyons. Sol. Energy 2007, 81, 742–754. [Google Scholar] [CrossRef]
- Lin, B.; Li, X.; Zhu, Y.; Qin, Y. Numerical simulation studies of the different vegetation patterns’ effects on outdoor pedestrian thermal comfort. J. Wind Eng. Ind. Aerodyn. 2008, 96, 1707–1718. [Google Scholar] [CrossRef]
- Shashua-Bar, L.; Tsiros, I.X.; Hoffman, M.E. A modeling study for evaluating passive cooling scenarios in urban streets with trees: Case study—Athens, Greece. Build. Environ. 2010, 45, 2798–2807. [Google Scholar] [CrossRef]
- Shashua-Bar, L.; Tsiros, I.X.; Hoffman, M.E. Passive cooling design options to ameliorate thermal comfort in urban streets of a Mediterranean climate (Athens) under hot summer conditions. Build. Environ. 2012, 57, 110–119. [Google Scholar] [CrossRef]
- Andreou, E. Thermal comfort in outdoor spaces and urban canyon microclimate. Renew. Energy 2013, 55, 182–188. [Google Scholar] [CrossRef]
- Coutts, A.M.; White, E.C.; Tapper, N.J.; Beringer, J.; Livesley, S.J. Temperature and human thermal comfort effects of street trees across three contrasting street canyon environments. Theor. Appl. Climatol. 2016, 124, 55–68. [Google Scholar] [CrossRef]
- Bowler, D.E.; Buyung-Ali, L.; Knight, T.M.; Pullin, A.S. Urban greening to cool towns and cities: A systematic review of the empirical evidence. Landsc. Urban Plan. 2010, 97, 147–155. [Google Scholar] [CrossRef]
- Ivana, V.B.; Dragan, D.M.; Stevan, M.S. Evaluation and improvement of outdoor thermal comfort in urban areas on extreme temperature days: Applications of automatic algorithms. Build. Environ. 2015, 94, 632–643. [Google Scholar] [CrossRef]
- Dragan, D.M.; Ivana, V.B.; Stevan, M.S. Influence of changing trees locations on thermal comfort on street parking lot and footways. Urban For. Urban Green. 2017, 23, 113–124. [Google Scholar] [CrossRef]
- Van Hoof, J.; Mazej, M.; Hensen, J.L. Thermal comfort: Research and practice. Front. Biosci. 2010, 15, 765–788. [Google Scholar] [CrossRef]
- Höppe, P. The physiological equivalent temperature—A universal index for the biometeorological assessment of the thermal environment. Int. J. Biometeorol. 1999, 43, 71–75. [Google Scholar] [CrossRef] [PubMed]
- Chen, Y.C.; Matzarakis, A. Modified physiologically equivalent temperature—Basics and applications for western European climate. Theor. Appl. Climatol. 2018, 132, 1275–1289. [Google Scholar] [CrossRef]
- Ye, G.; Yang, C.; Chen, Y.; Li, Y. A new approach for measuring predicted mean vote (PMV) and standard effective temperature (SET∗). Build. Environ. 2003, 38, 33–44. [Google Scholar] [CrossRef]
- Blazejczyk, K.; Jendritzky, G.; Broede, P.; Fiala, D.; Havenith, G.; Epstein, Y.; Psikuta, A.; Kampmann, B. An introduction to the Universal Thermal Climate Index (UTCI). Geogr. Pol. 2013, 86, 5–10. [Google Scholar] [CrossRef]
- Fröhlich, D.; Matzarakis, A. RayMan Manual Version 0.1; Research Centre Human Biometeorology, German Meteorological Service: Freiburg, Germany, 2017. [Google Scholar]
- Matzarakis, A.; Rutz, F.; Mayer, H. Modelling radiation fluxes in simple and complex environments: Basics of the RayMan model. Int. J. Biometeorol. 2010, 54, 131–139. [Google Scholar] [CrossRef] [PubMed]
- Ozkeresteci, I.; Crewe, K.; Brazel, A.J.; Bruse, M. Use and evaluation of the Envi-met model for environmental design and planning: An experiment on linear parks. In Proceedings of the 21st International Cartographic Conference, Durban, South Africa, 10–16 August 2003; Available online: https://pdfs.semanticscholar.org/b74e/913b1d0b54269ed5e661238b428c1ad671e2.pdf (accessed on 2 November 2018).
- National Bureau of Statistics. China City Statistical Yearbook 2016. Available online: http://www.yearbookchina.com/navibooklist-N2017060038-1.html (accessed on 24 August 2018).
- Geiger, R. “Klassifikation der Klimate nach W. Köppen” [Classification of Climates after W. Köppen]. Landolt-Börnstein—Zahlenwerte und Funktionen aus Physik, Chemie, Astronomie, Geophysik und Technik, alte Serie; Springer: Berlin, Germany, 1954; Volume 3, p. 603. [Google Scholar]
- Geiger, R. Überarbeitete Neuausgabe von Geiger, R.: Köppen-Geiger/Klima der Erde; (Wandkarte 1:16 Mill.); Klett-Perthes: Gotha, Germany, 1961. [Google Scholar]
- Weatherbase. Shantou, China. Available online: https://www.weatherbase.com/weather/weather-summary.php3?s=61395&cityname=Shantou,+China (accessed on 24 August 2018).
- China Ground Climate Data International Exchange Station Data Set Station Information. Available online: http://www.360doc.com/document/12/0123/21/8088674_181500436.shtml (accessed on 24 August 2018).
- Höppe, P. Heat balance modelling. Experientia 1993, 49, 741–746. [Google Scholar] [CrossRef] [PubMed]
- VDI. Methods for the Human Biometeorological Evaluation of Climate and Air Quality for the Urban and Regional Planning. Part I: Climate; VDI Guildline 3787; Part 2; Beuth: Berlin, Germany, 1998. [Google Scholar]
- Fanger, P.O. Thermal Comfort; McGraw-Hill Book Company: New York, NY, USA, 1972; p. 244. [Google Scholar]
- Gagge, A.P.; Fobelets, A.P.; Berglund, P.E. A standard predictive index of human response to the thermal environment. In Proceedings of the ASHRAE Annual Meeting, Portland, OR, USA, 22 June 1986. [Google Scholar]
- Matzarakis, A.; Rutz, F.; Mayer, H. Estimation and calculation of the mean radian temperature within urban structures. In Biometeorology and Urban Climatology at the Turn of the Millennium; Dera, R.J., Kalma, J.D., Oke, T.R., Auliciems, A., Eds.; Selected Papers from the Conference ICB-ICUC99, WCASP-50,WMO/TD No. 1026; World Meteorological Organization: Geneva, Switzerland, 2000; pp. 273–278. [Google Scholar]
- Spagnolo, J.; de Dear, R. A field study of thermal comfort in outdoor and semi-outdoor environments in subtropical Sydney Australia. Build. Environ. 2003, 38, 721–738. [Google Scholar] [CrossRef]
- Gulyas, A.; Unger, J.; Matzarakis, A. Assessment of the microclimatic and human comfort conditions in a complex urban environment: Modelling and measurements. Build. Environ. 2006, 41, 1713–1722. [Google Scholar] [CrossRef]
- Wang, Y.; Bakker, F.; de Groot, R.; Wortche, H.; Leemans, R. Effects of urban trees on local outdoor microclimate: Synthesizing field measurements by numerical modelling. Urban Ecosyst. 2015, 18, 1305–1331. [Google Scholar] [CrossRef]
- Zheng, T.; Kevin, K.L.; Edward, N. Urban tree design approaches for mitigating daytime urban heat island effects in a high-density urban environment. Energy Build. 2016, 114, 265–274. [Google Scholar] [CrossRef]
- Hwang, R.-L.; Lin, T.-P.; Matzarakis, A. Seasonal effects of urban street shading on long-term outdoor thermal comfort. Build. Environ. 2011, 46, 863–870. [Google Scholar] [CrossRef]
- International Standardization Organization. ISO 7730: Ergonomics of the Thermal Environment—Analytical Determination and Interpretation of Thermal Comfort Using Calculation of the PMV and PPD Indices and Local Thermal Comfort Criteria. 2005. Available online: https://www.iso.org/standard/39155.html (accessed on 15 September 2018).
- Matzarakis, A.; Mayer, H. Another Kind of Environmental Stress: Thermal Stress. WHO Collaborating Centre for Air Quality Management and Air Pollution Control. Newsletters 1996, 18, 7–10. [Google Scholar]
- Matzarakis, A.; Mayer, H.; Iziomon, M. Applications of a universal thermal index: Physiological equivalent temperature. Int. J. Biometeorol. 1999, 43, 76. [Google Scholar] [CrossRef] [PubMed]
- Memon, R.A.; Leung, D.Y.; Liu, C.H. Effects of building aspect ratio and wind speed on air temperatures in urban-like street canyons. Build. Environ. 2010, 45, 176–188. [Google Scholar] [CrossRef]
- Fang, H.; Xin, R.; Xiao, Z. Selection and Deployment of Tree Species for Urban Road Afforestation in Shantou City. J. Chin. Urban For. 2008, 6, 32–33. [Google Scholar]
- Kotzen, B. An investigation of shade under six different tree species of the Negev desert towards their potential use for enhancing micro-climatic conditions in landscape architectural development. J. Arid Environ. 2003, 55, 231–274. [Google Scholar] [CrossRef]
- Montague, T.; Kjelgren, R. Energy balance of six common landscape surfaces and the influence of surface properties on gas exchange of four containerized tree species. Sci. Hortic. 2004, 100, 229–249. [Google Scholar] [CrossRef]
- Shahidan, M.F.; Shariff, M.K.; Jones, P.; Salleh, E.; Abdullah, A.M. A comparison of Mesua ferrea L. and Huracrepitans L. for shade creation and radiation modification in improving thermal comfort. Landsc. Urban Plan. 2010, 97, 168–181. [Google Scholar] [CrossRef]
- ENVI-met. A1. Configuration File: Basic Settings. Available online: http://www.envi-met.info/documents/onlinehelpv3/hs60.htm (accessed on 24 August 2018).
- Johnson, D. Urban modification of diurnal temperature cycles in Birmingham, UK. J. Climatol. 1985, 5, 221–225. [Google Scholar] [CrossRef]
- Yamashita, S.; Sekine, K.; Shoda, M.; Yamashita, K.; Hara, Y. On relationships between heat island and sky view factor in the cities of Tama River basin, Japan. Atmos. Environ. (1967) 1986, 20, 681–686. [Google Scholar] [CrossRef]
- Unger, J. Intra-urban relationship between surface geometry and urban heat island: Review and new approach. Clim. Res. 2004, 27, 253–264. [Google Scholar] [CrossRef]
- Svens son, M.K. Sky view factor analysis—Implications for urban air temperature differences. Meteorol. Appl. 2004, 11, 201–211. [Google Scholar] [CrossRef]
- Yan, H.; Fan, S.; Guo, C.; Wu, F.; Zhang, N.; Dong, L. Assessing the effects of landscape design parameters on intra-urban air temperature variability: The case of Beijing, China. Build. Environ. 2014, 76, 44–53. [Google Scholar] [CrossRef]
- Kleerekoper, L.; van Esch, M.; Salcedo, T.B. How to make a city climate-proof, addressing the urban heat island effect. Resour. Conserv. Recycl. 2012, 64, 30–38. [Google Scholar] [CrossRef]
- Yang, F.; Qian, F.; Lau, S.S. Urban form and density as indicators for summer time outdoor ventilation potential: A case study on high-rise housing in Shanghai. Build. Environ. 2013, 70, 122–137. [Google Scholar] [CrossRef]
- Givoni, B. Urban Design in Different Climates; World Meteorological Organization: Geneva, Switzerland, 1989. [Google Scholar]
- Herrmann, J.; Matzarakis, A. Mean radiant temperature in idealised urban canyons—Examples from Freiburg, Germany. Int. Biometeorol. 2012, 56, 199–203. [Google Scholar] [CrossRef] [PubMed]
- Mills, G. Urban climatology and urban design. In Proceedings of the 15th International Congress of Biometeorology and International Conference on Urban Climatology, Sydney, Australia, 8–12 November 1999. [Google Scholar]
- Johansson, E. Influence of urban geometry on out door thermal comfort in a hot dry climate: A study in Fez, Morocco. Build. Environ. 2006, 41, 1326–1338. [Google Scholar] [CrossRef]
- Krüger, E.; Pearlmutter, D.; Rasia, F. Evaluating the impact of canyon geometry and orientation on cooling loads in a high-mass building in a hot dry environment. Appl. Energy 2010, 87, 2068–2078. [Google Scholar] [CrossRef]
- Ahmed, K. A comparative analysis of the outdoor thermal environment of the urban vernacular and the contemporary development: Case studies in Dhaka. In Proceedings of the 11th PLEA International Conference on Architecture of the Extremes, DeadSea, Israel, 3–8 July 1994; pp. 3–8. [Google Scholar]
- Emmanuel, R.; Johansson, E. Influence of urban morphology and sea breeze on hot humid microclimate: The case of Colombo, Sri Lanka. Clim. Res. 2006, 30, 189–200. [Google Scholar] [CrossRef]
- Nunez, M. The Energy Balance of an Urban Canvas. Ph.D. Thesis, University of British Columbia, Vancouver, BC, Canada, 1974. [Google Scholar]
- Oke, T.R. Canyon geometry and the nocturnal urban heat island: Comparison of scale model and field observations. J. Climatol. 1981, 1, 237–254. [Google Scholar] [CrossRef]
- Holmer, B. A simple operative method for determination of sky view factors in complex urban canyons from fish eye photographs. Meteorol. Z. 1992, 1, 236–239. [Google Scholar] [CrossRef]


| AR = 0.5 | AR = 1.0 | AR = 1.5 | AR = 2.0 | AR = 2.5 | AR = 3.0 | AR = 4.0 | |
|---|---|---|---|---|---|---|---|
| N-S | ● | ● | ● | ● | ○ | ● | ● |
| EW | ● | ● | ● | ● | ● | ● | ○ |
| NE-SW | ● | ● | ● | ● | ● | ○ | ○ |
| NW-SE | ● | ● | ● | ● | ● | ● | ● |
| Date (Day.Month.Year) | Time | Ta (°C) | v (m/s) | RH (%) |
|---|---|---|---|---|
| 8.7.2016 | 9:00 | 33 | 3.3 | 54 |
| 8.7.2016 | 10:00 | 33 | 5.4 | 53 |
| 8.7.2016 | 11:00 | 34 | 3.3 | 50 |
| 8.7.2016 | 12:00 | 36 | 5.4 | 48 |
| 8.7.2016 | 13:00 | 36 | 3.3 | 44 |
| 8.7.2016 | 14:00 | 37 | 3.3 | 44 |
| 8.7.2016 | 15:00 | 37 | 3.3 | 43 |
| 8.7.2016 | 16:00 | 37 | 3.3 | 42 |
| 8.7.2016 | 17:00 | 36 | 3.3 | 44 |
| 8.7.2016 | 18:00 | 36 | 1.5 | 46 |
| 8.7.2016 | 19:00 | 35 | 1.5 | 49 |
| Tree Species | Canopy Density | Height at Maturity (m) | Crown Width at Maturity (m) | Shape | ||
|---|---|---|---|---|---|---|
| Min–Max | Average | Min–Max | Average | |||
| Cinnamomum burmannii | dense | 1.3–19 | 5 | 0.1–23.5 | 3.5 | triangular |
| Aleurites moluccana | dense | 10–20 | 9 | 6 | - | spreading |
| Mangifera indica (T1) | dense | 15–23 | - | 10–15 | 10 | round |
| Delonix regia | medium | 10–12 | - | 12–18 | - | T-shape |
| Acer x freemanii Jeffersred | medium | 10–45 | 16 | 9–12 | 11 | oval |
| Alstonia scholaris (T2) | medium | 17–40 | 30 | 10 | - | spreading |
| Eucalyptus tereticornis | moderate | 25–50 | 25 | 7–30 | 16 | culumnar |
| Prunus dulcis | open | 5–8 | - | 5–8 | - | vase |
| Bombax Ceita (T3) | open | 15–23 | - | 10–15 | 5 | Oval |
| ORIENTATION (Or) | Or/ARi | Or/ARi/Ti | Or/ARi/Ti/di |
|---|---|---|---|
| Ari = 0.5; 1.5; 3.0 | Ti = T1; T2; T3 | di = 05 m; 10 m; 15 m | |
| E–W | E–W/0.5 | E–W/0.5/T1 | E–W/0.5/T1/05 |
| E–W/0.5/T1/10 | |||
| E–W/0.5/T1/15 | |||
| E–W/0.5/T2 | E–W/0.5/T2/05 | ||
| E–W/0.5/T2/10 | |||
| E–W/0.5/T2/15 | |||
| E–W/0.5/T3 | E–W/0.5/T3/05 | ||
| E–W/0.5/T3/10 | |||
| E–W/0.5/T3/15 | |||
| E–W/1.5 | E–W/1.5/T1 | E–W/1.5/T1/05 | |
| E–W/1.5/T1/10 | |||
| E–W/1.5/T1/15 | |||
| E–W/1.5/T2 | E–W/1.5/T2/05 | ||
| E–W/1.5/T2/10 | |||
| E–W/1.5/T2/15 | |||
| E–W/1.5/T3 | E–W/1.5/T3/05 | ||
| E–W/1.5/T3/10 | |||
| E–W/1.5/T3/15 | |||
| E–W/3.0 | E–W/3.0/T1 | E–W/3.0/T1/05 | |
| E–W/3.0/T1/10 | |||
| E–W/3.0/T1/15 | |||
| E–W/3.0/T2 | E–W/3.0/T2/05 | ||
| E–W/3.0/T2/10 | |||
| E–W/3.0/T2/15 | |||
| E–W/3.0/T3 | E–W/3.0/T3/05 | ||
| E–W/3.0/T3/10 | |||
| E–W/3.0/T3/15 |
| Time (h:mm) | 0:00 | 1:00 | 2:00 | 3:00 | 4:00 | 5:00 | 6:00 | 7:00 | 8:00 | 9:00 | 10:00 | 11:00 |
| wind direction (°) | 219 | 213 | 261 | 276 | 282 | 287 | 286 | 273 | 75 | 288 | 293 | 289 |
| Time (h:mm) | 12:00 | 13:00 | 14:00 | 15:00 | 16:00 | 17:00 | 18:00 | 19:00 | 20:00 | 21:00 | 22:00 | 23:00 |
| wind direction (°) | 290 | 290 | 284 | 148 | 299 | 298 | 270 | 100 | 250 | 212 | 213 | 172 |
© 2018 by the authors. Licensee MDPI, Basel, Switzerland. This article is an open access article distributed under the terms and conditions of the Creative Commons Attribution (CC BY) license (http://creativecommons.org/licenses/by/4.0/).
Share and Cite
Zheng, B.; Bernard BEDRA, K.; Zheng, J.; Wang, G. Combination of Tree Configuration with Street Configuration for Thermal Comfort Optimization under Extreme Summer Conditions in the Urban Center of Shantou City, China. Sustainability 2018, 10, 4192. https://doi.org/10.3390/su10114192
Zheng B, Bernard BEDRA K, Zheng J, Wang G. Combination of Tree Configuration with Street Configuration for Thermal Comfort Optimization under Extreme Summer Conditions in the Urban Center of Shantou City, China. Sustainability. 2018; 10(11):4192. https://doi.org/10.3390/su10114192
Chicago/Turabian StyleZheng, Bohong, Komi Bernard BEDRA, Jian Zheng, and Guoguang Wang. 2018. "Combination of Tree Configuration with Street Configuration for Thermal Comfort Optimization under Extreme Summer Conditions in the Urban Center of Shantou City, China" Sustainability 10, no. 11: 4192. https://doi.org/10.3390/su10114192
APA StyleZheng, B., Bernard BEDRA, K., Zheng, J., & Wang, G. (2018). Combination of Tree Configuration with Street Configuration for Thermal Comfort Optimization under Extreme Summer Conditions in the Urban Center of Shantou City, China. Sustainability, 10(11), 4192. https://doi.org/10.3390/su10114192