Factors Aggregating Ability and the Regional Differences among China’s Urban Agglomerations


Abstract
1. Introduction
2. Study Area and Data
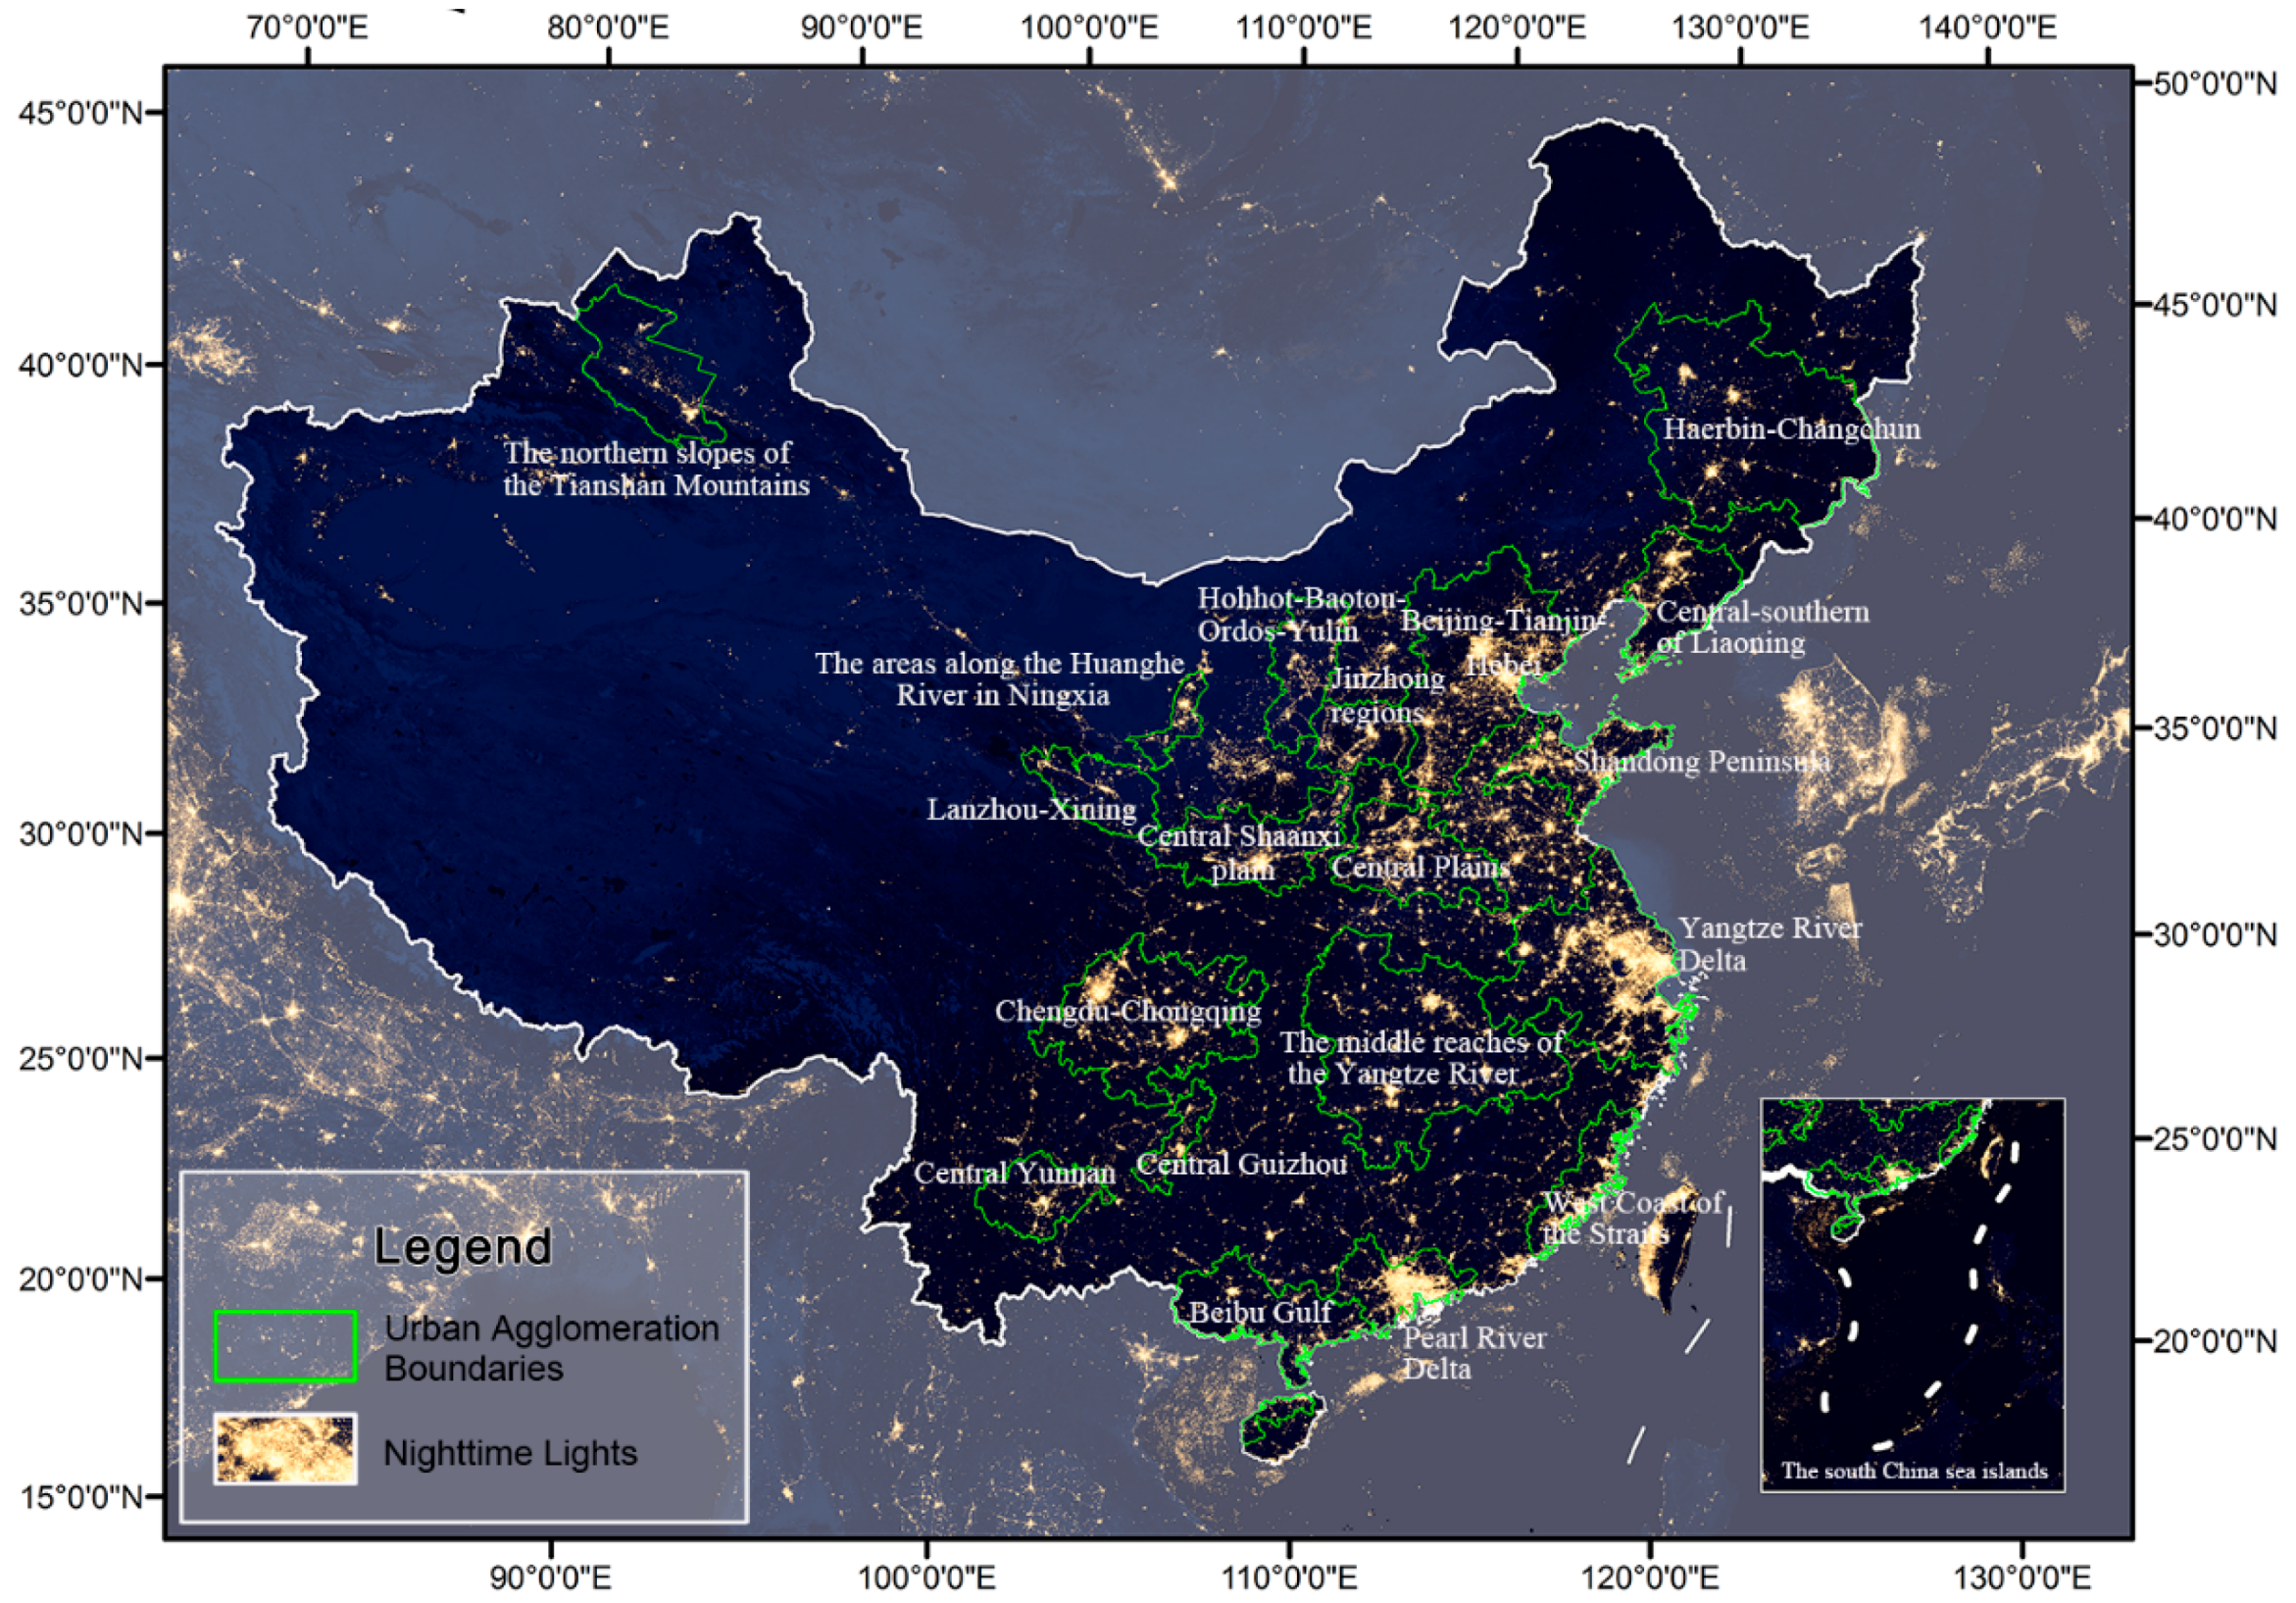
2.1. Study Area
2.2. Data Sources
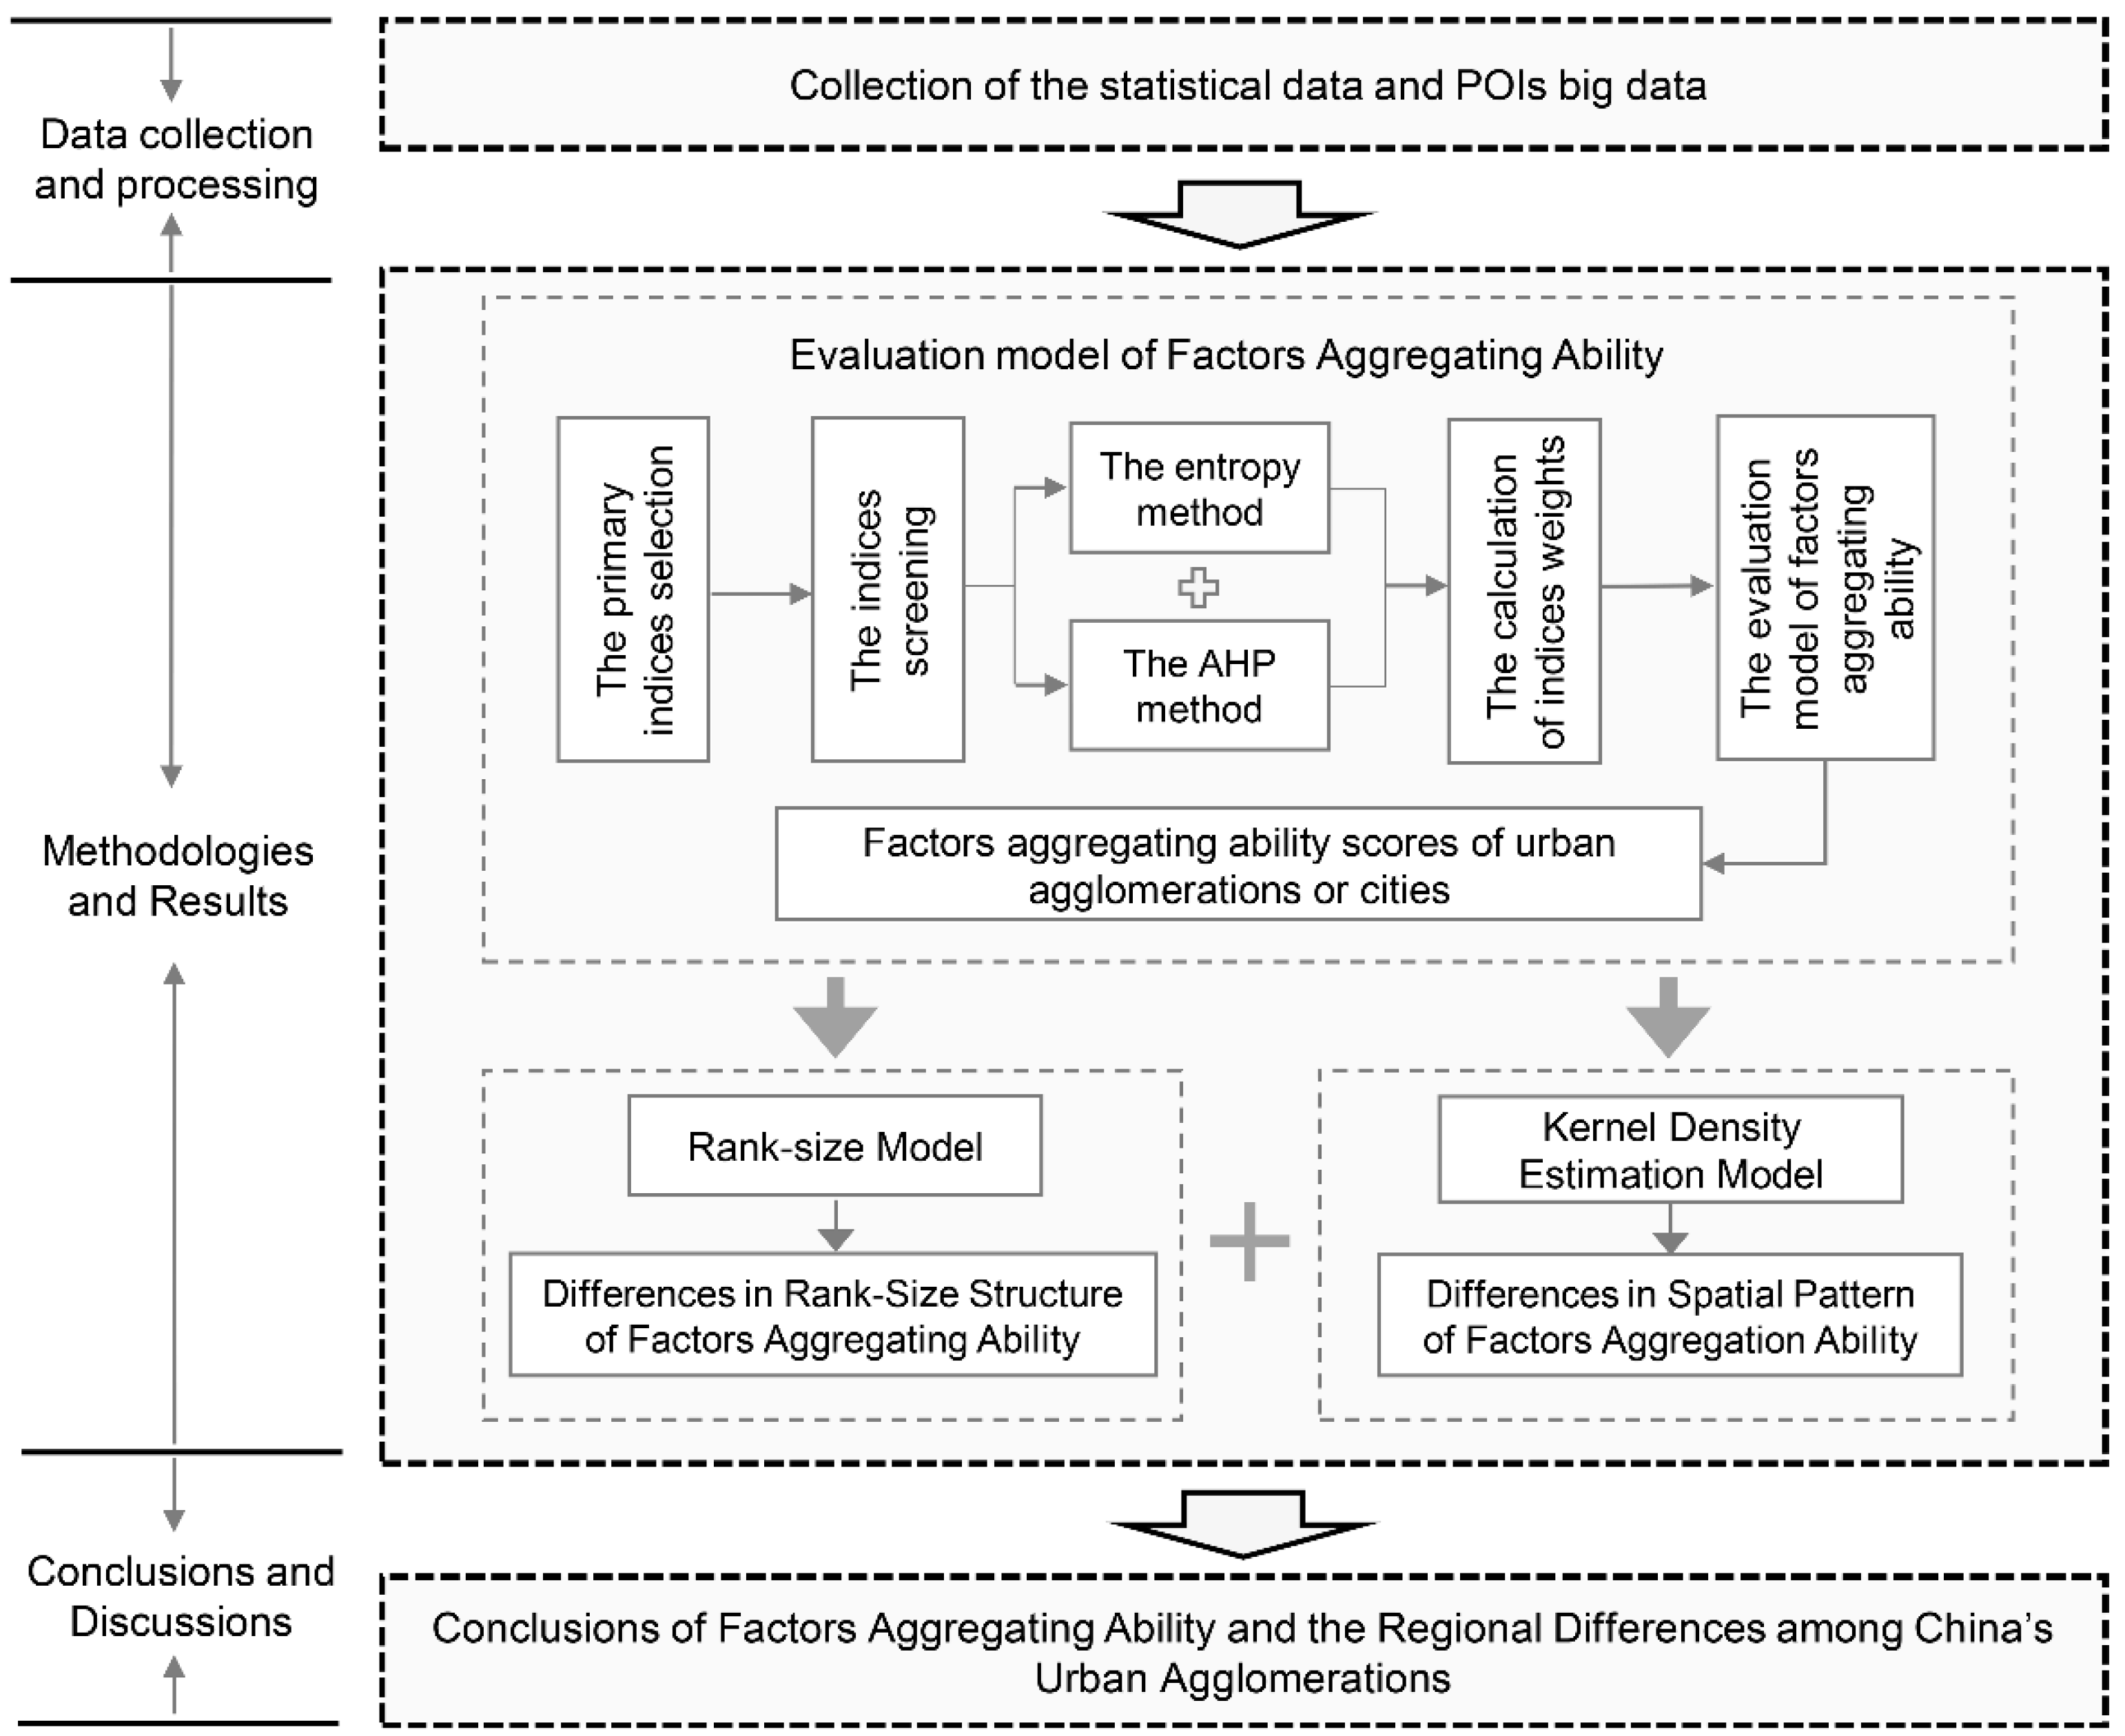
3. Methodologies
3.1. Evaluation Model of Factors Aggregating Ability
3.2. Rank-Size Model
3.3. Kernel Density Estimation
4. Results
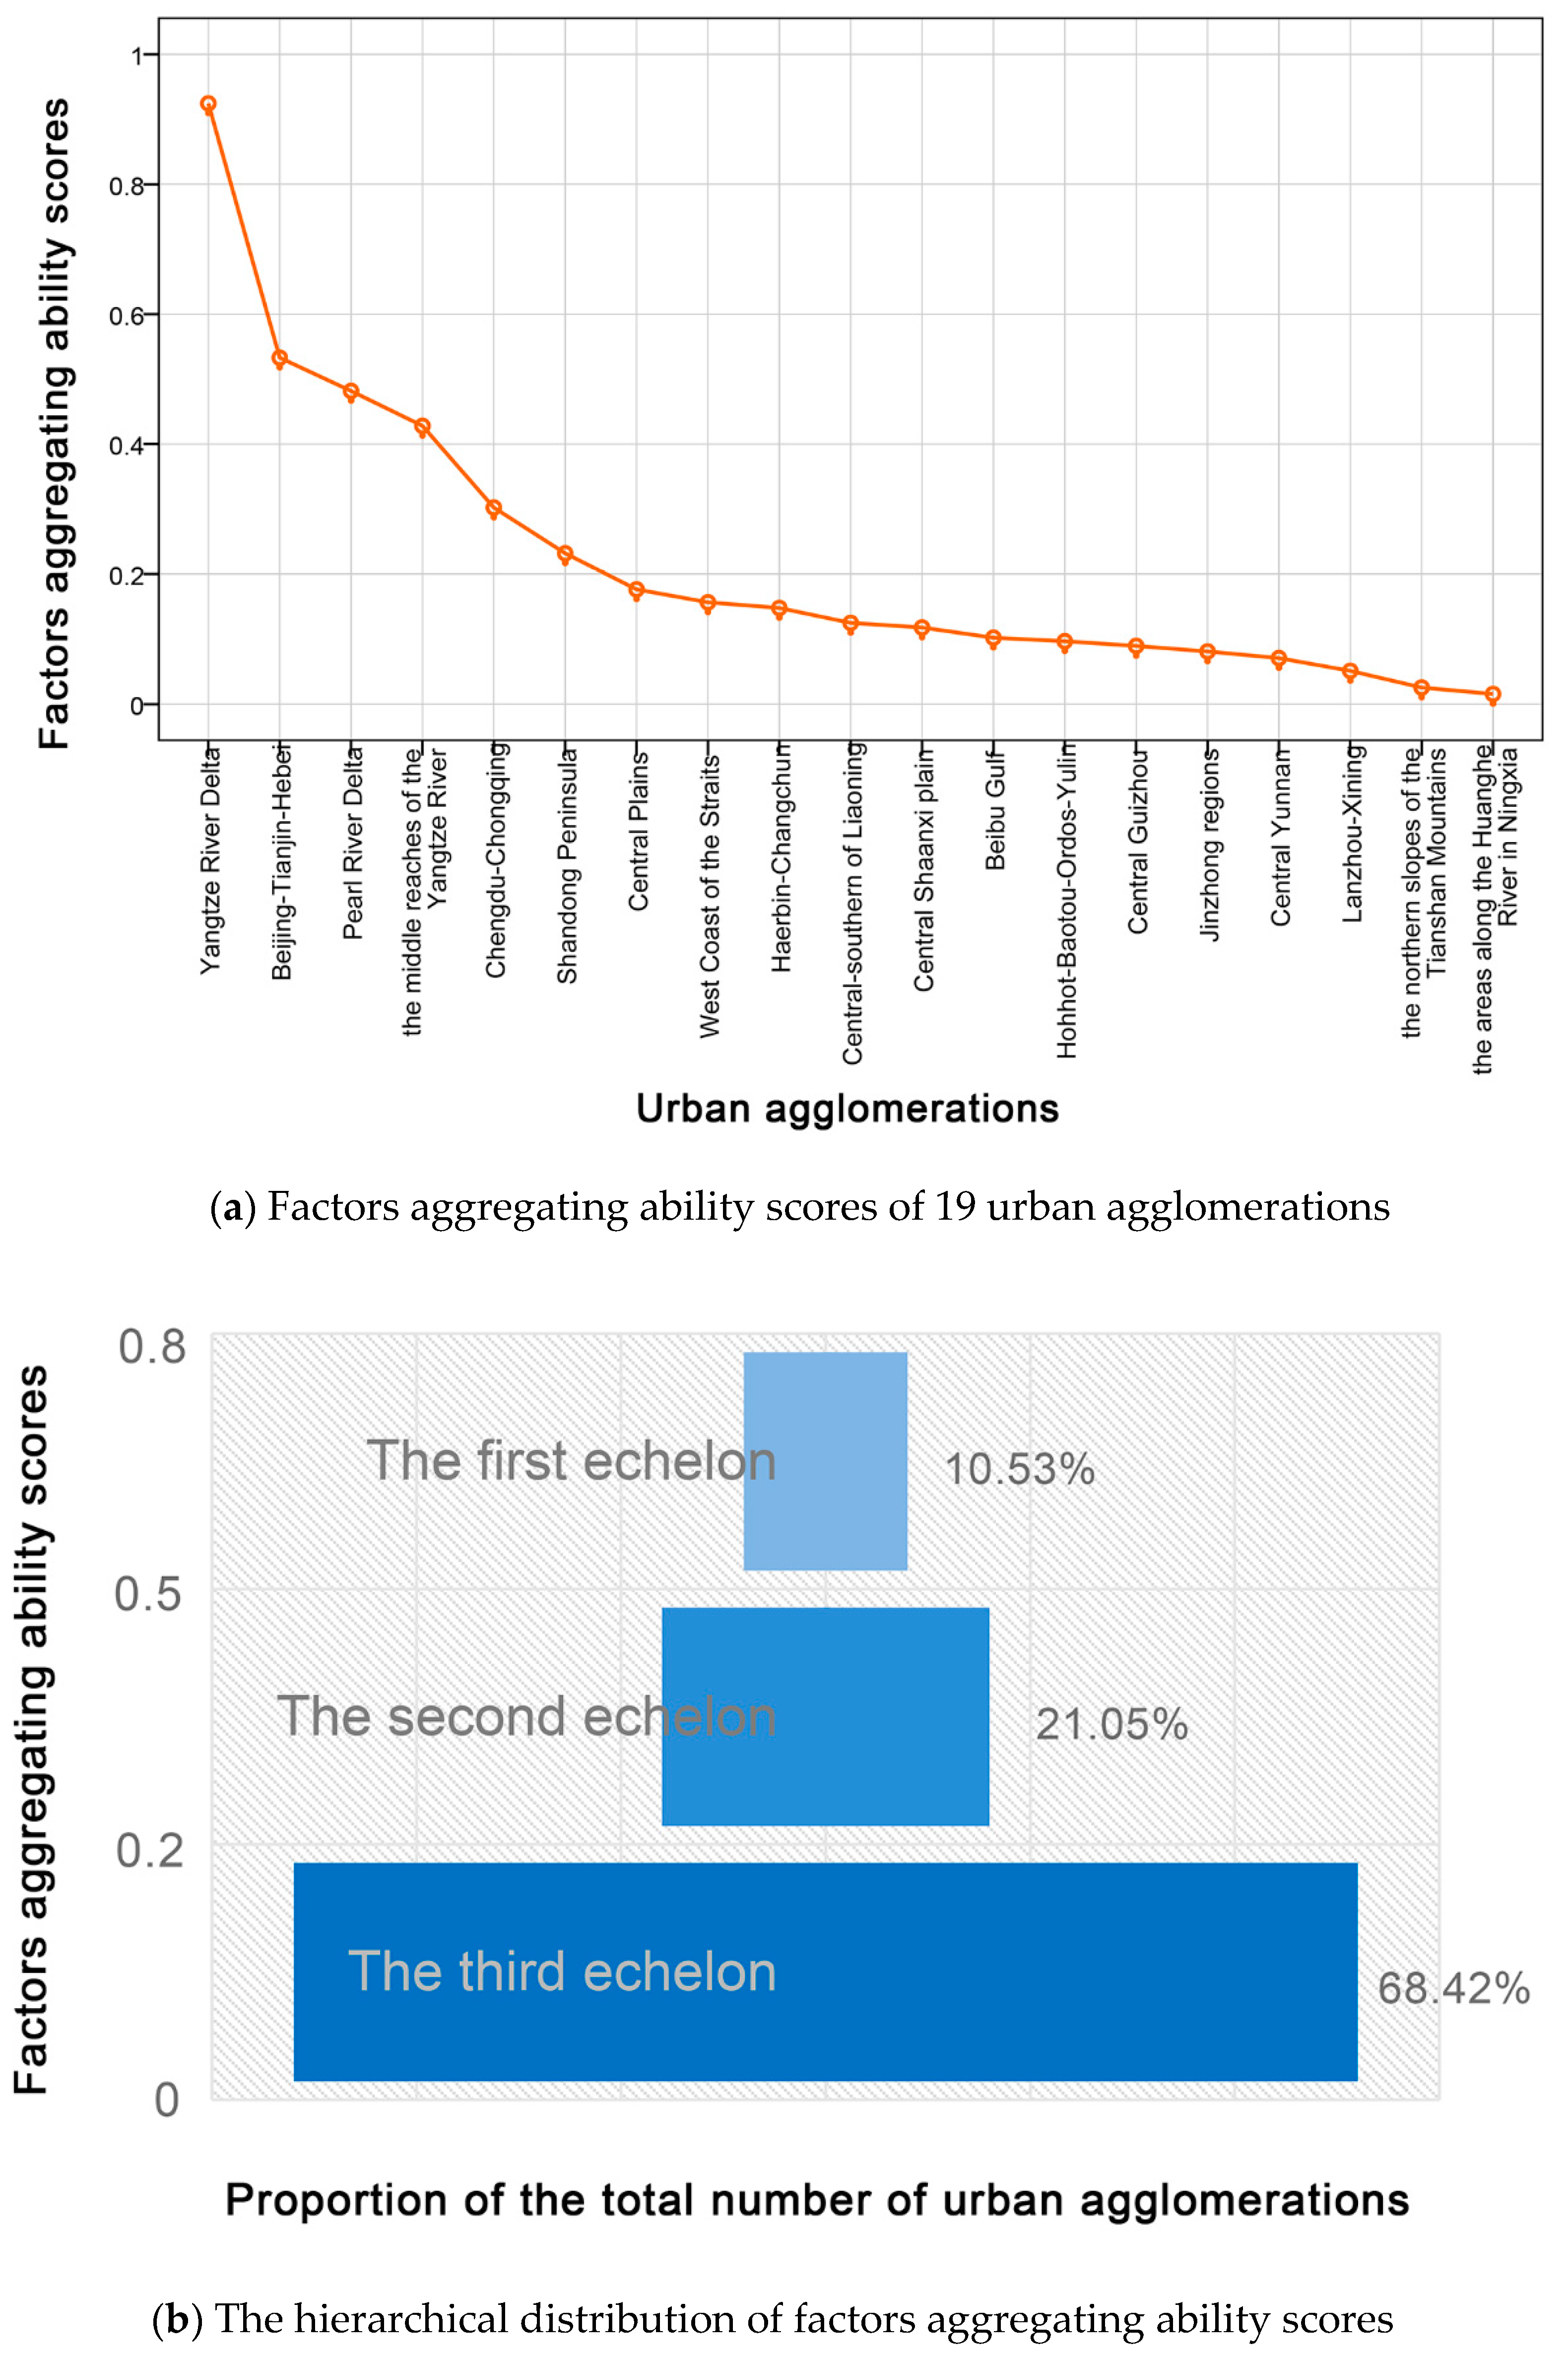
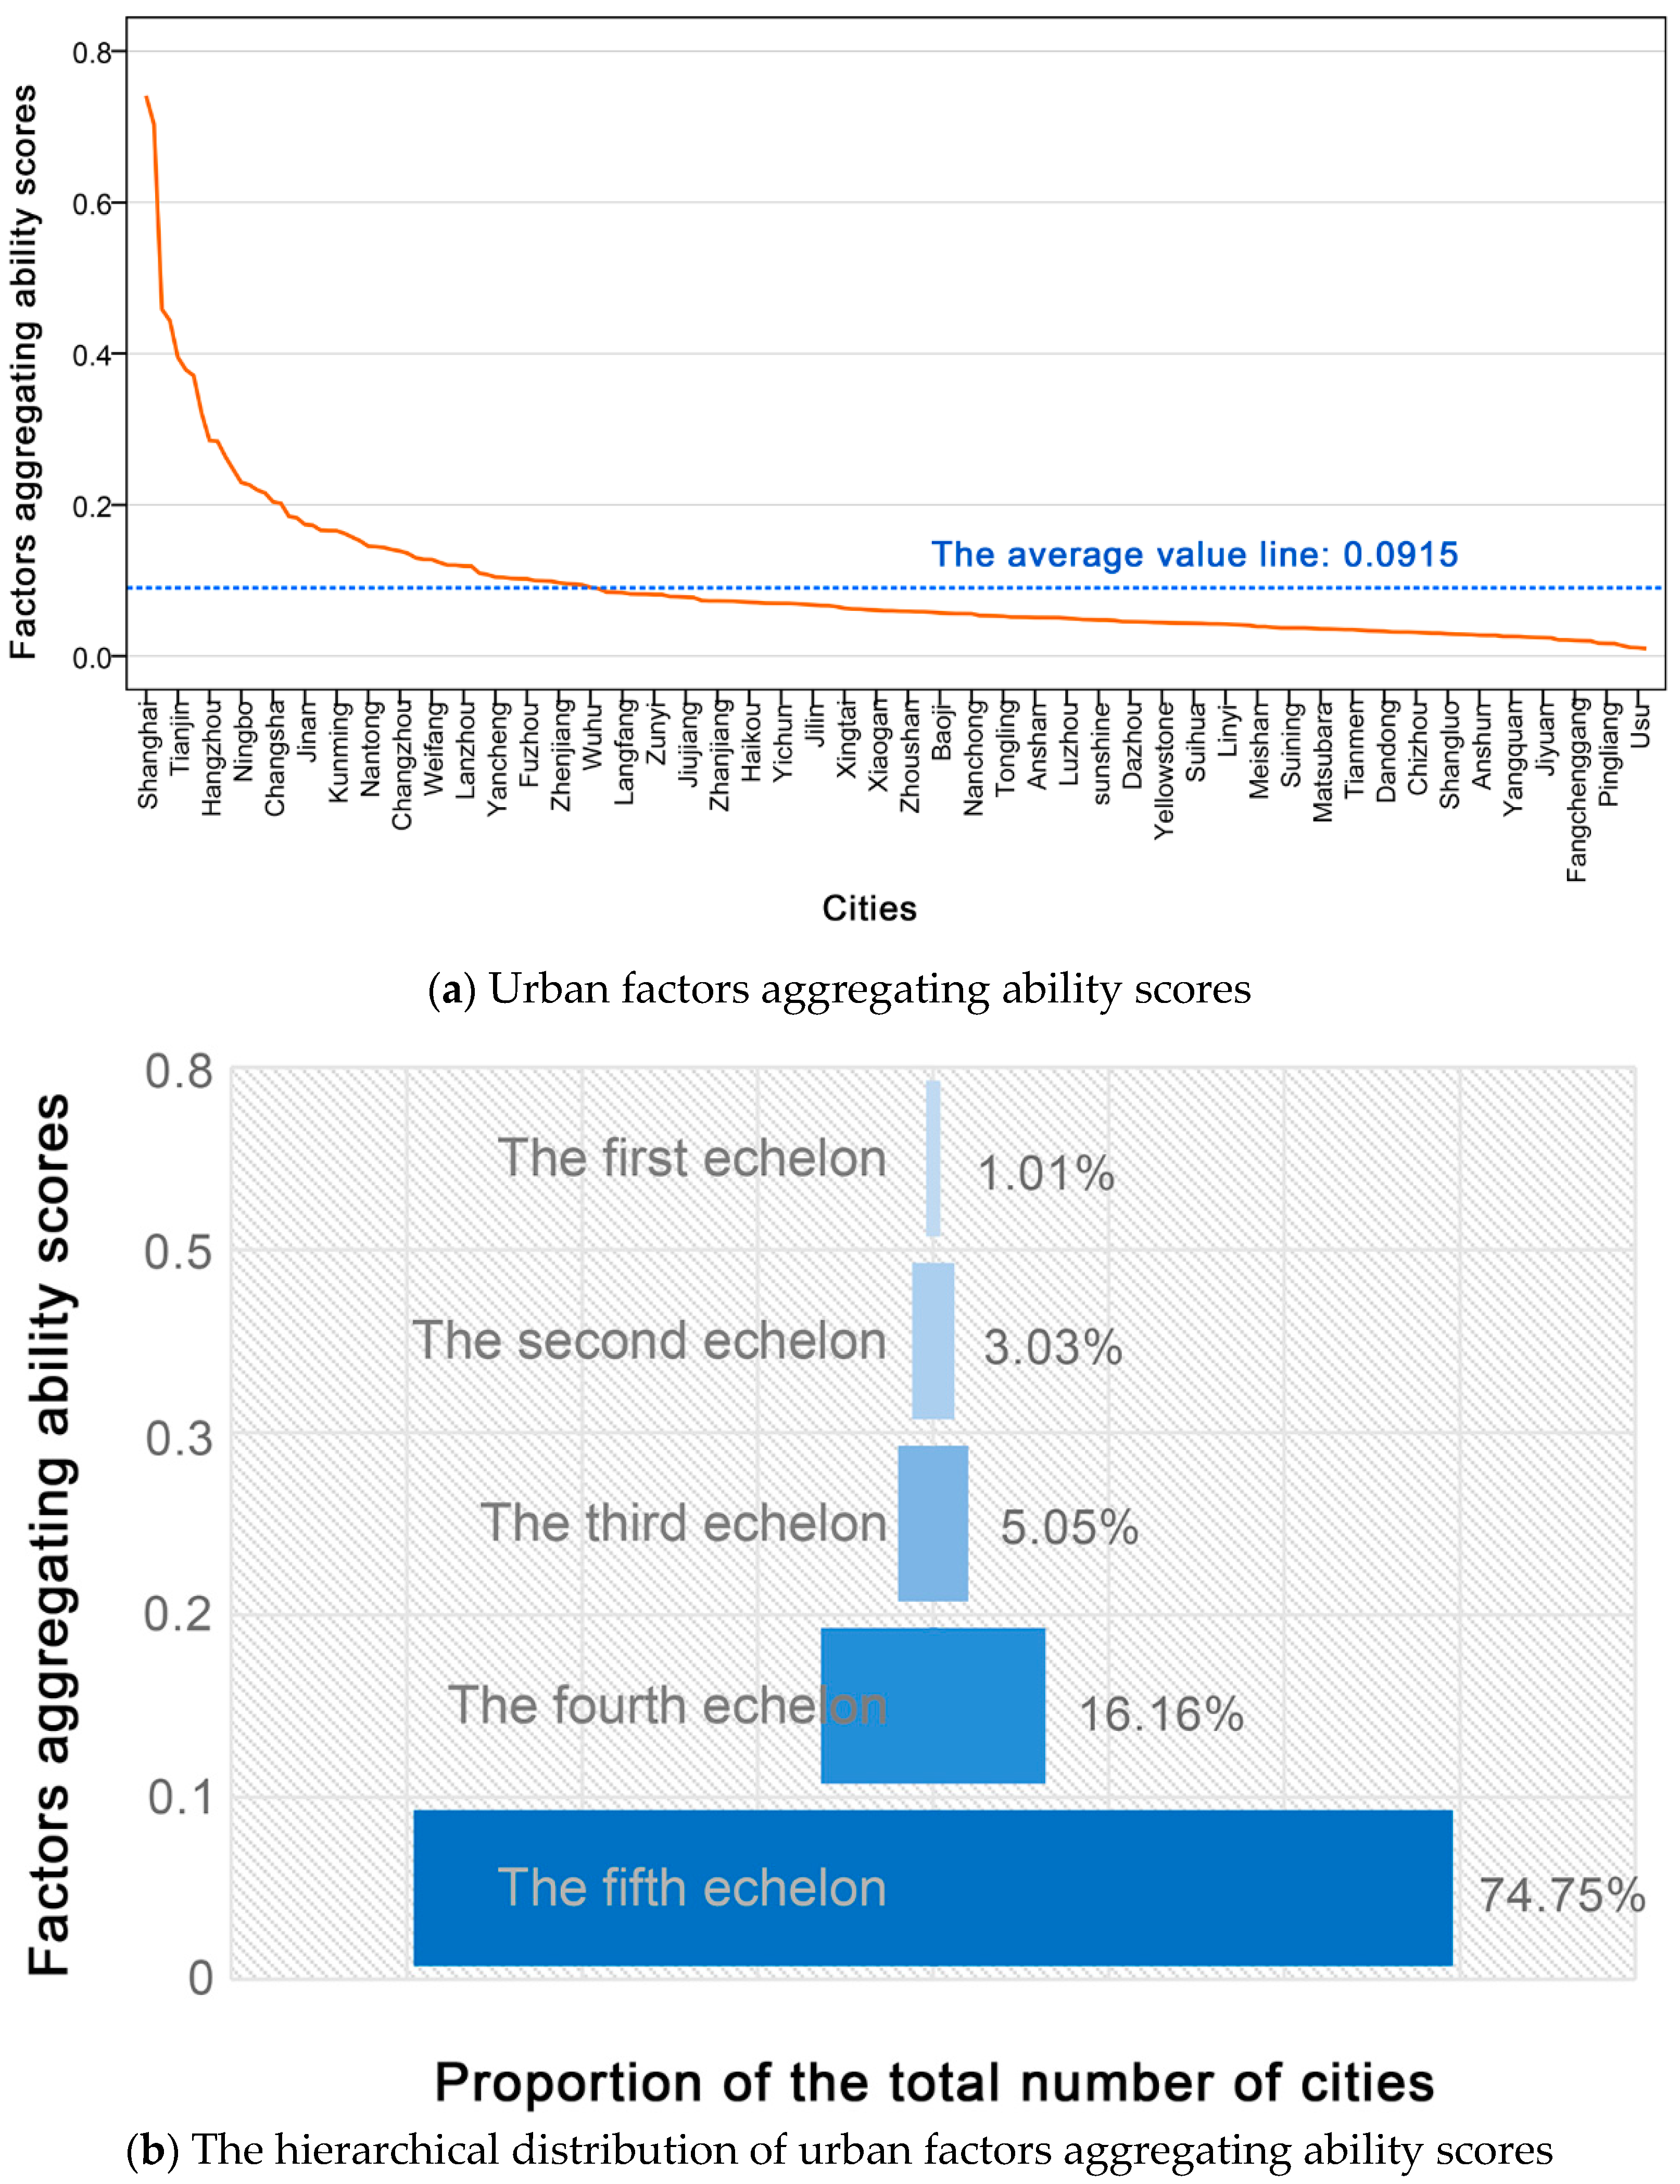
4.1. Differences in Hierarchical Distribution of Factors Aggregating Ability
4.2. Differences in Rank-Size Structure of Factors Aggregating Ability
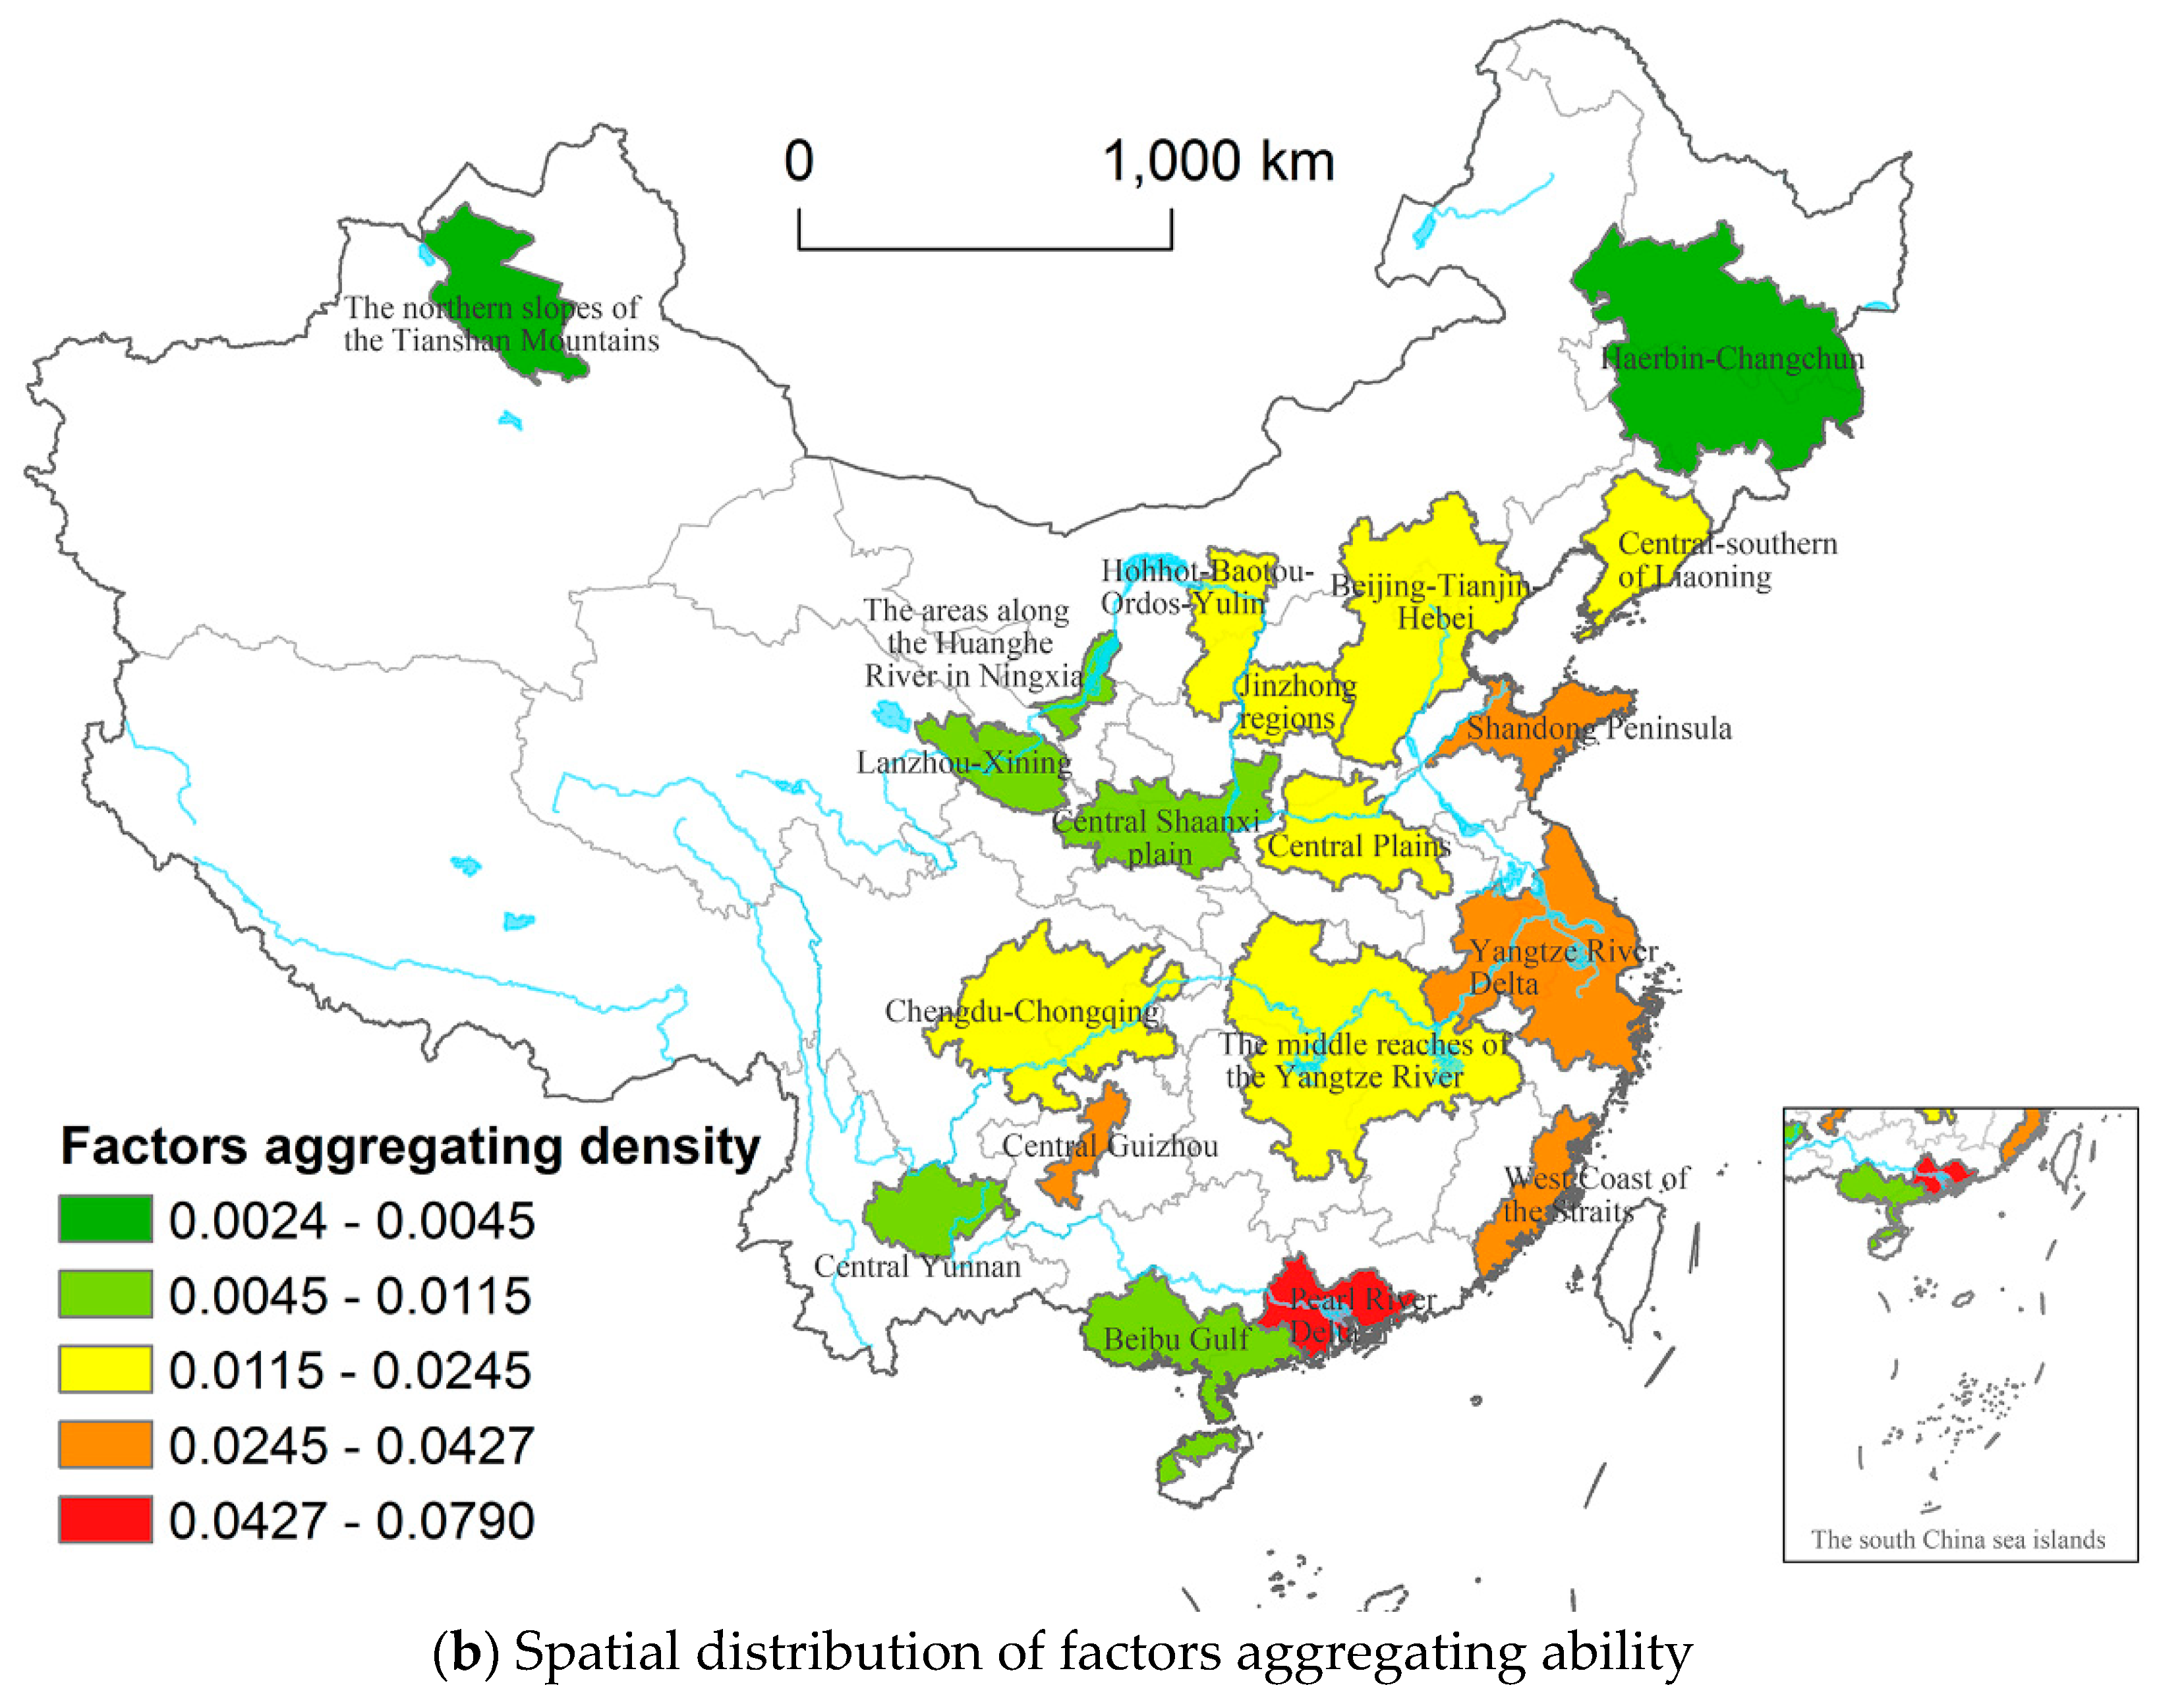
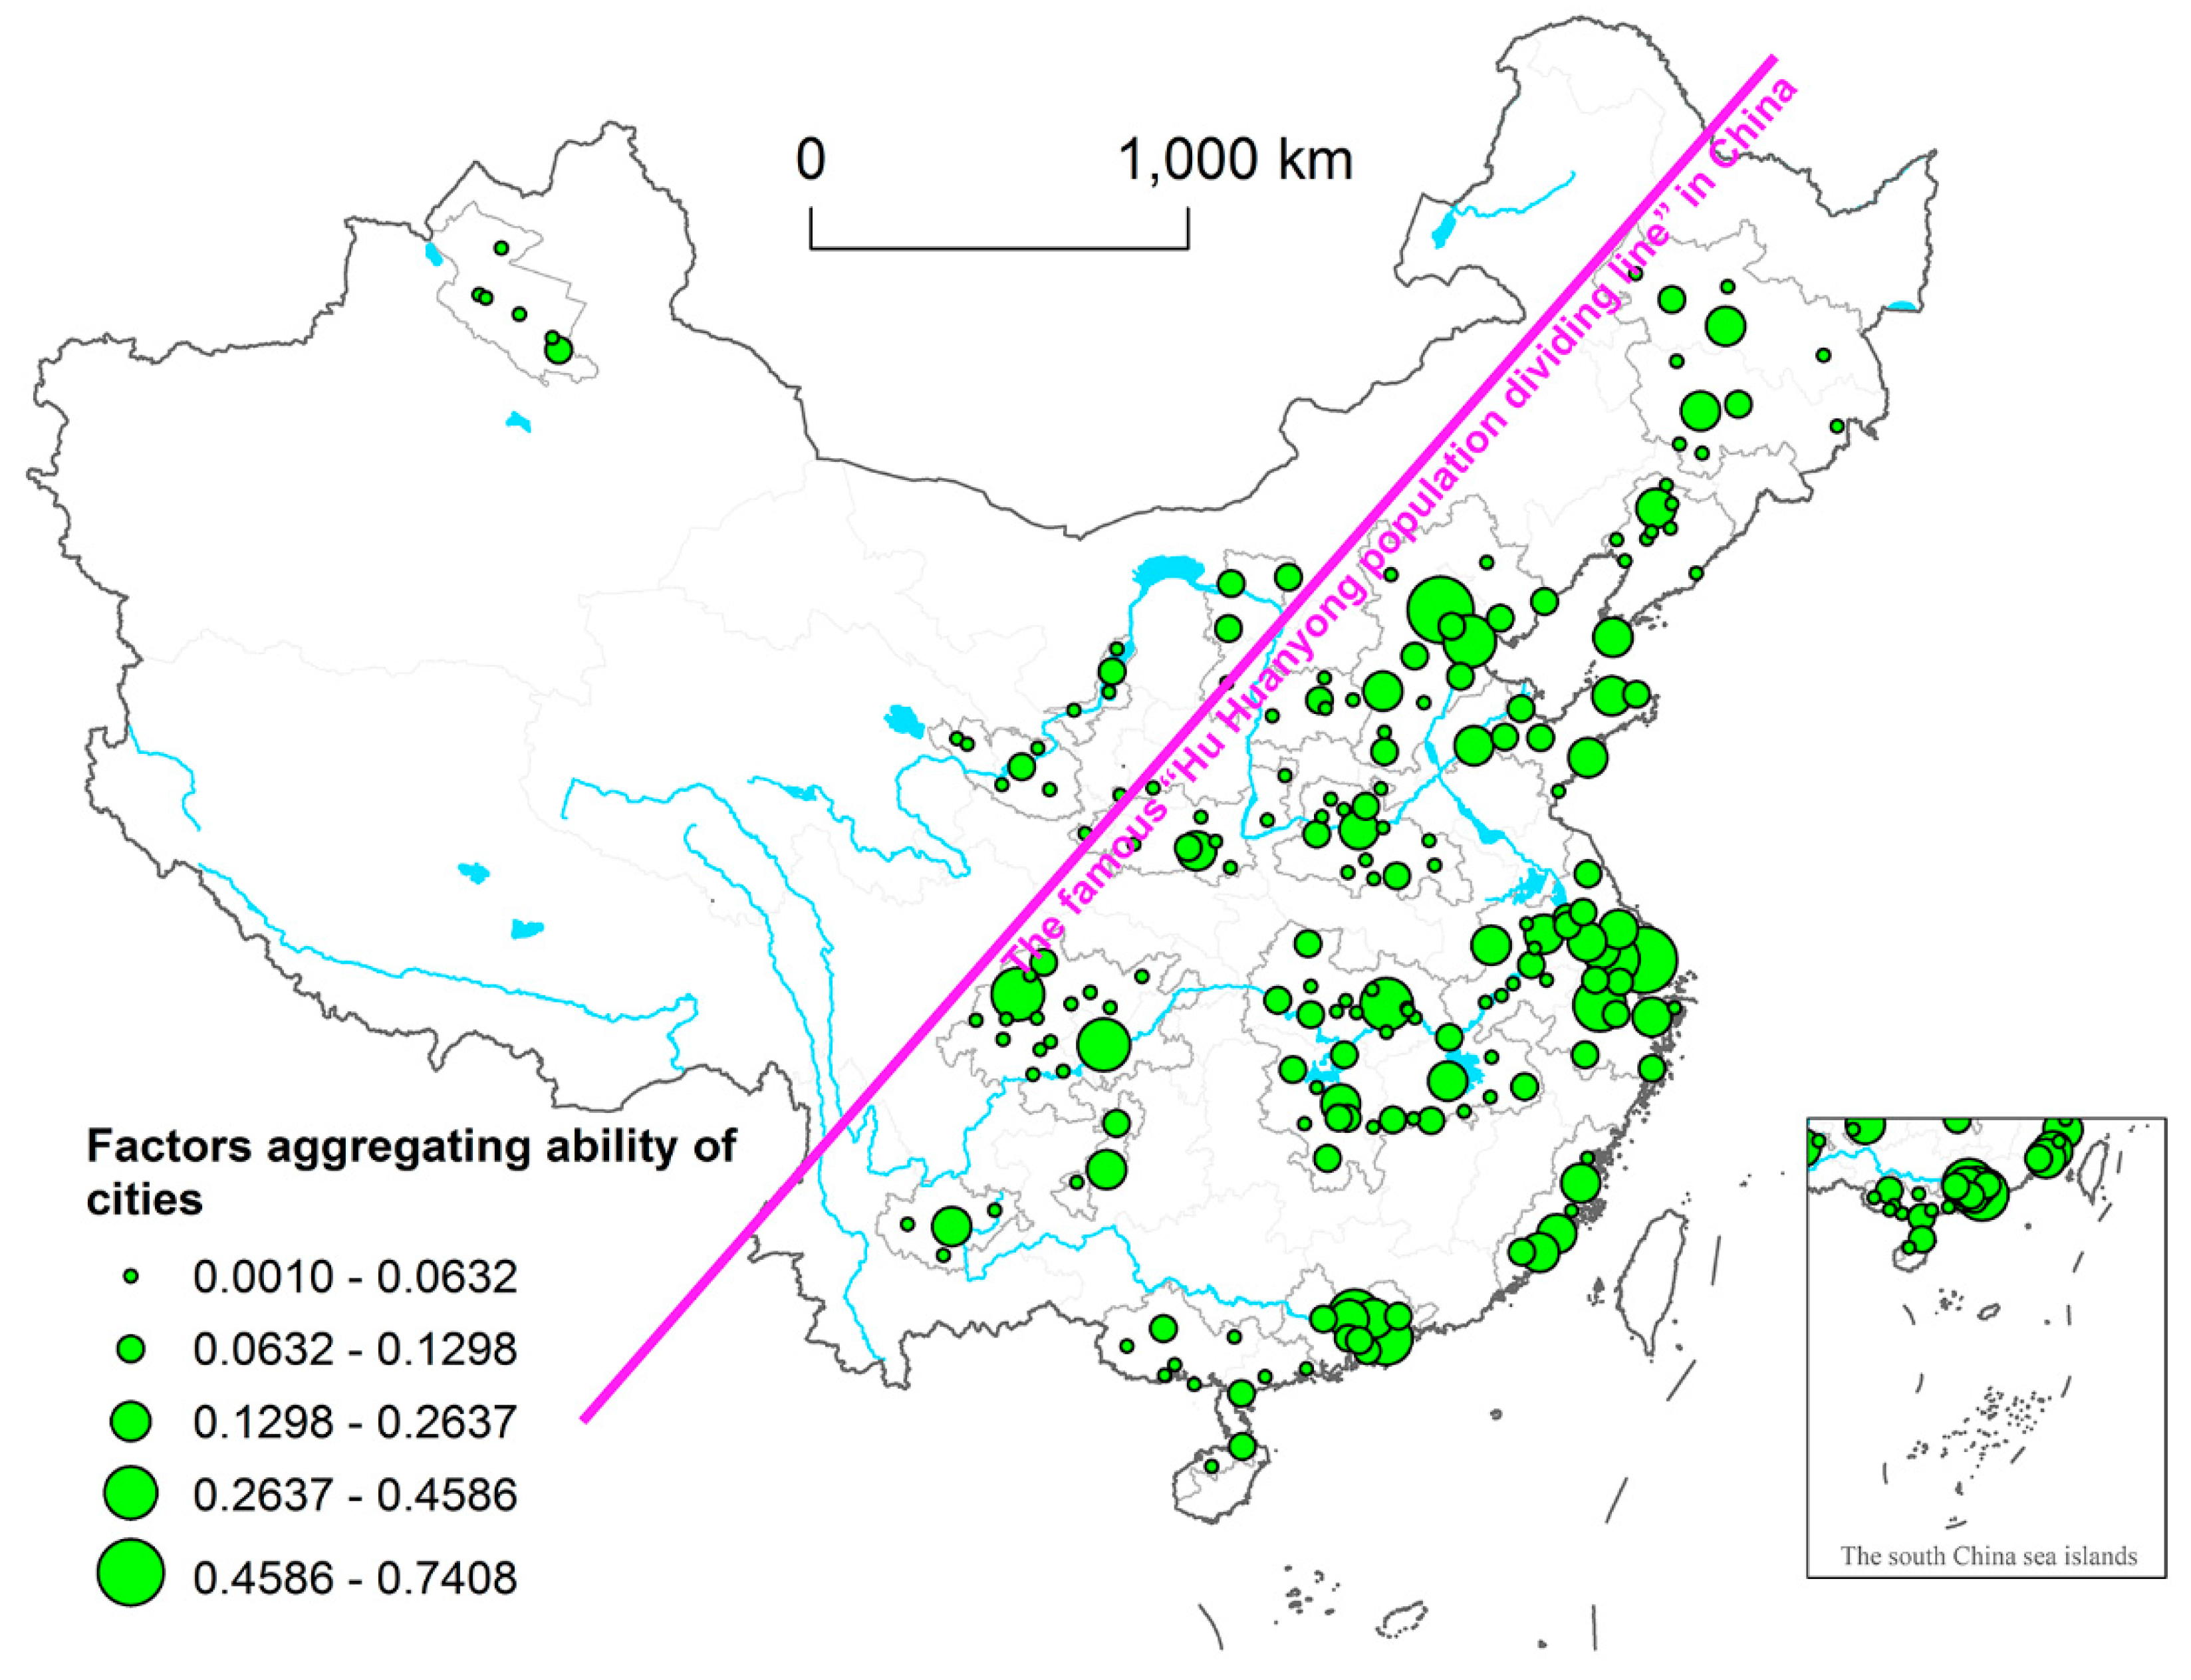
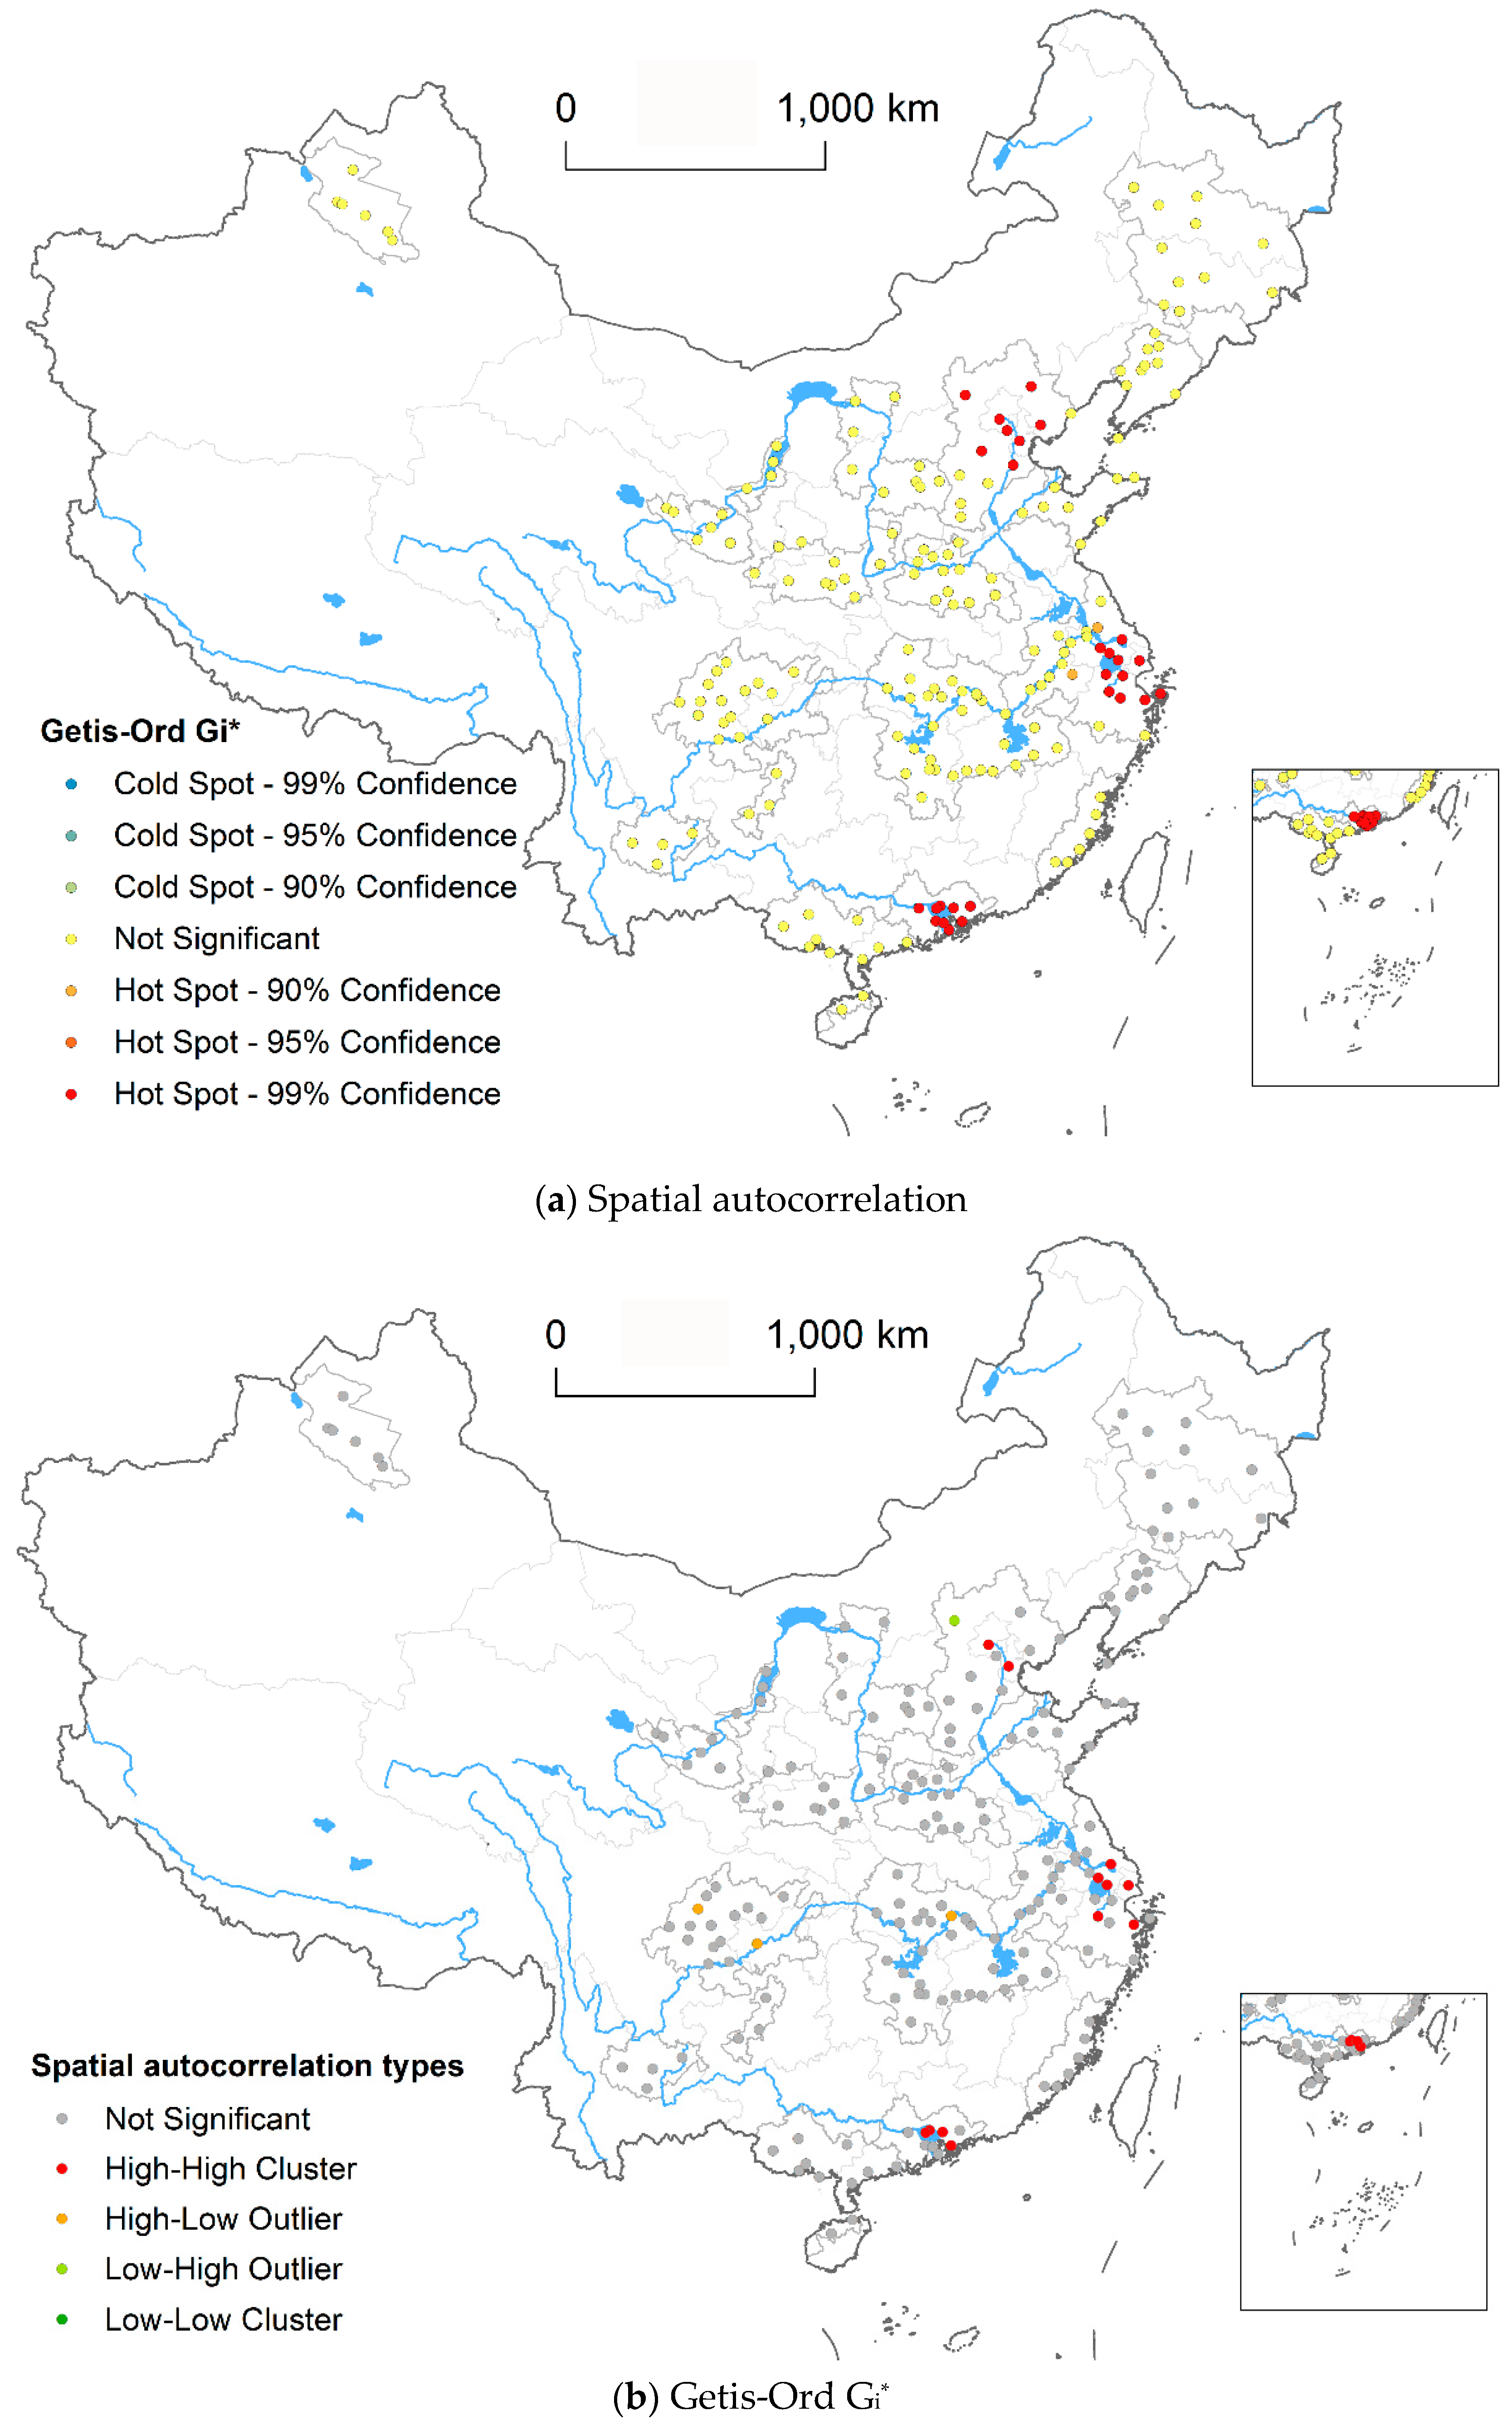
4.3. Differences in Spatial Pattern of Factors Aggregation Ability
5. Conclusions and Discussion
5.1. Conclusions
5.2. Discussion
Author Contributions
Funding
Conflicts of Interest
References
- Fang, C.L.; Yu, D.L. Urban agglomeration: An evolving concept of an emerging phenomenon. Landsc. Urban Plan. 2017, 162, 126–136. [Google Scholar] [CrossRef]
- Polyan, P.M. Large urban agglomerations of the Soviet Union. Sov. Geogr. 1982, 23, 707–718. [Google Scholar] [PubMed]
- Gottmann, J. Megalopolis, or the urbanization of the North-eastern seaboard. Econ. Geogr. 1957, 33, 189–200. [Google Scholar] [CrossRef]
- Kunzmann, K.R.; Wegener, M. The pattern of urbanization in Western Europe. Ekistics 1991, 50, 156–178. [Google Scholar]
- Portnov, B.A.; Schwartz, M. Urban clusters as growth foci. J. Region. Sci. 2009, 49, 287–310. [Google Scholar] [CrossRef]
- Chapple, K. The fiscal trade-off: Sprawl, the conversion of land, and wage decline in California’s metropolitan regions. Landsc. Urban Plan. 2018, 177, 294–302. [Google Scholar] [CrossRef]
- Bagheri, B.; Tousi, S.N. An explanation of urban sprawl phenomenon in Shiraz Metropolitan Area (SMA). Cities 2018, 73, 71–90. [Google Scholar] [CrossRef]
- Katherine, H. Urban infrastructure and natural resource flows: Evidence from Cape Town. Sci. Total Environ. 2013, 461, 839–845. [Google Scholar]
- Guo, Q.B.; Liu, Q. Research progress review on urban factors aggregating ability. J. Hubei Univ. 2016, 43, 122–129. (In Chinese) [Google Scholar]
- Porter, M.E. Location, competition and economic development: Local clusters in a global economy. Econ. Dev. Quart. 2000, 14, 15–34. [Google Scholar] [CrossRef]
- Oskenbayev, Y.; Yilmaz, M.; Abdulla, K. Resource concentration, institutional quality and the natural resource curse. Econ. Syst. 2013, 37, 254–270. [Google Scholar] [CrossRef]
- Ohlin, B. Interregional and International Trade; Harvard University Press: Cambridge, MA, USA, 1933. [Google Scholar]
- Russo, F.; Musolino, G. A unifying modelling framework to simulate the spatial economic transport interaction process at urban and national scales. J. Transp. Geogr. 2012, 24, 189–197. [Google Scholar] [CrossRef]
- Trippl, M.; Grillitsch, M.; Isaksen, A.; Sinozic, T. Perspectives on cluster evolution: Critical review and future research issues. Eur. Plan. Stud. 2015, 23, 2028–2044. [Google Scholar] [CrossRef]
- Chang, C.; Oxley, L. Industrial agglomeration, geographic innovation and total factor productivity: The case of Taiwan. Math. Comput. Simul. 2009, 79, 2787–2796. [Google Scholar] [CrossRef]
- Hochman, O. Efficient agglomeration of spatial clubs. J. Urban Econ. 2011, 69, 118–135. [Google Scholar] [CrossRef]
- Fu, Y.M.; Gabriel, S.A. Labor migration, human capital agglomeration and regional development in China. Region. Sci. Urban Econ. 2012, 42, 473–484. [Google Scholar] [CrossRef]
- Papi, L.; Sarno, E.; Zazzaro, A. The Geographical Network of Bank Organizations: Issues and Evidence for Italy. In Handbook of Geographies of Money and Finance; Martin, R., Pollard, J., Eds.; CSEF Working Paper, 403; Edward Elgar: Cheltenam, UK, 2015. [Google Scholar]
- Bhaumik, S.K.; Dimova, R. Does Human Capital Endowment of Foreign Direct Investment Recipient Countries Really Matter Evidence from Cross-country Firm Level. Data Rev. Dev. Econ. 2013, 17, 559–570. [Google Scholar] [CrossRef]
- Yang, C.; Lin, H.; Li, H. Influences of production and R&D agglomeration on productivity: Evidence from Chinese electronics firms. China Econ. Rev. 2013, 27, 162–178. [Google Scholar]
- Alfaro, L.; Chen, M.X. The global agglomeration of multinational firms. J. Int. Econ. 2014, 94, 263–276. [Google Scholar] [CrossRef]
- Ellision, G. Geographic concentration in U. S. manufacturing industrial: A dartboard approach. J. Urban Econ. 2000, 9, 48–67. [Google Scholar]
- Catini, R.; Karamshuk, D.; Penner, O.; Riccaboni, M. Identifying geographic clusters: A network analytic approach. Res. Policy 2015, 44, 1749–1762. [Google Scholar] [CrossRef]
- Scioscia, F.; Binetti, M.; Ruta, M.; Ieva, S.; Di Sciascio, E. A framework and a tool for semantic annotation of POIs in Open Street Map. Procedia 2014, 111, 1092–1101. [Google Scholar]
- Zhang, X.Y.; Du, S.H.; Wang, Q. Hierarchical semantic cognition for urban functional zones with VHR satellite images and POI data. ISPRS J. Photogramm. Remote Sens. 2017, 132, 170–184. [Google Scholar] [CrossRef]
- He, Y.X.; Yang, J.J. Comprehensive evaluation of global clean energy development index based on the improved entropy method. Ecol. Indic. 2018, 88, 305–321. [Google Scholar] [CrossRef]
- Guo, Q.B.; Zhang, Z.H. Spatial-temporal evolution of factors aggregating ability in urban agglomeration in the middle reaches of the Yangtze River. Acta Geogr. Sin. 2017, 72, 1746–1761. (In Chinese) [Google Scholar]
- Arshad, S.; Hu, S.; Ashraf, B.N. Zipf’s law and city size distribution: A survey of the literature and future research agenda. Physica A 2018, 492, 75–92. [Google Scholar] [CrossRef]
- Chen, Y.G. The evolution of Zipf’s law indicative of city development. Physica A 2016, 443, 555–567. [Google Scholar] [CrossRef]
- Giesen, K.; Südekum, J. Zipf’s law for cities in the regions and the country. J. Econ. Geogr. 2011, 11, 667–686. [Google Scholar] [CrossRef]
- Spencer, C.J.; Yakymchuk, C.; Ghaznavi, M. Visualizing data distributions with kernel density estimation and reduced chi-squared statistic. Geosci. Front. 2017, 8, 1247–1252. [Google Scholar] [CrossRef]
- Hu, Y.J.; Wang, F.H.; Guin, C.; Zhu, H.J. A spatial-temporal kernel density estimation framework for predictive crime hotspot mapping and evaluation. Appl. Geogr. 2018, 99, 89–97. [Google Scholar] [CrossRef]
- Heidenreich, N.B.; Schindler, A.; Sperlich, S. Bandwidth selection for kernel density estimation: A review of fully automatic selectors. Adv. Stat. Anal. 2013, 97, 403–433. [Google Scholar] [CrossRef]


| Target Layer | Criteria Layer | Indicators Layer | Indicator Weight |
|---|---|---|---|
| Factors Aggregating Ability | Population Factor Aggregating Ability (0.1084) | The proportion of the population in the urban agglomeration to that in the country | 0.0672 |
| The ratio of college students per 10,000 students in the urban agglomeration to the national indicator level | 0.0412 | ||
| Land Factor Aggregating Ability (0.0734) | The proportion of the built-up area in the urban agglomeration to that in the country | 0.0570 | |
| The ratio of unit land area output rate in the urban agglomeration to the national indicator level | 0.0164 | ||
| Economy Factor Aggregating Ability (0.1163) | The proportion of GDP in the urban agglomeration to that in the country | 0.0786 | |
| The ratio of fixed asset investment intensity in the urban agglomeration to the national indicator level | 0.0377 | ||
| Financial Factor Aggregating Ability (0.099) | The proportion of the deposits of financial institutions at the end of the year in the urban agglomeration to those in the country | 0.0494 | |
| The proportion of bank outlets in the urban agglomeration to those in the country | 0.0496 | ||
| Technological innovation Factor Aggregating Ability (0.1568) | The ratio of professional and technical personnel per 10,000 people in the urban agglomeration to the national indicator level | 0.0373 | |
| The proportion of high-tech enterprises in the urban agglomeration to those in the country * | 0.0572 | ||
| The proportion of invention patent applications in the urban agglomeration to those in the country | 0.0623 | ||
| Public Facility Factor Aggregating Ability (0.1500) | The ratio of road network density in the urban agglomeration to the national indicator level * | 0.0256 | |
| The proportion of bus stations in the urban agglomeration to those in the country * | 0.0181 | ||
| The proportion of commercial supermarket service agencies in the urban agglomeration to those in the country * | 0.0196 | ||
| The proportion of catering service agencies in the urban agglomeration to those in the country * | 0.0191 | ||
| The proportion of hotel service agencies in the urban agglomeration to those in the country * | 0.0198 | ||
| The proportion of primary and secondary schools in the urban agglomeration to those in the country * | 0.0235 | ||
| The proportion of medical institutions in the urban agglomeration to those in the country * | 0.0243 | ||
| Cultural Factor Aggregating Ability (0.0569) | The ratio of cultural industry revenue as a share of GDP in the urban agglomeration to the national indicator level | 0.0273 | |
| The proportion of art institutions in the urban agglomeration to those in the country * | 0.0296 | ||
| Ecological Environment Factor Aggregating Ability (0.0614) | The ratio of environmental governance investment as a share of fiscal expenditure in the urban agglomeration to the national indicator level | 0.0285 | |
| The proportion of parks in the urban agglomeration to those in the country * | 0.0329 | ||
| Public Facility Factor Aggregating Ability (0.0614) | The proportion of government public finance income and expenditure ratio in the urban agglomeration to the national indicator level | 0.0151 | |
| The ratio of private economy added value as a share of GDP in the urban agglomeration to the national indicator level | 0.0463 | ||
| Opening-Up Factor Aggregating Ability (0.1164) | The proportion of actual inflow of foreign investment in the urban agglomeration to that in the country | 0.0556 | |
| The proportion of inbound tourists received in the urban agglomeration to those in the country | 0.0608 |
| Urban Agglomerations | Comprehensive Factors | Population Factor | Land Factor | Economic Factor | Financial Factor | Technological Innovation Factor | Public Facility Factor | Cultural Factor | Ecological Environment Factor | Policy Factor | Opening-Up Factor |
|---|---|---|---|---|---|---|---|---|---|---|---|
| Yangtze River Delta | 0.9245 | 0.0832 | 0.0677 | 0.1163 | 0.0990 | 0.1449 | 0.1400 | 0.0509 | 0.0472 | 0.0588 | 0.1164 |
| Beijing-Tianjin-Hebei | 0.5330 | 0.0566 | 0.0415 | 0.0617 | 0.0761 | 0.0815 | 0.0708 | 0.0453 | 0.0283 | 0.0146 | 0.0564 |
| Pearl River Delta | 0.4817 | 0.0448 | 0.0441 | 0.0440 | 0.0384 | 0.0699 | 0.0658 | 0.0186 | 0.0501 | 0.0405 | 0.0655 |
| The middle reaches of the Yangtze River | 0.4280 | 0.0779 | 0.0349 | 0.0663 | 0.0339 | 0.0380 | 0.0826 | 0.0340 | 0.0162 | 0.0119 | 0.0324 |
| Chengdu-Chongqing | 0.3023 | 0.0408 | 0.0294 | 0.0420 | 0.0308 | 0.0255 | 0.0769 | 0.0200 | 0.0111 | 0.0074 | 0.0183 |
| Shandong Peninsula | 0.2318 | 0.0526 | 0.0238 | 0.0341 | 0.0177 | 0.0149 | 0.0257 | 0.0111 | 0.0098 | 0.0226 | 0.0195 |
| Central Plains | 0.1763 | 0.0352 | 0.0193 | 0.0271 | 0.0154 | 0.0107 | 0.0350 | 0.0089 | 0.0043 | 0.0087 | 0.0118 |
| West Coast of the Straits | 0.1565 | 0.0287 | 0.0222 | 0.0176 | 0.0092 | 0.0077 | 0.0191 | 0.0060 | 0.0092 | 0.0188 | 0.0182 |
| Harbin-Changchun | 0.1478 | 0.0267 | 0.0201 | 0.0199 | 0.0142 | 0.0087 | 0.0233 | 0.0118 | 0.0067 | 0.0035 | 0.0129 |
| Central-southern of Liaoning | 0.1249 | 0.0188 | 0.0133 | 0.0104 | 0.0142 | 0.0095 | 0.0251 | 0.0080 | 0.0095 | 0.0105 | 0.0057 |
| Central Shaanxi Plain | 0.1178 | 0.0220 | 0.0146 | 0.0159 | 0.0120 | 0.0103 | 0.0241 | 0.0100 | 0.0016 | 0.0007 | 0.0065 |
| Beibu Gulf | 0.1021 | 0.0226 | 0.0137 | 0.0124 | 0.0081 | 0.0048 | 0.0191 | 0.0056 | 0.0074 | 0.0063 | 0.0020 |
| Hohhot-Baotou-Ordos-Yulin | 0.0967 | 0.0369 | 0.0165 | 0.0091 | 0.0027 | 0.0026 | 0.0035 | 0.0030 | 0.0087 | 0.0103 | 0.0033 |
| Central Guizhou | 0.0895 | 0.0461 | 0.0078 | 0.0035 | 0.0020 | 0.0022 | 0.0162 | 0.0017 | 0.0008 | 0.0077 | 0.0014 |
| Jinzhong regions | 0.0809 | 0.0440 | 0.0099 | 0.0036 | 0.0046 | 0.0021 | 0.0042 | 0.0038 | 0.0022 | 0.0052 | 0.0012 |
| Central Yunnan | 0.0707 | 0.0214 | 0.0135 | 0.0049 | 0.0027 | 0.0039 | 0.0094 | 0.0035 | 0.0026 | 0.0079 | 0.0009 |
| Lanzhou-Xining | 0.0511 | 0.0223 | 0.0079 | 0.0027 | 0.0025 | 0.0024 | 0.0064 | 0.0031 | 0.0010 | 0.0003 | 0.0026 |
| The northern slopes of the Tianshan Mountains | 0.0255 | 0.0036 | 0.0030 | 0.0008 | 0.0010 | 0.0018 | 0.0031 | 0.0007 | 0.0012 | 0.0102 | 0.0003 |
| The areas along the Huanghe River in Ningxia | 0.0156 | 0.0015 | 0.0002 | 0.0004 | 0.0001 | 0.0001 | 0.0006 | 0.0007 | 0.0092 | 0.0026 | 0.0001 |
| Urban Agglomerations | q Value | R2 | Equation | Primacy Ratio |
|---|---|---|---|---|
| Yangtze River Delta | 1.144 | 0.947 | y = −1.144x + 5.151 | 1.19 |
| Pearl River Delta | 1.001 | 0.925 | y = −1.001x + 4.199 | 1.01 |
| Beijing-Tianjin-Hebei | 0.941 | 0.966 | y = −0.941x + 3.969 | 1.16 |
| the middle reaches of the Yangtze River | 1.631 | 0.942 | y = −1.631x + 5.495 | 1.11 |
| Shandong Peninsula | 1.312 | 0.885 | y = −1.312x + 4.434 | 1.08 |
| Chengdu-Chongqing | 0.997 | 0.858 | y = −0.997x + 3.673 | 1.05 |
| West Coast of the Straits | 1.057 | 0.764 | y = −1.057x + 3.459 | 1.04 |
| Central Plains | 1.328 | 0.922 | y = −1.328x + 4.064 | 1.33 |
| Central-southern of Liaoning | 0.981 | 0.892 | y = −0.981x + 3.028 | 1.01 |
| Harbin-Changchun | 1.075 | 0.929 | y = −1.075x + 3.362 | 1.01 |
| Beibu Gulf | 1.300 | 0.933 | y = −1.300x + 3.548 | 1.29 |
| Central Shaanxi Plain | 0.944 | 0.925 | y = −0.944x + 0.925 | 1.59 |
| The northern slopes of the Tianshan Mountains | 0.766 | 0.924 | y = −0.766x +1.74 | 2.45 |
| Hohhot-Baotou-Ordos-Yulin | 2.267 | 0.849 | y = −2.267x + 5.366 | 1.06 |
| Lanzhou-Xining | 0.858 | 0.958 | y = −0.858x + 2.09 | 1.51 |
| Central Guizhou | 0.641 | 0.880 | y = −0.641x + 1.818 | 1.84 |
| Jinzhong regions | 0.992 | 0.995 | y = −0.992x + 2.515 | 1.42 |
| Central Yunnan | 0.803 | 0.941 | y = −0.803x + 2.216 | 1.73 |
| The areas along the Huanghe River in Ningxia | 0.749 | 0.998 | y = −0.749x + 1.481 | 1.98 |
© 2018 by the authors. Licensee MDPI, Basel, Switzerland. This article is an open access article distributed under the terms and conditions of the Creative Commons Attribution (CC BY) license (http://creativecommons.org/licenses/by/4.0/).
Share and Cite
Liu, C.; Wang, T.; Guo, Q. Factors Aggregating Ability and the Regional Differences among China’s Urban Agglomerations. Sustainability 2018, 10, 4179. https://doi.org/10.3390/su10114179
Liu C, Wang T, Guo Q. Factors Aggregating Ability and the Regional Differences among China’s Urban Agglomerations. Sustainability. 2018; 10(11):4179. https://doi.org/10.3390/su10114179
Chicago/Turabian StyleLiu, Chengliang, Tao Wang, and Qingbin Guo. 2018. "Factors Aggregating Ability and the Regional Differences among China’s Urban Agglomerations" Sustainability 10, no. 11: 4179. https://doi.org/10.3390/su10114179
APA StyleLiu, C., Wang, T., & Guo, Q. (2018). Factors Aggregating Ability and the Regional Differences among China’s Urban Agglomerations. Sustainability, 10(11), 4179. https://doi.org/10.3390/su10114179