Exploring the Consumer Attitude of Building-Attached Photovoltaic Equipment Using Revised Technology Acceptance Model


Abstract
1. Introduction
- ▪
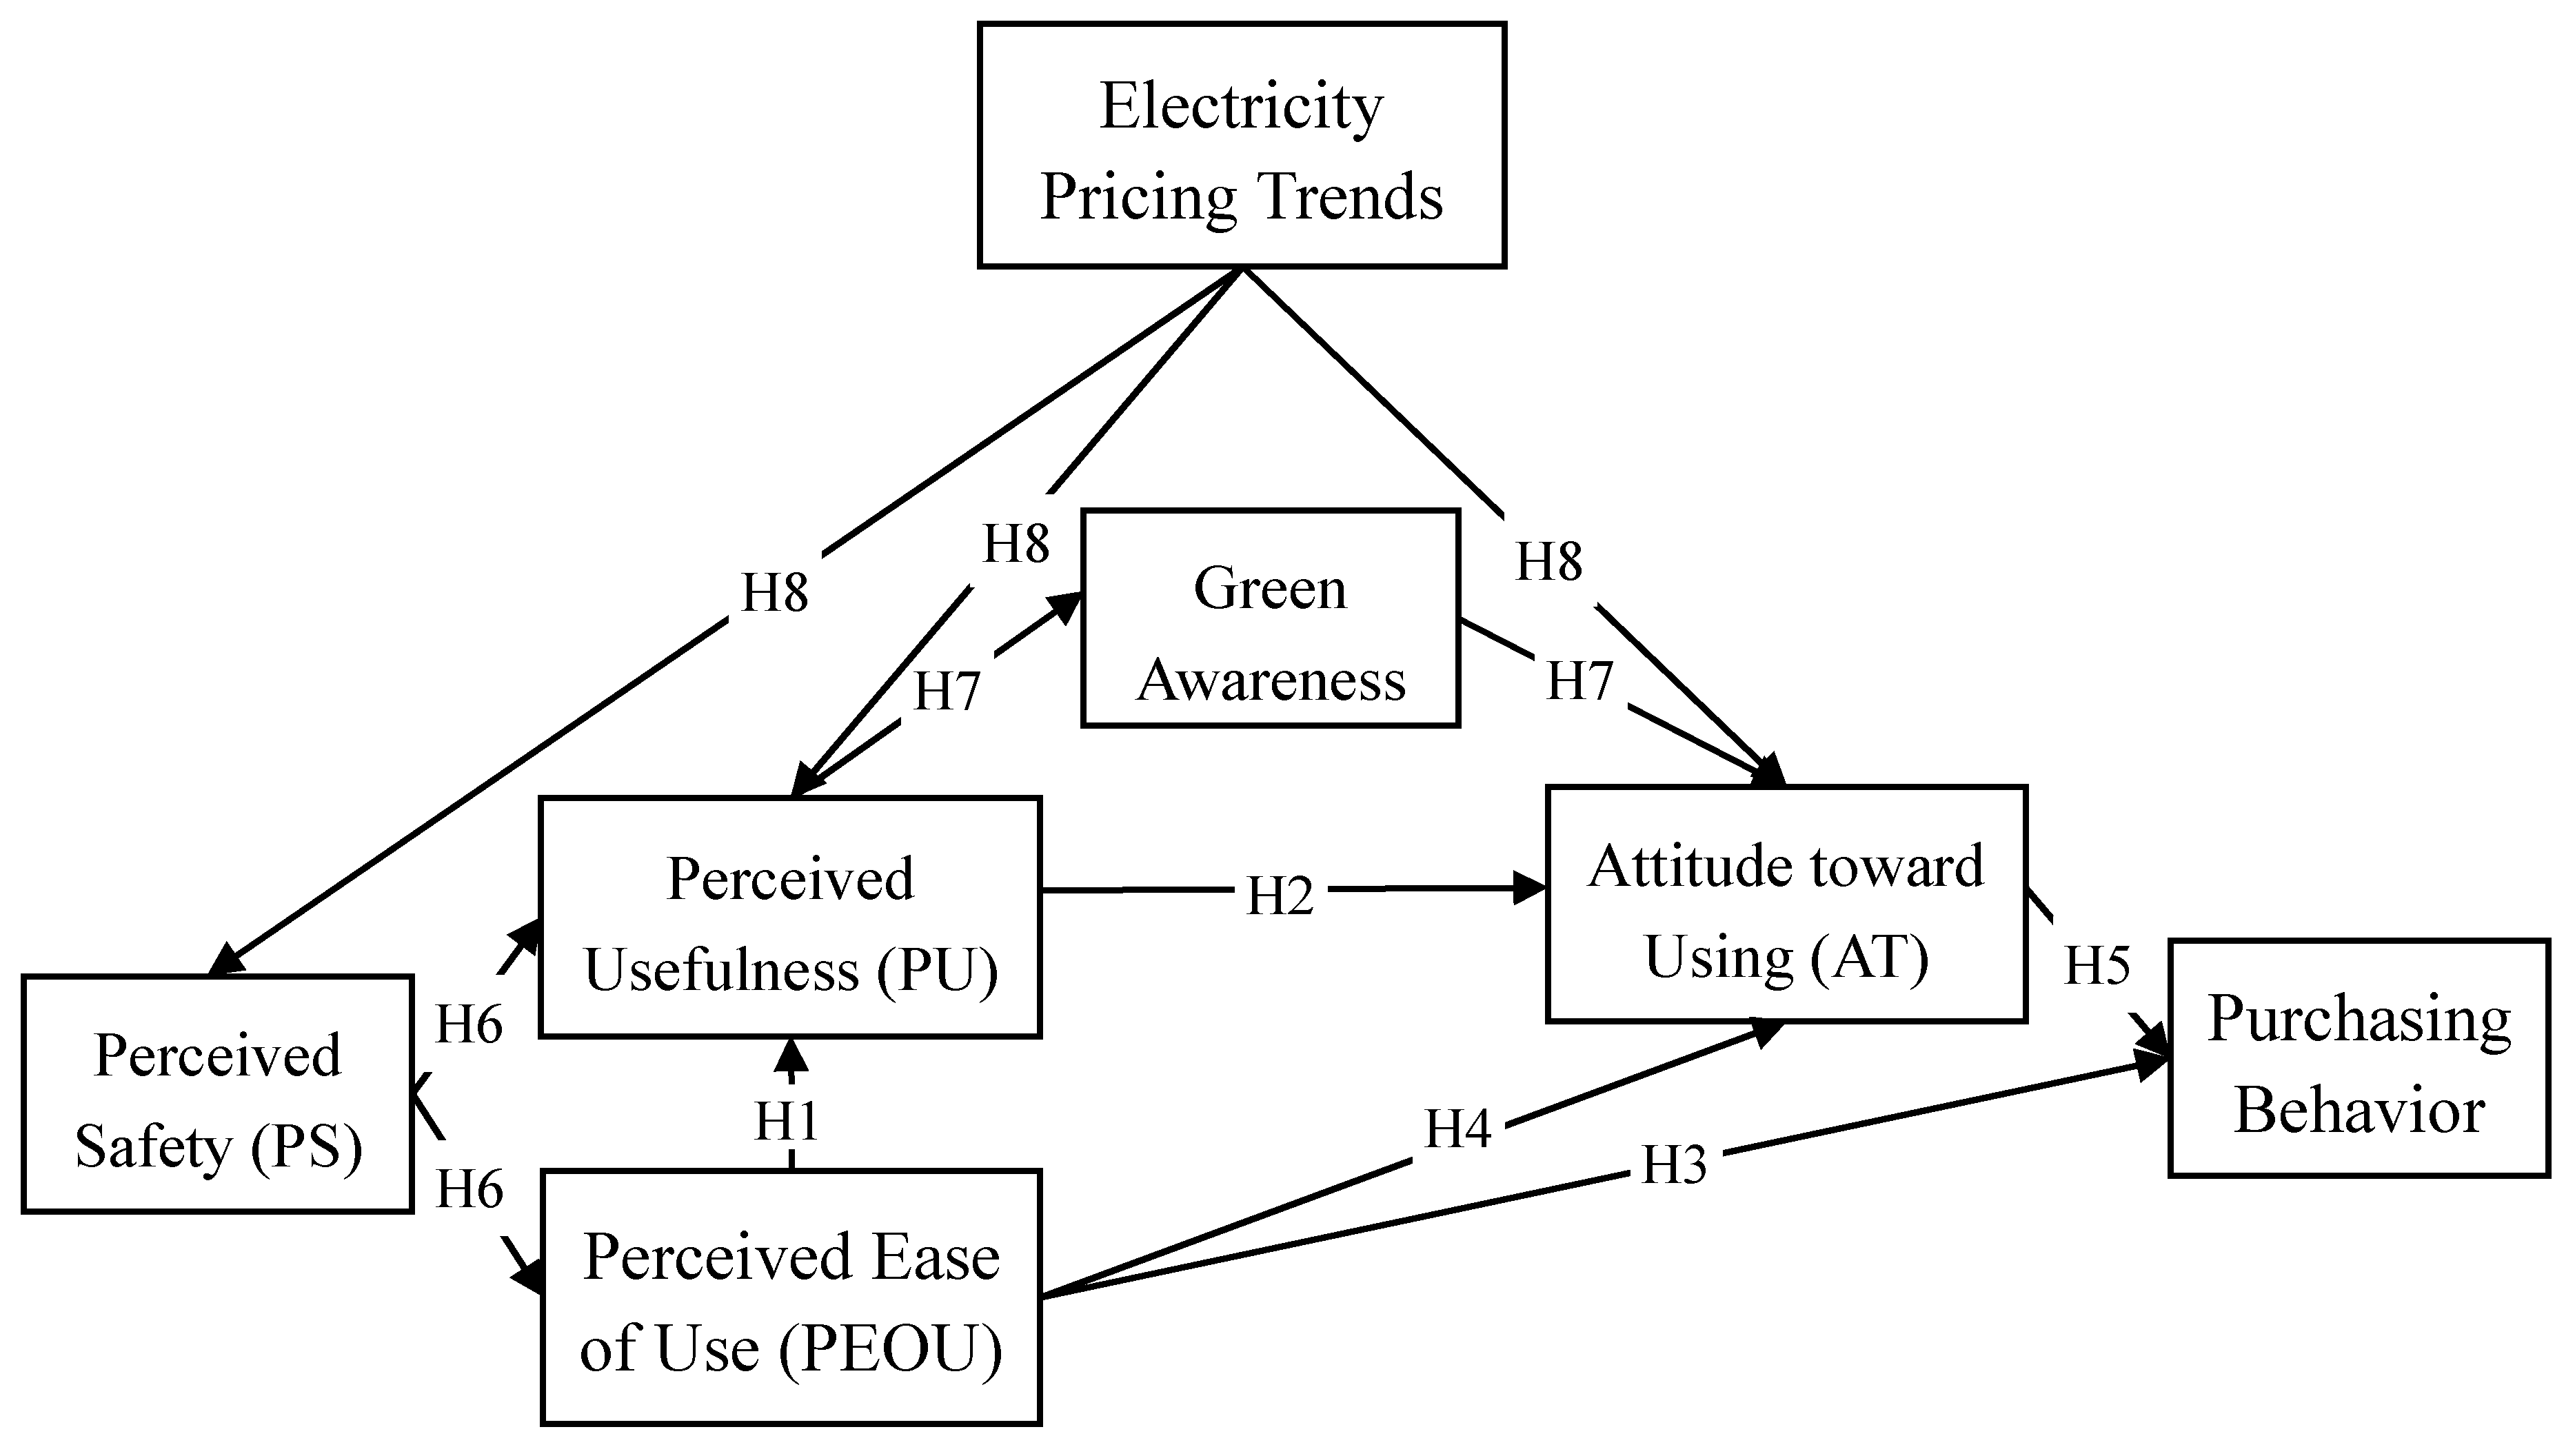
- Consumers’ perceived usefulness (PU), perceived ease of use (PEOU), and perceived safety (PS) of the BAPV systems.
- ▪
- Whether consumers’ perceived usefulness (PU), perceived ease of use (PEOU), and perceived safety (PS) of the BAPV system will positively affect their attitude toward using (AT) and purchasing behavior.
- ▪
- Whether external variables, such as electricity price trends and consumers’ green awareness, will positively affect consumers’ attitude toward using (AT) and purchasing behavior.
- ▪
- Whether consumers’ attitude toward using (AT) will directly affect their purchasing behavior.
2. Hypothesis Developments and Research Model
2.1. Grid-Connected Photovoltaic Power System
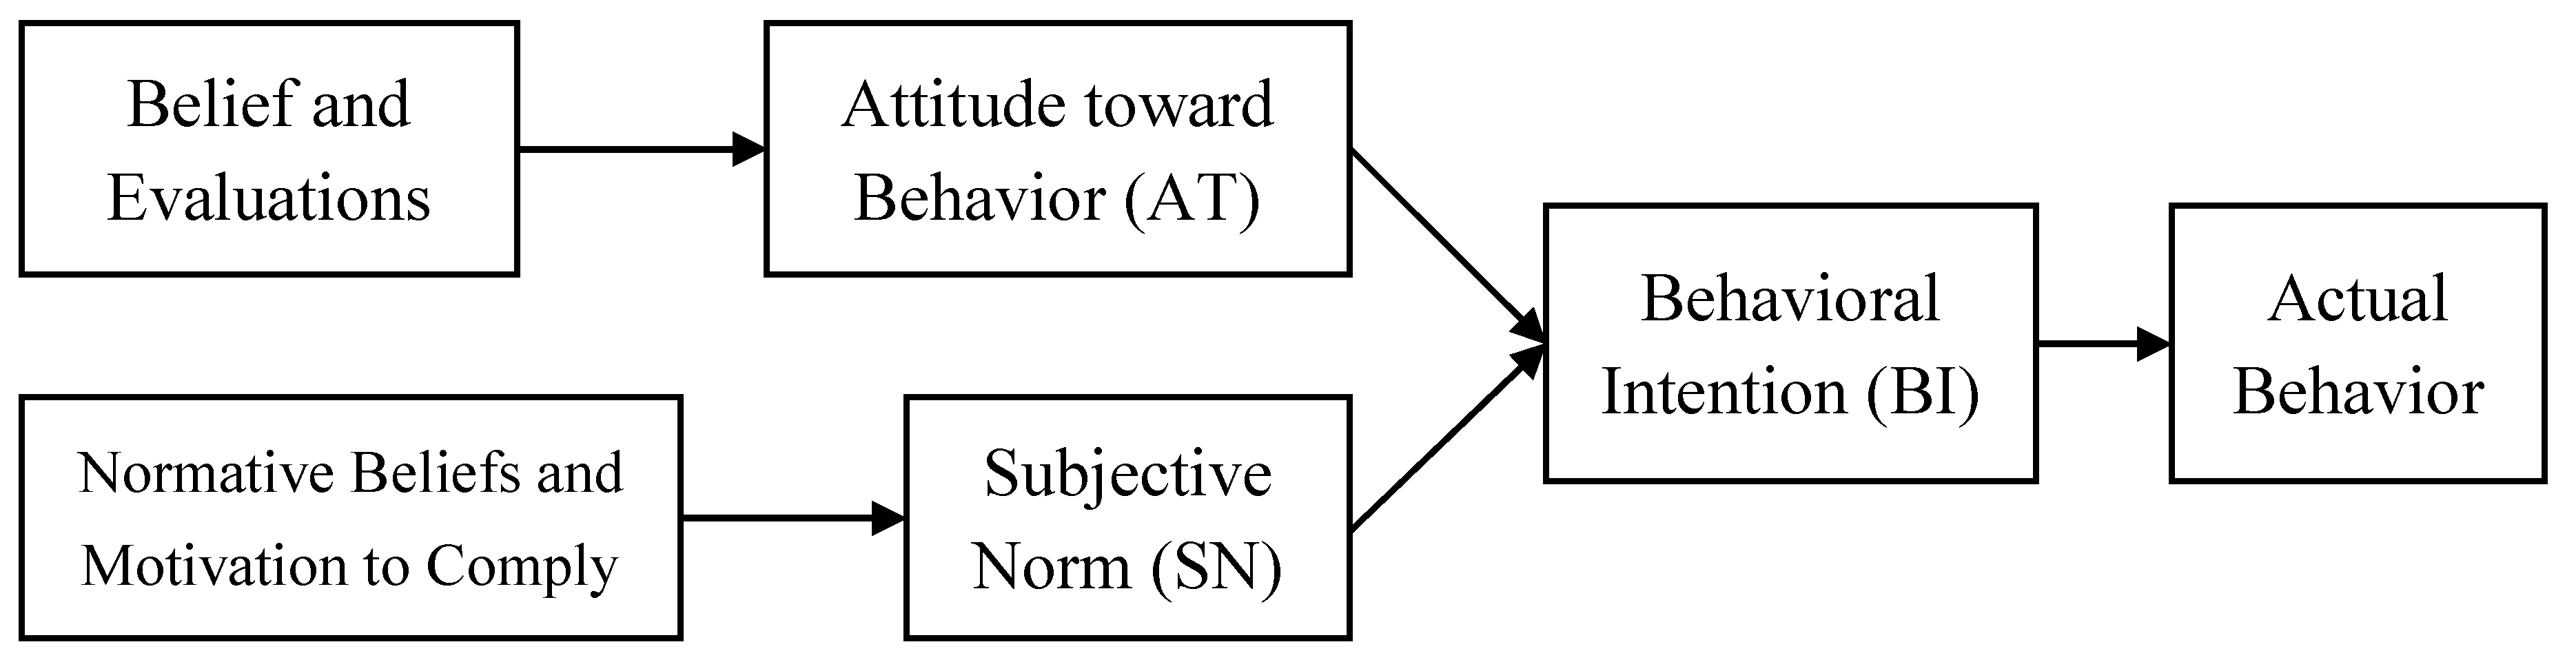
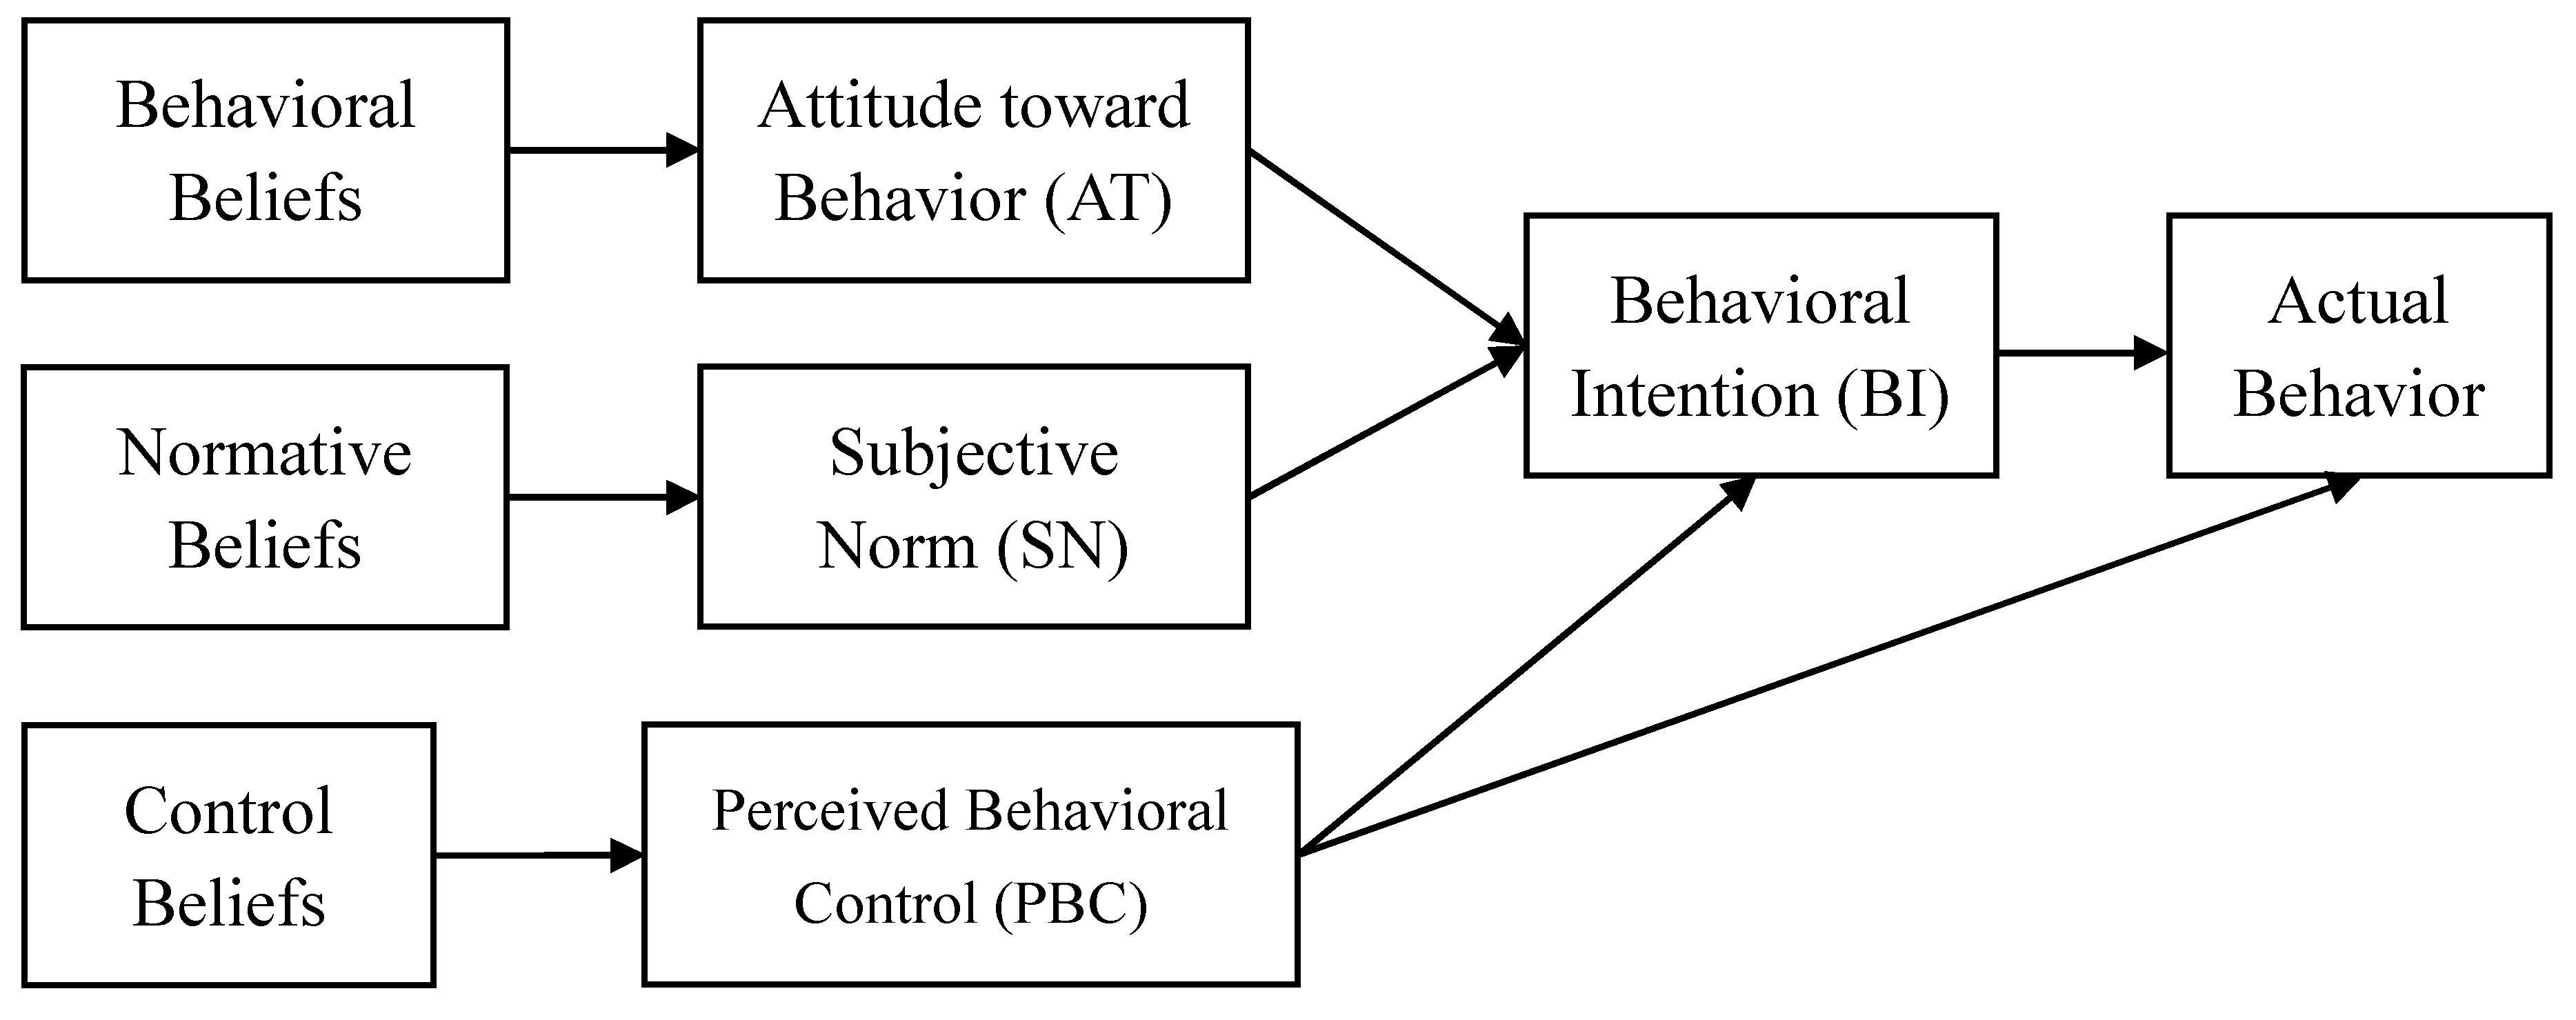
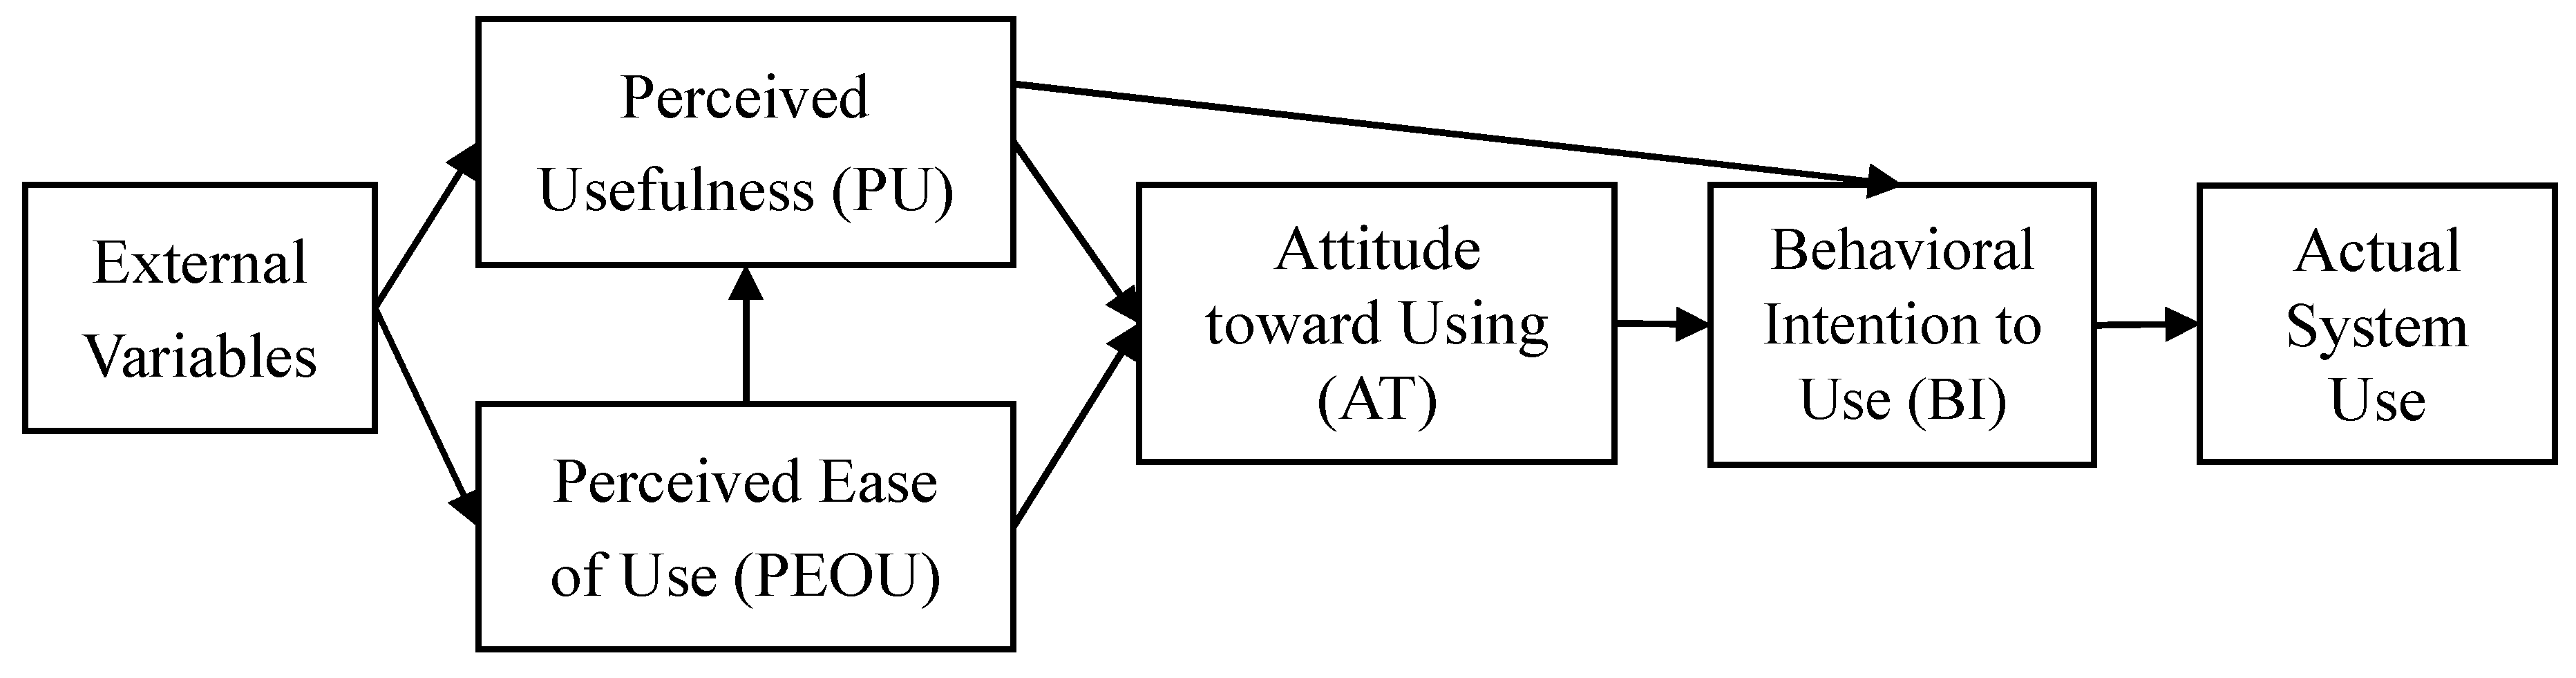
2.2. Technology Acceptance Model (TAM)
2.3. Green Awareness
2.4. Electricity Price Trend
3. Methodology
3.1. Sample and Data Collection
3.2. Measure Scale
3.3. Statistical Data Analysis
4. Results
4.1. Descriptive Statistics and Covariance Matrix
4.2. Confirmatory Factor Analysis (CFA)
4.3. Structural Equation Model Analysis and Hypothesis Test Results
5. Conclusions and Policy Implications
Author Contributions
Funding
Acknowledgments
Conflicts of Interest
References
- Sommerkorn, M.; Hassol, S.J. Arctic Climate Feedbacks: Global Implications; World Wide Fund for Nature: Godalming, UK, 2009. [Google Scholar]
- United Nations High Commissioner for Refugees [UNHCR], World at War: UNHCR Global Trends of Forced Displacement in 2014. 2015. Available online: http://www.unhcr.org/556725e69.pdf (accessed on 22 February 2017).
- Keane, D. The environmental causes and consequences of migration: A search for the meaning of environmental refugees. Georget. Int. Environ. Law Rev. 2003, 16, 209–223. [Google Scholar]
- Lehne, J.; Blyth, W.; Lahn, G.; Bazilian, M.; Grafham, O. Energy services for refugees and displaced people. Energy Strategy Rev. 2016, 13, 134–146. [Google Scholar] [CrossRef]
- Biermann, F.; Boas, I. Preparing for a warmer world: Towards a global governance system to protect climate refugees. Glob. Environ. Politics 2010, 10, 60–88. [Google Scholar] [CrossRef]
- Kraemer, R.A.; Mutanga, S.S.; Pophiwa, N.; Fetzek, S.; McGlade, K.; Schraven, B.; Khasru, S.M. Building Global Governance for Climate Refugees. 2017. Available online: http://www.g20-insights.org/ (accessed on 15 March 2017).
- United Nations Environment Program [UNEP]. The Guidelines for National Waster Management Strategies: Moving from Challenges to Opportunities. 2013. Available online: http://cwm.unitar.org/national-profiles/publications/cw/wm/UNEP_UNITAR_NWMS_English.pdf (accessed on 15 March 2017).
- Environmental Protection Administration of Taiwan. GHG Emissions Statistics. 2014. Available online: http://www.epa.gov.tw/ct.asp?xItem=10052&ctNode=31352&mp=epa (accessed on 15 March 2017).
- Lidskog, R.; Elander, I. Reinterpreting locational conflicts: NIMBY and nuclear waste management in Sweden. Policy Politics 1992, 20, 1–16. [Google Scholar] [CrossRef]
- Frantál, B.; Malý, J. Close or renew? Factors affecting local community support for rebuilding nuclear power plants in the Czech Republic. Energy Policy 2017, 104, 134–143. [Google Scholar] [CrossRef]
- Roh, S.; Kim, D. The factors of nuclear energy public acceptance and relative importance (public acceptance factors and relative importance). Energy Sources Part B Econ. Plan. Policy 2017, 12, 559–564. [Google Scholar] [CrossRef]
- United Nations Environment Program [UNEP]. Green Economy and Trade—Trends, Challenges and Opportunities. 2013. Available online: https://www.google.com/url?q=http://web.unep.org/greeneconomy/sites/unep.org.greeneconomy/files/field/image/fullreport.pdf (accessed on 18 March 2017).
- Bureau of Energy, Ministry of Economic Affairs. Million Solar Rooftop PVs. 2012. Available online: http://web3.moeaboe.gov.tw/ECW/english/content/Content.aspx?menu_id=1761 (accessed on 18 March 2017).
- Bureau of Energy, Ministry of Economic Affairs. Regulations on the Management of Renewable Energy Power Generation Equipment. 2015. Available online: http://web3.moeaboe.gov.tw/ECW/populace/Law/Content.aspx?menu_id=1096 (accessed on 18 March 2017).
- Leccisi, E.; Raugei, M.; Fthenakis, V. The Energy and environmental performance of ground-mounted photovoltaic systems—A timely update. Energies 2016, 9, 622. [Google Scholar] [CrossRef]
- Davis, F.D. Perceived usefulness, perceived ease of use, and user acceptance of information technology. MIS Q. 1989, 13, 319–340. [Google Scholar] [CrossRef]
- Fishbein, M.; Ajzen, I. Belief, Attitude, Intention, and Behavior: An Introduction to Theory and Research; Addison Wesley: Reading, MA, USA, 1977. [Google Scholar]
- Fishbein, M.; Ajzen, I. Predicting and Changing Behavior: The Reasoned Action Approach; Taylor Francis: New York, NY, USA, 2011. [Google Scholar]
- Ajzen, I. From intentions to actions: A theory of planned behavior. In Action Control: From Cognition to Behavior; Kuhl, J., Beckman, J., Eds.; Springer: Berlin, Germany, 1985; pp. 11–39. [Google Scholar]
- Igbaria, M.; Guimaraes, T.; Davis, G.B. Testing the determinants of microcomputer usage via a structural equation model. J. Manag. Inf. Syst. 1995, 11, 87–114. [Google Scholar] [CrossRef]
- Dulany, D.E. Hypotheses and habits in verbal operant conditioning. J. Abnorm. Soc. Psychol. 1961, 63, 251–263. [Google Scholar] [CrossRef] [PubMed]
- Dulany, D.E. Awareness, rules, and propositional control: A confrontation with SR behavior theory. In Verbal Behavior and General Behavior Theory; Dixon Deryck Horton, T., Ed.; Prentice-Hall: Upper Saddle River, NJ, USA, 1968. [Google Scholar]
- Ajzen, I. The theory of planned behavior. Organ. Behav. Hum. Decis. Process. 1991, 50, 179–211. [Google Scholar] [CrossRef]
- Ajzen, I.; Madden, T.J. Prediction of goal-directed behavior-attitudes, intentions, and perceived behavioral-control. J. Exp. Soc. Psychol. 1986, 22, 453–474. [Google Scholar] [CrossRef]
- Bandura, A. Self-efficacy: Toward a unifying theory of behavioral change. Psychol. Rev. 1977, 84, 191–215. [Google Scholar] [CrossRef] [PubMed]
- Bandura, A. Self-efficacy mechanism in human agency. Am. Psychol. 1982, 37, 122–147. [Google Scholar] [CrossRef]
- Venkatesh, V.; Davis, F.D. A theoretical extension of the technology acceptance model: Four longitudinal field studies. Manag. Sci. 2000, 46, 186–204. [Google Scholar] [CrossRef]
- Venkatesh, V.; Morris, M.G.; Davis, G.B.; Davis, F.D. User acceptance of information technology: Toward a unified view. MIS Q. 2003, 27, 425–478. [Google Scholar] [CrossRef]
- Fathema, N.; Shannon, D.; Ross, M. Expanding the technology acceptance model (TAM) to examine faculty use of learning management systems (LMSs) in higher education institutions. MERLOT J. Online Learn. Teach. 2015, 11, 210–232. [Google Scholar]
- Mohammadi, H. Factors affecting the e-learning outcomes: An integration of TAM and IS success model. Telemat. Inform. 2015, 32, 701–719. [Google Scholar] [CrossRef]
- Chuah, S.H.W.; Rauschnabel, P.A.; Krey, N.; Nguyen, B.; Ramayah, T.; Lade, S. Wearable technologies: The role of usefulness and visibility in smartwatch adoption. Comput. Hum. Behav. 2016, 65, 276–284. [Google Scholar] [CrossRef]
- Kardooni, R.; Yusoff, S.B.; Kari, F.B. Renewable energy technology acceptance in Peninsular Malaysia. Energy Policy 2016, 88, 1–10. [Google Scholar] [CrossRef]
- Hung, S.Y.; Liang, T.P.; Chang, C.M. A meta-analysis of empirical research using TAM. J. Inf. Manag. 2005, 12, 211–234. [Google Scholar]
- Conner, M.; Armitage, C.J. Extending the theory of planned behavior: A review and avenues for further research. J. Appl. Soc. Psychol. 1998, 28, 1429–1464. [Google Scholar] [CrossRef]
- Amaro, S.; Duarte, P. An integrative model of consumers’ intentions to purchase travel online. Tour. Manag. 2015, 46, 64–79. [Google Scholar] [CrossRef]
- Jacoby, J.; Kyner, D.B. Brand loyalty vs. repeat purchasing behavior. J. Market. Res. 1973, 10, 1–9. [Google Scholar] [CrossRef]
- Nunkoo, R.; Juwaheer, T.D.; Rambhunjun, T. Applying the extended technology acceptance model to understand online purchase behavior of travelers. In Proceedings of the 21st International Business Research Conference, Toronto, ON, Canada, 10–11 June 2013. [Google Scholar]
- Tae, W.S.; Kim, S.S.; Lee, K.U.; Nam, E.C.; Kim, K.W. Validation of hippocampal volumes measured using a manual method and two automated methods (FreeSurfer and IBASPM) in chronic major depressive disorder. Neuroradiology 2008, 50, 569–581. [Google Scholar] [CrossRef] [PubMed]
- Lin, J.C.C.; Lu, H. Towards an understanding of the behavioural intention to use a web site. Int. J. Inf. Manag. 2000, 20, 197–208. [Google Scholar]
- Legris, P.; Ingham, J.; Collerette, P. Why do people use information technology? A critical review of the technology acceptance model. Inf. Manag. 2003, 40, 191–204. [Google Scholar] [CrossRef]
- Seddon, P.B. A respecification and extension of the DeLone and McLean model of IS success. Inf. Syst. Res. 1997, 8, 240–253. [Google Scholar] [CrossRef]
- Iacobici-Luca, N.; Frigura-Iliasa, F.M.; Vatau, D.; Andea, P. Power quality assessment system for a 220 kV/110 kV high voltage power station. In Proceedings of the Electric Power Quality and Supply Reliability (PQ), Tallinn, Estonia, 29–31 August 2016; pp. 267–272. [Google Scholar] [CrossRef]
- Cano-Plata, E.A.; Jimenez-Lozano, G.; Soto-Marín, O.J.; Ustariz-Farfán, A.J.; Wilches, J.A.O.; Arcila, M.C.C.; Estrada, J.H. Hybrid simulation of power quality assessment: An application for power ground grid in arc furnace systems. IEEE Trans. Ind. Appl. 2016, 52, 2648–2653. [Google Scholar] [CrossRef]
- DeLone, W.H.; McLean, E.R. Information systems success: The quest for the dependent variable. Inf. Syst. Res. 1992, 3, 60–95. [Google Scholar] [CrossRef]
- Delone, W.H.; McLean, E.R. The DeLone and McLean model of information systems success: A ten-year update. J. Manag. Inf. Syst. 2003, 19, 9–30. [Google Scholar]
- Intergovernmental Panel on Climate Change (IPCC). Global Warming of 1.5 °C Report. Available online: http://ipcc.ch/report/sr15/ (accessed on 26 March 2017).
- Environmental Protection Agency (EPA). Overview of Climate Change Science. 2017. Available online: https://www.epa.gov/climate-change-science/overview-climate-change-science (accessed on 26 March 2017).
- Saboori, B.; Sulaiman, J.; Mohd, S. Economic growth and CO2 emissions in Malaysia: A cointegration analysis of the environmental Kuznets curve. Energy Policy 2012, 51, 184–191. [Google Scholar] [CrossRef]
- United Nations Framework Convention on Climate Change [UNFCCC]. Copenhagen Climate Change Conference. 2009. Available online: http://unfccc.int/meetings/copenhagen_dec_2009/meeting/6295.php (accessed on 3 April 2017).
- Alam, M.; Akram, D.; Sharmin, E.; Zafar, F.; Ahmad, S. Vegetable oil based eco-friendly coating materials: A review article. Arab. J. Chem. 2014, 7, 469–479. [Google Scholar] [CrossRef]
- Boztepe, A. Green marketing and its impact on consumer buying behavior. Eur. J. Econ. Political Stud. 2012, 5, 5–21. [Google Scholar]
- Khan, S.N.; Mohsin, M. The power of emotional value: Exploring the effects of values on green product consumer choice behavior. J. Clean. Prod. 2017, 150, 65–74. [Google Scholar] [CrossRef]
- Sangroya, D.; Nayak, J.K. Factors influencing buying behaviour of green energy consumer. J. Clean. Prod. 2017, 151, 393–405. [Google Scholar] [CrossRef]
- Rashid, N.R.N.A. Awareness of eco-label in Malaysia’s green marketing initiative. Int. J. Bus. Manag. 2009, 4, 132. [Google Scholar] [CrossRef]
- Norazah, M.S. Green products purchases: Structural relationships of consumers’ perception of Eco-Label, Eco-Brand and environmental advertisement. J. Sustain. Sci. Manag. 2013, 8, 1–10. [Google Scholar]
- Rahbar, E.; Abdul Wahid, N. Investigation of green marketing tools’ effect on consumers’ purchase behavior. Bus. Strategy Ser. 2011, 12, 73–83. [Google Scholar] [CrossRef]
- Laroche, M.; Bergeron, J.; Barbaro-Forleo, G. Targeting consumers who are willing to pay more for environmentally friendly products. J. Consum. Market. 2001, 18, 503–520. [Google Scholar] [CrossRef]
- Han, H.; Hsu, L.T.J.; Sheu, C. Application of the theory of planned behavior to green hotel choice: Testing the effect of environmental friendly activities. Tour. Manag. 2010, 31, 325–334. [Google Scholar] [CrossRef]
- Tan, L.P.; Johnstone, M.L.; Yang, L. Barriers to green consumption behaviours: The roles of consumers’ green perceptions. Australas. Market. J. (AMJ) 2016, 24, 288–299. [Google Scholar] [CrossRef]
- Lichtenstein, D.R.; Bloch, P.H.; Black, W.C. Correlates of price acceptability. J. Consum. Res. 1988, 15, 243–252. [Google Scholar] [CrossRef]
- Parguel, B.; Delécolle, T.; Valette-Florence, P. How price display influences consumer luxury perceptions. J. Bus. Res. 2016, 69, 341–348. [Google Scholar] [CrossRef]
- Shirai, M. Effects of price reframing tactics on consumer perceptions. J. Retail. Consum. Serv. 2017, 34, 82–87. [Google Scholar] [CrossRef]
- Dodds, W.B.; Monroe, K.B. The effect of brand and price information on subjective product evaluations. NA-Adv. Consum. Res. 1985, 12, 85–90. [Google Scholar]
- Lin, J.; Lobo, A.; Leckie, C. The role of benefits and transparency in shaping consumers’ green perceived value, self-brand connection and brand loyalty. J. Retail. Consum. Serv. 2017, 35, 133–141. [Google Scholar] [CrossRef]
- Lovelock, C.H. Services Marketing: People, Technology, Strategy, 4th ed.; Prentice Hall International: New York, NY, USA, 2001. [Google Scholar]
- Yu, J.; Lee, H.; Ha, I.; Zo, H. User acceptance of media tablets: An empirical examination of perceived value. Telemat. Inform. 2015, 34, 206–223. [Google Scholar] [CrossRef]
- Zeithaml, V.A. Consumer perceptions of price, quality, and value: A means-end model and synthesis of evidence. J. Market. 1988, 52, 2–22. [Google Scholar] [CrossRef]
- Grewal, D.; Monroe, K.B.; Krishnan, R. The effects of price-comparison advertising on buyers’ perceptions of acquisition value, transaction value, and behavioral intentions. J. Market. 1998, 62, 46–59. [Google Scholar] [CrossRef]
- Hänninena, N.; Karjaluotoa, H. Environmental values and customer-perceived value in industrial supplier relationships. J. Clean. Prod. 2017, 156, 604–613. [Google Scholar] [CrossRef]
- Taylor, S.; Todd, P.A. Understanding information technology usage: A test of competing models. Inf. Syst. Res. 1995, 6, 144–176. [Google Scholar] [CrossRef]
- Dunlap, R.E.; Liere, K.D.V.; Dillman, D.A. Evidence of decline in public concern with environmental quality: A reply. Rural Sociol. 1979, 44, 204–212. [Google Scholar]
- Petrick, J.F. Development of a multi-dimensional scale for measuring the perceived value of a service. J. Leis. Res. 2002, 34, 119. [Google Scholar] [CrossRef]
- Hair, J.F.; Black, W.C.; Babin, B.J.; Anderson, R.E.; Tatham, R.L. Multivariate Data Analysis, 6th ed.; Pearson Prentice Hall: Upper Saddle River, NJ, USA, 2006. [Google Scholar]
- Directorate-General of Budget Accounting and Statistics (DGBAS). Report on the Survey of Family Income Expenditure. 2014. Available online: http://win.dgbas.gov.tw/fies/a11.asp?year=103 (accessed on 4 April 2017).
- Anderson, J.C.; Gerbing, D.W. Structural equation modeling in practice: A review and recommended two-step approach. Psychol. Bull. 1988, 103, 411. [Google Scholar] [CrossRef]
- Peterson, R.A. A meta-analysis of cronbach’s coefficient alpha. J. Consum. Res. 1994, 21, 381–391. [Google Scholar] [CrossRef]
- Bollen, K.A. A new incremental fit index for general structural equation models. Sociol. Methods Res. 1989, 17, 303–316. [Google Scholar] [CrossRef]
- Bentler, P.M.; Wu, E.J. EQS-Windows User’s Guide, version 4; BMDP Statistical Software: Los Angeles, CA, USA, 1993. [Google Scholar]
- Jöreskog, K.G.; Sörbom, D. LISREL 7: A Guide to the Program and Applications; SPSS: Chicago, IL, USA, 1989. [Google Scholar]
- Fornell, C.; Larcker, D.F. Evaluating structural equation models with unobservable variables and measurement error. J. Market. Res. 1981, 18, 39–50. [Google Scholar] [CrossRef]
- Bagozzi, R.P.; Yi, Y. On the evaluation of structural equation models. J. Acad. Market. Sci. 1988, 16, 74–94. [Google Scholar] [CrossRef]
- Gode, D.K.; Sunder, S. Allocative efficiency of markets with zero-intelligence traders: Market as a partial substitute for individual rationality. J. Political Econ. 1993, 101, 119–137. [Google Scholar] [CrossRef]
- Jha, S.K.; Puppala, H. Prospects of Renewable Energy Sources in India: Prioritization of Alternative Sources in Terms of Energy Index. Energy 2017, 127, 116–127. [Google Scholar] [CrossRef]
- Niu, D.X.; Song, Z.Y.; Xiao, X.L. Electric power substitution for coal in China: Status quo and SWOT analysis. Renew. Sustain. Energy Rev. 2017, 70, 610–622. [Google Scholar] [CrossRef]
- Tsoutsos, T.; Frantzeskaki, N.; Gekas, V. Environmental impacts from the solar energy technologies. Energy Policy 2005, 33, 289–296. [Google Scholar] [CrossRef]


| Variable | Operational Definition | Measurement |
|---|---|---|
| Perceived usefulness | The degree to which the user-satisfaction of the individual was achieved | Davis [13] |
| Perceived ease of use | The degree to which the equipment was easy to use | Davis [13] |
| Perceived safety | The degree to which the equipment was used safely | DeLone & McLean [44] |
| Electricity price trend | The degree to which the electricity pricing fluctuated up/down | Petrick [72] |
| Attitude toward using | A feeling or opinion about solar power systems that led to an action | Taylor & Todd [70] |
| Purchasing behavior | The intention to which the user was willing to buy/recommend solar power systems or not | Taylor & Todd [70] |
| Green awareness | The public awareness of environmental awareness and maintained behavior toward the natural environment | Dunlap et al. [71] |
| Variables | Frequency | Percent (%) | Variables | Frequency | Percent (%) |
|---|---|---|---|---|---|
| Gender (n = 483) | |||||
| Male | 222 | 46.0 | Master graduate | 161 | 33.3 |
| Female | 261 | 54.0 | PhD graduate | 10 | 2.1 |
| Age | Monthly personal income | ||||
| 20–29 | 195 | 40.4 | Less than NT$20,000 | 168 | 34.8 |
| 30–39 | 73 | 15.1 | NT$20,001–$40,000 | 83 | 17.2 |
| 40–49 | 84 | 17.4 | NT$40,001–$60,000 | 118 | 24.4 |
| 50–59 | 91 | 18.8 | NT$60,001–$80,000 | 52 | 10.8 |
| 60 years and older | 40 | 8.3 | NT$80,001–$100,000 | 28 | 5.8 |
| District | NT$100,001–$150,000 | 28 | 5.8 | ||
| Taipei City | 183 | 37.9 | Over NT$150,001 | 6 | 1.2 |
| New Taipei City | 171 | 35.4 | Career | ||
| Other Northern Area | 129 | 26.7 | Traditional occupation | 1 | 0.2 |
| Marital status | Manufacturing industry | 18 | 3.7 | ||
| Single or not married | 267 | 55.3 | Information technology | 66 | 13.7 |
| Married | 215 | 44.5 | Service industry | 52 | 10.8 |
| Education | Financial industry | 30 | 6.2 | ||
| Freelance | 24 | 5.0 | Civil servants | 67 | 13.9 |
| Others | 19 | 3.9 | Student | 157 | 32.5 |
| Junior high school | 1 | 0.2 | Housekeeper | 21 | 4.3 |
| High school graduate | 37 | 7.7 | Retired | 28 | 5.8 |
| College graduate | 274 | 56.7 |
| Variables | Frequency | Percent (%) |
|---|---|---|
| Using experience (n = 483) | ||
| Yes | 61 | 12.6 |
| No | 422 | 87.4 |
| Using period | ||
| Never | 422 | - |
| <1 year | 24 | 39.3 |
| 1–3 years | 18 | 29.5 |
| 3–5 years | 4 | 6.6 |
| Over 5 years | 15 | 24.6 |
| Awareness degree of recovery-pricing regulation | ||
| Completely understand | 12 | 2.5 |
| Partially understand | 196 | 40.6 |
| None | 275 | 56.9 |
| Awareness degree of the government subsidy regulation | ||
| Completely understand | 12 | 2.5 |
| Partial understand | 196 | 40.6 |
| None | 275 | 56.9 |
| Items | PU1 | PU2 | PE1 | PE2 | PS1 | PS2 | PS3 | EP1 | EP2 | AT1 | AT2 | AT3 | PB1 | PB2 | PB3 | GR1 | GR2 | GR3 | Mean | Std. Dev. |
|---|---|---|---|---|---|---|---|---|---|---|---|---|---|---|---|---|---|---|---|---|
| PU1 | 1.15 | 5.92 | 1.07 | |||||||||||||||||
| PU2 | 0.62 | 1.78 | 5.36 | 1.34 | ||||||||||||||||
| PE1 | 0.50 | 0.84 | 2.61 | 3.96 | 1.62 | |||||||||||||||
| PE2 | 0.36 | 0.61 | 1.52 | 2.86 | 4.17 | 1.69 | ||||||||||||||
| PS1 | 0.50 | 0.85 | 0.88 | 0.64 | 2.05 | 4.77 | 1.43 | |||||||||||||
| PS2 | 0.51 | 0.86 | 0.89 | 0.65 | 1.48 | 1.74 | 4.97 | 1.32 | ||||||||||||
| PS3 | 0.38 | 0.65 | 0.67 | 0.49 | 1.12 | 1.13 | 1.75 | 5.33 | 1.32 | |||||||||||
| EP1 | 0.33 | 0.55 | 0.32 | 0.23 | 0.54 | 0.54 | 0.41 | 1.88 | 5.11 | 1.37 | ||||||||||
| EP2 | 0.33 | 0.55 | 0.32 | 0.24 | 0.54 | 0.55 | 0.41 | 1.57 | 1.80 | 5.25 | 1.34 | |||||||||
| AT1 | 0.43 | 0.73 | 0.42 | 0.31 | 0.59 | 0.60 | 0.45 | 0.59 | 0.59 | 1.26 | 5.75 | 1.13 | ||||||||
| AT2 | 0.45 | 0.75 | 0.44 | 0.32 | 0.61 | 0.62 | 0.47 | 0.61 | 0.61 | 1.04 | 1.53 | 5.40 | 1.24 | |||||||
| AT3 | 0.33 | 0.55 | 0.32 | 0.23 | 0.45 | 0.45 | 0.34 | 0.45 | 0.45 | 0.76 | 0.79 | 1.03 | 6.00 | 1.02 | ||||||
| PB1 | 0.41 | 0.78 | 0.53 | 0.38 | 0.58 | 0.59 | 0.44 | 0.58 | 0.58 | 0.89 | 0.93 | 0.68 | 1.49 | 5.60 | 1.23 | |||||
| PB2 | 0.46 | 0.77 | 0.59 | 0.43 | 0.65 | 0.66 | 0.50 | 0.65 | 0.65 | 1.00 | 1.04 | 0.75 | 1.11 | 1.53 | 5.48 | 1.24 | ||||
| PB3 | 0.47 | 0.69 | 0.60 | 0.43 | 0.66 | 0.67 | 0.50 | 0.66 | 0.66 | 1.01 | 1.05 | 0.76 | 1.12 | 1.26 | 1.67 | 5.23 | 1.30 | |||
| GR1 | 0.10 | 0.17 | 0.14 | 0.10 | 0.14 | 0.15 | 0.11 | 0.09 | 0.09 | 0.24 | 0.24 | 0.18 | 0.21 | 0.24 | 0.24 | 0.70 | 6.38 | 0.83 | ||
| GR2 | 0.07 | 0.12 | 0.10 | 0.08 | 0.11 | 0.11 | 0.08 | 0.07 | 0.07 | 0.17 | 0.18 | 0.13 | 0.16 | 0.17 | 0.18 | 0.31 | 0.50 | 6.59 | 0.71 | |
| GR3 | 0.09 | 0.15 | 0.13 | 0.09 | 0.13 | 0.13 | 0.10 | 0.08 | 0.08 | 0.21 | 0.22 | 0.16 | 0.19 | 0.21 | 0.21 | 0.38 | 0.28 | 0.50 | 6.55 | 0.70 |
| Scale Items | Standardized Loadings | p-Values | SMCs | CCR | AVE |
|---|---|---|---|---|---|
| Perceived usefulness (α = 0.63) | 0.62 | 0.45 | |||
| PU1 | 0.57 | - | 0.33 | ||
| PU2 | 0.76 | *** | 0.58 | ||
| Perceived ease of use (α = 0.71) | 0.74 | 0.59 | |||
| PE1 | 0.89 | - | 0.79 | ||
| PE2 | 0.62 | *** | 0.38 | ||
| Perceived safety (α = 0.86) | 0.87 | 0.69 | |||
| PS1 | 0.84 | *** | 0.71 | ||
| PS2 | 0.93 | *** | 0.87 | ||
| PS3 | 0.70 | - | 0.49 | ||
| Electricity price trend (α = 0.92) | |||||
| EP1 | 0.83 | *** | 0.69 | 0.85 | 0.73 |
| EP2 | 0.88 | - | 0.77 | ||
| Attitude toward using (α = 0.87) | 0.87 | 0.69 | |||
| AT1 | 0.89 | - | 0.80 | ||
| AT2 | 0.84 | *** | 0.71 | ||
| AT3 | 0.75 | *** | 0.56 | ||
| Purchasing behavior (α = 0.90) | 0.90 | 0.75 | |||
| PB1 | 0.82 | - | 0.67 | ||
| PB2 | 0.90 | *** | 0.81 | ||
| PB3 | 0.87 | *** | 0.76 | ||
| Green awareness (α = 0.80) | 0.81 | 0.58 | |||
| GR1 | 0.78 | *** | 0.39 | ||
| GR2 | 0.68 | *** | 0.54 | ||
| GR3 | 0.82 | - | 0.33 |
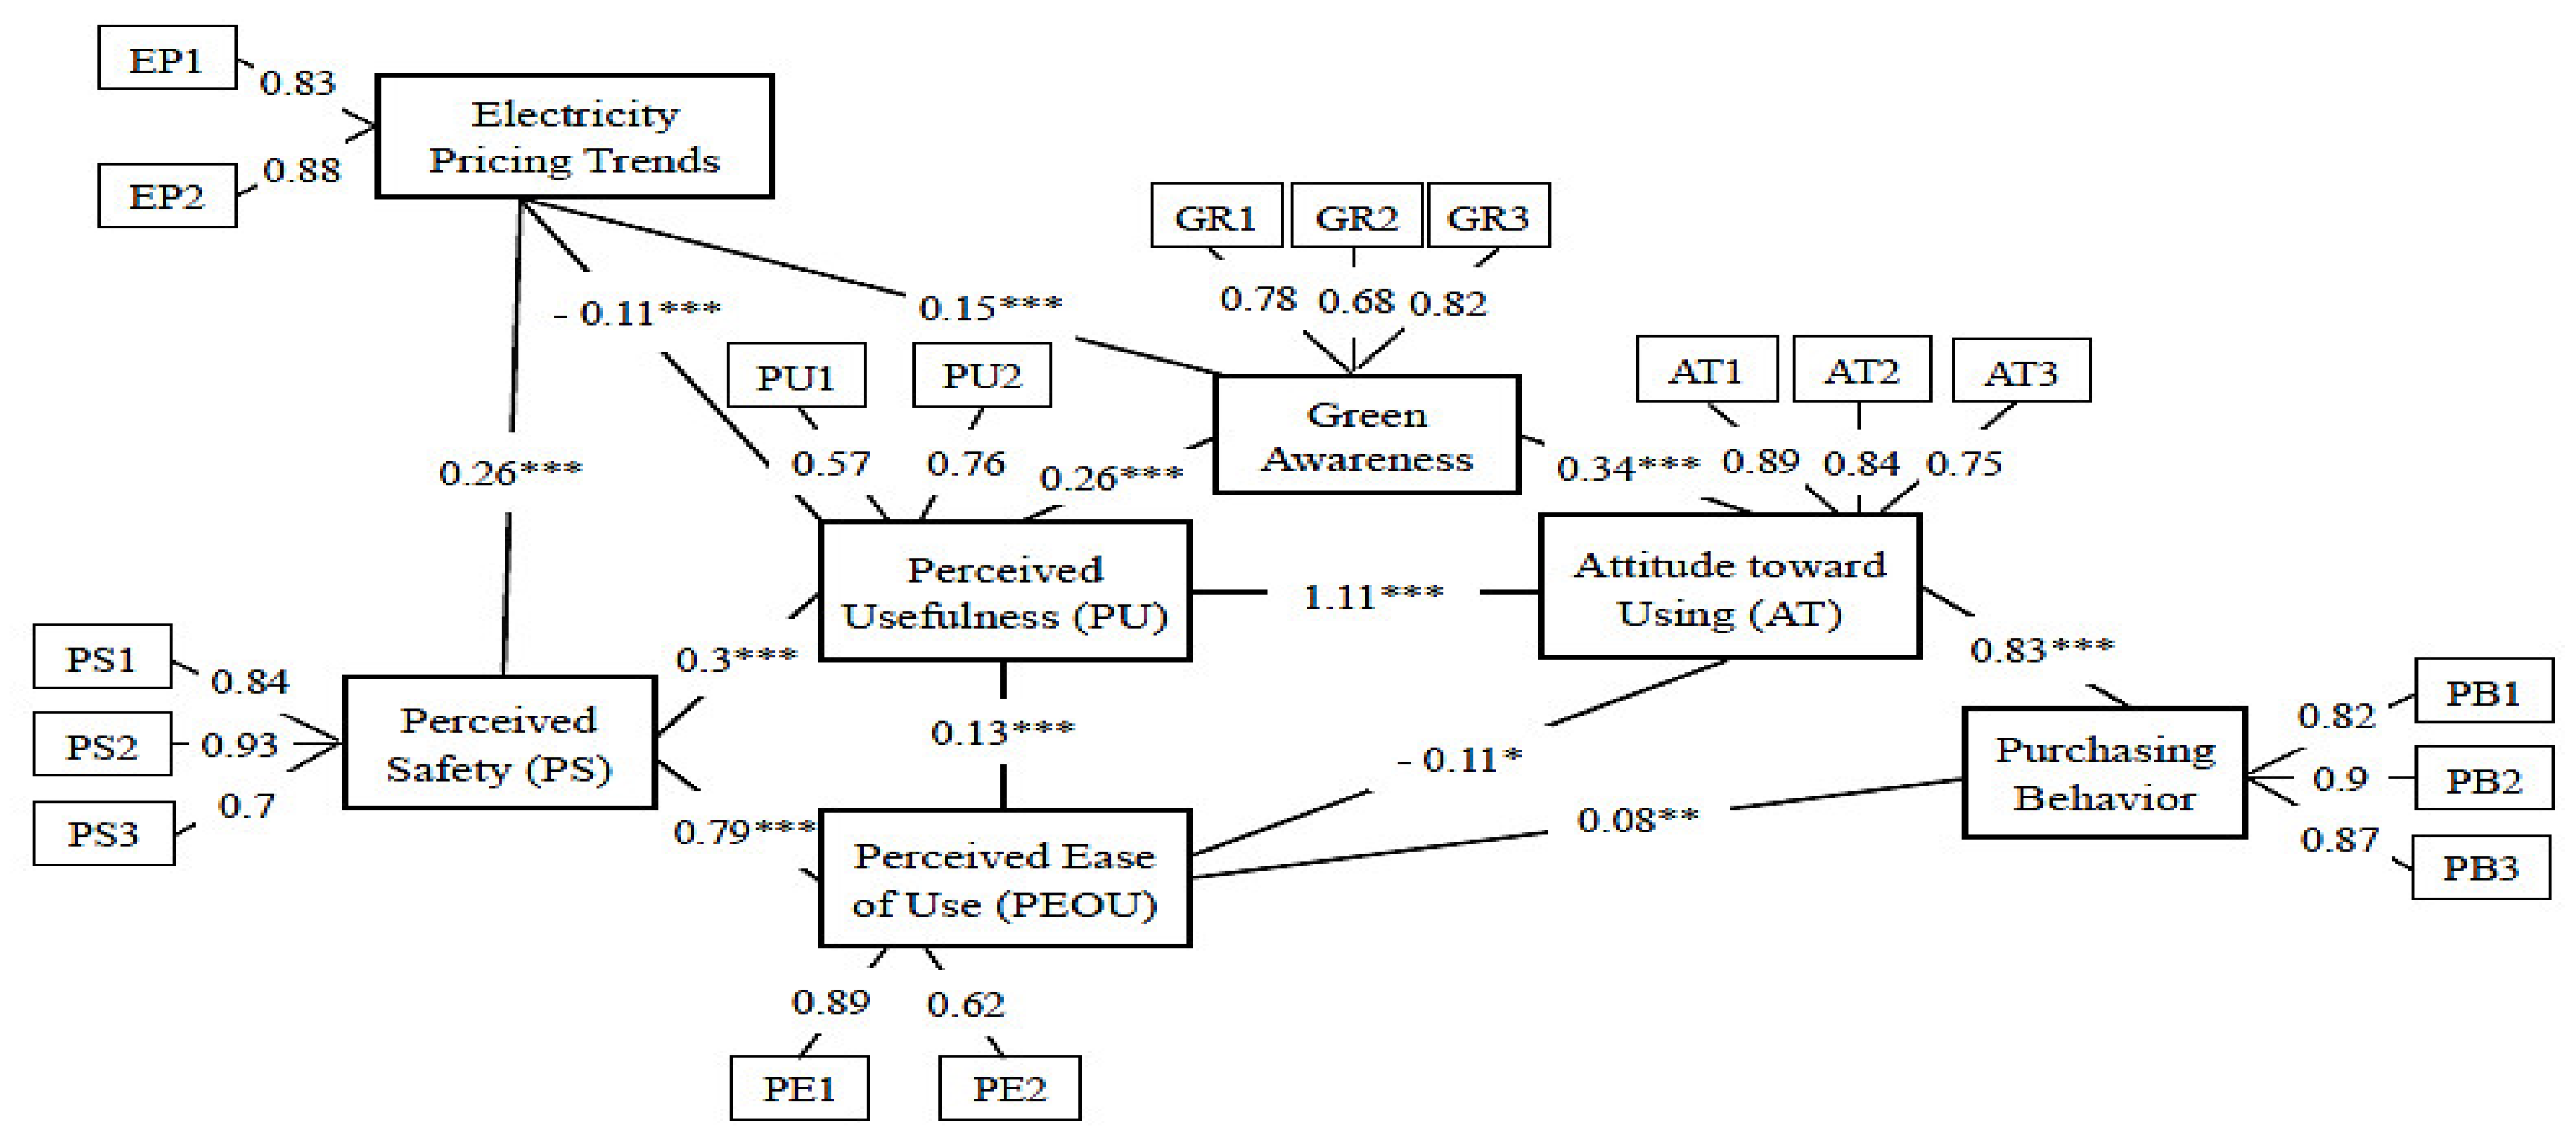
| Hypothesized Paths | Coefficient | p-Values | Remarks | |
|---|---|---|---|---|
| H1 | Perceived ease of use → perceived usefulness | 0.13 | *** | Supported |
| H2 | Perceived usefulness → attitude toward using | 1.11 | *** | Supported |
| H3 | Perceived ease of use → purchasing behavior | 0.08 | 0.002 ** | Supported |
| H4 | Perceived ease of use → attitude toward using | −0.11 | 0.035 * | Supported |
| H5 | Attitude toward using → purchasing behavior | 0.83 | *** | Supported |
| H6 | Perceived safety → perceived usefulness | 0.30 | *** | Supported |
| Perceived safety → perceived ease of use | 0.79 | *** | Supported | |
| H7 | Perceived usefulness → green awareness | 0.26 | *** | Supported |
| Green awareness → attitude toward using | 0.34 | *** | Supported | |
| H8 | Electricity price trend → perceived safety | 0.26 | *** | Supported |
| Electricity price trend → perceived usefulness | −0.11 | *** | Supported | |
| Electricity price trend → attitude toward using | 0.15 | *** | Supported | |
© 2018 by the authors. Licensee MDPI, Basel, Switzerland. This article is an open access article distributed under the terms and conditions of the Creative Commons Attribution (CC BY) license (http://creativecommons.org/licenses/by/4.0/).
Share and Cite
Tsaur, R.-C.; Lin, Y.-H. Exploring the Consumer Attitude of Building-Attached Photovoltaic Equipment Using Revised Technology Acceptance Model. Sustainability 2018, 10, 4177. https://doi.org/10.3390/su10114177
Tsaur R-C, Lin Y-H. Exploring the Consumer Attitude of Building-Attached Photovoltaic Equipment Using Revised Technology Acceptance Model. Sustainability. 2018; 10(11):4177. https://doi.org/10.3390/su10114177
Chicago/Turabian StyleTsaur, Ruey-Chyn, and Yi-Hsuan Lin. 2018. "Exploring the Consumer Attitude of Building-Attached Photovoltaic Equipment Using Revised Technology Acceptance Model" Sustainability 10, no. 11: 4177. https://doi.org/10.3390/su10114177
APA StyleTsaur, R.-C., & Lin, Y.-H. (2018). Exploring the Consumer Attitude of Building-Attached Photovoltaic Equipment Using Revised Technology Acceptance Model. Sustainability, 10(11), 4177. https://doi.org/10.3390/su10114177