Article

An Evaluation of Local Comprehensive Plans Toward Sustainable Green Infrastructure in US

1
Department of Urban Policy & Administration, Incheon National University, 119 Academy-ro, Yeonsu-gu, Incheon 22012, Korea
2
Department of Landscape Architecture and Urban Planning, Texas A&M University, Langford A308 TAMU 3137, College Station, TX 77843, USA
*
Author to whom correspondence should be addressed.
Sustainability 2018, 10(11), 4143; https://doi.org/10.3390/su10114143
Submission received: 7 October 2018 / Revised: 3 November 2018 / Accepted: 9 November 2018 / Published: 11 November 2018
(This article belongs to the Section Environmental Sustainability and Applications)

Abstract

:
The benefits of green infrastructure have been verified at the site-level by many empirical studies. However, there is limited understanding of how local governments prepare and implement green infrastructure planning in practice. This study employs the content analysis method to examine the quality of local comprehensive plans regarding sustainable green infrastructure in 60 municipalities of the United States. The study uses regression analysis to explain the variance of plan quality. Study results indicate that key green infrastructure principles were not fully incorporated in the existing sampled plans, with average score of 19.6 out of 50. While plan quality scores were slightly higher in counties than in cities, both areas could significantly improve plan quality with detailed policies, action strategies, and implementation tactics for green infrastructure planning and management. Regression analysis further identified that planning capacities, as well as socio-economic characteristics of study area may impact overall plan quality. The findings of this study demonstrate the importance of incorporating detailed green infrastructure principles whenever local planners adopt or amend regional plans in order to improve plan quality and to support implementation.

1. Introduction

Recent population projection from a United Nations (UN) report predicts that 87.4% of the United States population will reside in urban areas by 2050, which represents approximately 350 million people [1]. Green spaces surrounding urban areas could rapidly transform into developed land, potentially degrading the overall functions of ecosystems within urbanized areas. In particular, landscape fragmentation that occurs during indiscriminate development can cause green infrastructure to detach rapidly with the decrease of the amount of green areas [2,3].
Landscape fragmentation has numerous negative impacts on both natural and social environments. Primarily, it alters the surrounding environment by separating vegetation patches. This causes alterations in microclimates, including radiation fluxes, wind, and water flux, and create isolation in time and space in the environment [4]. Landscape fragmentation highlights the essential role of hubs and corridors in the ecosystem. According to Weber et al. [5], a natural area is seen as a hub when its features include one or more of the following: “areas containing sensitive plant or animal spices; large blocks of continuous interior forest …; wetland complexes …; stream or rivers, and their associated riparian forest and wetland …; and conservation areas protected by the public”. Meanwhile, natural corridors are “linear features, at least 350 m wide, linking hubs together” (p. 97). Sharing similar views about the role of corridors, Benedict and McMahon [6] added examples of hubs such as natural areas of vegetation, open space, or an unknown ecological value. With the rapid expansion of urbanized areas, leading to increased landscape fragmentation, hubs and corridors have an enhanced role in city or urban areas due to their support to ecosystem services related to landscape connectivity even if rarely evaluated in green infrastructure planning [7,8]. In the city, where natural landscapes have been replaced by man-made structures, hubs and corridors are now more important than ever [5]. To support efforts to restore natural environments to city and urban areas, one of the region’s primary tools is implementing effective green infrastructure planning. Green infrastructure often refers to a “strategically planned network of natural and semi-natural areas that is designed to provide a wide range of ecosystem services” [6,9]. Although the concept can be implied differently at the national (green network), regional (planning), or site (low impact development practices) level, the share goal is to design, construct, and manage nature by harmonizing environmental resources with city landscape [10]. In the US, green infrastructure is more focused on various approaches to manage and restore natural water resources at the various level [11]. As one of natural based solutions to move cities toward sustainability, green infrastructure can help improve the urban stormwater management by enhancing the recreation and tourism opportunities as well as aesthetic externalities [12]. More importantly, green infrastructure also plays a crucial role in saving energy, reducing urban heat island effect, protecting wildlife habitat, and mitigating air pollution, among other sustainable benefits [13,14,15,16,17,18].
Until recently, the benefits of green infrastructure have been studied mostly in relation to site- and local-level environmental, social, and economic impacts [19,20,21,22], while its potential value has not been fully examined at the planning level. Although some studies [23,24,25,26] have assessed the framework of green infrastructure and theoretically highlighted the role of green infrastructure in the planning field, limited studies have examined whether local plans have adequately integrated key green infrastructure principles. A comprehensive plan is often employed as the major guideline for city/community development. As a long-range and mandatory plan for several states in US, it generally shows the community’s present conditions in various fields (e.g., land use, housing, transportation, environment, hazard, utility, etc.), provides future visions, and regulates each field with diverse strategies and policies, in order to lead the community growth for next 20 years.
By incorporating fundamental concepts of green infrastructure into the plan, local governments may systematically prepare overall policy instructions, implementation ordinances, and action strategies in the initial planning stage, which can save total construction costs for future developments and strategically utilize existing land use by harmonizing with diverse natural landscapes. To empirically understand how such plans have addressed green infrastructure-related policies in planning practices, our study focused on 60 local comprehensive plans in the United States and evaluated plan quality. Regression analysis was further conducted to explain the variance of plan quality.
The following sections introduce key principles of sustainable green infrastructure, previous plan quality evaluation, and factors influencing plan quality; illustrate study area, sample selection, concept measurement, and overall data analysis procedure; elaborate on the results; and conclude with discussions to aid in understanding of green infrastructure for practitioners and policymakers and to provide suggestions for planners in filling the current gaps in existing plans.

2. Literature Review

2.1. Key Principles of Sustainable Green Infrastructure in the USEPA Guideline

Realizing the essential role of green infrastructure in modern urban settings, many jurisdictions across the nation are trying to apply this approach to their local areas. The U.S. Environmental Protection Agency (USEPA) has contributed to these efforts by designing the “Water Quality Scorecard” to help local governments identify and remove barriers to water quality improvement [27]. The scorecard includes revising city regulations and practices, creating new rule or ordinances, and providing incentives to support green infrastructure initiatives. Local jurisdiction was classified into three scales: municipality, neighborhood, and site.
Adapting the Water Quality Scorecard guidelines and considering several studies and reports related to green infrastructure planning and implementation [2,6,24,28,29], key green infrastructure principles were established. Five principles are used to reflect the performance of the city or county in terms of green infrastructure framework. The first principle, promote natural resources and open space, looks at the importance of natural resource areas such as forest, prairies, conservation corridors, aquifer, and buffer zones, among other open spaces. This principle reflects how the local government acts to protect natural resources, open space, and urban tree systems from future development. The second principle of the evaluation form is to promote efficient, compact development patterns and infill. This principle focuses on sustainable development for urban areas. The local government is assessed on how it encourages various types of developments such as infill, redevelopment for previously developed areas, mixed-used, or transit-oriented approaches. The third principle of green infrastructure assessment form seeks to evaluate the design aspect of the development. This principle is assessing the reduction of impervious cover by applying smart design strategies. It examines how well a city or county has utilized street design to comply with various desired elements including width standard, green infrastructure integration, construction materials used in public streets, sidewalks, driveways, and parking lots, among other traffic infrastructures. The efficiency of parking is scrutinized in the fourth principle of evaluation form. To assess the effectiveness of parking in the local area, three primary issues were mainly concerned: reducing parking requirements, managing transportation demand, and minimizing stormwater from parking lots. Besides current rules and regulations related to parking policy performance, this principle also concentrated on how the local government approaches the bigger issue: transportation demand. This strategic approach reveals how well the city is preparing for future development. The final principle of the evaluation form illustrates green infrastructure stormwater management. This principle directly addresses the performance of the local authority on governing green infrastructure practices. It explores how green infrastructure has been incorporated into stormwater management provisions by reviewing the application of green infrastructure and the efficiency of maintenance and enforcement from the local government.

2.2. Plan Quality Evaluation

Determining the “quality” of a plan is not a simple task. Planning scholars and experts often disagree about how a “good plan” is constituted [30,31,32,33]. The factors that contribute to the difficulty of judging a good plan arise from various sources. The plan must typically address a complex set of issues. Most importantly, conflicting goals and competing interests, among many others similar factors must be evaluated during the process of plan creation. Given the complexity and diversity of the planning context, it is unrealistic to expect that one plan would work for all regions. Evenson et al. [34] point out that plans typically cover a cross-section of interests as well as reflect participation from diverse fields of study. For example, a comprehensive plan is built based upon contributions from representatives from city planning, transportation, infrastructure, parks, and recreation areas, in addition to involvement and feedback from citizens. Evaluating a plan regarding urban ecosystem services is even more difficult, since typical environmental problems are addressed in various elements of plan [35]. According to the literature of plan quality evaluation, “good” plans share some criteria [34,36]. Quality plans include vision; identification of objectives and goals; incorporation of results from public engagement’s response; assessments of current and future conditions; prioritization of development proposals, investment, and policy changes; and an agenda for evaluating implementation [34].
The empirical base of plan quality evaluation has developed rapidly since the 1990s. In the sole meta-analysis of plan quality evaluation studies, plan quality was extensively explored by Berke and Godschalk [37]. They quantitatively compared the plan quality scores of 16 published studies. Their analysis examined different topics of studies, research designs, and included plans for both domestic and international locations [38]. Based on the findings of this meta-analysis, the authors proposed an updated approach to assessing plan quality evaluation. They indicated that a high-quality plan would “provide a clear and convincing picture of the future, which strengthens the plan’s influence in the land planning arena” [37] (p. 69) and [38].
This study employed an approach assessing five key plan components, which has been widely used in previous plan quality assessments [39,40,41,42,43,44,45]. Five plan components are: (1) factual basis (fundamental information for managing green infrastructure); (2) goals and objectives (broad goals to achieve visions for green infrastructure planning); (3) policies and strategies (specific and measurable tools to implement goals and objectives); (4) inter-governmental cooperation (identification and capability to coordinate with different levels of stakeholders); and (5) implementation (capability to carry out goals and policies).

2.3. Factors influencing Plan Quality

This paper analyzes the relationship between plan quality scores and three major groups of independent variables: planning capacity, socio-economic characteristics, and risk factors. Each of these groups contains specific variables that were likely to be addressed in the previous plan evaluation studies.
Plans are usually more rigorous and comprehensive when sufficient planning efforts, such as human, technical, and expertise resources, are provided [28,46,47]. The plan’s updated year (or the age of plan) reflects the sensitivity and attitude of the planning document towards the dynamic process of nature and the society for which it is planned. Previous studies suggest that local plans should reflect changes as well as follow a monitoring process to ensure plan consistency [48,49]. When localities continuously update or adopt new plans, the plan quality tends to increase [28]. The involvement of consultants also reflects the unique characteristics of the planning preparation process. Consultant firms have a group of multi-disciplinary experts who work together to prepare the planning document. They possess knowledge and technical skills and can provide a network of experts to work on the preparation process. A possible shortcoming of using third-party consultants is that they might lack specific knowledge about the location. However, working in close collaboration with local authorities, consultants can improve overall plan quality.
The number of planners who participate during the plan-making process not only reflects the size of the planning department of each local government, but also indicates the amount of personnel resources they spend on the process. Brody et al. [46] and Tang et al. [50] considered that the number of staffs was an indicator that positively affects overall plan quality. Berke and French [51] and Tang and Brody [48] also highlighted the importance of intellectual resource in plan preparation, which can be used as a proxy for indicating localities’ plan preparation and implementation capacity.
Socio-economic variables are typical contextual variables that affect the quality of local planning documents. The population variable is most commonly used in this context. The number of people utilizing an area, or its population size, has been addressed in previous research [40,49,52,53]. The population variable does not simply translate to the number of people residing in the area. It also includes such factors as race, income, and housing, among other factors. Population growth has been used as an important indicator to represent contextual characteristics of certain region. Norton [54], Brody et al. [55], and Tang and Brody [48] used this variable as one of key independent variables when examining its relationship with plan quality.
Another variable in the socioeconomic characteristic group is income, which has been used frequently in previous studies to determine the impact of regional income on plan quality [50,56,57]. In this study, the median income family in 2000 was used to show the “wealth” of study sample areas [40]. Using a different approach, Tang et al. [50] measured “wealth” by taking median family income and applying the inflation-adjusted dollar value for more precise calculation. Wealthier areas tend to produce higher quality plans when addressing green infrastructure planning. This conclusion follows previous studies of Berke [52] and Burby and May [58]: wealthier communities often show more interest and expend more resources on environment-related topics in their regional plan. Finally, plan quality can be differentiated by localities’ education level. Several studies have identified that jurisdictions containing populations with higher levels of education are more likely to expend greater time and resources on plan-making, resulting in a positive impact on plan quality [28,50,55,59].
Depending on the stormwater risks for each locality, planning investment and efforts will differ, which influence overall plan quality. We would expect that the greater appearance of stormwater risks (e.g., areas that encompass a high percentage of impervious surfaces and that contain floodplain, or are located near coastal areas) would lead to higher plan quality score. With the direct threat from sea level rise, coastal areas in the United States are also at risk from chronic, disruptive flooding events which is defined as flooding that occurs 26 times per year or more [60,61]. More crucially, annual hurricane season poses greater potential impact on coastal communities rather than inland communities. Plan quality is expected to be higher in coastal areas because an understanding and awareness on the hazard vulnerability will be greater in those regions than in the inland regions [62].

3. Methods

3.1. Sample Selection

The following steps were used for our sampling process. First, the 100 counties and cities with the highest population growth between 2010 and 2015 were selected, based on the U.S. Census Bureau [63]. These jurisdictions typically represent areas where development is rapidly occurring. Thus, significant areas of green space are transformed into impervious surfaces, which eventually requires green infrastructure principles to be incorporated into local comprehensive plans. Second, small jurisdictions that have a population of less than 50,000 were excluded from our samples, since those communities are likely to have insufficient human and technical resources, as well as different contextual features, as compared to large metropolitan areas. Third, localities that have not adopted comprehensive plans were excluded from the study. In the end, jurisdictions that satisfied the above criteria were randomly selected in the final procedure: 30 counties and 30 cities (a total of 60 jurisdictions; see Figure 1).

3.2. Concept Measurement

The dependent variable, plan quality score, was measured using the content analysis method that has been commonly employed in previous plan evaluation research [41,42,48,64,65,66]. Five plan components, “factual basis”, “goals and objectives”, “inter-organizational coordination and cooperation”, “policies, tools and strategies”, and “implementation”, were used to conceptualize local plan quality on green infrastructure planning. A total of 93 indicators were utilized for the evaluation, which were mainly adapted from the USEPA’s Water Quality Scorecard: Incorporating Green Infrastructure Practices at the Municipal, Neighborhood, and Site Scales [27].
Each jurisdiction’s plan quality score was first assessed by the criteria summarized in Appendix A and calculated using Equations (1) and (2) [28,48,55].
P C S j = 10 2 m j i = 1 m j I S i
where PCSj refers to the score of the jth plan component; mj refers to the total number of indicators within the jth plan component (scale: 0–10); and ISi refers to the ith indicator’s scores (scale: 0–2).
T P S = j = 1 5 P C S j
where TPS indicates the total plan quality score of five plan components’ scores.
Two trained scorers were employed to minimize personal bias during the assessment and uphold the inter-coder reliability. All 60 plans were double-coded and the percent-agreement score of overall indicators for two scorers was approximately 81%, which was determined to be acceptable, based on the past plan evaluation research of Miles and Huberman [67] and Berke and Godschalk [37]. Cronbach’s alpha test was also conducted to inspect inter-item consistency. The alpha values for all five plan components were higher than 80%, indicating that assessment reliability was considered acceptable, according to the previous social science studies [68].
Planning capacity variables (e.g., plan adopted year, number of planners, and involvement of consultants) were collected from each jurisdiction’s comprehensive plan and the planning department’s website. Where data were not available online, we gathered the information by individually contacting each municipality’s staff. Socioeconomic data, such as population, population change, income, and education level, were collected from the 2010 US Census Bureau. An impervious cover dataset was acquired from the 2011 US Geological Survey’s (USGS) National Land Cover Database (NLCD). The percentage of 100-year floodplain data were collected from the 2014 Federal Emergency Management Agency’s (FEMA) Map Service Center. Coastal area is a dummy variable with the score of 1, indicating that the sample is located close to seaside with a high risk of flooding. These locations were chosen based on the US Census Bureau data. To compare the different impacts between cities and counties, another dummy variable (city) was created. Score 1 represents a municipality that is a city, while 0 represents a county. Table 1 shows the detailed conceptual measurement of overall variables.

3.3. Data Analysis

Research data were analyzed in two phases. First, the plan quality score for each jurisdiction was measured by following the process described in Section 3.2. Descriptive statistics were used to assess 60 local plans’ score, which is the sum of five plan components’ score, with the scale of 0–50. While assessing plan quality using 93 indicators, the performance was also measured. Particularly, plan performance was scored by examining the breadth and depth scores, which previous plan quality studies have often adopted [28,41,62,69]. Breadth scores indicate the number of plans that have addressed a specific indicator, whereas depth scores show the degree of detail of a particular indicator. The scores were assessed using Equations (3) and (4):
P B j = i = 1 n P j n × 100
where PBj refers to the plan breadth score of the jth indicator (scale: 0–100); n refers to the total number of plans (n = 60); and Pj refers to the number of plans that have adopted the jth indicator (scale: 0–1).
P D j = i = 1 n P j m × 100
where PDj refers to the plan depth score of the jth indicator (scale: 0–100); n refers to the total number of plans (n = 60); Pj refers to the score of plans that have adopted the jth indicator; and m refers to the number of plans that have scored at least zero for the jth indicator.
Second, the ordinary least squares (OLS) technique, which is one of the most commonly used statistical analysis methods for predicting values of a dependent variable using multiple explanatory variables [70], was employed to examine how various independent factors in this study explain the variance of the plan quality score. Due to the limited sample size, this study classified independent variables into three block groups (models) and ran each regression analysis respectively. After running the three models (Models 1–3), only variables statistically significant in each model were chosen for the final fully specified model (Model 4). Through the diagnostic process, no major OLS assumptions (e.g., model specification, heteroskedasticity, multicollinearity, autocorrelation, and outliers) were violated.

4. Results

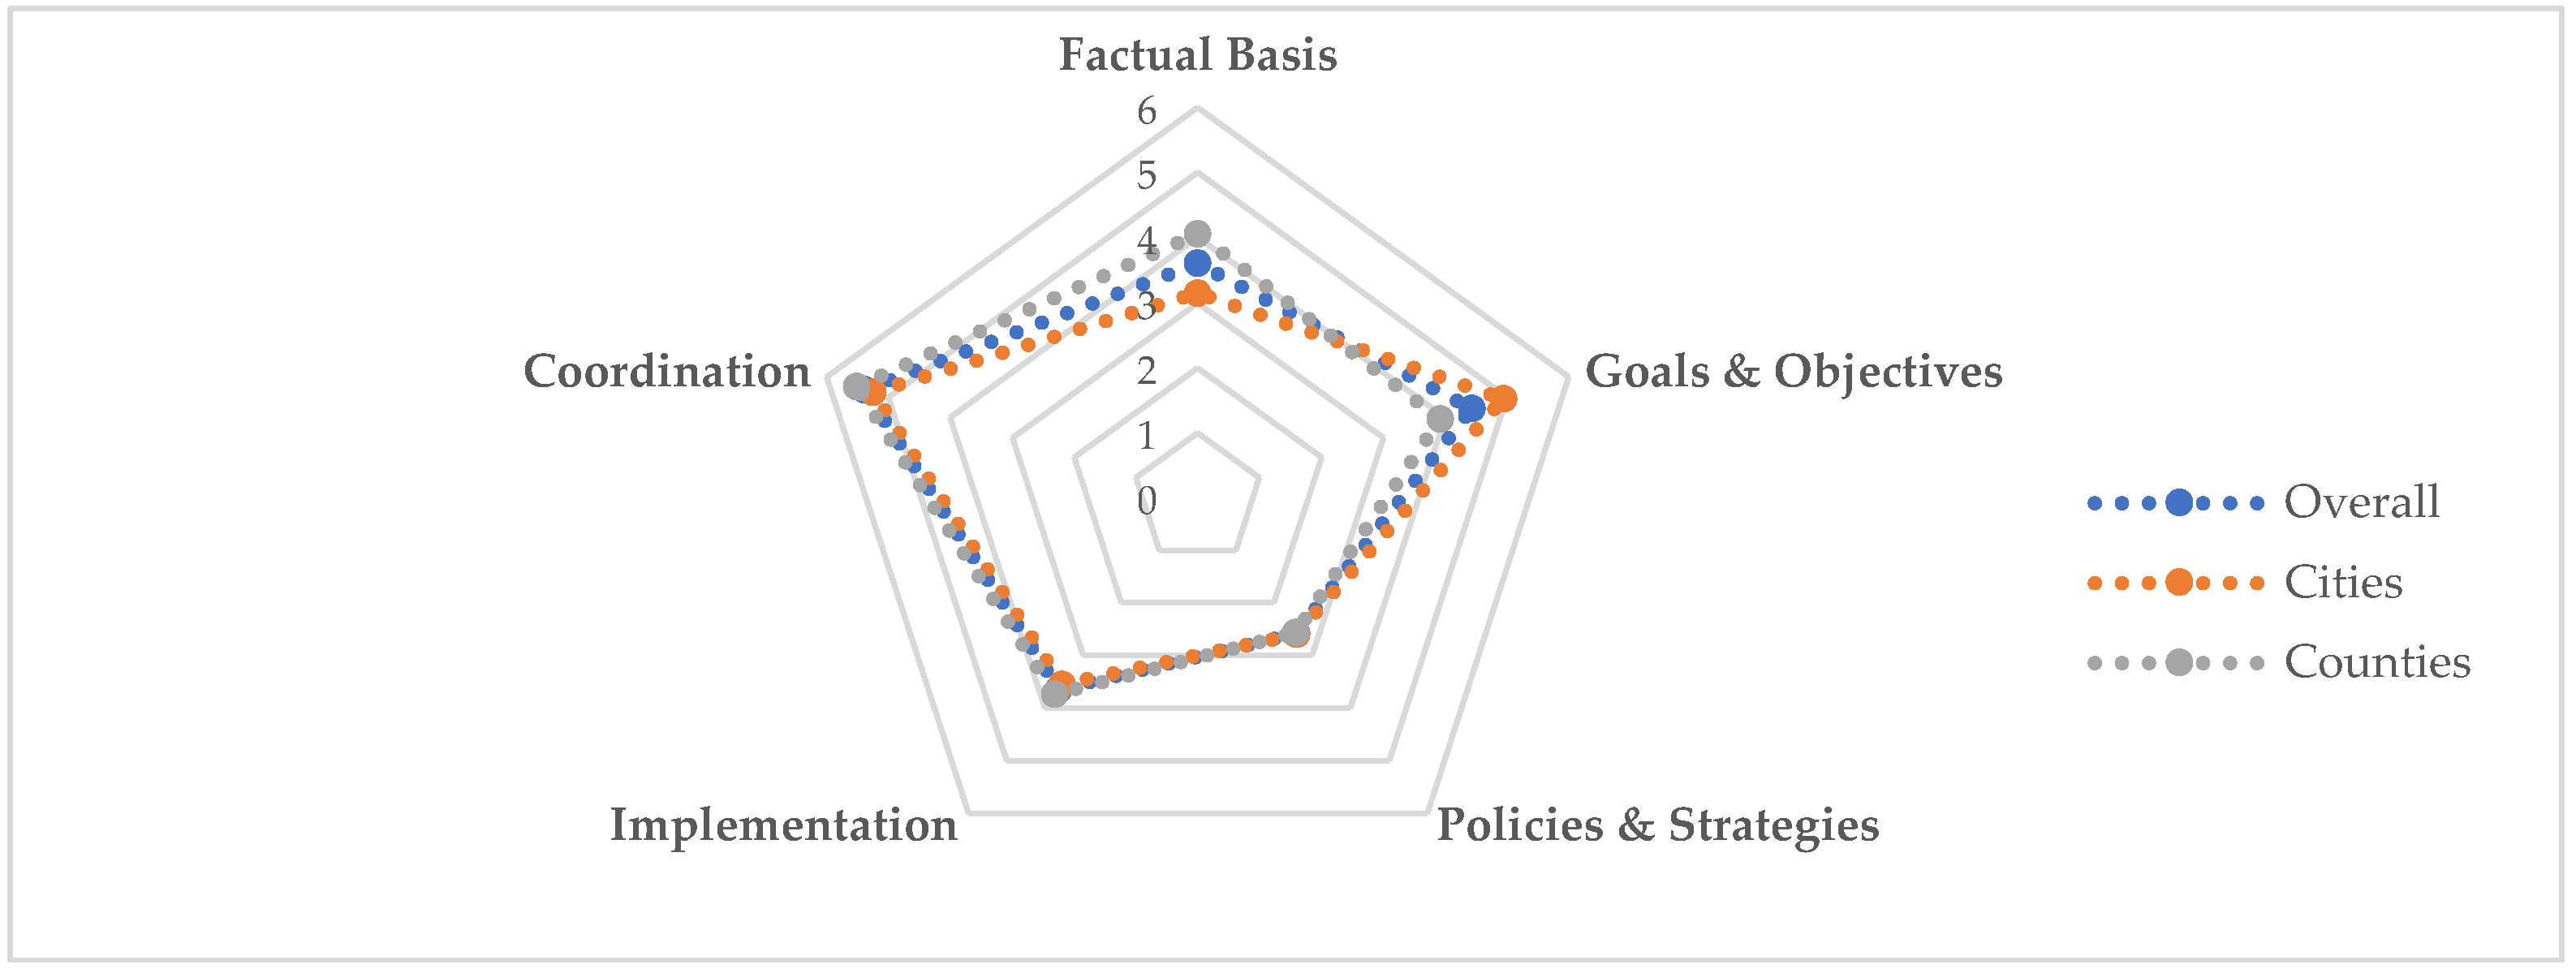
4.1. Descriptive Statistics of Plan Quality Evaluation

The 60 localities’ average plan quality score for green infrastructure was 19.64 out of 50, implying that sample jurisdictions have not sufficiently incorporated the key concepts of green infrastructure planning into their local comprehensive plans (see Table 2). Counties’ average plan score (19.79) was slightly higher than city scores (19.48), which was contrary to our initial expectation that cities would have higher scores on green infrastructure planning, presuming that cities would have better technical and human resources. With the large variations on plan quality scores, Sumter County in Florida had the highest score of 32.00, while Lafayette County in Mississippi received the lowest score of 8.43. Although sample counties had higher average scores on plan quality, much larger variations existed compared to city scores. No cities received scores under 10, whereas two counties scores of approximately 8.50. Appendix B shows the overall 60 jurisdictions’ total plan quality score, as well as each plan component score that the localities have acquired.
As shown in Figure 2, the inter-organizational coordination and cooperation component received the highest mean score of 5.38 among five plan components, followed by goals and objectives (4.43), implementation (3.64), factual basis (3.60), and policies and strategies (2.69). This indirectly implies that the sample localities understand the necessity of collaboration while managing green spaces, with nearby jurisdictions and various stakeholders. Goals and objectives obtained the second highest average score, indicating that localities have adopted broad goals relatively well in relation to green infrastructure planning. However, detailed action strategies or policies, as well as implementation approaches, are not sufficiently covered in most plans. The factual basis component also scored fairly low, indicating that plans failed to identify basic information with regard to natural and human resources, as well as for projections of future jurisdiction circumstances. Relatively large variations existed between cities and counties on two components (goals and objectives and factual basis). While sample cities scored almost one point higher in goals and objectives, counties scored nearly one point higher in factual basis.
Performance results of each plan component are illustrated on Appendix C.

4.2. Regression Analysis

The findings of OLS explain the impact of planning capacity on plan quality, while controlling for other socioeconomic and environmental conditions. Table 3 reports both coefficients (β) and standardized coefficients (beta) for the plan quality score. Five variables were found to be statistically significant in Models 1–3, and only those variables were included in the fully specified model (Model 4) with the inclusion of a city dummy variable, which indicates whether the jurisdiction is a city or county. The results suggest that plans adopted year (β = 0.3410, p < 0.05) and the number of planners (β = 0.6888, p < 0.01) have positive associations with the local plan quality. As was frequently shown in previous research [37,48,71], more recently adopted plans tend to adopt diverse and up-to-date goals and policies regarding green infrastructure planning and larger numbers of planners may bring abundant human and technical resources while adopting a plan. Both variables were shown as strong predictors for the final model.
Among three risk related variables, floodplain alone had a positive and significant association with the dependent variable in Model 3, meaning that areas with a higher percentage of 100-year floodplain tend to produce a higher quality plan. This implies that those jurisdictions with high floodplain already recognize the risk of flood and have generated various strategies in managing green infrastructure. Although its effect was insignificant in the final model, floodplain was the strongest predictor to explain the variance of plan quality across all models. Imperviousness is often used as a proxy for understanding the development of the area and should be considered with a variety of natural factors (e.g., precipitation, topography, and drainage network) when examining the flood vulnerability. As expected, its effect on plan quality was positive, but the association was not statistically significant. In the end, we have included the city variable in the final model to identify whether cities have produced better plans in terms of green infrastructure planning compared to counties. The outcome showed that cities are more likely to produce higher quality plans compared to counties, with a coefficient of −2.6954 (p < 0.1). The variance of plan quality was explained by about 41% in the fully specified model.

5. Discussion and Conclusions

This study first examined whether key principles of green infrastructure planning have been substantially incorporated into sample local comprehensive plans by employing plan quality assessment. Several variables were then measured to explain the variance of plan quality. The explanatory results have revealed that localities are likely to have a relatively low awareness of green infrastructure, with the overall mean score of 19.6 out of 50. Since the concept of green infrastructure has been mixed with other greenery technologies/implementations and its scale is quite broad in order to cover a specific section or field of a comprehensive plan, local planners might not recognize the importance of green infrastructure or systematically embrace the major strategies and components of green infrastructure planning [16,72,73]. However, as indicated in Section 2.1, green infrastructure is not a new concept, scientific technology, or invention. Communities have continuously invested in building green roofs, rain gardens, trees, and parks, as well as in managing open spaces, water resources, flooding, and improving energy efficiency through pursuing sustainable and compact development. In addition, diverse federal agencies nowadays are committing to green infrastructure by providing financial support and conducting relevant projects, services, and programs [74]. Local planners should utilize the expertise and resources that umbrella organizations (e.g., U.S. Environmental Protection Agency (USEPA), Department of Housing and Urban Development (HUD), Department of Transportation (DOT), Department of Energy (DOE), Department of Agriculture (USDA)) provide and create effective partnerships while planning, designing, and implementing green infrastructure. Particularly, several agencies and foundations, such as the National Green Infrastructure Certification Program and the Green Infrastructure Foundation, provide technical training programs to increase awareness of green infrastructure tools, which are sometimes referred to as low-impact development (LID) practices. Local planners should actively engage with such programs and educate their residents and officials in order to implement green infrastructure planning.
The low score of plan quality might be caused by plans that are outdated [28,48]. Fifteen out of the sixty plans evaluated were adopted before 2010. While some localities have not amended or updated their plans, others areas planning documents were unavailable online or through individual contact. Because recent terms, skills, techniques, and practices regarding green infrastructure are included within the evaluation criteria, sample plans that were not recently updated might have relatively low scores compared to up-to-date plans [44,75]. The result from the regression analysis supports this fact by showing that a year increase of plan date is likely to show approximately 0.34 points higher plan quality, while holding other variables fixed.
From assessing each component’s item (or indicator) performance, we have determined that local plans share similar weaknesses, which should be further considered for improving current green infrastructure planning process and implementation. First, while fundamental information that was often emphasized in the past have been well investigated, plans in the sample poorly identified community data/records on climate, flooding, point- and nonpoint-pollution sources, parking, and open/green spaces. We believe that this was one of the basic reasons that goals and objectives regarding green infrastructure were not clearly stated in the sample plans, although more awareness should be obtained by local planners of the value of green infrastructure planning. Second, significant gaps were found in the sampled plans’ policies and strategies with regard to providing education opportunities. Increased amounts of workshops, training, and outreach programs should be delivered to various entities to increase understanding of green infrastructure. Localities should also provide more diverse policies with a mix of regulations and incentives. In particular, various types of zoning as well as financing supportive programs to preserve and manage street trees, brownfields, and stormwater should be increased. Third, future plans should include clear timetables, financing sources, and responsible departments for implementing each strategy while continuously monitoring performance and identifying barriers to implementing green infrastructure planning. Finally, although coordination with and between diverse levels of planning organizations are specified and involved during the planning process, more dynamic cooperation and R&D work collaborating with universities and research institutes should be conducted to engage the various entities and to apply modern technology.
Our findings from the regression analysis may suggest local planning implications by identifying which factors influence plan quality associated with key green infrastructure principles. The results align with previous studies [41,42,49], which indicate that more recent and regularly updated plans may incorporate the latest information and circumstances, and thus, generate higher quality plans. More planners involved in plan creation led to higher quality that integrate key concepts of green infrastructure planning. The number of qualified planners represents the level of man power, resource, responsibility, and expertise contributed to the high quality of planning document [40,48,55,76]. A planner has been trained and is able to handle administrative work as well as deal with technical issues or public engagement activities. Hence, the involvement of more qualified planners leads to better techniques and planning during the adoption and amendment processes, which eventually allows localities to be proactive in minimizing the impacts from landscape fragmentation [77]. In addition, jurisdictions with higher education levels tend to have a greater interest in plan making, which result in better plan quality.
This study provides a greater insight into the performance of local plans in preparing and implementing green infrastructure planning in practice. However, the approach of this study still has some drawbacks. First, there were only 60 cities and counties because of the sampling process in this study. Although the sample size is relatively large compared to previous plan quality studies, this limits the statistical power of the regression. In addition, stratified random sampling may excluded high quality plans and let to the overall average plan score being lower than our initial expectation. Further research should evaluate sufficient numbers of plans to increase the statistical power of the study as well as confidence in predicting the variables affecting plan quality. Second, a comprehensive plan or general plan is only one type of plan that is being adopted. Other plans may also address green infrastructure. For example, some cities or counties might have a Sustainable Development Plan or Aquifer Protection Plan that discusses green infrastructure. Thus, only evaluating comprehensive plans might skip some potential plans when assessing the performance of local government on the topic of green infrastructure. It could be beneficial to conduct a future study about additional regional plans that include green infrastructure planning. Third, a comprehensive plan or general plan covers a long range of time. Some cities use such plans as their 10-year vision, while other regions might create plans to achieve goals over a span of thirty or more years. The time range for a comprehensive plan can directly affect the visions, statements, as well as other fundamental elements of the plan. This also impact the plan preparation and implementation process of the local government. Thus, the discrepancy in time range of comprehensive plan could impact the quality of the evaluation process.
This research has answered two major concerns about the performance of comprehensive plan regarding green infrastructure and what elements affect performance quality. The findings represent a helpful guideline for local planners to establish more comprehensive and concrete policies for green infrastructure while amending their plans. We hope that this study will encourage increased involvement of various disciplines in assessing the quality of green infrastructure planning approaches.

Author Contributions

H.K.: Conceptualization, Methodology, Writing—original Draft Preparation, Data Curation, Data Analysis, Writing—review and Editing, Visualization, Supervision, and Funding Acquisition; and T.T.: Methodology, Data Curation, Resources, Writing and Editing.

Funding

This research was funded by Incheon National University (International Cooperative) Research Grant in 2017, grant number 2017-0419.

Acknowledgments

The authors would like to thank the anonymous reviewers for their helpful comments.

Conflicts of Interest

The authors declare no conflict of interest.

Appendix A

Table A1. Plan evaluation criteria for each plan component.
Plan Component (Number of Indicators)Scoring MethodScale (Ordinal)
Factual basis (18)0 point = Indicator is never mentioned within a plan
1 point = Indicator is mentioned within a plan, but not detailed
2 points = Indicator is fully identified and demonstrated within a plan
0–2
Goals and objectives (17)0 point = Indicator is not mentioned within a plan
1 point = Indicator is mentioned within a plan
0–1
Inter-organizational coordination (10)0 point = Indicator is never mentioned within a plan
1 point = Indicator is mentioned within a plan, but not detailed
2 points = Indicator is concretely mentioned and described within a plan
0–2
Policies, tools and strategies (40)0 point = Indicator is never mentioned within a plan
1 point = Indicator is stated with limited information and vague commitment words within a plan (e.g., “consider”, “encourage”, “promote”, “may”, “can”)
2 points = Indicator is clearly mentioned with a firm commitment words within a plan (e.g., “shall”, “require”, “will”, “must”, “necessitate”)
0–2
Implementation (8)0 point = Indicator is never mentioned within a plan
1 point = Indicator is mentioned within a plan, but not detailed
2 points = Indicator is clearly mentioned within a plan
0–2

Appendix B

Table A2. Plan Evaluation Criteria for Each Plan Component.
PlaceNameFactual BasisGoals and ObjectivesPolicies and StrategiesImplementationCoordinationTotal Score
County or independent cityWilliams, ND2.642.351.885.636.0018.50
Sumter, FL6.115.883.888.138.0032.00
Long, GA2.221.180.635.635.5015.16
Forsyth, GA6.533.532.008.758.0028.81
Loudoun, VA4.727.065.382.57.5027.16
St. Johns, FL2.225.292.634.385.5020.02
Lincoln, SD3.891.760.750.634.5011.53
Fredericksburg, VA6.815.883.135.006.5027.32
Broomfield, CO2.224.712.881.884.0015.69
Uintah, UT2.362.942.380.634.512.81
Columbia, GA4.862.942.507.507.5025.30
Travis, TX6.815.295.134.388.5030.11
Horry, SC5.695.884.003.136.0024.70
Cass, ND5.281.760.380.632.0010.05
Berkeley, SC5.564.122.135.007.0023.81
Rutherford, TN4.722.943.506.257.5024.91
Franklin, WA3.895.293.882.505.0020.56
Matanuska Susitna, AK3.192.352.000.632.5010.67
Lee, FL1.814.714.133.755.5019.90
Falls Church, VA5.006.473.386.256.5027.60
Douglas, CO4.174.124.001.886.5020.67
Russell, AL2.922.351.133.136.0015.53
Manatee, FL2.787.063.501.886.5021.72
Prince William, VA3.195.293.252.506.0020.23
Jasper, SC3.892.943.001.883.5015.21
Lafayette, MS2.362.940.500.632.008.43
Hoke, NC3.892.350.630.631.008.50
Lancaster, SC4.581.180.755.635.0017.14
Lee, AL3.473.531.504.386.5019.38
Gwinnett, GA3.893.532.256.254.5020.42
CityKent, WA4.176.4741.886.0022.51
Cedar Park, TX3.332.941.383.755.0016.40
Frisco, TX5.553.532.883.135.0020.08
Kokomo, IN1.943.530.631.253.5010.85
Dublin, CA2.57.063.383.134.5020.56
Doral, FL3.618.234.2556.5027.60
Goodyear, AZ2.52.942.384.385.5017.69
Irvine, CA2.363.531.131.884.5013.39
Meridian, ID2.364.121.883.756.0018.10
Leesburg, VA1.816.471.635.634.0019.53
Mount Pleasant, SC3.475.293.135.633.521.02
Odessa, TX1.942.351.131.883.5010.80
Fort Myers, FL2.363.531.251.885.0014.02
Austin, TX6.116.474.505.006.0028.08
League, TX4.036.473.632.504.5021.12
Auburn, AL4.587.063.133.757.0025.52
Kissimmee, FL4.175.883.881.884.5020.30
Fisher, IN3.334.712.754.375.5020.66
Bellevue, WA5.835.883.501.885.5022.59
Denver, CO1.944.711.255.634.5018.03
West Des Moines, IA2.782.350.753.134.5013.51
Charlotte, NC1.395.883.255.007.5023.02
Seattle, WA3.197.063.382.505.5021.63
Manteca, CA1.944.122.001.886.5016.44
Miramar, FL1.253.532.883.134.5015.28
Fargo, ND4.035.882.502.505.0019.91
Sandy Spring, GA4.036.474.505.637.0027.62
Fort Collins, CO1.396.473.006.886.0023.73
Richardson, TX2.361.761.881.255.0012.25
Bossier, LA4.173.532.136.256.0022.07

Appendix C

With regard to the performance of the factual basis component, fundamental inventories that show the jurisdiction’s circumstances, such as land use, natural resources, population, and water resources, are well investigated with high breadth score (ranging from 82% to 95%), while information related to parking spaces, water pollution types and sources, existing low impact development practices, climate, and potential brownfield sites are not sufficiently detailed. The depth scores also a trend similar to the breadth scores, in that indicators often mentioned in a plan were also illustrated with an intimated information.
Regarding the goals and objectives performance, the depth score was not collected because of its scale, which ranged only from 0 to 1 (other plan components range from 0 to 2). Large variations existed for the breadth score (range from 22% to 97%). General objectives such as preserving natural resources, habitats, and critical areas were mentioned in the majority of plans (breadth score: 97%). However, local plans failed to denote goals related to specific green infrastructure planning, including planting street trees, improving public right-of-way, reducing impervious surfaces, controlling stormwater runoff, and managing parking related issues. Although overall goals were generally expressed in adjectives and nouns, they were not stated in a measurable context (Berke and Godschalk, 2009).
Large variations also existed in policies and action strategies. A number of plans encompassed fundamental new urbanism related tools, such as encouraging mixed-used development and connecting walkways and parking lots, with the breadth score higher than 90%. Conventional environmental regulations (e.g., cluster development, open space preservation, habitat protection, and conservation easement) were also often adopted in local plans (breadth range from 68% to 85%). Half of the local plans, however, did not specify 75% of the indicators (30 out of 40). In particular, the lack of regulatory (e.g., impact fee, fee simple purchase, urban growth boundary, development restriction within floodplain, zoning, and site plan), incentive (e.g., density bonus and transfer of development rights), financing (e.g., tax increment financing and rebate), and outreach tools (e.g., workshop, training program, and information brochure) related to green infrastructure planning were prominently included during the evaluation process.
Results revealed that localities have a high commitment to collaborate with/within diverse stakeholders, jurisdictions, governments, and organizations in managing green infrastructure. Breadth scores were higher than 60% for all elements in this plan component. Citizen input, as well as coordination with private sectors and local universities was well recognized. Depth scores, however, were relatively low compared to the breath scores, indicating that each indicator was not described with detailed information even though it was often stated in the comprehensive plans.
Although indicators within the implementation component do not imply that localities will conduct certain action strategies immediately, planners may well prepare and implement various policies with clear timelines and responsibilities. Local plans have frequently identified funding sources regarding green infrastructure and updated/adapted their plans regularly. However, less than half of the plans (43%) stated a clear time schedule as well as the specific responsible department for each strategy’s implementation. Monitoring plan performances and identifying barriers for green infrastructure implementation were poorly described within the sampled plans.

References

  1. United Nations (UN), Department of Economic and Social Affairs, Population Division. World Urbanization Prospects: The 2014 Revision, CD-ROM Edition. 2014. Available online: https://esa.un.org/unpd/wup/CD-ROM/ (accessed on 2 January 2018).
  2. McMahon, E.T. Green infrastructure. Plan. Commi. J. 2000, 37, 4–7. [Google Scholar]
  3. Farrugia, S.; Hudson, M.D.; McCulloch, L. An evaluation of flood control and urban cooling ecosystem services delivered by urban green infrastructure. Int. J. Biodivers. Sci. Ecosyst. Serv. Manag. 2013, 9, 136–145. [Google Scholar] [CrossRef]
  4. Saunders, D.A.; Hobbs, R.J.; Margules, C.R. Biological consequences of ecosystem fragmentation: A review. Conserv. Biol. 1991, 5, 18–32. [Google Scholar] [CrossRef]
  5. Weber, T.; Sloan, A.; Wolf, J. Maryland’s green infrastructure assessment: Development of a comprehensive approach to land conservation. Landsc. Urban Plan. 2006, 77, 94–110. [Google Scholar] [CrossRef]
  6. Benedict, M.; McMahon, E.T. Green infrastructure: Smart conservation for the 21st century. Renew. Resour. J. 2002, 20, 12–17. [Google Scholar]
  7. Pelorosso, R.; Gobattoni, F.; Geri, F.; Leone, A. PANDORA 3.0 plugin: A new biodiversity ecosystem service assessment tool for urban green infrastructure connectivity planning. Ecosyst. Serv. 2017, 26, 476–482. [Google Scholar] [CrossRef]
  8. Garmendia, E.; Apostolopoulou, E.; Adams, W.; Bormpoudakis, D. Biodiversity and green infrastructure in Europe: Boundary object or ecological trap? Land Use Policy 2016, 56, 315–319. [Google Scholar] [CrossRef]
  9. European Commission. Green infrastructure (GI)—Enhancing Europe’s Natural Capital. 2013. Available online: https://eur-lex.europa.eu/resource.html?uri=cellar:d41348f2-01d5-4abe-b817-4c73e6f1b2df.0014.04/ DOC_1&format=PDF (accessed on 20 October 2018).
  10. Lennon, M. Green infrastructure and planning policy: A critical assessment. Local Environ. 2014, 20, 957–980. [Google Scholar] [CrossRef]
  11. United States Environmental Protection Agency (USEPA). Green Infrastructure Opportunities That Arise During Municipal Operations. EPA 842-R-15-002. 2015. Available online: https://www.epa.gov/sites/production/files/2015-09/documents/green_infrastructure_roadshow.pdf (accessed on 20 October 2018).
  12. Pelorosso, R.; Gobattoni, F.; Leone, A. The low-entropy city: A thermodynamic approach to reconnect urban systems with nature. Landsc. Urban Plan. 2017, 168, 22–30. [Google Scholar] [CrossRef]
  13. Pelorosso, R.; Gobattoni, F.; Leone, A. Green courtyards as urban cool islands: Towards nature-based climate adaptation plans of compact cities. CSE-City Saf. Energy 2017, 1, 27–36. [Google Scholar]
  14. Pappalardo, V.; La Rosa, D.; Campisano, A.; La Greca, P. The potential of green infrastructure application in urban runoff control for land use planning: A preliminary evaluation from a southern Italy case study. Ecosyst. Serv. 2017, 26, 345–354. [Google Scholar] [CrossRef]
  15. European Commission (EC). Towards an EU Research and Innovation Policy Agenda for Nature-Based Solutions & Re-Naturing Cities; Final Report of the Horizon 2020 expert group on nature-based solutions and re-naturing cities; Publications Office of the European Union: Luxembourg, 2015. [Google Scholar]
  16. Keeley, M.; Koburger, A.; Dolowitz, D.P.; Medearis, D.; Nickel, D.; Shuster, W. Perspectives on the use of green infrastructure for stormwater management in Cleveland and Milwaukee. Environ. Manag. 2013, 51, 1093–1108. [Google Scholar] [CrossRef] [PubMed]
  17. Tzoulas, K.; Korpela, K.; Venn, S.; Yli-Pelkonen, V.; Kaźmierczak, A.; Niemela, J.; James, P. Promoting ecosystem and human health in urban areas using Green infrastructure: A literature review. Landsc. Urban Plan. 2007, 81, 167–178. [Google Scholar] [CrossRef]
  18. Girardet, H. Creating Sustainable Cities; Green Books: Devon, UK, 1999. [Google Scholar]
  19. Schrijnen, P.M. Infrastructure networks and red–green patterns in city regions. Landsc. Urban Plan. 2000, 48, 191–204. [Google Scholar] [CrossRef]
  20. Turner, T. City as Landscape: A Post Post-Modern View of Design and Planning; E &FN Spon: London, UK, 2014. [Google Scholar]
  21. Van der Ryn, S.; Cowan, S. Ecological Design; Island Press: Washington, DC, USA, 2013. [Google Scholar]
  22. Walmsley, A. Greenways: Multiplying and diversifying in the 21st century. Landsc. Urban Plan. 2006, 76, 252–290. [Google Scholar] [CrossRef]
  23. Lindholm, G. The implementation of green infrastructure: Relating a general concept to context and site. Sustainability 2017, 9, 610. [Google Scholar] [CrossRef]
  24. Hansen, R.; Rall, E.; Chapman, E.; Rolf, W.; Pauleit, S. Urban Green Infrastructure Planning: A Guide for Practitioners. Green Surge. 2017. Available online: http://greensurge.eu/working-packages/wp5/ (accessed on 10 June 2017).
  25. McDonald, L.; Allen, W.; Benedict, M.; O’Connor, K. Green infrastructure plan evaluation frameworks. J. Conser. Plann. 2005, 1, 12–43. [Google Scholar]
  26. Youngquist, T.D. What Is Green Infrastructure? An Evaluation of Green Infrastructure Plans from across the United States. Master’s. Thesis, Community and Regional Planning, Iowa State University, Ames, IA, USA, 2009. [Google Scholar]
  27. U.S. Environmental Protection Agency (USEPA). Water Quality Scorecard: Incorporating Green Infrastructure Practices at the Municipal, Neighborhood, and Site Scales. EPA 231B09001. 2009. Available online: https://www.epa.gov/smartgrowth/water-quality-scorecard (accessed on 5 June 2017).
  28. Kim, H.; Li, M.-H. Sustainable stormwater management: Examining the role of local planning capacity in mitigating peak surface runoff. Sustainability 2016, 8, 763. [Google Scholar] [CrossRef]
  29. Davies, C.; Macfarlane, R.; Mcgloin, C.; Roe, M. Green Infrastructure Planning Guide. Version 1.1. 2015. Available online: http://www.greeninfrastructurenw.co.uk/resources/North_East_Green_Infrastructure_Planning_Guide.pdf (accessed on 5 June 2017).
  30. Baer, W.C. General plan evaluation criteria: An approach to making better plans. J. Am. Plan. Assoc. 1997, 63, 329–344. [Google Scholar] [CrossRef]
  31. Bunnell, G.; Jepson, E.J., Jr. The effect of mandated planning on plan quality: A fresh look at what makes “a good plan”. J. Am. Plan. Assoc. 2011, 77, 338–353. [Google Scholar] [CrossRef]
  32. Susskind, L. Should state government mandate local planning? Planning 1978, 44, 17–20. [Google Scholar]
  33. Wiewel, W.; Knaap, G. Partnerships for Smart Growth: University-Community Collaboration for Better Public Places; M.E. Sharpe, Inc., in Cooperation with Lincoln Institute of Land Policy: Armonk, NY, USA, 2005. [Google Scholar]
  34. Evenson, K.R.; Satinsky, S.B.; Rodriguez, D.A.; Aytur, S.A. Exploring a public health perspective on pedestrian planning. Health Promot. Pract. 2012, 13, 204–213. [Google Scholar] [CrossRef] [PubMed]
  35. Cortinovis, C.; Geneletti, D. Ecosystem services in urban plans: What is there, and what is still needed for better decision. Land Use Policy 2018, 70, 298–312. [Google Scholar] [CrossRef]
  36. Berke, P.; Backhurst, M.; Day, M.; Ericksen, N.; Laurian, L.; Crawford, J.; Dixon, J. What makes plan implementation successful? An evaluation of local plans and implementation practices in New Zealand. Environ. Plan. B Plan. Des. 2006, 33, 581–600. [Google Scholar] [CrossRef]
  37. Berke, P.; Godschalk, D. Searching for the good plan A meta-analysis of plan quality studies. J. Plan. Lit. 2009, 23, 227–240. [Google Scholar] [CrossRef]
  38. Berke, P.; Smith, G.; Lyles, W. Planning for resiliency: Evaluation of state hazard mitigation plans under the disaster mitigation act. Nat. Hazards Rev. 2012, 13, 139–149. [Google Scholar] [CrossRef]
  39. Arlikatti, S.; Lindell, M.K.; Prater, C.S. Risk area accuracy and hurricane evacuation expectations of coastal residents. Environ. Behav. 2006, 38, 226–247. [Google Scholar] [CrossRef]
  40. Brody, S.D. Examining the role of resource-based industries in ecosystem approaches to management: An evaluation of comprehensive plans in Florida. Soc. Nat. Resour. 2003, 16, 625–641. [Google Scholar] [CrossRef]
  41. Brody, S.D. Ecosystem Planning in Florida: Solving Regional Problems through Local Decision-Making; Ashgate Press: Aldershot, UK, 2008. [Google Scholar]
  42. Fu, X.; Tang, Z. Planning for drought-resilient communities: An evaluation of local comprehensive plans in the fastest growing counties in the US. Cities 2013, 32, 60–69. [Google Scholar] [CrossRef]
  43. Kang, J.E.; Peacock, W.G.; Husein, R. An assessment of coastal zone hazard mitigation plans in Texas. J. Disaster Res. 2010, 5, 520–528. [Google Scholar] [CrossRef]
  44. Nelson, A.C.; French, S.P. Plan quality and mitigating damage from natural disasters: A case study of the Northridge earthquake with planning policy considerations. J. Am. Plan. Assoc. 2002, 68, 194–207. [Google Scholar] [CrossRef]
  45. Tang, Z.; Lindell, M.K.; Prater, C.S.; Brody, S.D. Measuring tsunami planning capacity on US Pacific coast. Nat. Hazards Rev. 2008, 9, 91–100. [Google Scholar] [CrossRef]
  46. Brody, S.D. Are we learning to make better plans? A longitudinal analysis of plan quality associated with natural hazards. J. Plan. Educ. Res. 2003, 23, 191–201. [Google Scholar] [CrossRef]
  47. Dalton, L.C.; Burby, R.J. Mandates, plans, and planners: Building local commitment to development management. J. Am. Plan. Assoc. 1994, 60, 444–461. [Google Scholar] [CrossRef]
  48. Tang, Z.; Brody, S.D. Linking planning theories with factors influencing local environmental-plan quality. Environ. Plan. B Plan. Des. 2009, 36, 522–537. [Google Scholar] [CrossRef] [Green Version]
  49. Tang, Z.; Lindell, M.K.; Prater, C.; Wei, T.; Hussey, C.M. Examining local coastal zone management capacity in US Pacific coastal counties. Coast. Manag. 2011, 39, 105–132. [Google Scholar] [CrossRef]
  50. Tang, Z.; Bright, E.; Brody, S. Evaluating California local land use plan’s environmental impact reports. Environ. Impact Assess. Rev. 2009, 29, 96–106. [Google Scholar] [CrossRef]
  51. Berke, P.R.; French, S.P. The influence of state planning mandates on local plan quality. J. Plan. Educ. Res. 1994, 13, 237–250. [Google Scholar] [CrossRef]
  52. Berke, P.R. Enhancing plan quality: Evaluating the role of state planning mandates for natural hazard mitigation. J. Environ. Plan. Manag. 1996, 39, 79–96. [Google Scholar] [CrossRef]
  53. Lubell, M.; Feiock, R.; Handy, S. City adoption of environmentally sustainable policies in California’s Central Valley. J. Am. Plan. Assoc. 2009, 75, 293–308. [Google Scholar] [CrossRef]
  54. Norton, R.K. More and better local planning: State-mandated local planning in coastal North Carolina. J. Am. Plan. Assoc. 2005, 71, 55–71. [Google Scholar] [CrossRef]
  55. Brody, S.D.; Godschalk, D.R.; Burby, R.J. Mandating citizen participation in plan making: Six strategic planning choices. J. Am. Plan. Assoc. 2003, 69, 245–264. [Google Scholar] [CrossRef]
  56. Scott, D.; Willits, F.K. Environmental attitudes and behavior: A Pennsylvania survey. Environ. Behav. 1994, 26, 239–260. [Google Scholar] [CrossRef]
  57. Van Liere, K.D.; Dunlap, R.E. Environmental concern: Does it make a difference how it’s measured? Environ. Behav. 1981, 13, 651–676. [Google Scholar] [CrossRef]
  58. Burby, R.J.; May, P.J. Making Governments Plan: State Experiments in Managing Land Use; JHU Press: Baltimore, MD, USA, 1997. [Google Scholar]
  59. Guagnano, G.A.; Markee, N. Regional differences in the sociodemographic determinants of environmental concern. Popul. Environ. 1995, 17, 135–149. [Google Scholar] [CrossRef]
  60. Hauer, M.E.; Evans, J.M.; Mishra, D.R. Millions projected to be at risk from sea-level rise in the continental United States. Nat. Clim. Chang. 2016, 6, 691. [Google Scholar] [CrossRef]
  61. Dahl, K.A.; Spanger-Siegfried, E.; Caldas, A.; Udvardy, S. Effective inundation of continental United States communities with 21st century sea level rise. Elem. Sci. Anth. 2017, 5, 37. [Google Scholar] [CrossRef] [Green Version]
  62. Tang, Z.; Brody, S.D.; Quinn, C.; Chang, L.; Wei, T. Moving from agenda to action: Evaluating local climate change action plans. J. Environ. Plan. Manag. 2010, 53, 41–62. [Google Scholar] [CrossRef]
  63. U.S. Census Bureau. American factfinder. 2005. Available online: https://factfinder.census.gov/faces/nav/jsf/pages/searchresults.xhtml?refresh. (accessed on 12 March 2017).
  64. Berke, P.R.; Conroy, M.M. Are we planning for sustainable development? J. Am. Plan. Assoc. 2000, 66, 21–33. [Google Scholar] [CrossRef]
  65. Kim, H.; Li, M.-H. Managing stormwater for urban sustainability: An evaluation of local comprehensive plans in the Chesapeake Bay watershed region. J. Environ. Plan. Manag. 2017, 60, 1702–1725. [Google Scholar] [CrossRef]
  66. Stevens, M.R. Evaluating the quality of official community plans in Southern British Columbia. J. Plan. Educ. Res. 2013, 33, 471–490. [Google Scholar] [CrossRef]
  67. Miles, M.B.; Huberman, A.M. Qualitative Data Analysis: A Sourcebook of New Methods; Sage Publications: Beverly Hills, CA, USA, 1984. [Google Scholar]
  68. Nunnally, J.C.; Bernstein, I.H. Psychometric Theory, 2nd ed.; McGraw-Hill: New York, NY, USA, 1978. [Google Scholar]
  69. Godschalk, D. Natural Hazard Mitigation: Recasting Disaster Policy and Planning; Island Press: Washington, DC, USA, 1999. [Google Scholar]
  70. Hutcheson, G.D.; Mueller, C.W. The Multivariate Social Scientist: Introductory Statistics Using Generalized Linear Models; Sage Publications: London, UK, 1999. [Google Scholar]
  71. Brody, S.D.; Highfield, W.; Carrasco, V. Measuring the collective planning capabilities of local jurisdictions to manage ecological systems in southern Florida. Landsc. Urban Plan. 2004, 69, 33–50. [Google Scholar] [CrossRef]
  72. Matthews, T.; Lo, A.; Bryne, J. Reconceptualizing green infrastructure for climate change adaptation: Barriers to adoption and drivers for uptake by spatial planners. Landsc. Urban Plan. 2015, 138, 155–163. [Google Scholar] [CrossRef]
  73. United States Environmental Protection Agency (USEPA). Addressing Green Infrastructure Design Challenges in the Pittsburgh Region. EPA 800-R-14-001. 2014. Available online: https://www.epa.gov/sites/production/files/2015-10/documents/pittsburgh-united-space-constraints-508.pdf (accessed on 23 October 2018).
  74. U.S. Department of Agriculture (USDA). Federal Agency Support for the Green Infrastructure Collaborative. 2014. Available online: https://www.epa.gov/sites/production/files/2015-10/documents/federal-support-for-green-infrastructure-collaborative_508.pdf (accessed on 22 February 2018).
  75. Brody, S.D.; Highfield, W.E. Does planning work: Testing the implementation of local environmental planning in Florida. J. Am. Plan. Assoc. 2005, 71, 159–175. [Google Scholar] [CrossRef]
  76. Burby, R.J.; May, P.J. Intergovernmental environmental planning: Addressing the commitment conundrum. J. Environ. Plan. Manag. 1998, 41, 95–110. [Google Scholar] [CrossRef]
  77. Brody, S.D.; Carrasco, V.; Highfield, W. Measuring the adoption of local sprawl: Reduction planning policies in Florida. J. Plan. Educ. Res. 2006, 25, 294–310. [Google Scholar] [CrossRef]
Figure 1. Study Area (30 Counties and 30 Cities).
Sustainability 10 04143 g001
Figure 2. Variation in Plan Component Score.
Sustainability 10 04143 g002
Table 1. Conceptual Measurement.
VariableDescriptionData SourceMeanS.D.Range
Dependent variable
Plan scoreSum of five plan componentsPlan coding protocol19.645.698.43–32.00
Independent variables
Plan adopted yearPlan adopted year minus 2017Each municipality’s plan−5.473.85−17.00–0.00
Number of plannersSum of officials in the Planning DepartmentEach municipality’s plan or website5.723.311.00–16.00
ConsultantsConsultants participation while adopting the plan (yes = 1; no = 0)Each municipality’s plan or website0.580.500–1.00
Population (1/10,000)Population in year 2010US Census (2010)19.6024.431.39–117.66
Population change (1/10,000)Population change between year 2010 and 2015US Census (2010)
American Community Survey (2015)
10.9519.000.16–93.18
Income (1/10,000)Median income in year 2010US Census (2010)6.172.153.25–11.56
EducationPercentage of population that have higher degree than bachelor in year 2010US Census (2010)35.7216.449.10–71.00
Impervious surfacePercentage of impervious surface (NLCD classes 22–24)USGS (2011)0.450.290.01–0.95
FloodplainPercentage of 100-year floodplain in the sample municipalityFEMA (2014)0.160.140–0.56
Coastal areaMunicipalities that are close to the coastal side (yes = 1; no = 0)US Census (2010)0.230.430–1.00
CityMunicipalities that are classified as city (yes = 1; no = 0)US Census (2010)0.500.500–1.00
Table 2. Descriptive Statistics of Each Plan Component.
Plan ComponentsNumber of IndicatorsMedianMeanS.D.Range
Factual basis183.473.601.461.25–6.81
Goals and objectives174.124.431.791.18–8.23
Policies and strategies402.692.581.260.38–5.38
Inter-organizational cooperation105.55.381.531.00–8.50
Implementation83.133.642.050.63–8.75
Total score9320.1619.645.698.43–32.00
Table 3. Regression Results.
VariableβBetaStandard Error
Planning capacity (Model 1)
Plan adopted year0.4585 ***0.46050.1637
Number of planners0.7478 ***0.74800.1901
Consultants0.92550.74391.2514
Constant17.3274 *** 1.8120
R20.3321
Adjusted R20.2964
Root MSE4.7743
Socioeconomic characteristic (Model 2)
Population (1/10,000)0.0843 **0.08260.0344
Population change (1/10,000)−0.0319−0.03420.0467
Income (1/10,000)−0.0052−0.10820.4377
Education0.1072 *0.13090.0591
Constant14.5362 *** 2.1673
R20.2063
Adjusted R20.1486
Root MSE5.2517
Risk (Model 3)
Impervious surface3.43143.39792.5145
Floodplain11.8115 **11.16006.0270
Coastal area−2.7345−2.67221.9922
Constant16.8108 ***
R20.0914
Adjusted R20.0428
Root MSE5.5686
Fully specified model (Model 4)
Plan adopted year0.3410 **0.33780.1663
Number of planners0.6888 ***0.66430.2451
Population0.01680.01900.0312
Education0.0798 *0.08020.0441
Floodplain4.49414.12184.6863
City−2.6954 *−2.57981.4227
Constant15.0059
R20.4065
Adjusted R20.3393
Root MSE4.6265
Notes: * p < 0.1; ** p < 0.05; *** p < 0.01.

