Article

Performance Evaluation of Root Zone Heating System Developed with Sustainable Materials for Application in Low Temperatures

1
College of Engineering, Nanjing Agricultural University, Nanjing 210031, China
2
Department of Agricultural Extension, College of Agriculture, University of Sargodha, Sargodha 40100, Pakistan
3
Faculty of Agricultural Engineering, PMAS Arid Agricultural University Rawalpindi, Rawalpindi 46000, Pakistan
*
Author to whom correspondence should be addressed.
Sustainability 2018, 10(11), 4130; https://doi.org/10.3390/su10114130
Submission received: 6 October 2018 / Revised: 7 November 2018 / Accepted: 7 November 2018 / Published: 10 November 2018
(This article belongs to the Special Issue Sustainable Energy Transformations and Storage Plants)

Abstract

:
The proposed system was developed to help the farmers of the Yangtze River Delta to grow greenhouse plants over winter, as the region has very low winter temperatures. For this reason, the experiment was undertaken during winter in extremely low temperatures to obtain optimal results. Keeping in mind the importance of sustainable practices, the authors developed the system using sustainable materials. The system was heated for 6 hours and then the hourly heat transfer rates were measured for 12 hours. The power consumption data of the heating system during different ambient temperatures were collected. Additionally, a simulation model of the heating system was developed using the COMSOL Multiphysics 5.3a package. The heat transfer in a porous media model was used in this study. Finally, the simulation results obtained from the COMSOL Multiphysics 5.3a package were analyzed and compared to the experimental results; these results were found to be in good agreement, thus authenticating the simulation model. After analyzing the data obtained from both methods, the power consumption of the heating system during different ambient temperature conditions were also calculated, which ranged from 15.73 W to 70.02 W in the simulated method and 28.2 W to 91.2 W in the experimental method. It was found that the root zone temperature remained in the range of 0–35 °C. This range of root zone temperature is suitable for many greenhouse horticultural crops such as tomato, cucumber, pepper, strawberry, lettuce, etc. The optimal root zone temperatures of many greenhouse horticultural plants are verified by many researchers.

1. Introduction

China’s Yangtze River Delta is the most important horticultural farming zone in the country. The economic benefits of horticultural farming directly affect the revenue level of the agricultural industry of China [1]. However, as a result of the climatic conditions in the region, greenhouse plant production in greenhouses without heaters is adversely affected by the severe continuous low temperatures [2]. The ambient temperature in the greenhouse can be managed using multiple techniques. However, changing the root zone temperature (RZT) is one of the most interesting methods. Multiple control systems for RZT have been devised. Root zone heating is a self-illustrative term which consists of heating the medium surrounding the roots of the plants [3]. Scientists devised a thermistor response appliance, an electronic-based root system which helps to accurately control the RZT [4]. Chris [5] argued that the three most important features of soil (or growth medium) are chemical, physical, and biological, which are directly influenced by the RZT in various ways. He further stated that plants are better able to grow in more suitable photosynthesis conditions and there are fewer thermal stresses in an environment where the RZT is controlled in a consistent and governed manner, ensuring a secure zone. Abd el Rahman et al. [6] raised tomato plants and observed their growth and transpiration for four weeks at various RZTs (29.9, 25.3, 20, and 16.8 °C). They observed that plant growth and transpiration reached the highest levels during periods of the highest RZT.
The paybacks of the root zone heating technique have been well recognized. Energy management is an accomplishment of the RZT, together with control over optimal plant growth. Jenkins et al. [7] observed, during a greenhouse test at a commercial level comparing the perimeter heating technique and the bench top heating technique, that the energy consumption of the bench top heating technique is 25% less than that of the perimeter heating technique. Furthermore, they argued that perimeter heating is cost-effective to maintain optimal root temperature because of the lower energy consumption and the lack of need for mechanisms to heat soil or air [8]. Various research experiments and trials were conducted to explore the association between aerial plant temperature and ambient temperature in the greenhouse. Richards et al. [9] carried out multiple experiments in order to decide the optimal, maximum, and minimum RZTs for various species of plants. In this regard, they determined that the RZT has a direct effect on the height and dry mass of the plant, while having a limited effect on the growth of the plant roots.
In subsequent studies, researchers endeavored to clarify the importance of root zone temperature. Similar experiences were noted by Mcavoy and Janes [10] with chrysanthemums and by Moorby and Graves [11] with lettuces. Conversely, the evidence with regard to the influence of RZTs on plants within greenhouses is ambiguous. While the results of some experiments indicated that RZTs have an influence on tomato plants’ growth, Went [12] argued that the RZT did not influence the growth of potato plants considering other optimal growth situations.
It is believed, on the basis of wide-range growth analysis, that the RZT is a more precarious factor as compared to leaf temperature [13]. The root zone temperature is significant for plants as it has the capacity to maintain processes of physiology such as the uptake mechanism for minerals and water, metabolic absorption, and the growth of leaves. Falah et al. [14] more precisely investigated tomato plant root nutrients uptake at higher temperatures and argued that the long-lasting consequences of higher solution temperatures lead to a reduction in oxygen solubility and an increase in enzyme oxidation of phenolic compounds in the root cortex and epidermal tissues; however, temporary consequences of higher solution temperatures can cause changes in the uptake mechanisms of nutrients and water. Jaworski and Vali [15] studied the association between the RZT and germination in tomato seeds; they further determined that a low RZT decreased the growth rate in tomato plants and can also influence membrane transport. Fujishige and Sugiyama [16] cultivated sweet pepper, tomato, and cucumber plants at various RZTs ranging from 10 °C to 35 °C for 10 days and revealed that the influence of root temperatures was comparatively low at low ambient temperatures.
A new type of greenhouse plant root zone heating system has been developed with a sustainable material which controls the greenhouse RZT during winter. The material used in the development of the innovative heating system is plastic polypropylene pots, polyurethane foam for insulation, and coco peat as the growing medium. Experiments have proved that plastic polypropylene is a sustainable material which can be recycled, avoiding its diffusion in the atmosphere, and possesses the necessary thermal, mechanical, and physical characteristics. It is reasonably firm with a higher melting point, low thickness, and resistance against impact [17]. Polyurethane insulation is a sustainable material in terms of energy conservation, thus providing actual benefits to society, which faces rising fuel and energy costs and is confronting the adverse environmental effects of climatic change [18]. Furthermore, polyurethane foam is resilient and stable as a result of its low thermal conductivity, and has a lifespan of more than 50 years. Polyurethane insulation is a good material as regards energy conservation and the use of resources with low environmental impact [19]. Economic cost and performance have historically been the motives for selecting compost [20]. However, people are becoming more environmentally aware and trying to utilize sustainable practices globally. On the basis of profit and performance, composts are considered the most suitable growth medium [21].
Rather than heating the ambient air temperature, the heat performance evaluation was done within the greenhouse, providing heat directly to the growing medium (i.e., the root zone) to generate optimal root temperatures, thus increasing the growth period (especially in winter), reducing energy and fuel costs, and attaining an optimal plant growth environment.

2. Materials and Methods

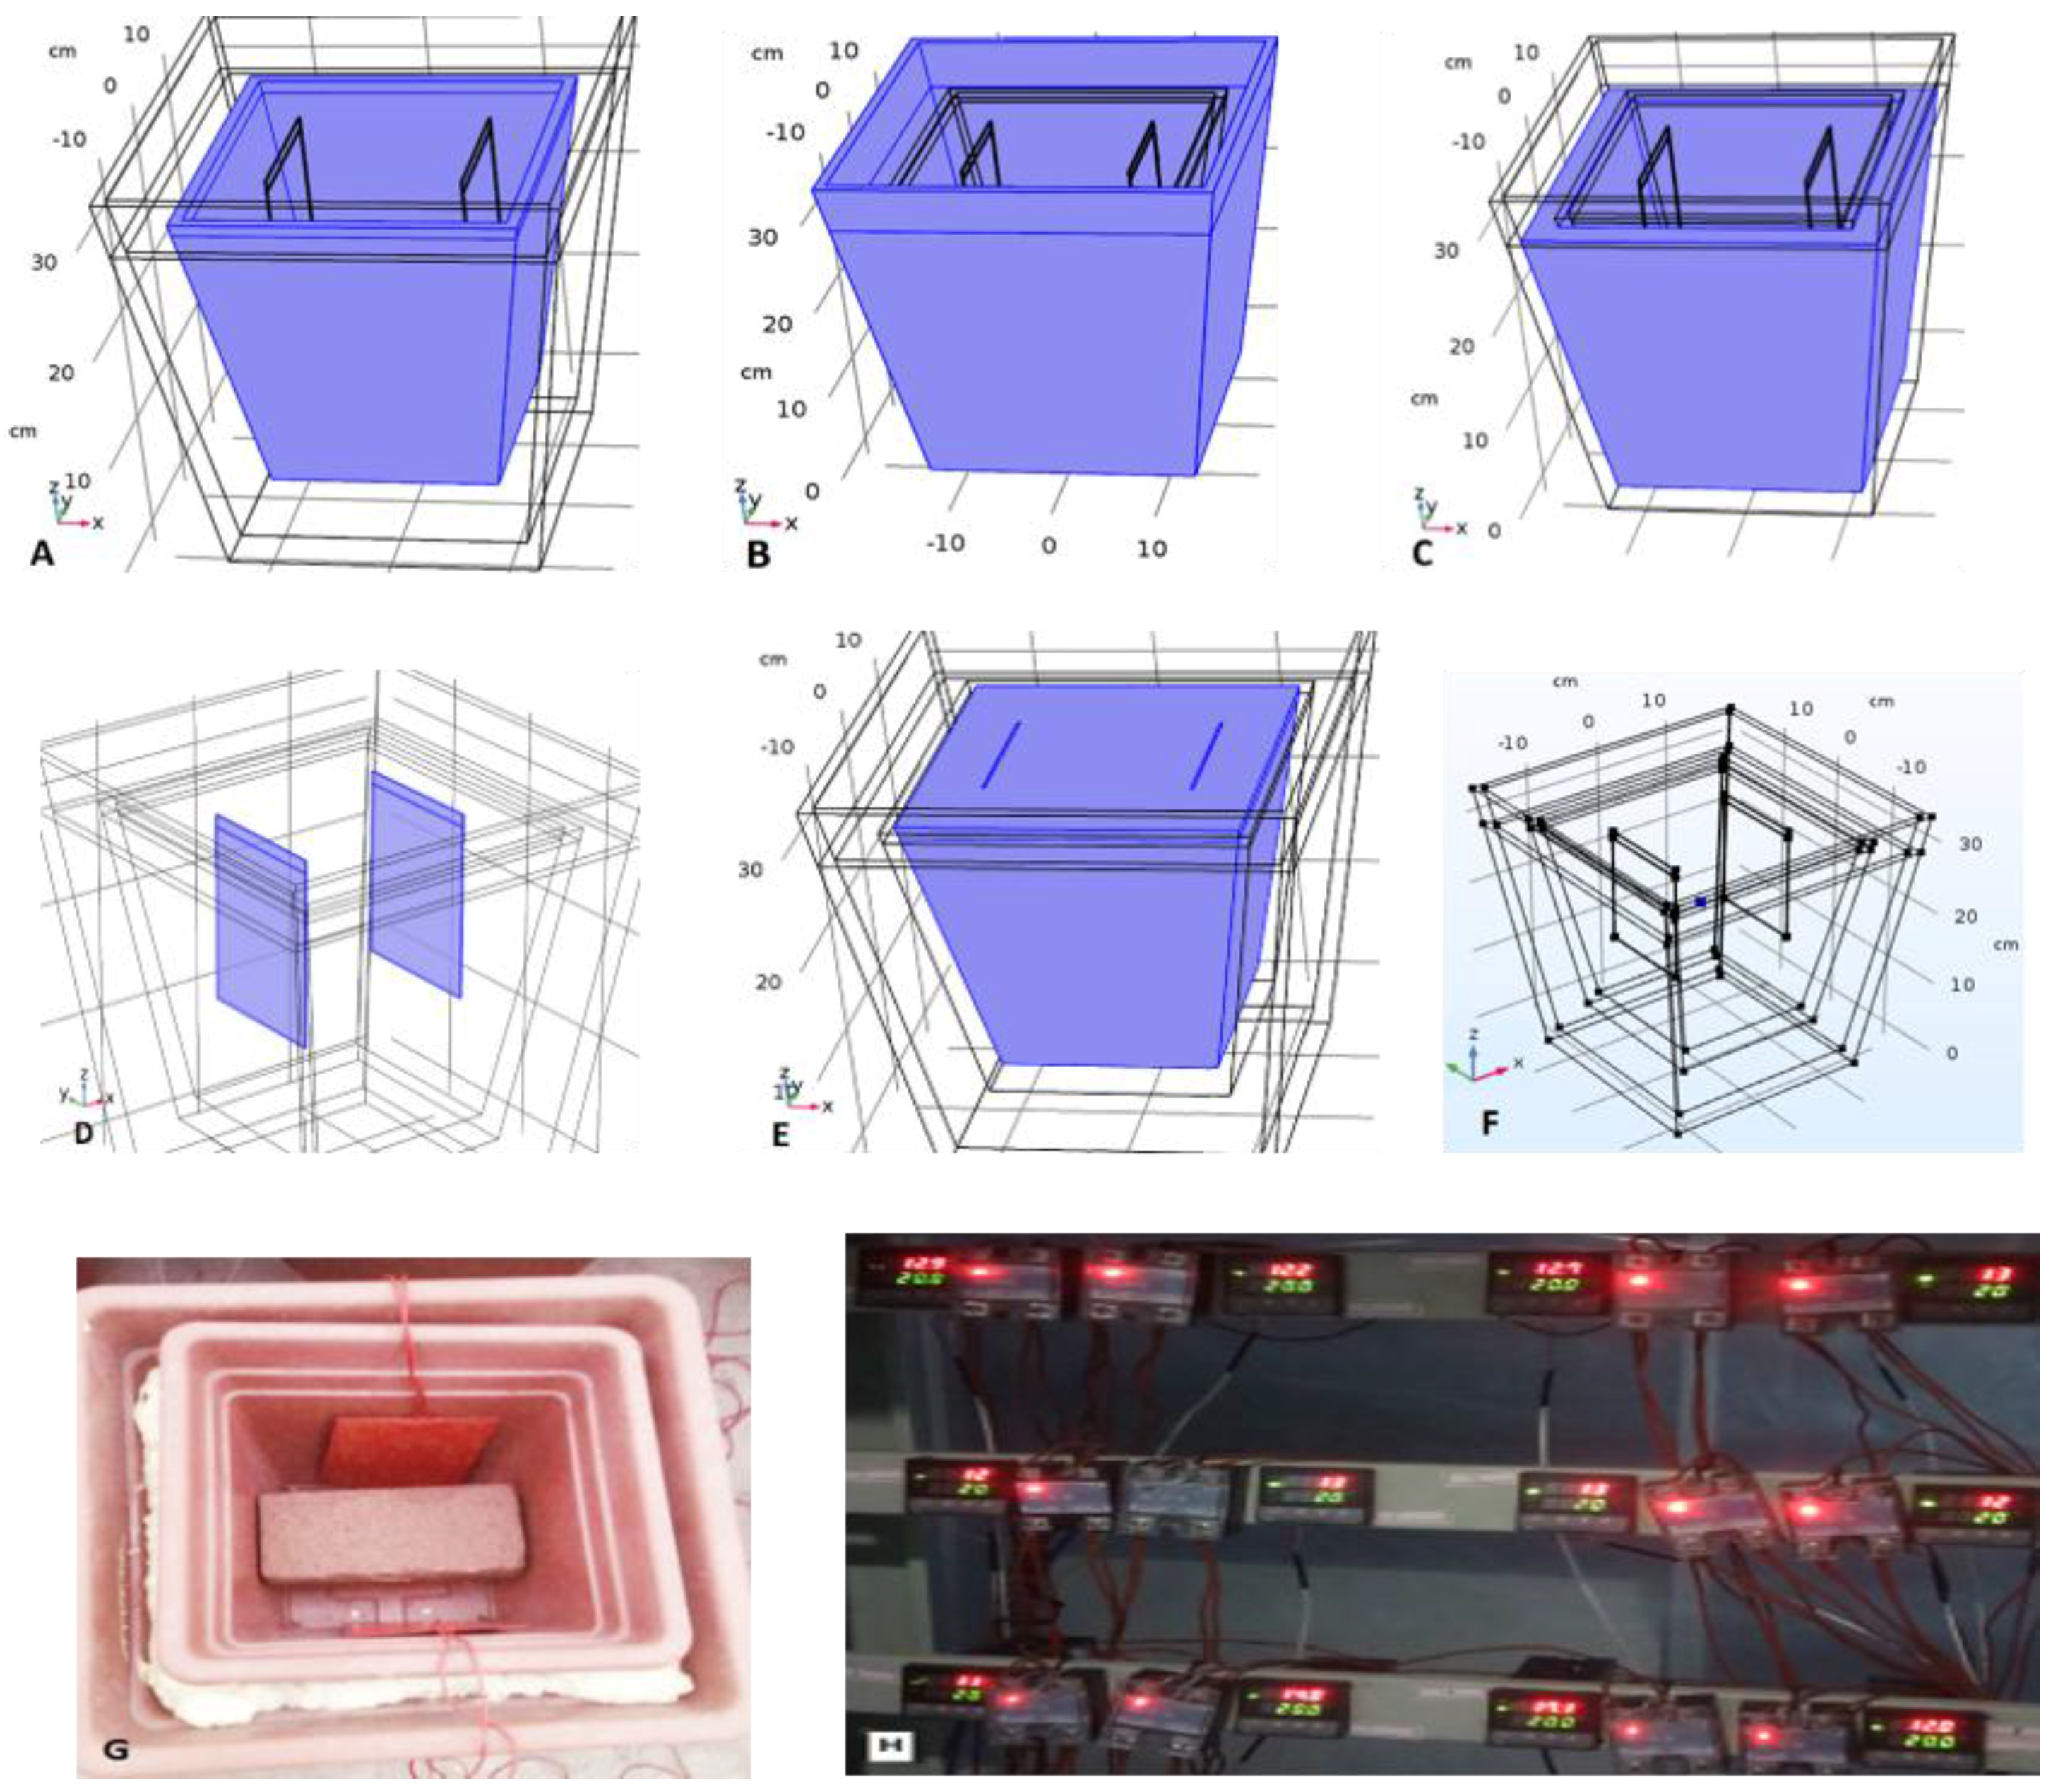
2.1. Experimental Setup

This study was conducted in a greenhouse at the College of Engineering, Nanjing Agricultural University. In the current study, five insulated growing containers were prepared to assess the heat transfer rates during different ambient temperature conditions in the soil near the root zone, as shown in Figure 1G. To compare the heat transfer trends in heated containers, there were also five non-heated containers. To monitor and control the temperature variations of the growing media inside the growing container, a control system was also designed to monitor and control the heating system. A PT100 sensor probe was installed inside the soil near the root zone. The hourly data collection was conducted in the middle of the container which corresponded with the root zone, as shown in Figure 1F. Thermocouples (REX-C100FK02) (RKC Instrument, Tokyo, Japan) were used continuously to measure and control soil temperature variations. The study was carried out during extremely low temperatures in January. The total heating time applied to the designed pots was 6 h/day and the total observation time was 12 hours. The maximum set temperature at the root zone was 35 °C. When the root zone temperature exceeded the set temperature on the controller, the controllers cut the power to the heating source. This investigation was carried out over five days. During the current study, the power consumption of the heating source was also measured hourly using a power meter. Greenhouse ambient temperature readings were collected hourly. Power consumption experimental readings are the mean values from the five days of investigation. Thereafter, the simulation model was validated by comparing it to experimental results.

2.2. Developing the Root Zone Heating System

A specialized root zone heating plant-growing container was developed. First, two pots were installed properly. In between these two pots, an insulation layer was installed and two heating pads were used as the root zone heating source; these were installed in the growing medium. Two plastic polypropylene pots were used, the interior pot containing the growing medium and the exterior pot to act as an exterior boundary and to reduce heat losses, as shown in Figure 1A,B, respectively. The thermal and physical properties of the pots are shown in Table 1. The polyurethane foam thermal insulation layer between the two containers was sandwich structured to reduce heat loss, as shown in Figure 1C. Two flexible reinforced silicone rubber electric heating pads fixed in the inner pot in the growing medium were used as the heating source for the root zone, as shown in Figure 1D. The physio-thermal properties of the insulation layer are described in Table 2. Coco peat was used as the growing medium for this experiment. This was chosen as it is very supportive to plants with a satisfactory moisture-holding capacity and it is a good medium to transfer heat and nutrients to the plants, as shown in Figure 1E. The physio-thermal properties of the growing medium are given in Table 3. The characteristics of the pads are given in Table 4. Figure 1F illustrates the position of the root zone, while the fully assembled pot is shown in Figure 1G. Figure 1H describes the heating control system, including the control switch and thermocouples.

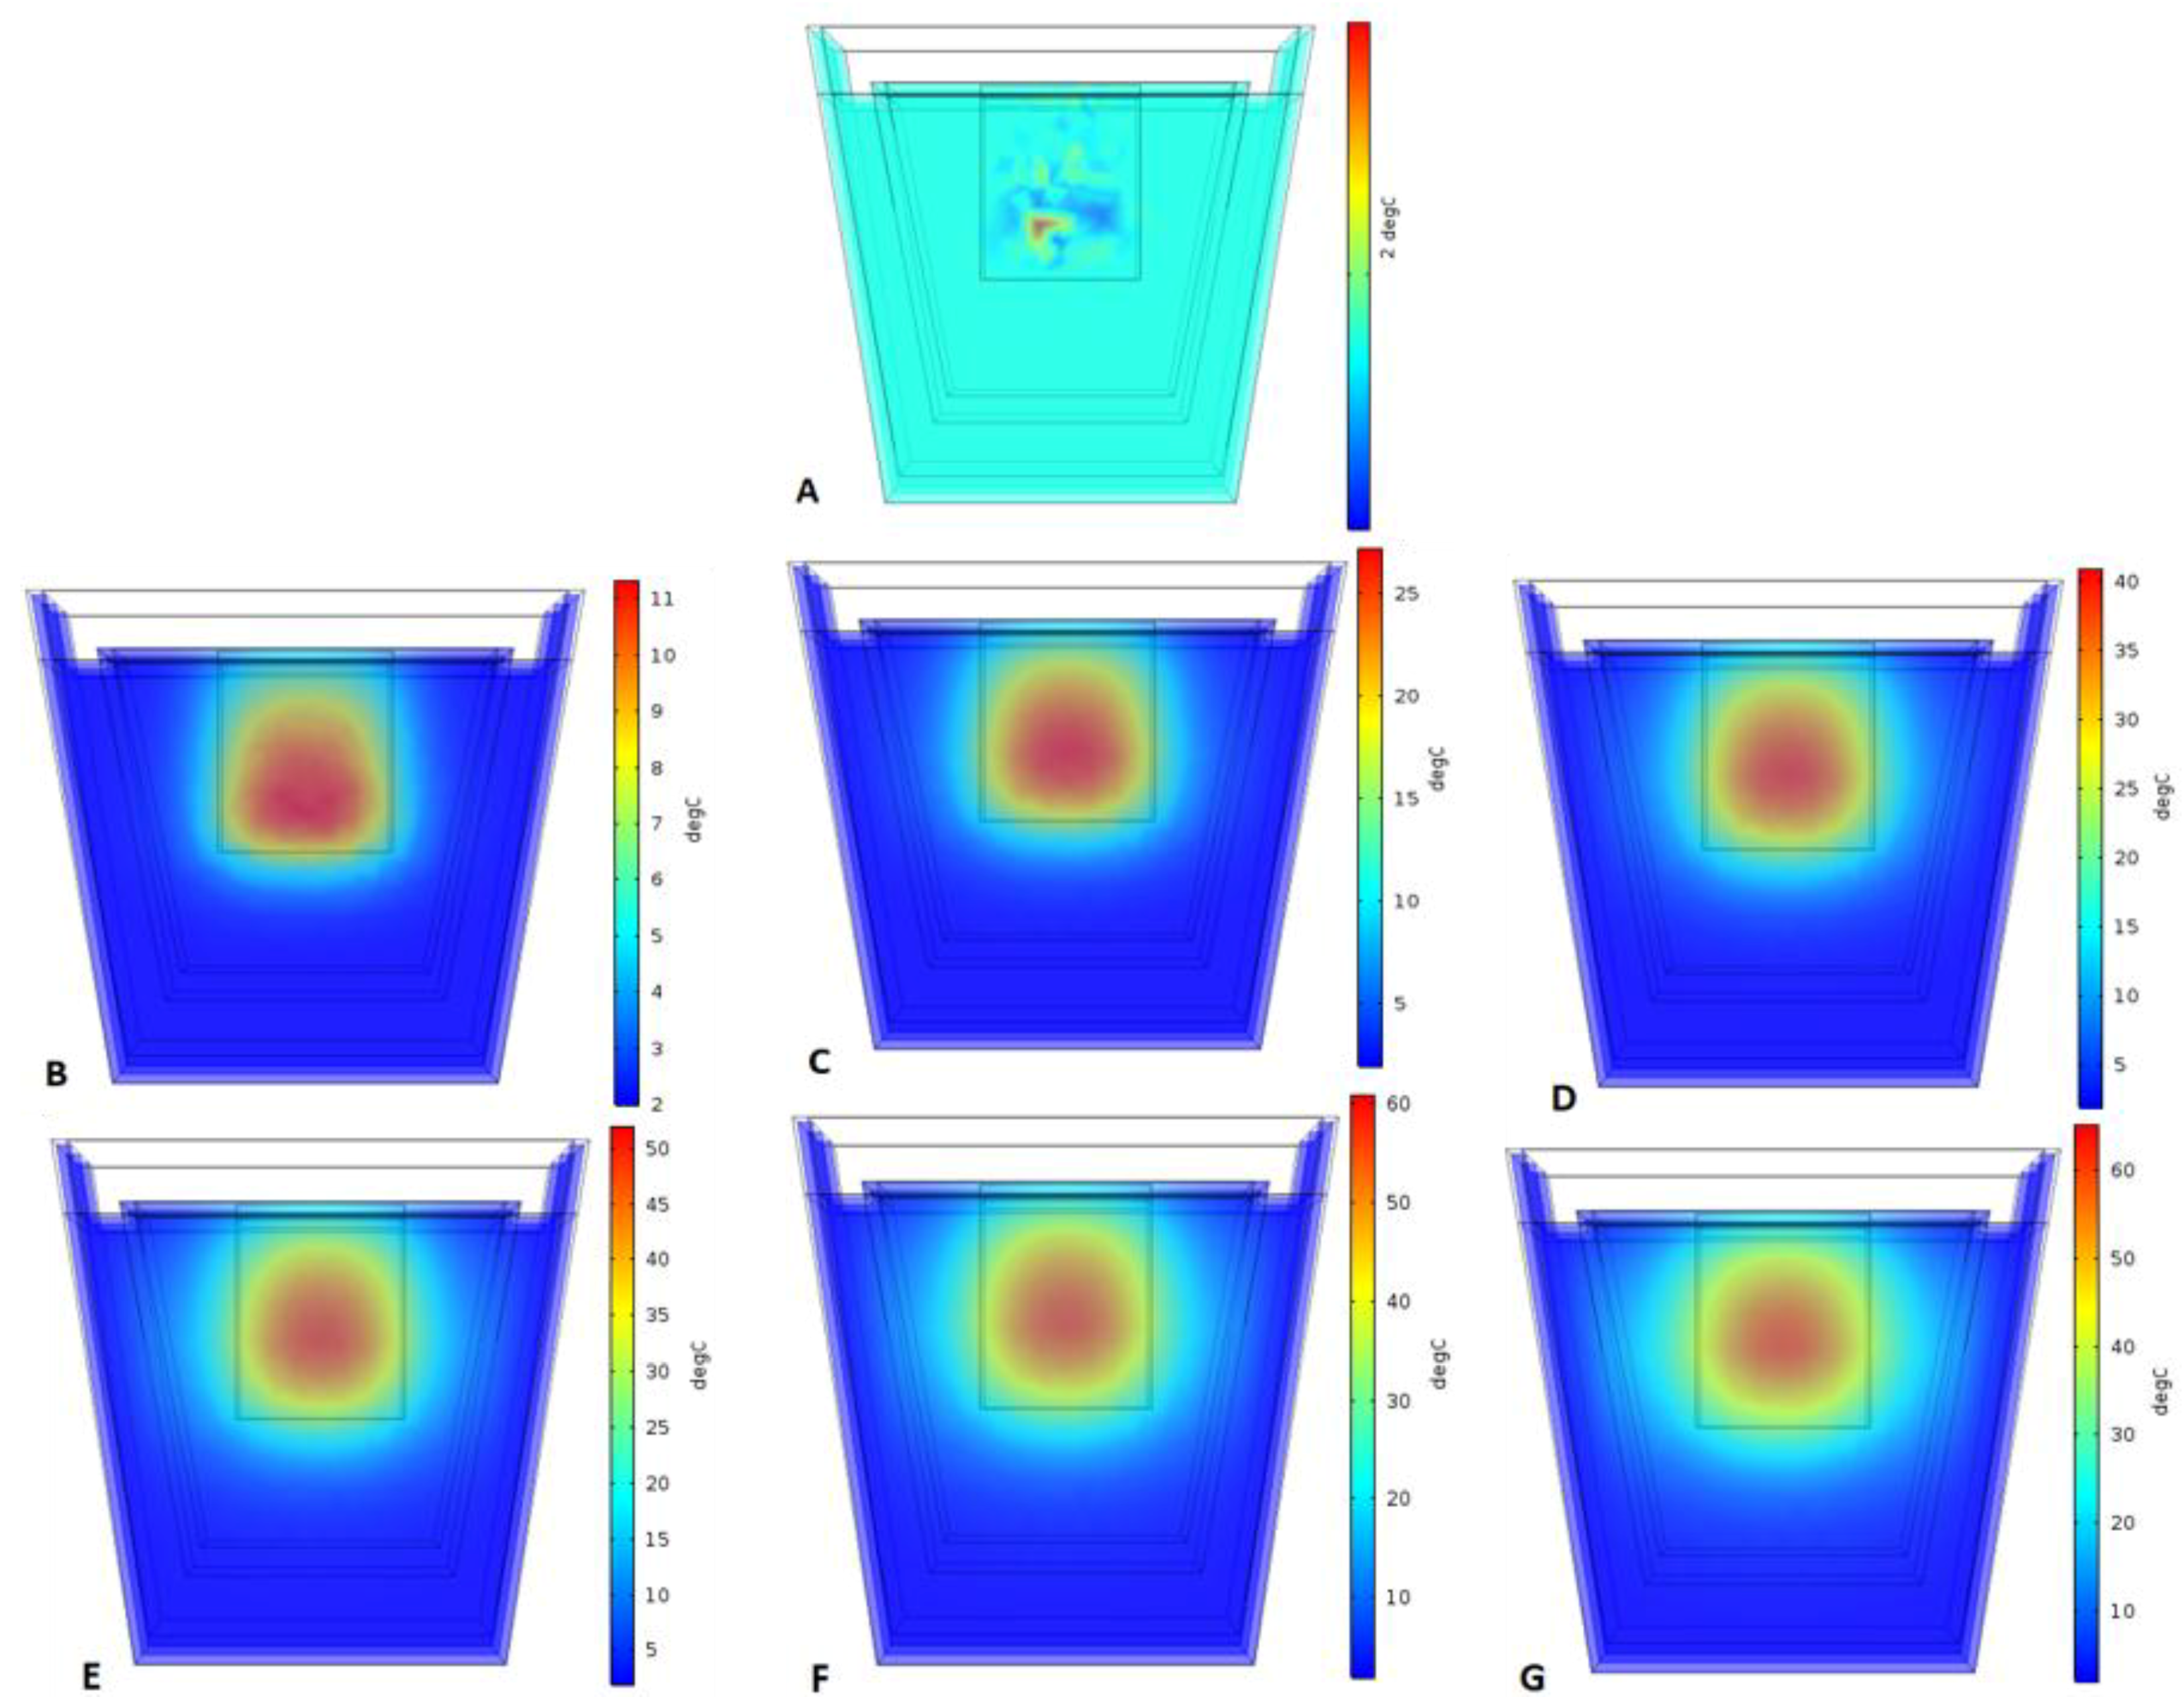
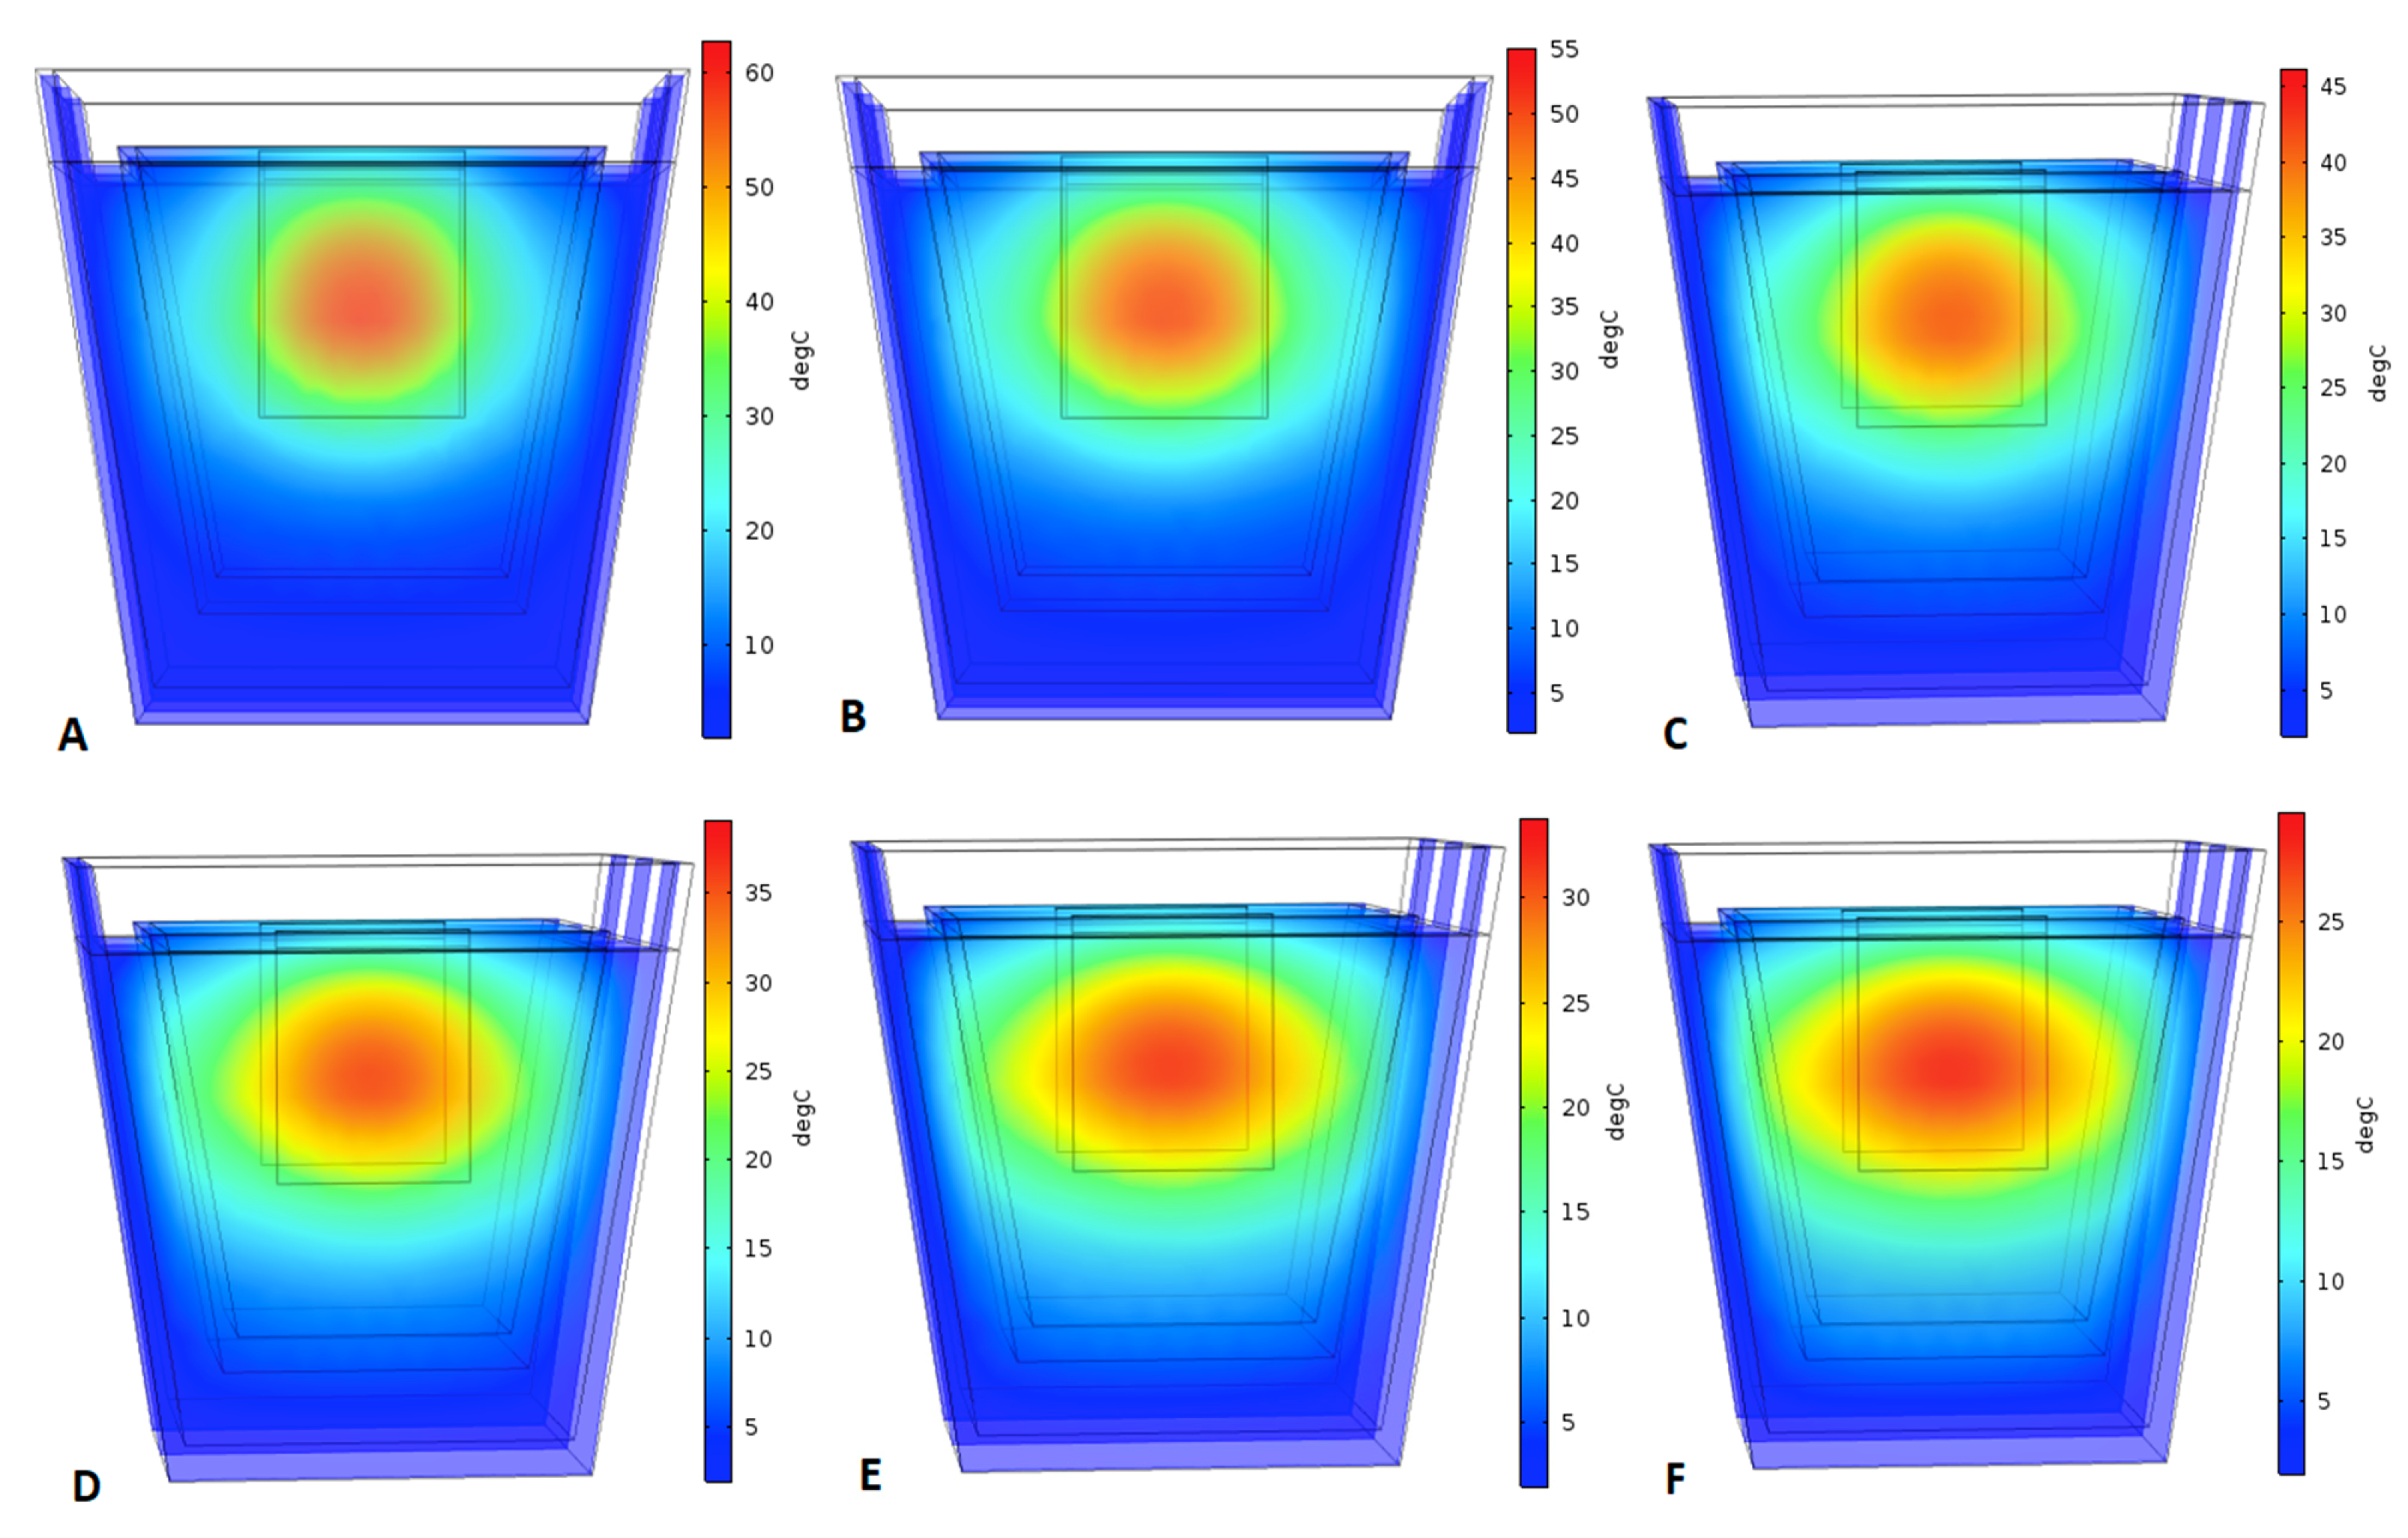
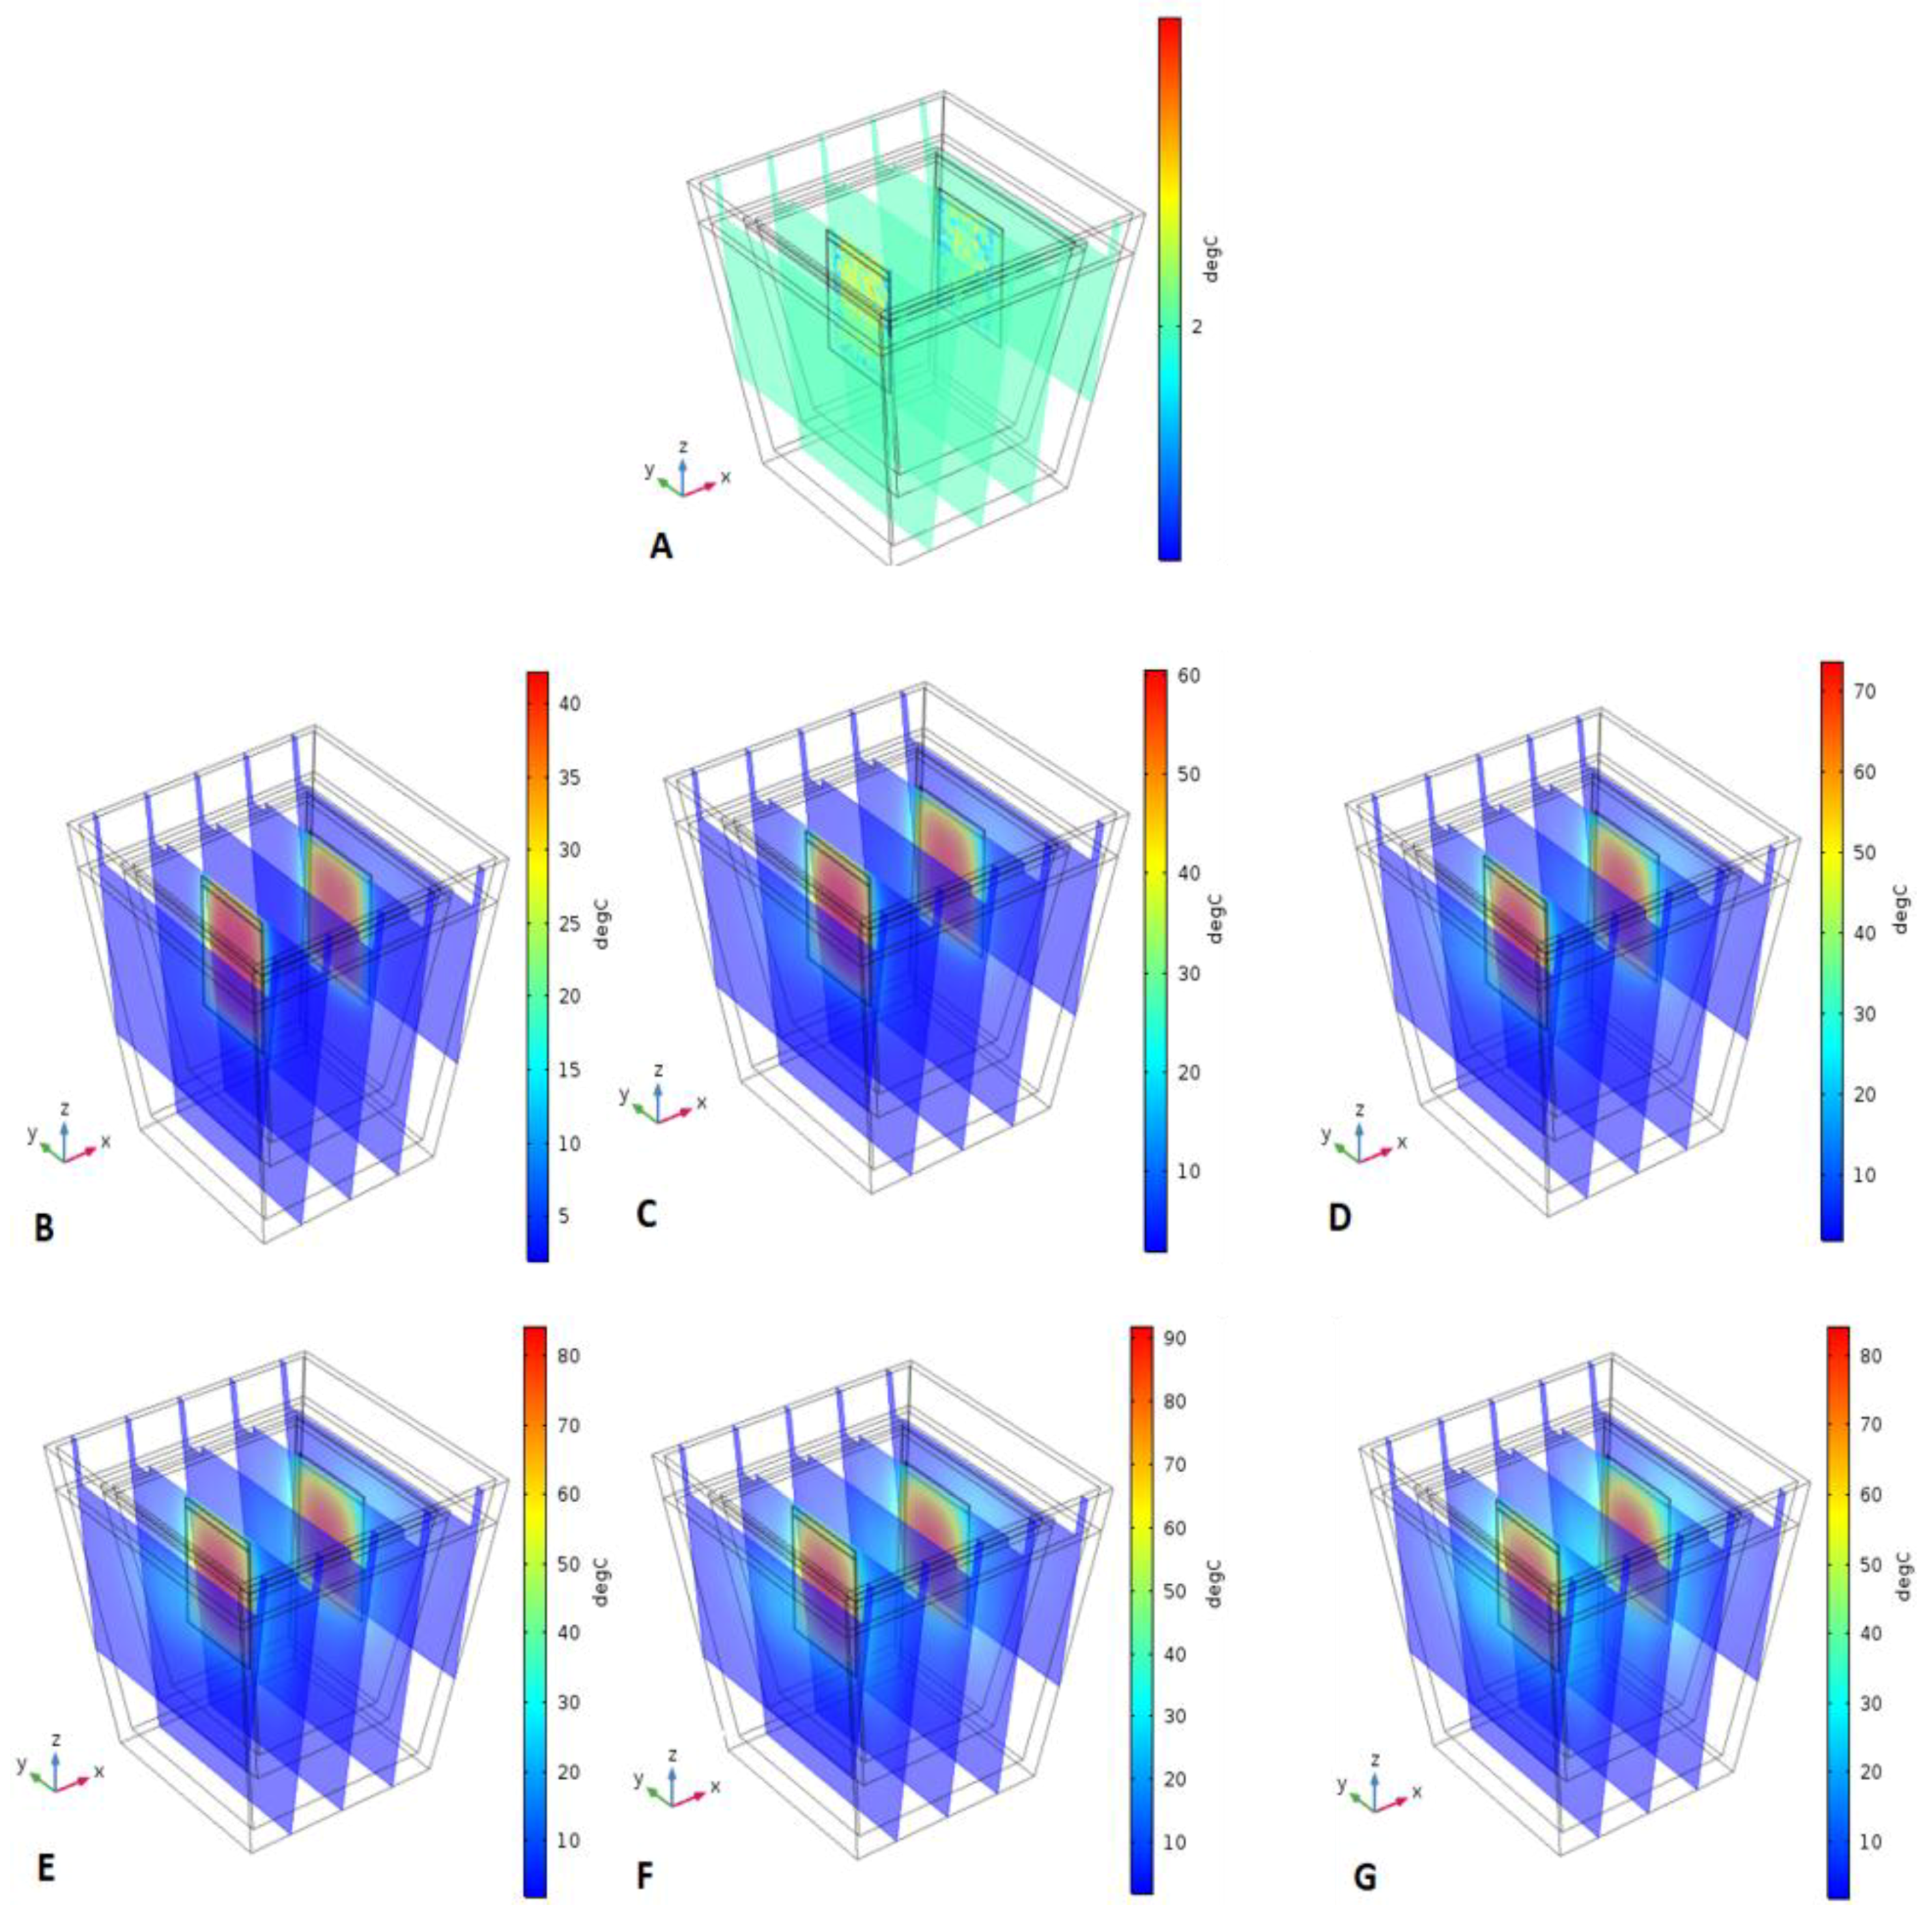
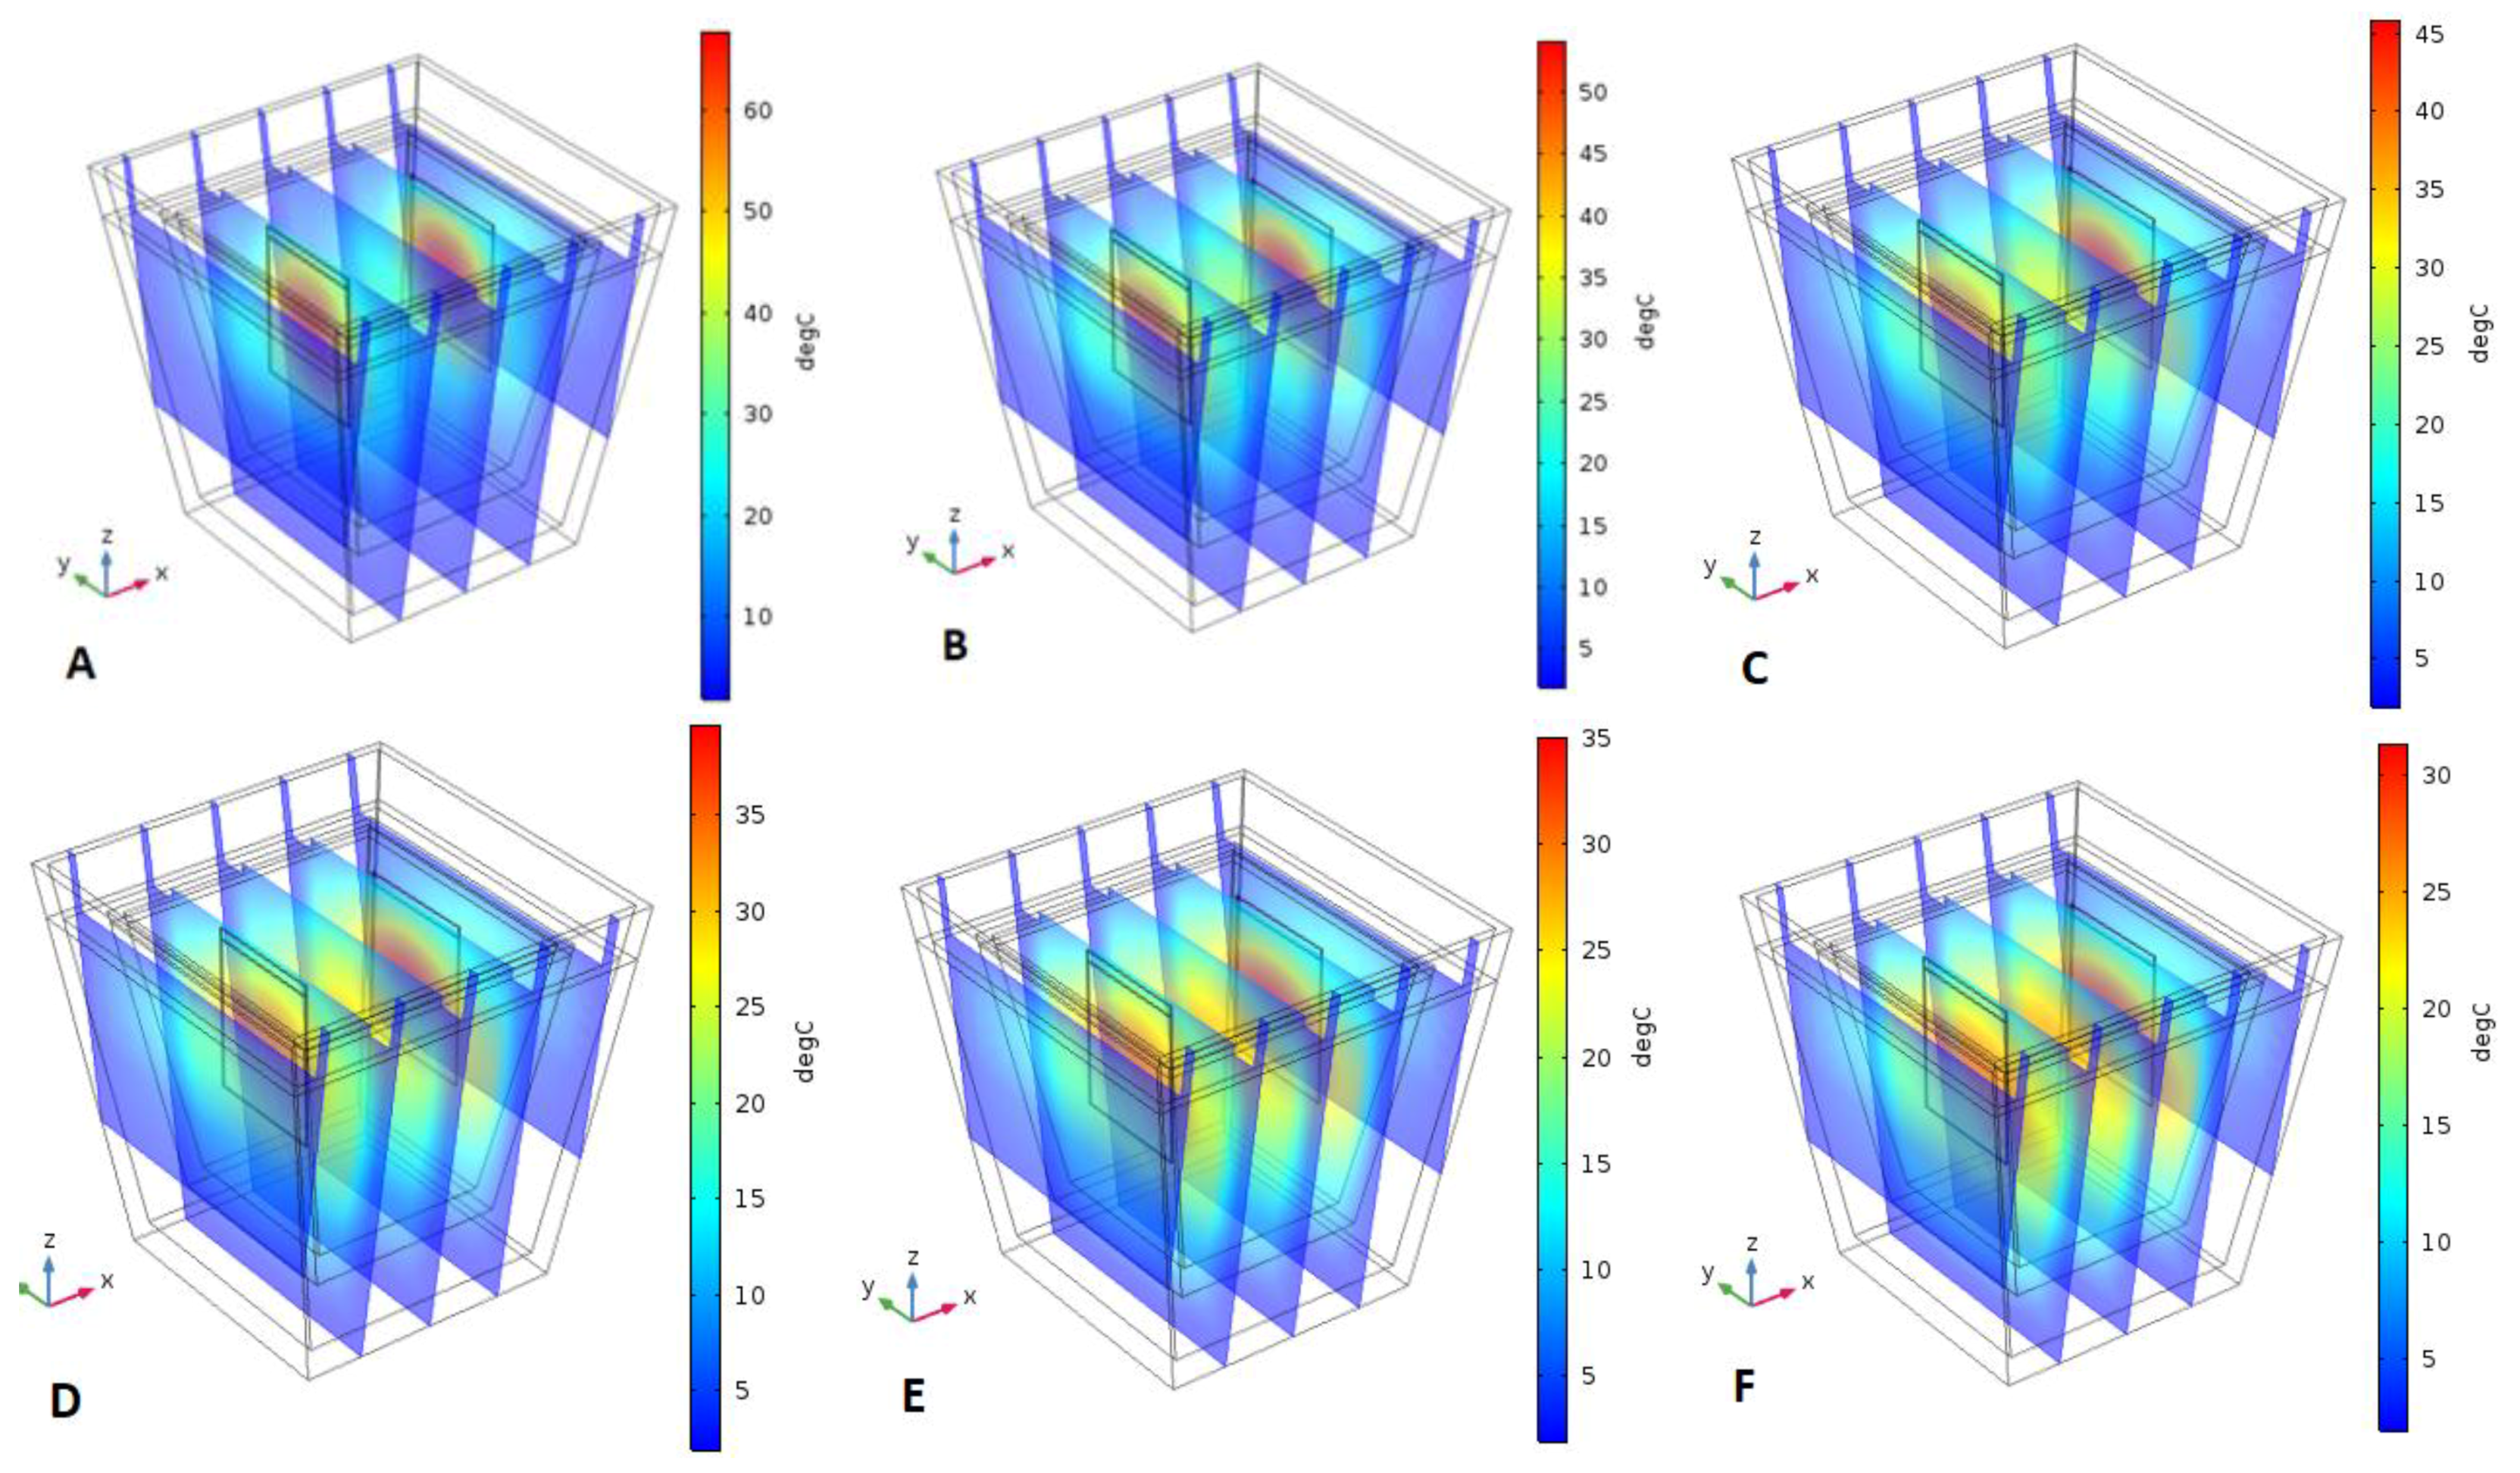
2.3. Heat Transfer in Porous Medium Module

The COMSOL Multiphysics 5.1a Package (Comsol, Beijing, China) was used in the current study to simulate the heat transfer in porous media [25,26,27,28,29,30]. In this study, the properties of all the materials and the symmetrical details of the system were determined. The main trouble for this simulation was that the soil was a discontinuous medium [31]. However, with the help of the methods reported by De Vries [32], we were able to approximate the volumetric heat and therefore consider the soil as a continuous medium [33]. All two- and three-dimensional geometries of the model were built in AutoCAD; then, a mesh of the imported model was created in COMSOL Multiphysics 5.1a. The generated meshes were Tetrahedron, Triangle, an edge element, and a vertex element, the details of which are given in Table 5. The meshing was thicker at the surface of the growing medium. The shape function that determined the physical behavior of each part was defined by the law of conservation of energy that controls heat flow in a solid growing medium, limited to the mechanisms of conduction.

2.4. Analysis of Time Interval and Boundary Conditions

The analysis interval time was 60 min, while the time sub step was 15 min depending on the trial assessment. Different conditions were applied at every step of the investigation. The heating pads were switched on for 6 h and switched off for the next 6 h. Heat exchange between the system and the environment was allowed. The key equations used in this study are derived from the heat transfer in porous media module.
  ( ρ C ρ ) e f f T t + ρ C ρ u . T + . q = Q + Q v d  
  ρ C ρ T t + ρ C ρ u . T + . q = Q + Q t e d  
  ( ρ C ρ ) e f f = θ p ρ p C ρ , p + ( 1 θ p ) ρ C ρ  
  k e f f = θ ρ k ρ + ( 1 + θ ρ ) K + K dis ρ  
Similarly, in the equations, “ρ” is the density of the soil (kg/m3), “Cp” is the specific heat capacity at constant stress (J/(kg·K)), “T” is the absolute temperature (K), “u” is the velocity field, “q” is the heat flux by conduction (W/m2), “α” is the coefficient of thermal expansion (1/K), “Q” contains additional heat sources (W/m3),“1 − θp” is the porosity, and “keff” is the effective thermal conductivity.

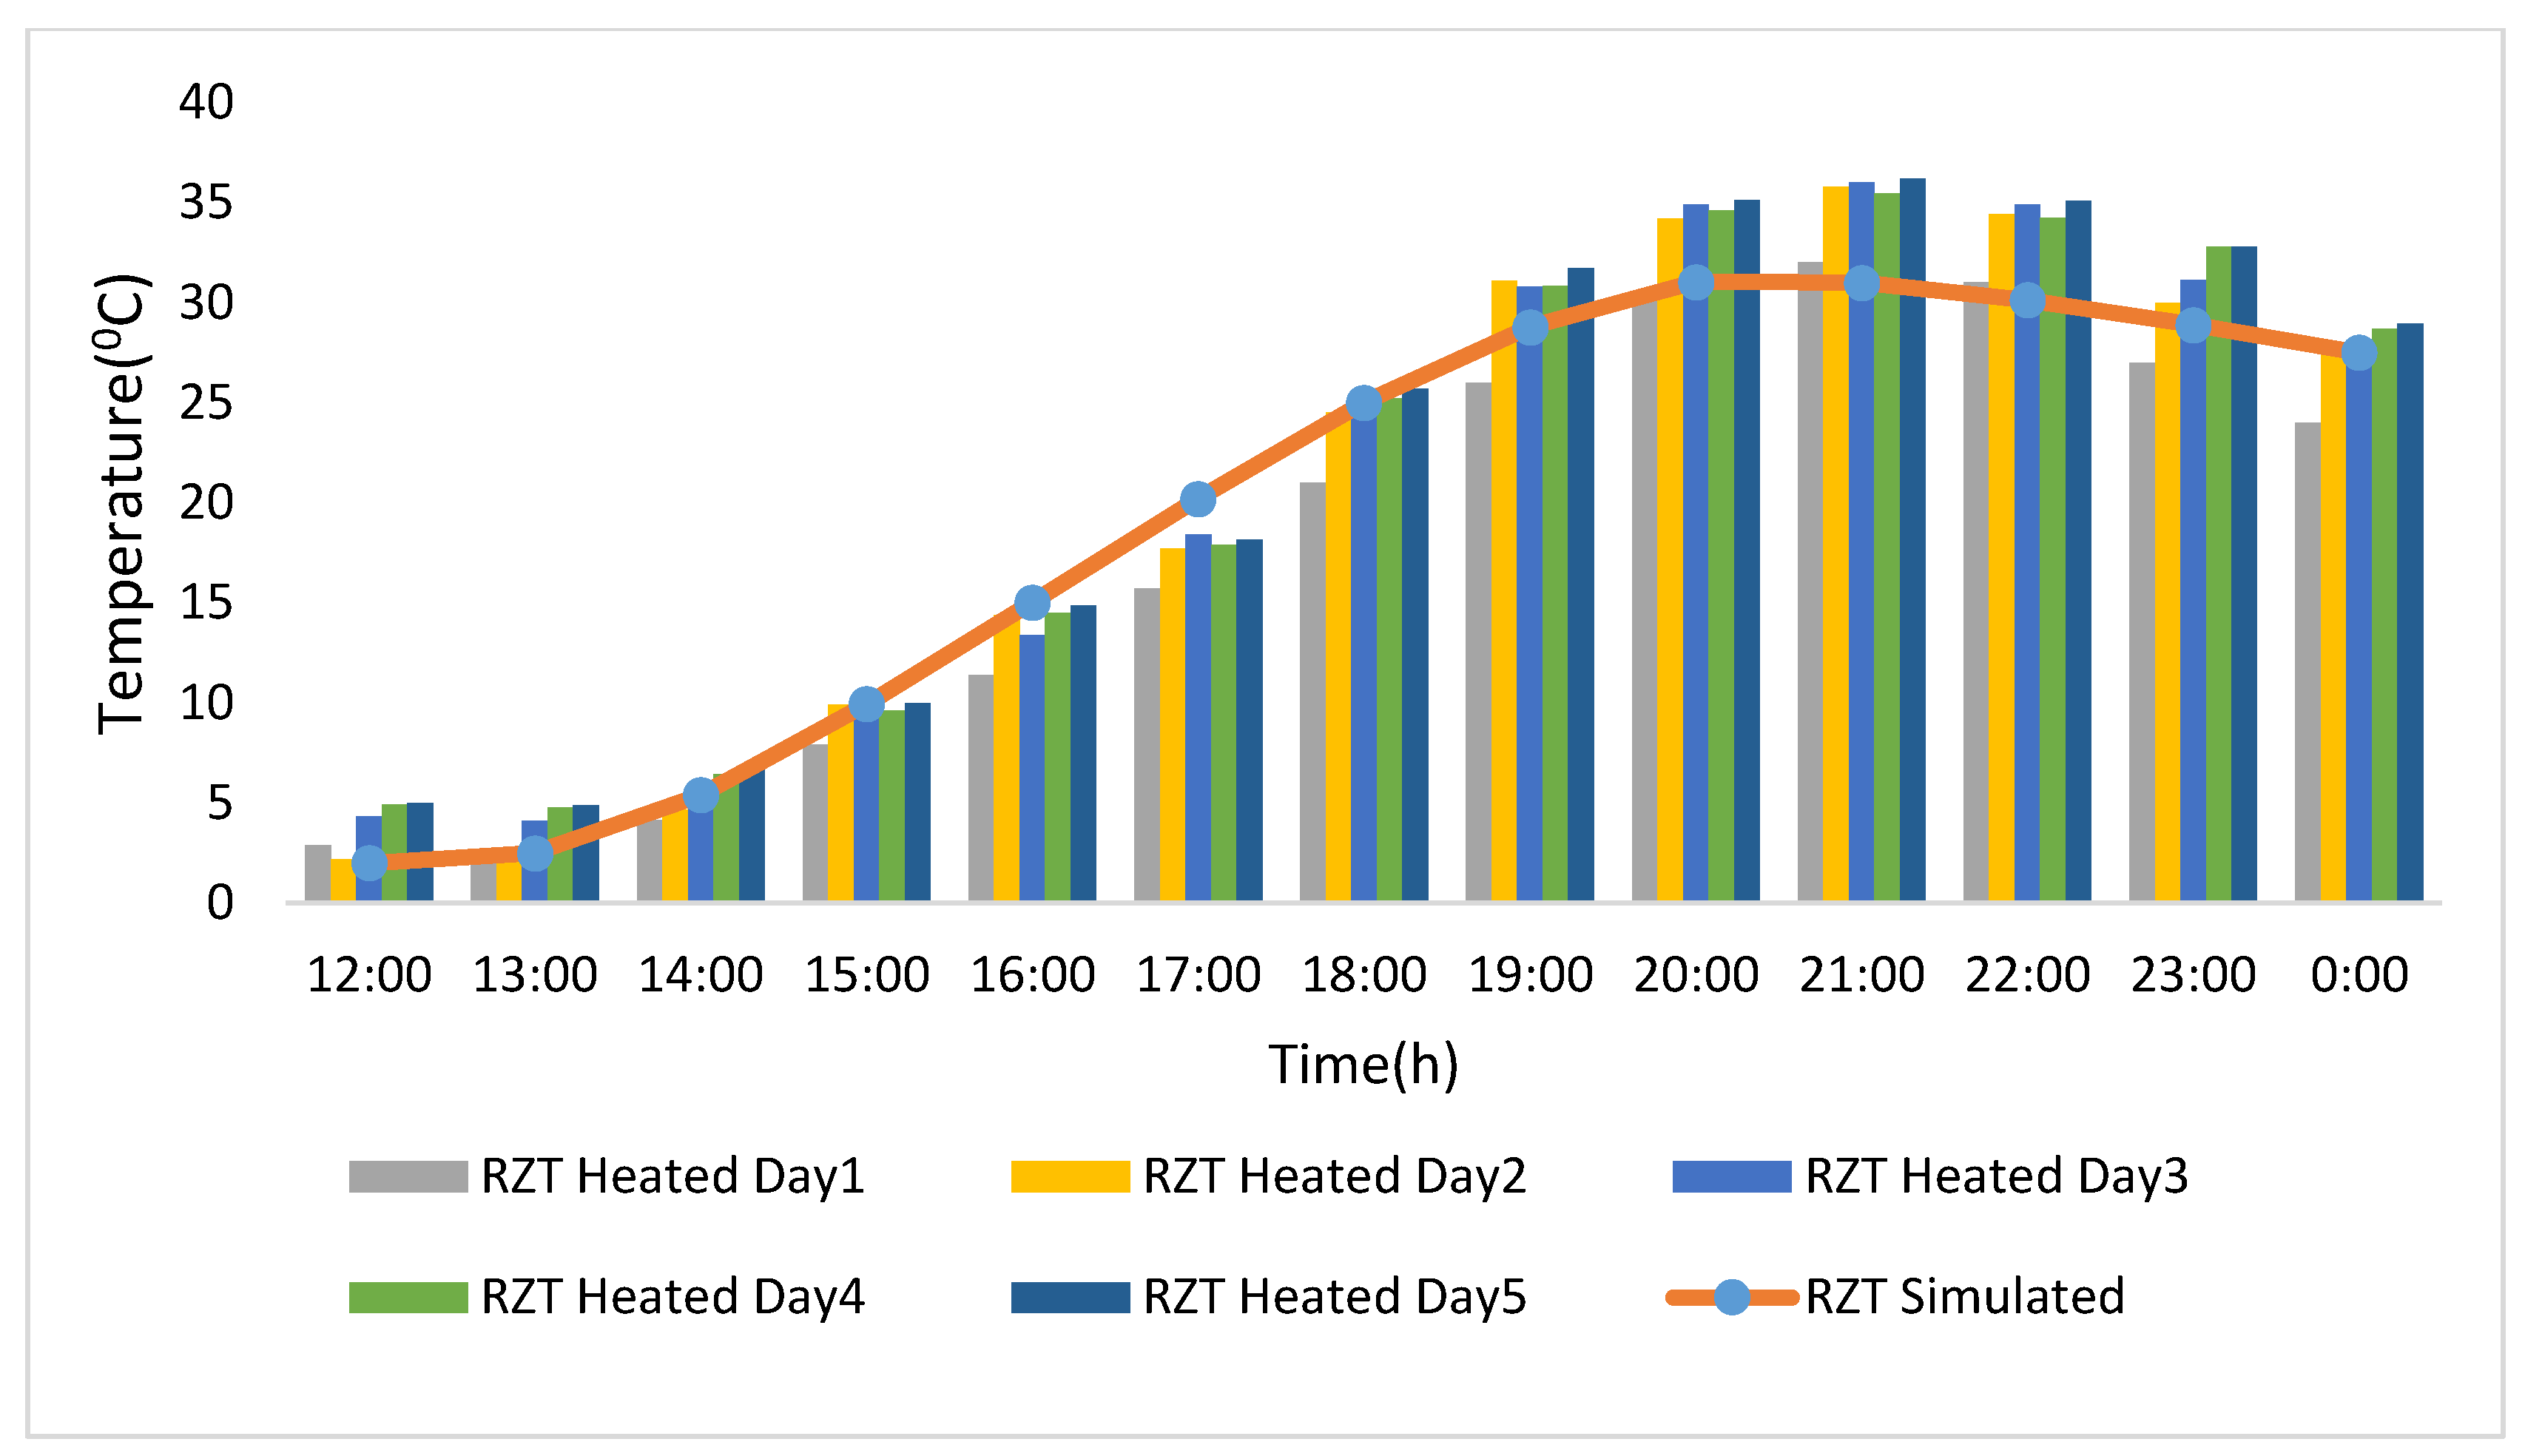
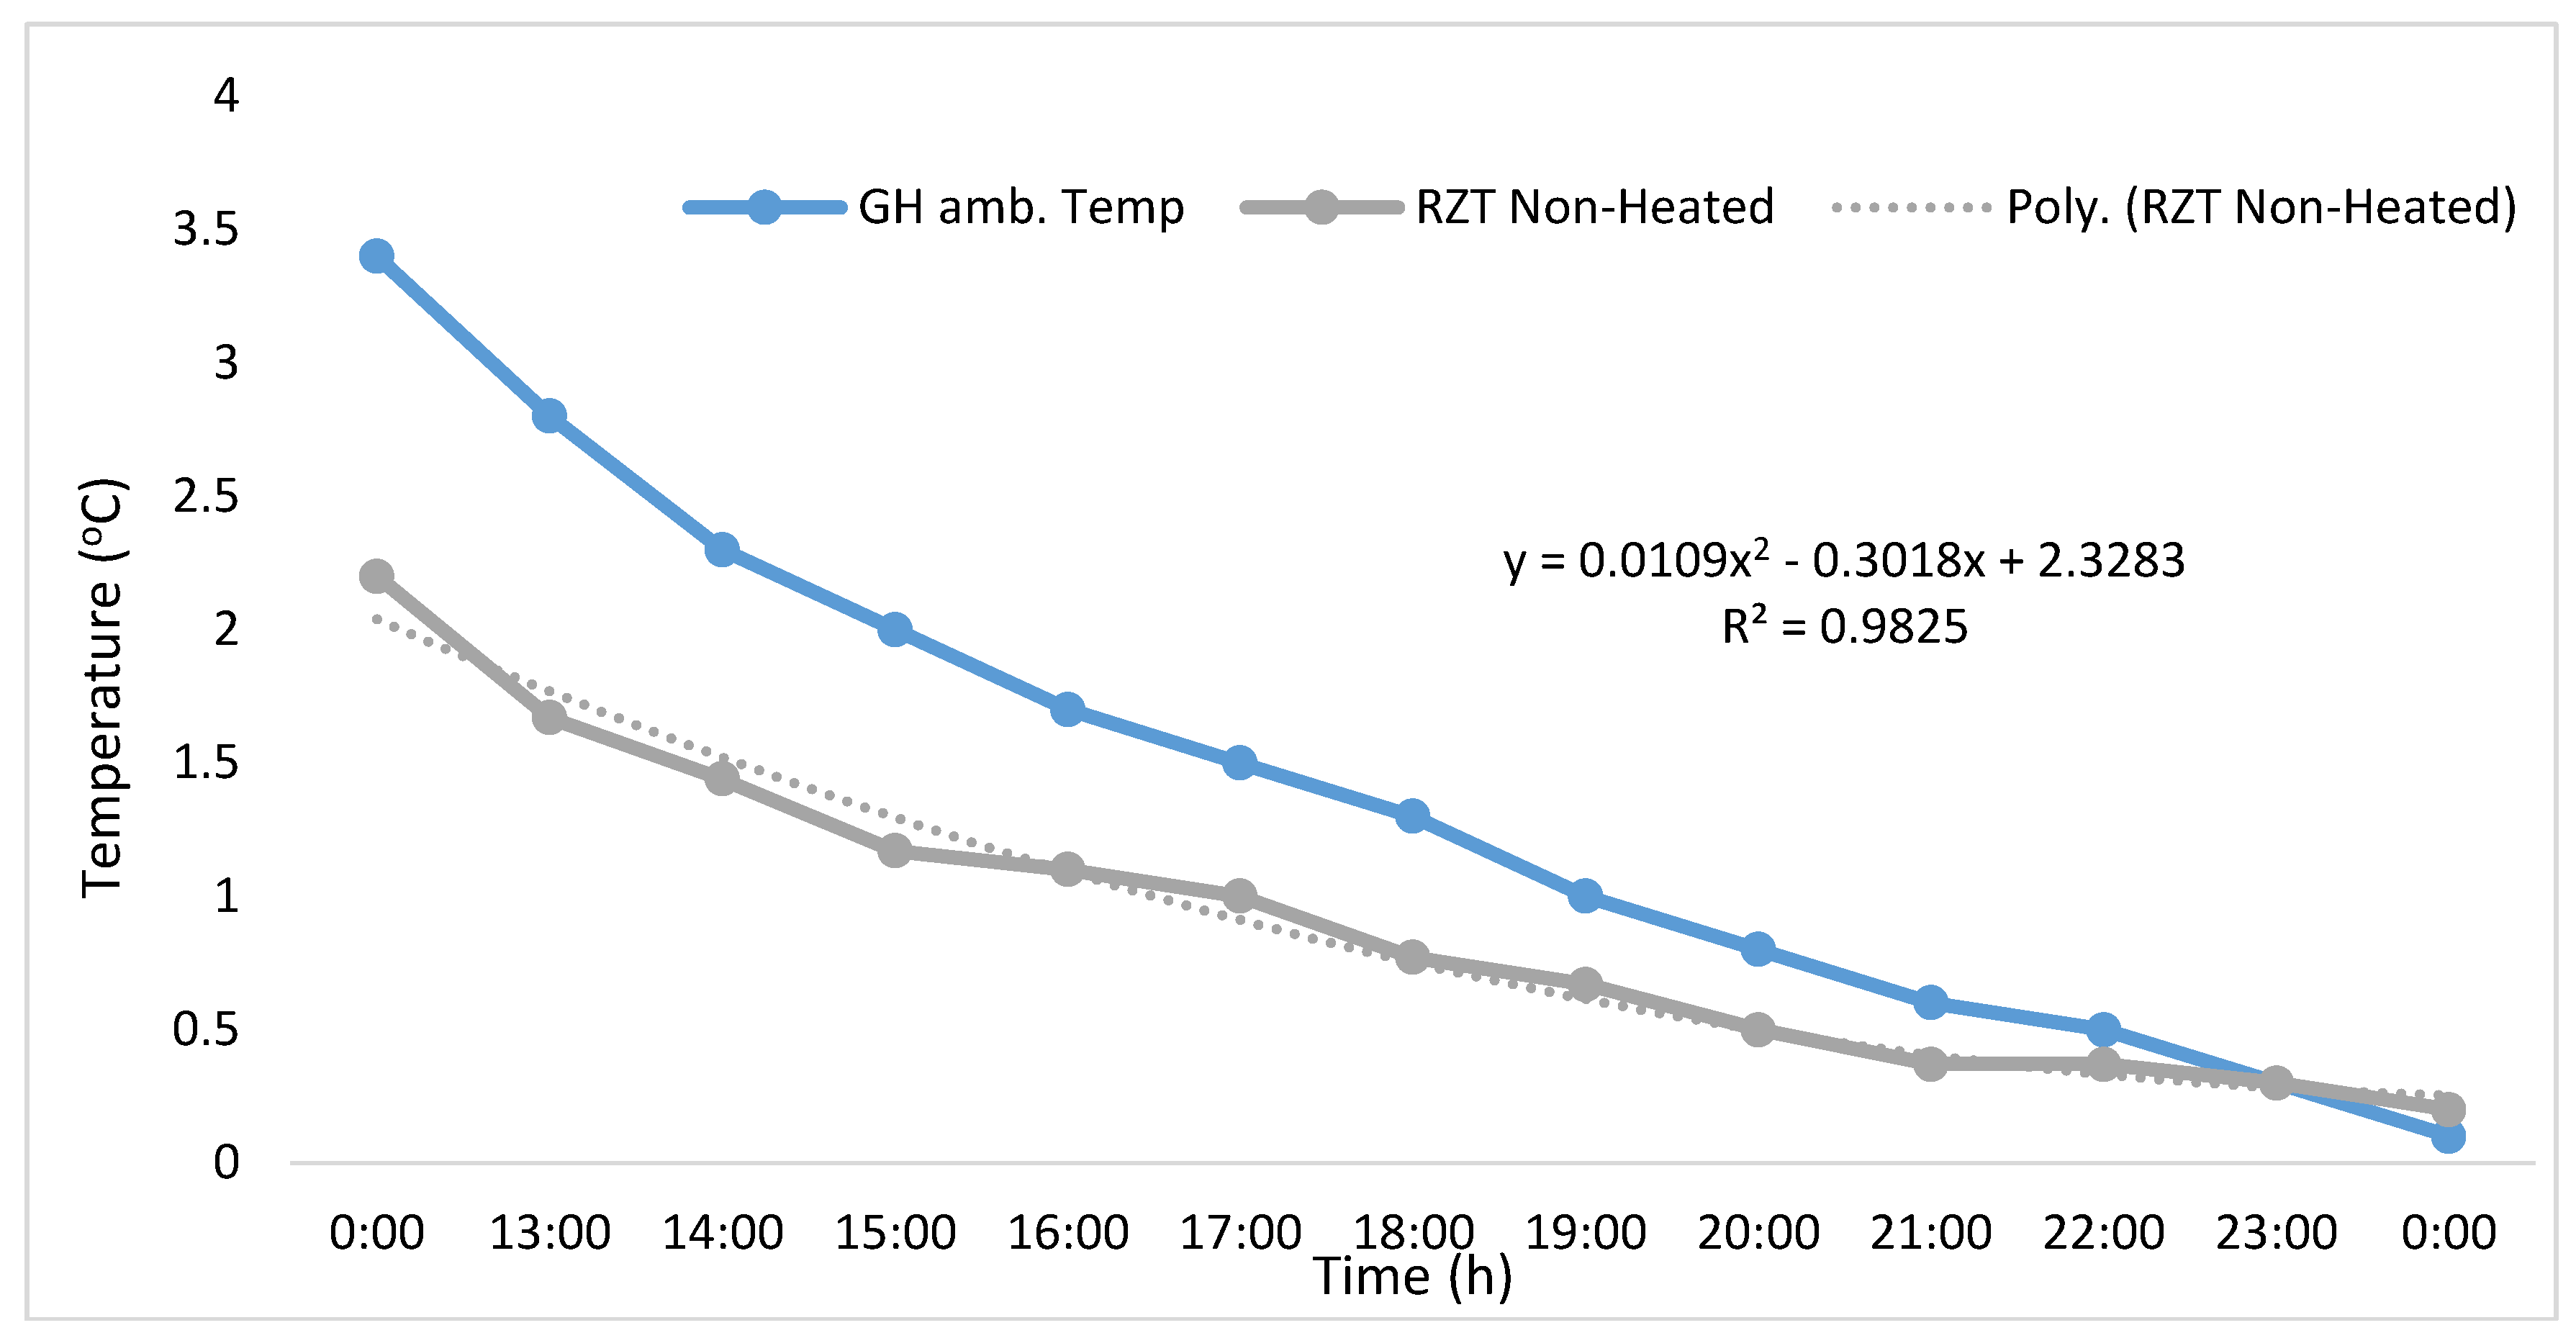
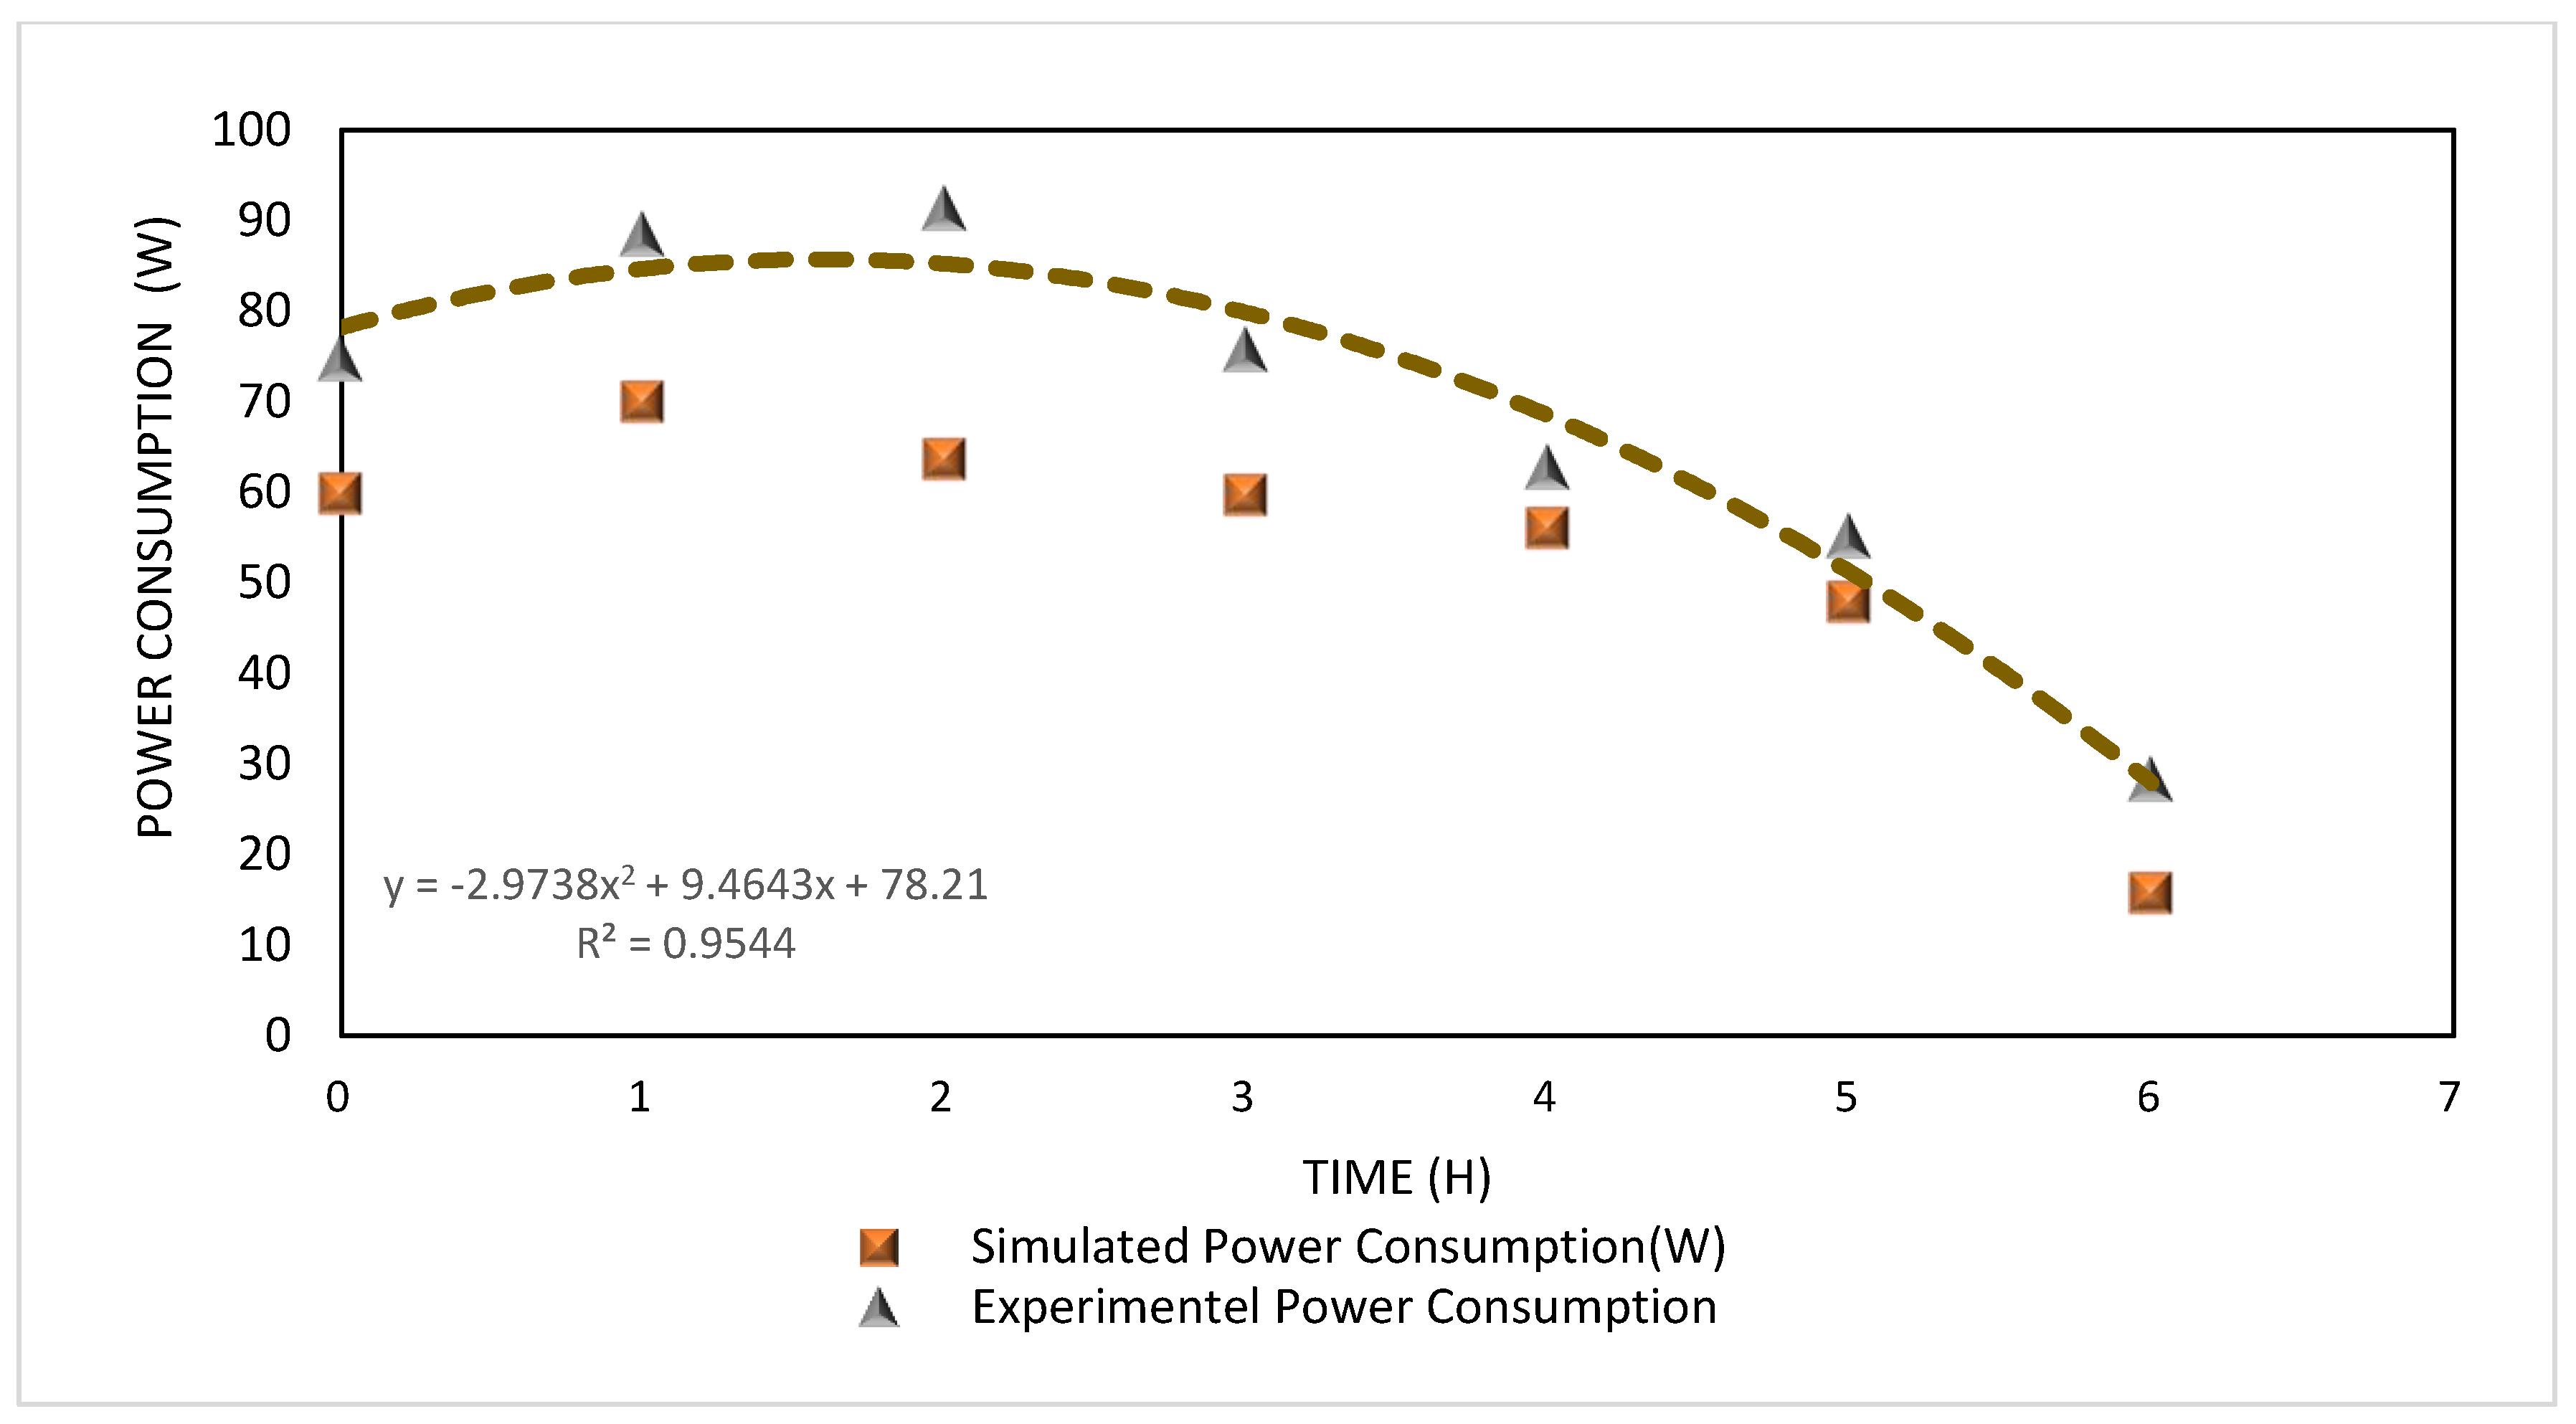
3. Results and Discussion

The simulation results are shown in Figure 2. Before the heating system was initiated, the set ambient temperature was 2 °C, as shown in Figure 2A. After 1 h of heating, the temperature increased and reached a maximum of 11 °C, as shown in Figure 2B. Figure 2C illustrates that the temperature of the central zone which increased to 25 °C, and the temperature increasing trend can be observed in Figure 2D, which has a maximum temperature of 40 °C. The increasing temperature trend continued and after 4 h of heating the temperature reached 50 °C, as shown in Figure 2E. In Figure 2F, the maximum obtained temperature was 60 °C. After this, the heating source was switched off and it can be seen that in Figure 2G the maximum temperature remained the same as that in Figure 2F. All images in Figure 2 illustrate the continuous increasing temperature trend of the temperature profile and it can be observed that the heat flux expands in all directions through the pot over time.
In Figure 3, after 6 h of heating, the process was stopped. Figure 3A shows that the maximum temperature remained at 60 °C; however, the four-dimensional conductive contours expanded with the passage of time, and it can be seen by the contours that the temperature near the boundary of the inner pot reached 20 °C. Figure 3B shows that the temperature decreased from 60 °C to 55 °C, but the expanding heat transfer pattern is well-defined and moving in all directions. The decreasing temperature trend continued in Figure 3C, reaching 45 °C. Figure 3D clearly illustrates the declining temperature of the central zone, which decreased to 35 °C; however, the heat transfer contours continued to expand. Figure 3E shows that the temperature of the central zone decreased to 30 °C. The increasing horizontal heat transfer is shown in all images in Figure 3, which illustrates heat loss from above. However, no heat can be seen from the sides due to the insulation; this transfer only crosses the boundaries of the inner pot. The maximum temperature observed in Figure 3A was 60 °C and the minimum temperature observed was 25 °C.
The simulation results of conductive surface heat transfer during the first 6 h of heating are shown in Figure 4; the temperature variations and increasing surface heat transfer pattern can be observed in all of the images. The initial set ambient temperature of the heating system was 2 °C, as shown in Figure 4A. After 1 h of heating, the maximum surface temperature increased and reached a maximum of 40 °C near the heating source, as shown in Figure 4B. The central slice temperature range also increased from 5 °C to 10 °C. In Figure 4C, the temperature of the heating source zone increased to 60 °C and the temperature range of the central slice was 10 °C to 15 °C. The surface temperature trend can be observed in Figure 4D, which had a maximum temperature of 70 °C near the heating sources, and the central slice temperature range increased from 15 °C to 20 °C. Figure 4E shows that the temperature range near the heating source was 70 °C to 80 °C, and the central slice temperature range was 30 °C to 40 °C. This pattern of increase continues in Figure 4F, where the maximum temperature detected was 90 °C and the central slice range was 35 °C to 45 °C. Figure 4F shows that the rate of heat transfer was reduced, as the temperature in the heating source slice dropped from 90 °C to 80 °C and the contour was lengthened.
After 6 h of heating, the heating source was switched off. The heating system surface heat transfer patterns are presented in Figure 5. Figure 5A shows that the maximum temperature remained at 60 °C; however, the four-dimensional heat transfer increased with the passage of time, and the color contour shows that near the boundary of the inner pot the temperature reached 20 °C. The temperature started to decline to 55 °C, which can be seen in Figure 5B, with the heat expanding in all directions of the pot; the thermal contours show that the heat transferred to the internal pot boundaries. The falling temperature trend continues in all images including Figure 5C, where it reached 45 °C. After the drop in temperature in Figure 5D, it is clearly shown that the maximum temperature was reduced to 35 °C, but the heat transfer color contours kept increasing. Figure 5E shows that the temperature of the central point decreased to 30 °C. The horizontal heat transfer increased with the passage of time, transferring externally and crossing the boundaries of the inner pot.
Figure 6 presents a comparison of the heat transfer rate of the simulated and experimental RZTs at different times over the five days. For the first observation at 12:00 p.m., the simulated RZT was less than all of the experimental RZTs for that time; the maximum temperature in heated pots noted was 5 °C on day 5, whereas the simulation reading temperature was 2 °C. After 1 hour, the experimental RZTs showed a small decrease in all of the heated pots; however, the simulated temperature increased from 2 °C to 2.5 °C and the experimental RZT changed from 2.8 °C to 2.5 on day 1, from 2.1 °C to 2.6 °C on day 2, from 4.3 °C to 4.1 °C on day 3, from 4.9 °C to 4.7 °C on day 4, and from 5 °C to 4.9 °C on day 5. At 2:00 p.m. the simulated RZT was 5.4 °C; at this time, a slight fluctuation was observed in the experimental RZT readings for all five days, which ranged between 4.14 °C and 6.6 °C. The increasing experimental RZT trend also continued at 3:00 p.m. on all days; at this time, the simulated RZT rose from 5.3 °C to 9.9 °C and in heated pots the experimental RZT was between 7.9 °C and 9.9 °C. At 4:00 p.m., the readings of the RZT continued to rise for both methods, from 9.9 °C to 15 °C in the simulated RZT, while the experimental RZT in the heated pots increased on all days, ranging between 11.4 °C and 14.4 °C, as can be seen in Figure 6. At 6:00 p.m., the heating power source was switched off in both the simulated and heated pots. After switching off, the RZT increased continuously in both methods as the conduction process kept expanding throughout the pots. The increasing RZT trend continued until 8:00 p.m. in the simulated method, while in the heated pots this increasing trend continued until 9:00 p.m. For the simulated method, the maximum observed temperature was 31 °C, observed at the 10:00 p.m., while the minimum temperature was 2 °C at 12:00 p.m. The dropping trend of the RZT in the heated pots started at 10:00 p.m., with an average drop of 1 °C being observed during this time. At the last observation of heated pots at 12:00 a.m., the RZT ranged between 24 °C and 29 °C.
Figure 7 shows that with the decrease in ambient temperature of the greenhouse, the root zone temperature of the non-heated pots also decreased. It can be observed that at 12:00 p.m., the ambient temperature of the greenhouse was 3.5 °C and the temperature of the non-heated root zone was 2.3 °C, which was lower than the ambient temperature. After 1 hour, the ambient temperature decreased to 2.6 °C; at that time, the root zone temperature of non-heated pots dropped to 1.5 °C. The ambient temperature continued to decrease at 2:00 p.m., which affected the non-heated root zone temperature, which dropped to 1.4 °C. At 3:00 p.m., the ambient temperature reached 2 °C and the root zone temperature of the non-heated pot was 1.7 °C. This decreasing trend continued in both the ambient temperature and the non-heated pot temperature until 12:00 a.m. At the time of the last observation, the ambient temperature decreased to 0.2 °C and the non-heated root zone temperature was 0 °C. The temperature dropping trend line can be observed for both ambient temperature and non-heated pot temperature, showing the non-heated pot temperature to be directly proportional to the greenhouse ambient temperature. These results were in good agreement with the study of Abdel Rahman et al. [6], who stated that with changing the temperatures, even in relatively small containers, the root temperature lags behind the air temperature considerably.
The power consumption of the heating system during the experiment and simulation were compared. As the power source was initiated, the power consumption of the experimental observation was higher than that of the simulated reading (74.06 W in the experimental observation and 59.8 W in the simulation). After 1 hour, the power consumption of both the simulation and experimental method fluctuated and increased, as shown in Figure 8. The simulated power consumption after 1 hour increased from 59.87 W to 70.2 W and the power consumption of the experimental observation increased from 74.06 W to 88.4 W. After 2 hours of heating, the simulation method showed a small decline in power consumption (70.2 W to 63.66 W), while in the experimental method a small rise in power was observed (88.4 W to 91.02 W). A declining trend continued during the fourth, fifth, and sixth hours of heating in both methods. The highest power consumption was recorded during the third hour of heating in the experimental observation, which was 92.2 W, while in the simulated observation the highest power consumption value was 70.02 W. The lowest power consumption was recorded during the sixth hour of heating in both methods, which was 28.2 W in the experimental observation and 15.73 W in the simulated method. The power consumption trend for both methods was similar. The power consumption of all experimental readings was higher than those of the simulated method, due to environmental factors. The polynomial correlation has an R2 value of 0.96 with an order of 2.

4. Discussion

Bazgaou et al. [34] proposed the burning cave soil warming structure, which uses biomass as an energy source but has an adverse influence on the environment due to the emission of CO2 directly from the experimental site. In contrast, the heating system suggested in our study has no such direct influence on the environment, as the electric power source was availed from the district grid. Moreover, the pots used in our designed heating system are developed using polypropylene, which will not affect the quality of the plants. This was proved by Fabrizio [35], who used polypropylene material in his investigation and revealed that this material does not interfere with the root system of crops. The efficiency of the insulation plays a vital role in saving the energy stored in form of heat for a long time, as suggested by Cuce and colleagues [36] in their key clarifications on insulating materials—which are needed in this respect for energy-efficient and environment-friendly greenhouse applications. The benefits of insulation can be observed in our investigated results, as the heat loss process was slowed by insulating the suggested heating system. Thanks to this insulation, heat is stored in the pots for a long time. Moreover, as the insulation covered the surface of the pots in all directions, heat loss can only occur upward; this upward heat movement can also benefit the plant canopy by providing heat to the leaves of plants.
In the past several years, a vital focus has been placed on vertical ground heat exchangers. Thus, far fewer models have been suggested to design, simulate, and investigate horizontal ground heat exchangers [37]. The current developed root zone heating system used a heating source which can transfer heat horizontally from two heating pads in the growing medium. The position of the heating source can be observed in Figure 1D. Hassanien et al. [38] used an evacuated tube solar collector-assisted heat pump to heat greenhouses and concluded in his study that to provide the optimal heating requirements to crops, extra heating methods should be applied in December, January, and February. The maximum heating requirement was found in January and February. However, our suggested heating system was evaluated during extremely low temperatures and obtained feasible root zone temperatures for different crops.
The experimental results of Xu et al. [39] illustrate that for greenhouses with seasonal heating systems, the temperature should be kept 12 °C higher than that of the ambient temperature. Using the proposed system, our investigation results show that the soil temperature in the heated pots was higher than the ambient temperature. The heated RZT was higher than the ambient temperature over 12 hours, and this temperature difference between the ambient air and heated pots ranged from 2 °C to 35 °C. Joudi et al. [40] stated in their investigation that greenhouse soil heat provides 13% to19% of the heating load as the soil is a good medium for heat storage, and the inclusion of this heat source reduced the heating demand for greenhouses. The results obtained in our investigation also revealed that the growing medium used during the current investigation stored heat within the pot and maintained a temperature range between 05 °C and 35 °C for 12 h, as shown in Figure 6.
The experimental and simulated results revealed a temperature range from 0°C to 35 °C achieved after heating the root zone for 1–6 h. An RZT range of 0–35 °C range is suitable for many greenhouse-grown plants. Gonzalez et al. [41] reported that strawberry plant yields were highest when a constant RZT was maintained in the range of 18–28 °C. The current developed heating system is a suitable option to attain high yields of strawberry, as this RZT was achieved during our experimental and simulated studies. Abdel et al. [42] suggested that sweet pepper yields can be maximized by providing optimal root zone temperatures from 15–20 °C, which can also be accomplished by heating via the current system for 4–5 hours. Sakamoto and Suzuki [43] conducted an experiment to determine the optimum root zone temperature for lettuce; they found that a root zone temperature ranging from 20–25 °C exhibited a positive influence on the plant growth. This optimal root zone temperature range was maintained during the experimental investigation. Olberg and Roberto [44] concluded in their findings that root zone heating for poinsettia between 24 and 27 °C is effective means to produce good quality, marketable potted plants. Therefore, our designed heated pots are also a favorable root zone heating option for poinsettia production. Tachibana [45] sought to determine an RZT for effective nutrient and water uptake by cucumber, and suggested that in cucumber cultivars the concentrations of both water and nutrients were maintained at temperatures less than 17 or 20 °C. The suggested system can heat the root zone directly, which can provide a suitably controlled environment for the growth of cucumber plants. The current root zone heating system was developed with limited, specific materials and coco peat was used as the growing medium. However, future research considerations regarding this heating system could focus on investigating different soil types and responses to different greenhouse plants.

5. Conclusions

The design, development, and performance of the smart pot root zone heating system were evaluated. A model of this system was developed for simulation purposes. The heat transfer in a porous media model was used during this study. The temperature distribution throughout the pot was observed during this simulation study. In the experimental study, the system was investigated during very low ambient temperature conditions in winter. The experimental data was then compared with the simulation results, and good agreement between the two methods was found. The heating time for both methods was 6 h/day. The maximum RZT for the heated pots was 36.2 °C, with an RZT range of 2 °C to 36.2 °C, while for the simulation the range was 2 °C to 31.02 °C. Many studies have shown that this RZT range is suitable for many greenhouse horticultural crops. The electric power consumption for both methods was also observed. In the experimental investigation, the power consumption range was 28.2 W to 91.02 W, while in the simulation the range was 15.73 W to 70 W. The RZT of non-heated pots decreased with decreasing ambient temperature. The RZT of non-heated pots also lagged behind the ambient temperature. Our results clearly show that the suggested heating system can provide a root zone temperature ranging from 0 °C to 35 °C. This root zone temperature range is very suitable for greenhouse plants such as tomato, cucumber, strawberry, lettuce, and poinsettia. To achieve optimum root zone temperatures and increase the period of the growing season, the suggested controlled system can be used during winter. Future studies should focus on investigating the system’s effect on different greenhouse horticultural crops during winter.

Author Contributions

Conceptualization, M.A.; Data curation, K.Y.; Investigation, M.A.; Methodology, M.A. and S.A.S.; Project administration, W.X.; Resources, W.X.; Software, Z.Y.; Supervision, W.X.; Visualization, M.U.; Writing—original draft, M.A.; Writing—review and editing, M.Y. and M.U.

Funding

This research received no external funding

Conflicts of Interest

The authors declare no conflict of interest.

References

  1. Memon, M.S.; Guo, J.; Tagar, A.A.; Perveen, N.; Ji, C.; Memon, S.A.; Memon, N. The Effects of Tillage and Straw Incorporation on Soil Organic Carbon Status, Rice Crop Productivity, and Sustainability in the Rice-Wheat Cropping System of Eastern China. Sustainability 2018, 10, 961. [Google Scholar] [CrossRef]
  2. Li, X.; Lu, W.; Hu, G.; Wang, X.C.; Zhang, Y.; Sun, G.X.; Fang, Z. Effects of light-emitting diode supplementary lighting on the winter growth of greenhouse plants in the Yangtze River Delta of China. Bot. Stud. 2016, 57. [Google Scholar] [CrossRef] [PubMed]
  3. Rosenthal, E. Rootzone Temperature. Available online: https://www.cannabisculture.com/content/2002/08/02/2565/ (accessed on 12 April 2018).
  4. Ingram, D.L.; Basford, B.H.; Foster, W.H.; Ramcharan, C. Electronically controlled root heating tubes. Hortscience 1990, 25, 693–694. [Google Scholar]
  5. Chris, P. Is Root Zone Heating Really Necessary? Available online: https://www.maximumyield.com/is-root-zone-heating-really-necessary-part-one-the-basics/2/922 (accessed on 14 July 2018).
  6. Abd El Rahman, A.A.; Kuiper, P.J.C.; Bierhuizen, J.F. Preliminary Observations on the Effect of Soil Temperature on Transpiration and Growth of Young Tomato Plants under Controlled Conditions; Mededelingen Van de Landb Hoogesch: Wageningen, The Netherlands, 1959. [Google Scholar]
  7. Jenkins, B.M.; Sachs, P.M.; Forister, G.W.; Sisto, I. Thermal Response of Greenhouses under Bench and Perimeter Heating; ASAE Paper 89-4038; ASAE: St. Joseph, MI, USA, 1989. [Google Scholar]
  8. Christenbury, G.D. Energy Management with Root-Zone Heating; The University of Georgia: Athens, GA, USA, 1990. [Google Scholar]
  9. Richards, S.J.; Hagan, R.M.; McCalla, T.M. Soil Temperature and Plant Growth. Agronomy 1952, 2, 303–481. [Google Scholar]
  10. McAvoy, R.J.; Janes, H.W. The effects of root zone heating in conjunction with standard and cool night conditions on the growth of chrysanthemums. In Acta Horticulturae; International Society for Horticultural Science (ISHS): Leuven, Belgium, 1984; pp. 843–852. [Google Scholar]
  11. Moorby, J.; Graves, C.J. Root and air temperature effects on growth and yield of tomatoes and lettuce. In Acta Horticulturae; International Society for Horticultural Science (ISHS): Leuven, Belgium, 1980; pp. 29–44. [Google Scholar]
  12. Went, F.W. Plant Growth under Controlled Conditions. II. Thermoperiodicity in Growth and Fruiting of the Tomato. Am. J. Bot. 1944, 31, 135–150. [Google Scholar] [CrossRef]
  13. Diver, S. Root Zone Heating for Greenhouse Crops. Available online: http://ceac.arizona.edu/sites/default/files/diver_-_root_zone_heating.pdf (accessed on 17 June 2018).
  14. Falah, M.A.F.; Wajima, T.; Yasutake, D.; Sago, Y.; Kitano, M. Responses of root uptake to high temperature of tomato plants (Lycopersicon esculentum Mill.) in soil-less culture. Int. J. Agric. Technol. 2010, 48, 543–558. [Google Scholar]
  15. Jaworski, C.A.; Valli, V.J. Tomato Seed Germination and Plant Growth in Relation to Soil Temperatures and Phosphorus Levels. Fla. State Hortic. Soc. 1964, 77, 177–183. [Google Scholar]
  16. Fujishige, N.; Sugiyama, T. Effect of soil temperature on growth of seedlings of a few fruit vegetables (a preliminary report). J. Jpn. Soc. Hortic. Sci. 1968, 37, 221–226. [Google Scholar] [CrossRef]
  17. ICIS Propylene. Available online: https://www.icis.com/chemicals/propylene (accessed on 4 August 2017).
  18. Avci, H.; Özdemir, A. Sustainable Approach to Produce Polyurethane Composite Foams with Natural Materials. Celal Bayar Üniv. Fen Bilim. Derg. 2017, 13, 887–892. [Google Scholar] [CrossRef]
  19. Van Os, E.A. Closed soilless growing systems: A sustainable solution for Dutch greenhouse horticulture. In Water Science and Technology; Elsevier Science Ltd.: Pergamon, Turkey; Kidlington, UK; Oxford, UK, 1999; Volume 39, pp. 105–112. [Google Scholar]
  20. National Geographic. Greendex: Consumer Choice and the Environment a Worldwide Tracking Survey Report. Toronto, Canada, 2014; pp. 1–20. Available online: https://globescan.com/wp-content/uploads/2017/07/Greendex_2014_Highlights_Report_NationalGeographic_GlobeScan.pdf (accessed on 3 January 2018).
  21. Bragg, N. A Review of Peat Reserves and Peat Usage in Horticulture and Alternative Materials; Report; The Horticultural Development Company (HDC): Petersfield, UK, 1990. [Google Scholar]
  22. Professional Plastics. Thermal Expansion Properties of Plastic Materials. Available online: https://www.professionalplastics.com/professionalplastics/ThermalPropertiesofPlasticMaterials.pdf (accessed on 5 August 2017).
  23. Co, E.; Kyoto, E. Thermal Insulation Materials Polyurethane (PUR) and Polyisocyanurate (PIR) Foam. Available online: http://www.react-ite.eu/uploads/tx_mddownloadbox/PP02_Thermal_insulation_materials_-_PP02_20130715.pdf (accessed on 28 July 2017).
  24. Joe Davids Cocopeat Profile Test. Available online: http://www.cocopeat.com.au/technical/productAnalysis/pdf/TechnicalAnalysis2001.pdf (accessed on 12 August 2017).
  25. Nield, D.A.; Bejan, A. Convection in Porous Media, 4th ed.; John Wiley & Sons Inc.: Hoboken, NJ, USA, 2013; ISBN 9781461455417. [Google Scholar]
  26. Wakao, N.; Kaguei, S.; Funazkri, T. Effect of fluid dispersion coefficients on particle-to-fluid heat transfer coefficients in packed beds. Correlation of nusselt numbers. Chem. Eng. Sci. 1979, 34, 325–336. [Google Scholar] [CrossRef]
  27. Bear, J.; Bachmat, Y. Introduction to Modeling of Transport Phenomena in Porous Media, 1st ed.; Springer: Dordrecht, The Netherlands, 1990; ISBN 978-0-7923-1106-5. [Google Scholar]
  28. Minkowycz, W.J.; Haji-Sheikh, A.; Vafai, K. On departure from local thermal equilibrium in porous media due to a rapidly changing heat source: The Sparrow number. Int. J. Heat Mass Transf. 1999, 42, 3373–3385. [Google Scholar] [CrossRef]
  29. Amiri, A.; Vafai, K. Transient analysis of incompressible flow through a packed bed. Int. J. Heat Mass Transf. 1998, 41, 4259–4279. [Google Scholar] [CrossRef]
  30. Carbonell, R.G.; Whitaker, S. Heat and Mass Transfer in Porous Media BT. In Fundamentals of Transport Phenomena in Porous Media; Bear, J., Corapcioglu, M.Y., Eds.; Springer: Dordrecht, The Netherlands, 1984; pp. 121–198. ISBN 978-94-009-6175-3. [Google Scholar]
  31. Jury, W.A.; Gardner, W.R.; Gardner, W.H. Soil Physics, 5th ed.; John Wiley & Sons Inc.: Hoboken, NJ, USA, 1991. [Google Scholar]
  32. DeVries, D.A. Thermal Properties of Soils. In Physics of Plant Environment; van Wijk, W.R., Ed.; John Wiley & Sons Inc.: New York, NY, USA, 1963. [Google Scholar]
  33. Campbell, G.S.; Jungbauer, J.D.; Bidlake, W.R.; Hungerford, R.D. Predicting the effect of temperature on soil thermal conductivity. Soil Sci. 1994, 158, 307–313. [Google Scholar] [CrossRef]
  34. Bazgaou, A.; Fatnassi, H.; Bouhroud, R.; Gourdo, L.; Ezzaeri, K.; Tiskatine, R.; Demrati, H.; Wifaya, A.; Bekkaoui, A.; Aharoune, A.; et al. An experimental study on the effect of a rock-bed heating system on the microclimate and the crop development under canarian greenhouse. Sol. Energy 2018, 176, 42–50. [Google Scholar] [CrossRef]
  35. Fabrizio, E. Energy reduction measures in agricultural greenhouses heating: Envelope, systems and solar energy collection. Energy Build. 2012, 53, 57–63. [Google Scholar] [CrossRef]
  36. Cuce, E.; Harjunowibowo, D.; Mert, P. Renewable and sustainable energy saving strategies for greenhouse systems: A comprehensive review. Renew. Sustain. Energy Rev. 2016, 64, 34–59. [Google Scholar] [CrossRef]
  37. Soltani, M.; Kashkooli, F.M.; Kazemi, A.R.; Bordbar, N.; Farshchi, M.J.; Elmi, M.; Gharali, K.; Dusseault, M.B. A comprehensive study of geothermal heating and cooling systems. Sustain. Cities Soc. 2018. [Google Scholar] [CrossRef]
  38. Hassanien, R.H.E.; Li, M.; Tang, Y. The evacuated tube solar collector assisted heat pump for heating greenhouses. Energy Build. 2018, 169, 305–318. [Google Scholar] [CrossRef]
  39. Xu, J.; Li, Y.; Wang, R.Z.; Liu, W. Performance investigation of a solar heating system with underground seasonal energy storage for greenhouse application. Energy 2014, 67, 63–73. [Google Scholar] [CrossRef]
  40. Joudi, K.A.; Farhan, A.A. Greenhouse heating by solar air heaters on the roof. Renew. Energy 2014, 72, 406–414. [Google Scholar] [CrossRef]
  41. Gonzalez-Fuentes, J.A.; Shackel, K.; Heinrich Lieth, J.; Albornoz, F.; Benavides-Mendoza, A.; Evans, R.Y. Diurnal root zone temperature variations affect strawberry water relations, growth, and fruit quality. Sci. Hortic. 2016, 203, 169–177. [Google Scholar] [CrossRef]
  42. Abdel-Mawgoud, A.M.R.; Sassine, Y.N.; El-Behairy, U.A.; Abou-Hadid, A.F.; El-Abd, S.O. Effect of Minimum Root-zone Temperature on the Growth and Production of Greenhouse Sweet Pepper. J. Appl. Sci. Res. 2005, 1, 72–77. [Google Scholar]
  43. Sakamoto, M.; Suzuki, T. Effect of Root-Zone Temperature on Growth and Quality of Hydroponically Grown Red Leaf Lettuce (Lactuca sativa L. cv. Red Wave). Am. J. Plant Sci. 2015, 6, 2350–2360. [Google Scholar] [CrossRef]
  44. Olberg, M.W.; Lopez, R.G. Growth and development of poinsettia (Euphorbia pulcherrima) finished under reduced air temperature and bench-top root-zone heating. Sci. Hortic. 2016, 210, 197–204. [Google Scholar] [CrossRef]
  45. Tachibana, S. Effect of Root Temperature on the Rate of Water and Nutrient Absorption in Cucumber Cultivars and Figleaf Gourds. Notes Queries 1987, s11-II, 309. [Google Scholar] [CrossRef]
Figure 1. Components of the root zone heating system. Note: (A) inner pot, (B) outer pot, (C) insulation layer, (D) heating pads, (E) growing medium, (F) root zone, (G) prepared pot, (H) control system.
Sustainability 10 04130 g001
Figure 2. Hourly conductive heat transfer illustration of root zone heating for 6 h. Note: (A) before heating, (B) after 1 h of heating, (C) after 2 h of heating, (D) after 3 h of heating, (E) after 4 h of heating, (F) after 5 h of heating, (G) after 6 h of heating.
Sustainability 10 04130 g002
Figure 3. Hourly conductive heat transfer illustration of root zone heating for 6 to 12 h. Note: (A) 7 h, (B) 8 h, (C) 9 h, (D) 10 h, (E) 11 h, (F) 12 h.
Sustainability 10 04130 g003
Figure 4. Surface conductive heat transfer illustration of root zone heating for 6 h. Note: (A) before heating, (B) after 1 h of heating, (C) after 2 h of heating, (D) after 3 h of heating, (E) after 4 h of heating, (F) after 5 h of heating, (G) after 6 h of heating.
Sustainability 10 04130 g004
Figure 5. Surface heat transfer illustration of root zone heating for 7 to 12 h. Note (A) 7 h (B) 8 h, (C) 9 h, (D) 10 h, (E) 11 h, (F) 12 h.
Sustainability 10 04130 g005
Figure 6. Hourly root zone temperature over five days: a comparison of simulation and experimental readings.
Sustainability 10 04130 g006
Figure 7. Comparison of ambient greenhouse temperature and the root zone temperature (RZT) of non-heated pots.
Sustainability 10 04130 g007
Figure 8. Hourly power consumption comparison of simulation and experimental methods.
Sustainability 10 04130 g008
Table 1. Thermal and physical properties of polypropylene plastic pots [22].
Sr. NoTypeUnitInner PotOuter Pot
1Lower working temperature°C−60−60
2Specific heat capacityJ/kg K19261926
3Densitykg/m3946946
4Thermal conductivityW/m K0.150.15
5Upper working temperature°C19–12019–120
6Upper lengthcm2635
7Downside lengthcm1724
8Upper widthcm2635
9Downside widthcm1724
10Heightcm2634
11Thicknessmm22
Table 2. Thermal and physical properties of polyurethane foam insulation [23].
Sr. NoTypeUnitValue
1Thermal conductivityW/m K0.039
2Specific heat capacityJ/kg K1400
3Densitykg/m37.5
4Thicknesscm4
5Top Lengthcm34
6Top widthcm34
7Bottom lengthcm23
8Bottom withcm23
9Heightcm26
Table 3. Thermal and physical properties of coco peat [24].
Sr. NoDescriptionUnitValue
1Densitykg/m31100
2Specific heat capacityJ/kg K4.02
3Electrical conductivityds/m0.56
4Air-filled porosity%20.26
5Water-holding capacity%58.4
6pH-5.8
Table 4. Silicone rubber electric heating pads features.
Sr. NoDescriptionUnitsValue
1Maximum temperature°C250
2Minimum temperature range°C−60
3Maximum voltageV220
4Lengthcm15
5Widthcm12
6ThicknessMm2
Table 5. Pot model meshing details.
DescriptionValue
Minimum section quality0.001232
Average section quality0.6684
Tetrahedron190,498
Triangle19,962
Edge element1808
Vertex element72

