Multi-Criteria Evaluation Framework in Selection of Accelerated Bridge Construction (ABC) Method
Abstract
:1. Introduction
2. Literature Review
3. Methodology
3.1. Construction Costs
3.2. Other Agency Costs
3.3. User Costs
3.4. TOPSIS Approach to the Accelerated Bridge Construction (ABC) Decision
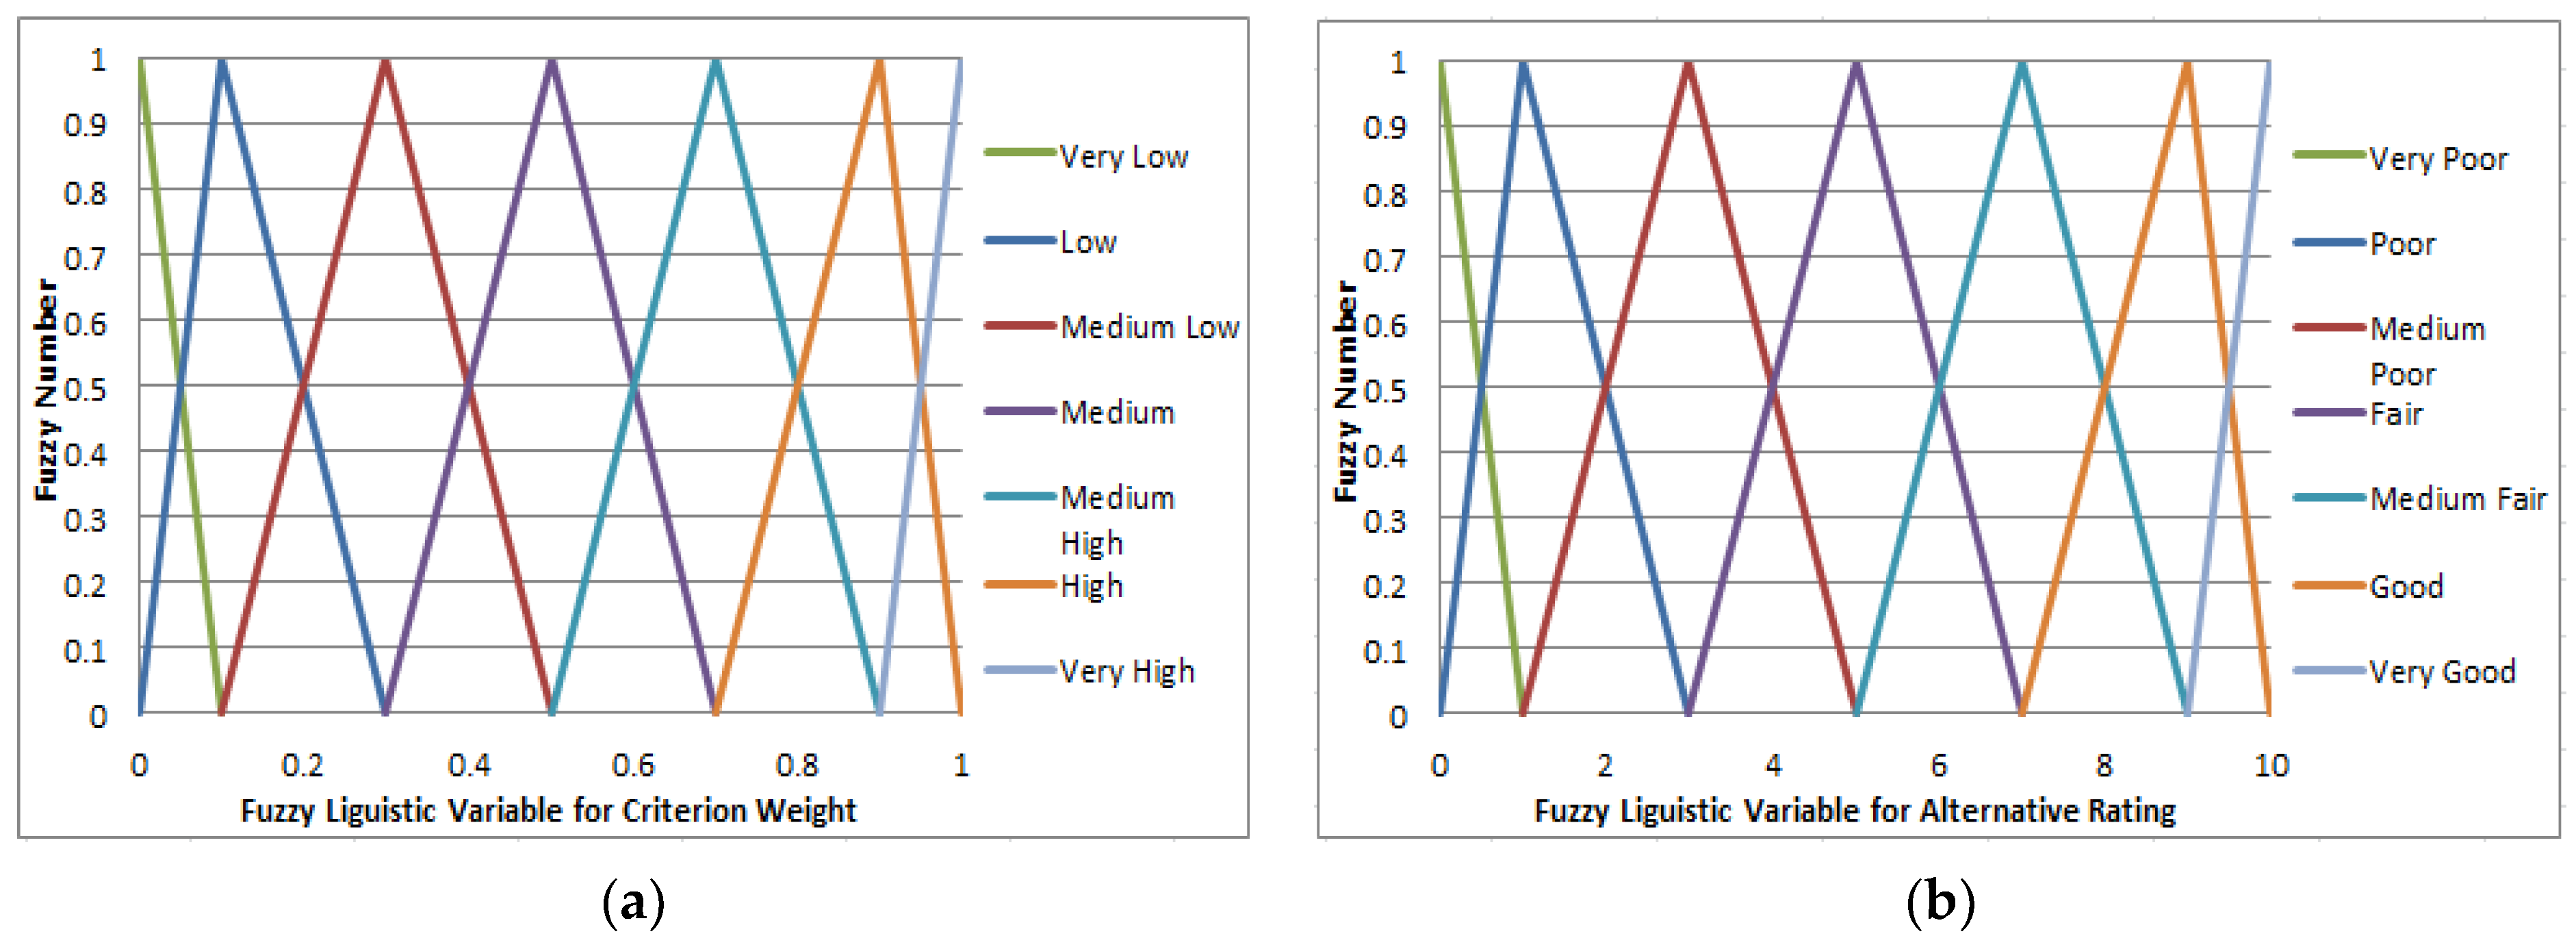
- Step 1: Construct a decision matrix. Assume there are m alternatives to be assessed with n criteria . The decision group has K members. Let to present the fuzzy importance weight of criterion assessed by the kth decision maker; let to present the rating of the with respect to criterion evaluated by kth decision maker. The decision matrix can be expressed as,where, and are linguistic variables. These linguistic variables can be described by triangular fuzzy numbers.
- Step 2: Calculate the integrated weight for criteria and the aggregated fuzzy rating of Alternative under criteria .where, and represent the fuzzy triangular number.
- Step 3: Normalize the fuzzy decision matrix . Let B denote the set of benefit criteria, while C is the set of cost criteria.
- Step 4: Construct the weight normalized fuzzy decision matrix . is the normalized fuzzy number and belongs to [0, 1].
- Step 5: Calculate the distance to fuzzy positive ideal solution (FPIS) and fuzzy negative ideal solution (FNIS). Compute the closeness coefficient (CC) of each alternative.where, and .
4. Case Study
- ABC method. ABC method requires I-4 to close one outside lane from 21:00 to 24:00 for only four nights. This schedule was obtained based on project documents.
- Conventional method I (Con I). Conventional method I requires I-4 to close two outside lanes from 21:00 to 24:00 for 48 nights. This schedule is a hypothetical schedule used in this study for further illustration of the methodology. The construction cost of Con I is assumed to be 15% higher than conventional method II, described below.
- Conventional method II (Con II). Conventional method II requires I-4 to close all the lanes from 21:00 to 24:00 for 32 nights. This is a schedule obtained from the project documentation.
4.1. Return-On Investment Analysis
4.2. Fuzzy TOPSIS Analysis
5. Conclusions
Author Contributions
Funding
Acknowledgments
Conflicts of Interest
References
- Federal Highway Administration (FHWA). 2013 Status of the Nation’s Highways, Bridges, and Transit: Conditions & Performance; In Report to Congress; FHWA: Washington, DC, USA, 2013.
- Federal Highway Administration (FHWA). Accelerated Bridge Construction: Changing How America Builds Infrastructure; Structure Magazine; FHWA: Washington, DC, USA, 2012.
- National Research Council. Innovative Bridge Designs for Rapid Renewal: ABC Toolkit; Transportation Research Board: Washington, DC, USA, 2013. [Google Scholar]
- Salem, S.; Richard, A.M. Accelerated Construction Decision-Making Process for Bridges; No. MRUTC 05-04; Midwestern Regional University Transportation Center, College of Engineering, Department of Civil and Environmental Engineering, University of Wisconsin: Madison, WI, USA, 2006. [Google Scholar]
- Tang, B. Framework for prefabricated bridge elements and systems (PBES) decision-making. In Proceedings of the Second US-Taiwan Bridge Engineering Workshop, San Mateo, CA, USA, 21–22 September 2006. [Google Scholar]
- Kendall, A.; Keoleian, G.A.; Helfand, G.E. Integrated life-cycle assessment and life-cycle cost analysis model for concrete bridge deck applications. J. Infrastruct. Syst. 2008, 14, 214–222. [Google Scholar] [CrossRef]
- Safi, M. Life-Cycle Costing: Applications and Implementations in Bridge Investment and Management. Ph.D. Thesis, KTH Royal Institute of Technology, Stockholm, Sweden, 2013. [Google Scholar]
- de Lurdes Antunes, M.; Marecos, V.; Neves, J.; Morgado, J. Decision to Paving Solutions in Road Infrastructures Based on Life-Cycle Assessment. Balt. J. Road Bridge Eng. 2016, 11, 43–52. [Google Scholar] [CrossRef]
- Keshavarz-Ghorabaee, M.; Amiri, M.; Zavadskas, E.K.; Turskis, Z.; Antuchevičienė, J. Ranking of Bridge Design Alternatives: A. TOPSIS-FADR Method. Balt. J. Road Bridge Eng. 2018, 13, 209–237. [Google Scholar] [CrossRef]
- Youssef, M.A.; Anumba, C.J.; Thorpe, T. Intelligent selection of concrete bridge construction methods in Egypt. Comput. Civ. Eng. 2005, 1–14. [Google Scholar] [CrossRef]
- Wang, Z.Z.; Fan, L.C.; Hastak, M. Multi-Criteria Optimization of Bridge Management. Adv. Mater. Research. 2011, 255, 4080–4084. [Google Scholar] [CrossRef]
- Salem, O.M.; Miller, R.A.; Deshpande, A.S.; Arurkar, T.P. Multi-criteria decision-making system for selecting an effective plan for bridge rehabilitation. Struct. Infrastruct. Eng. 2013, 9, 806–816. [Google Scholar] [CrossRef]
- Rashidi, M.; Samali, B.; Sharafi, P. A new model for bridge management: Part B: Decision support system for remediation planning. Aust. J. Civ. Eng. 2016, 14, 46–53. [Google Scholar] [CrossRef]
- Yadollahi, M.; Ansari, R.; Abd Majid, M.Z.; Yih, C.H. A multi-criteria analysis for bridge sustainability assessment: A case study of Penang Second Bridge, Malaysia. Struct. Infrastruct. Eng. 2015, 11, 638–654. [Google Scholar] [CrossRef]
- Wang, Y.M.; Liu, J.; Elhag, T.M. An integrated AHP–DEA methodology for bridge risk assessment. Comput. Ind. Eng. 2008, 54, 513–525. [Google Scholar] [CrossRef]
- Aghdaie, M.H.; Hashemkhani Zolfani, S.; Zavadskas, E.K. Prioritizing constructing projects of municipalities based on AHP and COPRAS-G: A case study about footbridges in Iran. Balt. J. Road Bridge Eng. 2012, 7, 145–153. [Google Scholar] [CrossRef]
- Bitarafan, M.; Zolfani, S.H.; Arefi, S.L.; Zavadskas, E.K.; Mahmoudzadeh, A. Evaluation of Real-time Intelligent Sensors for Structural Health Monitoring of Bridges Based on SWARA-WASPAS; A. Case in IRAN. Balt. J. Road Bridge Eng. 2014, 9, 333–340. [Google Scholar] [CrossRef]
- Ardeshir, A.; Mohseni, N.; Behzadian, K.; Errington, M. Selection of a bridge construction site using fuzzy analytical hierarchy process in geographic information system. Arabian J. Sci. Eng. 2014, 39, 4405–4420. [Google Scholar] [CrossRef]
- Pan, N.F. Fuzzy AHP approach for selecting the suitable bridge construction method. Autom. Constr. 2008, 17, 958–965. [Google Scholar] [CrossRef]
- Hwang, C.L.; Yoon, K. Methods for multiple attribute decision making. In Multiple Attribute Decision Making; Springer: Berlin, Germany, 1981; pp. 58–191. [Google Scholar]
- Zavadskas, E.K.; Mardani, A.; Turskis, Z.; Jusoh, A.; Nor, K.M. Development of TOPSIS method to solve complicated decision-making problems—An overview on developments from 2000 to 2015. Int. J. Inf. Technol. Decis. Mak. 2016, 15, 645–682. [Google Scholar] [CrossRef]
- Kannan, D.; de Sousa Jabbour, A.B.; Jabbour, C.J. Selecting green suppliers based on GSCM practices: Using fuzzy TOPSIS applied to a Brazilian electronics company. Eur. J. Oper. Res. 2014, 233, 432–447. [Google Scholar] [CrossRef]
- Guo, S.; Zhao, H. Optimal site selection of electric vehicle charging station by using fuzzy TOPSIS based on sustainability perspective. Appl. Energy. 2015, 158, 390–402. [Google Scholar] [CrossRef]
- Selim, H.; Yunusoglu, M.G.; Yılmaz Balaman, Ş. A dynamic maintenance planning framework based on fuzzy TOPSIS and FMEA: Application in an international food company. Qual. Reliab. Eng. Int. 2016, 32, 795–804. [Google Scholar] [CrossRef]
- Wang, Y.M.; Elhag, T.M. Fuzzy TOPSIS method based on alpha level sets with an application to bridge risk assessment. Expert Syst. Appl. 2006, 31, 309–319. [Google Scholar] [CrossRef]
- Taylan, O.; Bafail, A.O.; Abdulaal, R.M.; Kabli, M.R. Construction projects selection and risk assessment by fuzzy AHP and fuzzy TOPSIS methodologies. Appl. Soft Comput. 2014, 17, 105–116. [Google Scholar] [CrossRef]
- Chaphalkar, N.B.; Shirke, P.P. Application of multi-criteria decision making techniques for bridge construction. Int. J. Innov. Res. Sci. Eng. Technol. 2013, 2, 3617–3626. [Google Scholar]
- Rsmeans Data. Available online: https://www.rsmeans.com/ (accessed on 26 October 2017).
- Mallela, J.; Sadavisam, S. Work Zone Road User Costs: Concepts and Applications; US Department of Transportation, Federal Highway Administration: Washington, DC, USA, 2011.
- Hardy, M.; Wunderlich, K.E. Traffic Analysis Toolbox Volume VIII: Work Zone Modeling and Simulation—A Guide for Decision-Makers; No. FHWA-HOP-08-029; Federal Highway Administration: Washington, DC, USA, 2008.
- Texas Transportation Institute (TTI). Q-DAT Lane Closure Analysis Tool-Operation Instructions; Texas Transportation Institute: College Station, TX, USA, 2010. [Google Scholar]
- Mitretek, Quickzone Delay Estimation Program-User Guide; Federal Highway Administration: Washington, DC, USA, 2000.
- Transportation Research Board National Research Council. Highway Capacity Manual, 6th ed.; TRB Business Office: Washington, DC, USA, 2016. [Google Scholar]
- Pesesky, L.; Ismart, D.; Matherly, D.; Huffman, C.; Chiu, Y.C.; Zheng, H.; Nava, E.; Dixit, V.; Wolshon, B.; Radwan, E.; et al. Strategic Approaches at the Corridor and Network Level to Minimize Disruption from the Renewal Process; [Supporting Datasets]. No. SHRP 2 Report S2-R11-RW-1; United States, National Transportation Library [Distributor]: Washington, DC, USA, 2017. [Google Scholar]
- Jia, J.M.; Ibrahim, M.; Hadi, M.; Orabi, W.; Ali, M.; Xiao, Y. Estimation of the Total Cost of Bridge Construction for Use in Accelerated Bridge Construction Selection Decisions. In Proceedings of the Transportation Research Board 95th Annual Meeting, Washington, DC, USA, 10–14 January 2016; p. 17. [Google Scholar]
- Vandervalk, A.; Louch, H.; Guerre, J.; Margiotta, R. Incorporating Reliability Performance Measures into the Transportation Planning and Programming Processes: Technical Reference; No. SHRP 2 Report S2-L05-RR-3; Transportation Research Board: Washington, DC, USA, 2014. [Google Scholar]
- National Research Council. Analytical Procedures for Determining the Impacts of Reliability Mitigation Strategies; Transportation Research Board: Washington, DC, USA, 2013. [Google Scholar]
- Potts, I.B.; Harwood, D.W.; Hutton, J.M.; Fees, C.A.; Bauer, K.M.; Lucas, L.M.; Kinzel, C.S.; Frazier, R.J. Identification and Evaluation of the Cost-Effectiveness of Highway Design Features to Reduce Nonrecurrent Congestion; Transportation Research Board: Washington, DC, USA, 2014. [Google Scholar]
- Mahmassani, H.S.; Kim, J.; Chen, Y.; Stogios, Y.; Brijmohan, A.; Vovsha, P. Incorporating Reliability Performance Measures into Operations and Planning Modeling Tools; Transportation Research Board: Washington, DC, USA, 2014. [Google Scholar]
- Hadi, M.; Xiao, Y.; Ozen, H.; Alvarez, P. Evaluation Tools to Support ITS Planning Process: Development of a Sketch Planning Tool in FSUTMS/Cube Environment; Florida Department of Transportation: Tallahassee, FL, USA, 2008.
- National Research Council (US). Highway Safety Manual; American Association of State Highway and Transportation Officials (AASHTO): Washington, DC, USA, 2010; Volume 1. [Google Scholar]
- EPA. Motor Vehicle Emission Simulator (MOVES) User Guide; US Environmental Protection Agency: Washington, DC, USA, 2010.
- National Cooperative Highway Research Program (NCHRP). Capacity Models for Freeways/Multilane Highways, Urban Street, and Two-Lane Highways; NCHRP Project 03-107; Transportation Research Board: Washington, DC, USA, 2014. [Google Scholar]


| Independent Variable | Importance |
|---|---|
| AADT | 100.0% |
| Number of Span | 99.2% |
| Type | 59.4% |
| Location | 35.3% |
| AADT Categorical Value | AADT Range |
|---|---|
| 0 | 0 to 1000 |
| 1 | 1001 to 5000 |
| 2 | 5001 to 10,000 |
| 3 | 10,001 to 20,000 |
| 4 | 20,001 to 50,000 |
| 5 | 50,001 to 100,000 |
| 6 | 100,001 to 200,000 |
| 7 | More than 200,001 |
| Category | 1 | 2 | 3 | 4 | 5 | 6 | 7 | 8 | 9 | 10 |
| Range ($/ft2) | 0–100 | 101–200 | 201–300 | 301–400 | 401–500 | 501–600 | 601–700 | 701–800 | 801–900 | 901–1000 |
| Criteria | Expert1 | Expert2 | Expert3 | Expert4 |
|---|---|---|---|---|
| C1: Mobility | H | VH | VH | H |
| C2: Reliability | H | VH | MH | ML |
| C3: Safety | VH | VH | H | H |
| C4: Emission | M | MH | MH | L |
| C5: Construction Costs | VH | H | H | VH |
| Rating | Expert | Mobility Impacts | Reliability Impacts | Safety Impacts | Emission Impacts | Construction Costs |
|---|---|---|---|---|---|---|
| VP | Expert1 Expert2 Expert3 Expert4 | Equal or higher Equal or higher 10% lower 10% higher | Equal or higher Equal or higher 10% lower 10% higher | Equal or higher Equal or higher 10% lower 10% higher | Equal or higher Equal or higher 10% lower 10% higher | 100% higher 10% higher 50% higher 30% higher |
| P | Expert1 Expert2 Expert3 Expert4 | 10~30% lower 0~10% lower 10~20% lower 0~10% higher | 10~30% lower 0~10% lower 10~20% lower 0~10% higher | 10~30% lower 0~10% lower 10~20% lower 0~10% higher | 10~30% lower 0~10% lower 10~20% lower 0~10% higher | 75~100% higher 5~10% higher 40~50% higher 25~30% higher |
| MP | Expert1 Expert2 Expert3 Expert4 | 30~45% lower 10~15% lower 20~35% lower 0~15% lower | 30~45% lower 10~15% lower 20~35% lower 0~15% lower | 30~45% lower 10~15% lower 20~35% lower 0~15% lower | 30~45% lower 10~15% lower 20~35% lower 0~15% lower | 50~75% higher 0~5% higher 35~40% higher 20~25% higher |
| F | Expert1 Expert2 Expert3 Expert4 | 45~60% lower 15~20% lower 35~50% lower 15~30% lower | 45~60% lower 15~20% lower 35~50% lower 15~30% lower | 45~60% lower 15~20% lower 35~50% lower 15~30% lower | 45~60% lower 15~20% lower 35~50% lower 15~30% lower | 30~50% higher Equal 30~35% higher 15~20% higher |
| MF | Expert1 Expert2 Expert3 Expert4 | 60~80% lower 20~30% lower 50~65% lower 30~45% lower | 60~80% lower 20~30% lower 50~65% lower 30~45% lower | 60~80% lower 20~30% lower 50~65% lower 30~45% lower | 60~80% lower 20~30% lower 50~65% lower 30~45% lower | 20~30% higher 0~5% lower 20~30% higher 10~15% higher |
| G | Expert1 Expert2 Expert3 Expert4 | 80~95% lower 30~40% lower 65~80% lower 45~60% lower | 80~95% lower 30~40% lower 65~80% lower 45~60% lower | 80~95% lower 30~40% lower 65~80% lower 45~60% lower | 80~95% lower 30~40% lower 65~80% lower 45~60% lower | Equal 5~10% lower 10~20% higher 5~10% higher |
| VG | Expert1 Expert2 Expert3 Expert4 | 95% lower 40% lower 80% lower 60% lower | 95% lower 40% lower 80% lower 60% lower | 95% lower 40% lower 80% lower 60% lower | 95% lower 40% lower 80% lower 60% lower | 0~20% lower 10% lower 10% higher 5% higher |
| Segment | No. of Lanes | Length (Miles) | Free Flow Speed (mph) |
|---|---|---|---|
| I-4-work zone | 6 lanes | 3.11 | 60 |
| Detour for I-4 | 4 lanes | 4.32 | 30 |
| Graves Ave | 2 lanes | 0.83 | 45 |
| Detour for Graves | 2 lanes | 1.91 | 30 |
| Costs in Dollar Value ($) | Mobility Impact | Reliability Impact | Safety Impact | Emission Impact | Construction | Construction Agency Costs | Total Cost | |
|---|---|---|---|---|---|---|---|---|
| C = 1000 veh/hr/lane | ABC | 120,347 | 32,807 | 40,864 | 1615 | 430,000 | 53,320 | 678,953 |
| Con I | 224,591 | 258,414 | 77,313 | 2274 | 342,125 | 46,529 | 951,246 | |
| Con II | 487,838 | 258,580 | 127,434 | 3102 | 297,500 | 40,460 | 1,214,914 | |
| C = 1136 veh/hr/lane | ABC | 120,347 | 32,489 | 40,864 | 1615 | 430,000 | 53,320 | 678,635 |
| Con I | 191,339 | 202,851 | 77,207 | 2425 | 342,125 | 46,529 | 862,476 | |
| Con II | 487,838 | 258,580 | 127,434 | 3102 | 297,500 | 40,460 | 1,214,914 | |
| C = 1264 veh/hr/lane | ABC | 120,347 | 32,311 | 40,864 | 1615 | 430,000 | 53,320 | 678,457 |
| Con I | 183,026 | 73,715 | 77,207 | 2499 | 342,125 | 46,529 | 725,101 | |
| Con II | 487,838 | 258,580 | 127,434 | 3102 | 297,500 | 40,460 | 1,214,914 | |
| Alternatives | Mobility Impacts (in veh-hr) | Reliability Impacts (in veh-hr) | Emission Impacts (in Ton) | Safety Impacts (Crashes) | Construction Costs (Direct Plus Agency) |
|---|---|---|---|---|---|
| ABC | 7338 | 1444 | 2.79 | 0.79 | 483,320 |
| Con I | 11,667 | 9016 | 4.19 | 1.49 | 388,654 |
| Con II | 29,746 | 11,492 | 5.36 | 2.46 | 337,960 |
| Alternatives | Mobility Impacts (in veh-hr) | Reliability Impacts (in veh-hr) | Emission Impacts (in ton) | Safety Impacts (crashes) | Construction Costs (Direct Plus Agency) | |
|---|---|---|---|---|---|---|
| Expert1 | ABC | VG | VG | G | VG | MP |
| Con I | G | MP | MP | F | MF | |
| Con II | P | VP | P | P | VG | |
| Expert2 | ABC | VG | VG | VG | VG | P |
| Con I | G | F | F | F | P | |
| Con II | VP | VP | VP | VP | VG | |
| Expert3 | ABC | VG | G | F | VG | VP |
| Con I | F | MP | VP | MF | MF | |
| Con II | VP | VP | VP | VP | VG | |
| Expert4 | ABC | VG | G | VG | VG | VP |
| Con I | F | F | P | G | F | |
| Con II | VP | VP | VP | VP | VG | |
| Alternatives | D(max) | D(min) | CC |
|---|---|---|---|
| ABC | 3.076 | 6.178 | 0.667 |
| Con I | 5.993 | 3.029 | 0.335 |
| Con II | 7.036 | 1.929 | 0.215 |
© 2018 by the authors. Licensee MDPI, Basel, Switzerland. This article is an open access article distributed under the terms and conditions of the Creative Commons Attribution (CC BY) license (http://creativecommons.org/licenses/by/4.0/).
Share and Cite
Jia, J.; Ibrahim, M.; Hadi, M.; Orabi, W.; Xiao, Y. Multi-Criteria Evaluation Framework in Selection of Accelerated Bridge Construction (ABC) Method. Sustainability 2018, 10, 4059. https://doi.org/10.3390/su10114059
Jia J, Ibrahim M, Hadi M, Orabi W, Xiao Y. Multi-Criteria Evaluation Framework in Selection of Accelerated Bridge Construction (ABC) Method. Sustainability. 2018; 10(11):4059. https://doi.org/10.3390/su10114059
Chicago/Turabian StyleJia, Jianmin, Mohamed Ibrahim, Mohammed Hadi, Wallied Orabi, and Yan Xiao. 2018. "Multi-Criteria Evaluation Framework in Selection of Accelerated Bridge Construction (ABC) Method" Sustainability 10, no. 11: 4059. https://doi.org/10.3390/su10114059
APA StyleJia, J., Ibrahim, M., Hadi, M., Orabi, W., & Xiao, Y. (2018). Multi-Criteria Evaluation Framework in Selection of Accelerated Bridge Construction (ABC) Method. Sustainability, 10(11), 4059. https://doi.org/10.3390/su10114059


