Article

Corporate Hypocrisy: Role of Non-Profit Corporate Foundations in Earnings Management of For-Profit Founder Firms

1
Business School, Hunan University, Changsha 410079, China
2
School of Management, Huazhong University of Science and Technology, Wuhan 430074, China
*
Author to whom correspondence should be addressed.
Sustainability 2018, 10(11), 3991; https://doi.org/10.3390/su10113991
Submission received: 27 September 2018 / Revised: 25 October 2018 / Accepted: 30 October 2018 / Published: 1 November 2018

Abstract

:
The purpose of this study is to examine whether for-profit firms make opportunistic use of their corporate foundations to pursue self-serving earnings objectives in China. Using data on corporate foundations and a sample of firms listed on the A-share market from 2010 to 2016, we first use the propensity score matching method to explore the effect of corporate foundations on earnings management of their founder firms. We find that the overall discretionary accruals of firms with corporate foundations are significantly higher than for those without corporate foundations. Given the ownership property with Chinese characteristics, we further find that the significant difference is driven by privately-owned firms. Then we develop a model of discretionary donation expenditures to measure the magnitude of earnings management associated with corporate foundations. We observe that firms with small profits and consecutive earnings increase record income-increasing discretionary donation expenditures. While firms that record income-decreasing discretionary donation expenditures create earnings reserves that they can use in subsequent periods to report consecutive earnings increases. The results demonstrate that the visibly ethical behavior of establishing corporate foundations does not necessarily represent the consistent embodiment of corporate social responsibility (CSR), but can be regarded as corporate hypocrisy with self-interest embedded in benevolence.

1. Introduction

In recent years, many for-profit firms have been engaged in improving the social and environmental consequences of their activities by implementing a set of CSR initiatives and philanthropic initiatives in particular [1,2]. Corporate foundations designed to act as an intermediate channel for corporate giving come into being as part of these efforts. Firms can support external charitable causes through intermediary corporate foundations or donating directly to public charities [3]. Specifically, as the intermediary organization, corporate foundations promote public welfare and charity by transferring funds from their founder firms to external charitable causes [4]. Their services cover a wide range of social fields including education, health, poverty relief, public security, culture, environment, and animal protection. In China, corporate foundations are growing explosively in number, size, and importance in recent years [5]. According to statistics provided by the China Foundation Center, by December 2016, the total number of corporate foundations reached 768 and their total net assets was about ¥19 billion, which accounts for nearly one-seventh of China’s charitable foundations. However, although corporate foundations have been playing a much more important role in corporate philanthropy, they are still a novelty in China where they were almost non-existent until the Regulations on the Administration of Foundations (RAF) was issued in June 2004 [6].
There has been a series of scandals and misconduct in corporate foundations in China recently and, thus, they have come under attack from critics who suggest that some corporate foundations do not embody the natural expression of corporate philanthropy but become substantial tools of their founder firms to pursue self-interest [7]. For example, the Shanghai Jianguo foundation secretly transfers tens of millions of donated funds back to its founder firm in the form of interest-free loans numerous times over a period of five years. As a type of non-profit organization born from for-profit firms, corporate foundations can be regarded as vessels of the founder firms for three reasons. First, corporate foundations derive most of their income from the founder firms [8]. Second, corporate foundations mainly depend on the founder firms for nonfinancial resource (staff support, management, and knowledge) [9]. Third, corporate foundations always have their founder firms’ executives as members of their boards of directors [10,11]. According to statistics provided by the China Foundation Center, nearly 90% of corporate foundations’ board members come from the founder firms and 65% of them are top-level executives (CEOs, CFOs, and COOs). Consequently, the close ties between founder firms and their corporate foundations represent a major way for the firms to exploit the potential benefits of philanthropy [12].
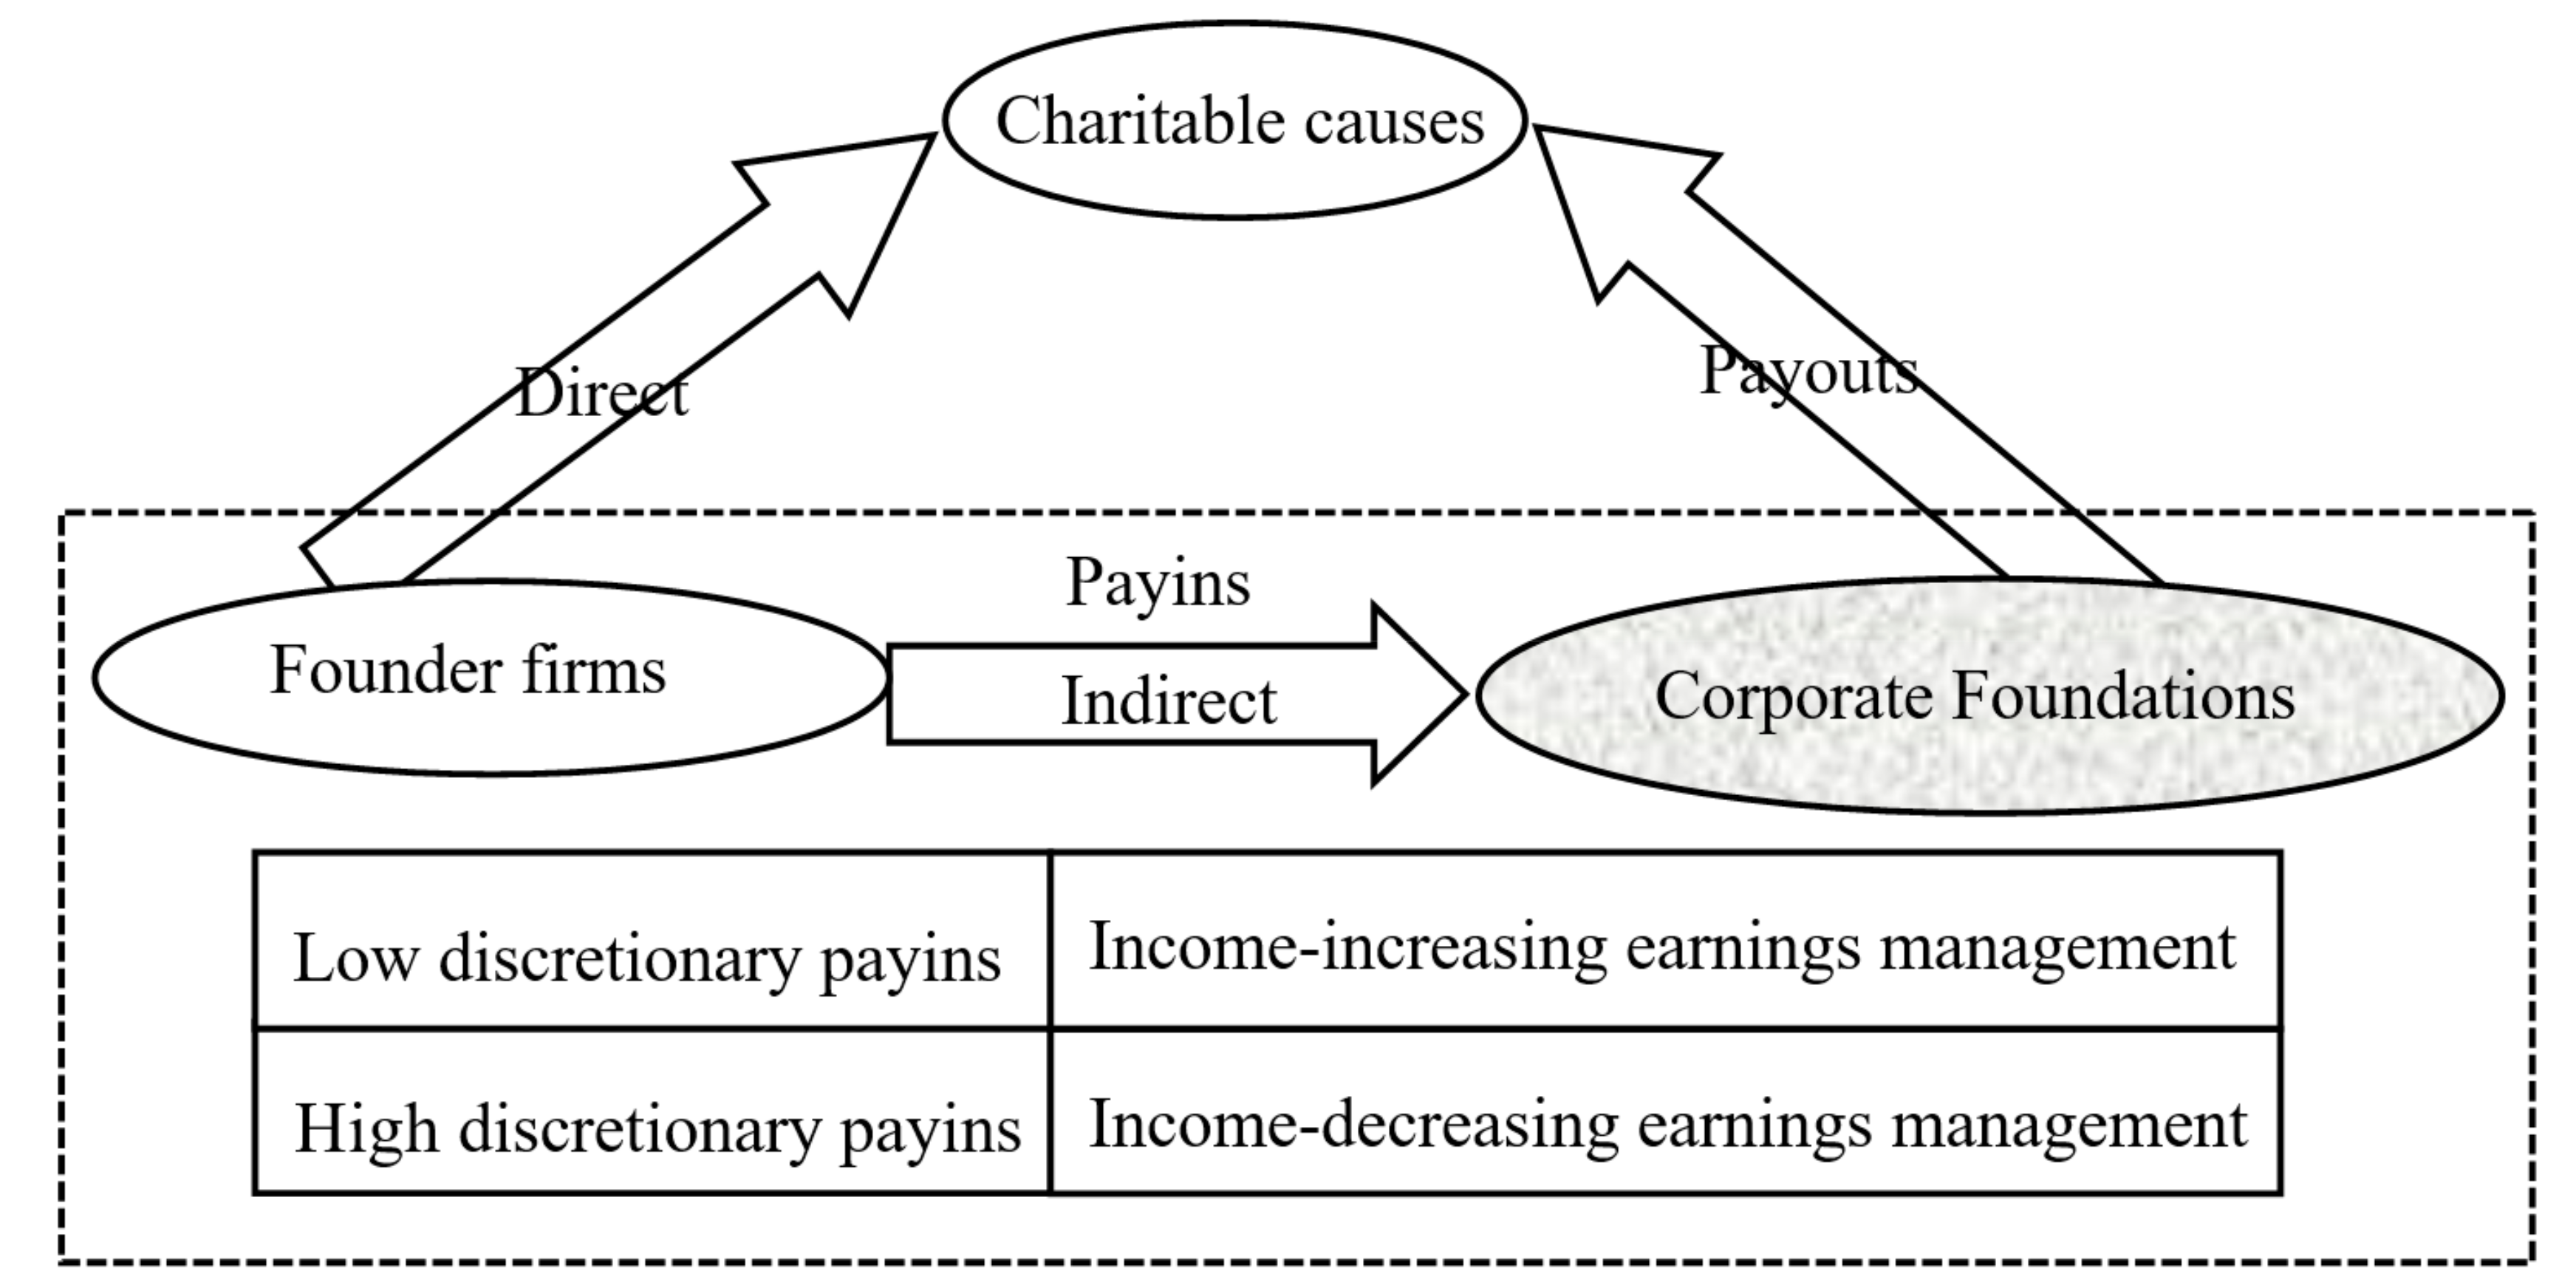
This study clarifies the self-serving earning objectives the firms are searching for with corporate foundations. Specifically, as the intermediate channel to transfer funds, corporate foundations offer an opportunity for their founder firms to exercise discretion to influence reported earnings. The firms first transfer funds to their corporate foundations (called “payins”) and simultaneously record donation expenditures on the income statements. Separately, corporate foundations then make grants and donations to promote public benefit undertakings (called “payouts”). The separation of pay-ins and pay-outs offers an opportunity for the firms to engage in discretionary funding choices to manipulate earnings since they can record donation expenditures on the income statements in any period they choose, which is subject to ensuring that the foundations have enough funds for charitable purposes. Firms can use their corporate foundations strategically to make income-increasing or income-decreasing foundation funding choices to achieve specific earnings targets, which is illustrated in Figure 1.
Although corporate foundations may be a useful earnings management tool, whether firms actually use their corporate foundations to manipulate earnings is still an open question. As a specific expression of corporate philanthropy, corporate foundations embody a significant approach to philanthropic CSR. Ethical, political, and integrative theories of CSR suggest that firms must accept CSR as an ethical obligation and have an incentive to be honest, trustworthy, and ethical in their business processes [13,14]. However, earnings management is the exertion of intentional influence over the process of financial reporting in order to mislead some stakeholders or to influence contractual outcomes and, thus, it is unethical and irresponsible behavior [15]. Literature that is more recent examines the relationship between CSR and earnings management and concludes two opposite views. Some studies relying on ethical, political, and integrative theories of CSR suggest that CSR firms always behave in a responsible manner to restrict earnings management practices [16,17,18,19,20]. While some studies relying on opportunistic use of CSR suggest that CSR can be deemed as managerial perquisite and CSR firms are more likely to engage in earnings management to mislead stakeholders as to the value of the firm and financial performance [21,22,23].
Given the two contrasting views from prior research with mixed implications on the true relation between CSR and earnings management, the question arises for corporate foundations: which viewpoint do they support? Using hand-collected data on Chinese corporate foundations and a sample of firms listed on the A-share market from 2010 to 2016, we first examine the effect of corporate foundations on earnings management of their founder firms. To do so, we employ the econometrics non-parametric propensity score matching method to classify the sample firms into two groups: one subgroup including firms with corporate foundations and the other subgroup including firms without corporate foundations. Then the overall earnings management differences are compared between the two subgroups. Using discretionary accruals as the proxy for overall earnings management level, we find that the discretionary accruals of firms with corporate foundations are significantly higher than for those without corporate foundations. Considering the important role of ownership property in shaping governance of Chinese listed firms, we further investigate the impact of ownership property on the effect of corporate foundations on earnings management. We find that the discretionary accruals are not significantly different within the stated-owned subgroup while they are significantly different within the privately-owned subgroup, which suggests that the difference of discretionary accruals between firms with and without corporate foundations is driven mainly by privately-owned firms.
Furthermore, we explore the specific earnings targets of this type of earnings management associated with corporate foundations. To measure the magnitude of the manipulation of foundation funding choices, we develop a model of discretionary donation expenditures using a research design similar to previous single account approaches. In brief, our findings reveal the following aspects: First, we find founder firms with small profits record lower discretionary donation expenditures than those with small losses. Second, we demonstrate that founder firms with higher stock price sensitivity record lower discretionary donation expenditures than firms with lower stock price sensitivity. Third, we show that founder firms with higher income-decreasing discretionary donation expenditures are more likely to report consecutive earnings increases in subsequent periods. Taken together, the results suggest that firms strategically use their corporate foundations to manipulate earnings in order to avoid losses and decreases in earnings or to create earnings reserves for use in future periods.
This study offers several contributions to the field. First, our study highlights that for-profit firms make opportunistic use of their corporate foundations to pursue self-serving earnings objectives. This is a new and far-reaching addition to the theoretical perspectives to better understand why for-profit firms establish non-profit corporate foundations. To our knowledge and in view of the existing literature, Petrovits [24] is one of very few researchers, if not the only one, to examine the strategic use of corporate foundations to achieve financial reporting objectives among US firms. Our study can continue to provide a healthy supplement to the literature. Unlike Petrovits [24], our primary goal is to explore the potential role of corporate foundations in the earnings management efforts of their founder firms. To do so, we generate a novel empirical strategy that tests alternative theories of corporate foundations by comparing the overall earnings management level of firms with and without corporate foundations. More precisely, we employ the econometrics non-parametric propensity score matching method to investigate the net effect of corporate foundations on overall earnings management of their founder firms. In light of the fact that firms with corporate foundations exhibit a higher level of overall earnings management than those without corporate foundations, we interpret the findings as evidence that corporate foundations can be used as an effective earnings management tool, which is consistent with the argument that contributions transferred to corporate foundations represent an agency problem [11,25,26,27]. To a certain extent, examining the differences in earnings management between firms with and without foundations can yield insights into the nature of corporate foundations and shed light on how corporate foundations extend to earnings management behavior.
Second, our study is important because it is the first to use the context of China, which is the largest emerging market and the second largest economy, to develop an empirically instrumental analysis of corporate foundations. More importantly, there are so many differences between corporate foundations in the U.S. and China that the findings derived from the U.S. may not fit in well with China. China and the U.S. occupy two extremes in terms of the development stage and legal system of corporate foundations. More specifically, as an innovative form of social organization, corporate foundations are a novelty in China where they are almost non-existent until 2005. However, corporate foundations in the U.S. are largely thought of as a twentieth-century phenomenon [28]. In addition, the U.S. has the most advanced governance rules for charitable foundations especially for corporate foundations. However, the fact remains that corporate foundations in China are still an overlooked non-profit organization and, thus, a favorable institutional and legal environment has not been considered to boost their expansion, which results in a specific Chinese-style philanthropy [7]. Not surprisingly, combined with the institutional background with Chinese characteristics, we conclude different and interesting findings. Specifically, considering the impact of ownership property, we find that the manipulation of foundation funding choices is made by privately-owned firms, which is contrary to the conventional belief that state ownership is a major barrier to corporate efficiency. Based on China’s unique stock delisting system, we find that firms with small profits are more likely to engage in income-increasing foundation funding choices to avoid losses, which demonstrates an alternative goal on the opportunistic use of corporate foundations.
Third, our study offers empirical evidence relevant to the current public controversy regarding corporate hypocrisy by examining the role of corporate foundations in the earnings management practices of their founder firms. The findings in our study are consistent with agency problems of the firms in which corporate foundations offer an opportunity for managers to exercise discretion in charitable contributions to pursue self-serving earnings objectives. Thus, we regard as corporate hypocrisy any behavior that establishes corporate foundations for charitable donations but simultaneously uses them to manipulate earnings in order to achieve self-serving objectives. In China’s system of moral values, which has existed for thousands of years, good and evil are absolute opposites. A ‘charitable’ person who seeks to gain spiritual resources and moral respect but simultaneously indulges in deceit and dishonest behavior to pursue self-interest is regarded as a moral hypocrite [29]. Ethical and integrative theories of CSR argue that there is a moral imperative for socially responsible firms to contribute to the good of society by doing what is ethically correct [17] while the manipulation of foundation funding choices is irresponsible and unethical insofar as it conceals dishonest and immoral motivations and has negative consequences for all stakeholders. To a large extent, the opportunistic use of corporate foundations is contrary to the stated ethical standards of philanthropic CSR and, thus, can be regarded as corporate hypocrisy with self-interest embedded in benevolence.
Lastly, our evidence has important implications for policy makers and prudential regulators concerning the governance of corporate foundations and the founder firms in China. Our study summarizes that, as a kind of non-profit social organization, corporate foundations, born from for-profit firms, are a signal of agency problems and can be used as off-balance sheet fund pools to pursue self-serving earnings objectives. The findings offer evidence relevant to the current public debate on the governance of corporate philanthropy and to the regulatory question with respect to full information disclosure of the firms’ direct giving programs and their corporate foundations. On the other hand, the findings also offer evidence relevant to corporate foundations and their governance. As private-sector agents with public objectives, it is important to design a corporate foundation governance system that considers their uniqueness. In addition, evidence from this study can help stakeholders better understand firms’ financial reporting behaviors in light of corporate foundations and differentiate transparent financial information from less reliable information.
The remainder of this paper is organized as follows. In Section 2, we introduce the institutional background, review the extant literature, and develop our research hypotheses. In Section 3, we describe the research sample and provide variable definitions and model specifications. In Section 4, we report the results of descriptive statistics and Pearson correlation analysis and discuss our hypotheses testing and robustness checks. Lastly, we summarize conclusions and offer a discussion of our study.

2. Institutional Background, Literature Review, and Hypotheses Development

2.1. Institutional Background

While the concept of charity towards others is embedded in the Chinese culture and has been practiced throughout Chinese history, charitable foundations, as an innovative form of nonprofit social organization, are still a new phenomenon in China. Historically, charitable foundations were banned from 1949 until 1981 when China established the Chinese Children and Youth Foundation. Under the ideology of strong state political control and strict central planning of the economy, most of the first-established foundations were public foundations funded and managed by the government. The state-dominated charity system limited the ability of charitable foundations to perform some of their philanthropic functions [6].
In 2004, along with China’s political reforms, the concept of social welfare began to move toward “public welfare socialization”, which put forward more innovative ideas for the development of non-profit organizations. Under social pressure and philanthropic development, there was increasing awareness of the need to share prosperity among firms. Then the RAF was issued in June 2004, which differentiated between public foundations and private foundations for the first time. The most important breakthrough of the RAF came in allowing private citizens or commercial entities to establish charitable foundations. Since then, corporate foundations came into being and have experienced rapid growth. The promulgation of the RAF represents a watershed in the development of China’s foundation sector [6]. Corporate foundations increased at an unprecedented rate after 2008, which is the year regarded as the “prime year of China’s philanthropy” because of corporate enthusiasm for charitable donations to the Wenchun Earthquake recovery. The Charity Law of the People’s Republic of China was issued in March 2016, which opened the right of public fundraising to private foundations. It is a milestone for the development of China’s private foundations.
Corporate foundations, like all private foundations in China, must follow certain regulations governing charitable foundations and non-profit organizations. The regulations that are important for corporate foundations concern minimum payout rules, income taxes, prohibiting transactions benefitting the donor, and specific tax return filing procedures. Specifically, according to RAF, Article 29, the funds that corporate foundations make grants to charitable causes should not be less than 8% of their net assets. Corporate foundations cannot allocate more than 10% of their total expenditures to cover staff wages and benefits and overhead and should pay 25% income tax on their investment income. Corporate foundations are required to disclose their annual reports from donors and provide a detailed account of the amount of funds to each recipient. If a corporate foundation fails to meet the regulations, it will receive a warning from the civil affairs department and its registration may be revoked in serious cases.

2.2. Literature Review and Hypotheses Development

2.2.1. Corporate Foundations and Earnings Management

Prior research on CSR provides theoretical background of integrating ethical expectations of business into a rational economic and legal framework [30,31]. However, some studies conclude that CSR firms do not always behave in an ethical manner and are likely to be contrary to their stated standards of CSR [22]. Specifically, CSR practices can potentially be linked to agency problems and classified as a misuse of corporate resources for personal benefits [32,33,34,35]. From an agency cost perspective, prior theoretical studies suggest that, when firms assume the mantle of CSR based on opportunistic motives, they may use CSR strategically to engage in earnings management [21,22,23]. Since CSR can have a positive effect on corporate reputation [36], firms may engage in CSR as a form of reputation insurance, which then gives them a “license to operate” with respect to corporate misconduct [37,38]. This motive is somewhat consistent with the argument that CSR can be used to garner support from stakeholders and, therefore, provides an opportunity for entrenchment to managers that manipulate earnings [39]. Thus, the decisions to participate in CSR may be made to give stakeholders the impression that the socially responsible firms are transparent. However, these firms hide behind the appearance of transparency while engaging in earnings management [17]. Taken altogether, if managers make opportunistic use of CSR, they are more likely to manipulate earnings to mislead some stakeholders about the underlying economic performance of the firm or to influence contractual outcomes that depend on reported earnings.
In view of a body of evidence that corporate giving represents an agency problem, Masulis and Reza [25] evaluate the seriousness of agency problems associated with direct giving to public charities and contributions to their corporate foundations and they conclude that agency problems are more severe for contributions transferred to their corporate foundations. Several studies also come to similar conclusions [11,26,27]. Their conclusions are mainly based on the separation of the economic and financial reporting effect of charitable contributions through corporate foundations in a given period. Specifically, the financial reporting effect takes place when firms legally transfer funds to corporate foundations while the economic effect takes place when corporate foundations ultimately contribute to external charitable causes and offer opportunistic managers an opportunity to time the funding of their corporate foundations to manipulate reported earnings. Moreover, with gradual acceleration of China’s marketization process and governance environment, general earnings management tools have been strictly constrained by the rules of accounting standards and regulations governing capital market. Nonetheless, corporate foundations can provide a strong margin of concealment and security because they can provide substantial discretion regarding the amount of donation expenditures recorded on income statements without necessarily affecting the level of grants to external charitable causes [24]. Based on the above discussion, we formulate the first hypothesis in the following form.
H1: 
The overall earnings management level of firms with corporate foundations is higher than for those without corporate foundations.

2.2.2. The Impact of Ownership Property on Earnings Management of Founder Firms

The literature has demonstrated both theoretically and empirically that ownership of property plays an important role in shaping governance of listed firms in China [40]. The state-owned firms in China are a unique phenomenon of system and a special-type organizational form of enterprises whose ownership, personnel rights, and other important powers are controlled by the government [7]. Due to the inherent connection with the government, they can obtain preferential treatment such as access to bank loans, import tariffs, and government bailouts [41]. In contrast, privately-owned firms lack legitimacy and political backing to secure access to capital [42] and are, thus, faced with a great deal of political uncertainty [43]. In order to overcome competitive and resource disadvantages, it is undoubtedly important for privately-owned firms to build links with the government [44]. Prior studies have demonstrated that corporate philanthropy is an ideal and secure way for firms to cultivate a long-term-based reciprocal relationship with the government [45]. Chinese authorities especially appreciate corporate philanthropy because they do not have sufficient resources to engage in social welfare projects and, thus, largely rely on corporate giving to alleviate such resource shortages. Thus, privately-owned firms are more strategically motivated to engage in philanthropic activities to gain legitimacy or win support from governments that control land, energy, and other important resources [46].
In contrast to privately-owned firms, state-owned firms have totally different motives to become involved in philanthropic activities. Due to factors such as bureaucratic interference, multiple types of conflicts of interest, and the lack of competition, state-owned firms have been frequently associated with serious agency problems, poor corporate governance, misallocations of resources, and unethical behaviors such as corruption and fraud [40,47]. Selecting government officials from the state executives is a very important talent selection system in China. Thus, the executives in state-owned firms have dual identities of being government officials as well as business executives and they are faced with monetary incentives and non-monetary promotion incentives. With the rules regulating the payment of the state executives promulgated in 2009, the executives pay more and more attention to the political promotion incentives [7]. In the literature, it is widely believed that political promotion can lead to more serious principal-agent problems. This belief is advanced on the ground that the state executives have substantial discretion when making business decisions and, thus, they are inclined to make opportunistic behaviors in order to achieve political promotion. Under the hidden incentives of political promotion, they have very strong motivations to use firm resources for charitable donations to upgrade their image and gain government recognition and support in a short period of time [48]. This kind of corporate philanthropy could be a misuse of corporate resources that reduce firm value. However, firm value is still an important part of China’s current performance appraisal system for the state executives. Thus, from the perspective of the promotion-based tournament incentives, the state executives are more likely to manage earnings for meeting the financial and administrative performance evaluation and masking their opportunistic donation behavior. This insight suggests that earnings management is inherently associated with charitable donation in state-owned firms under the influence of political promotion incentives. Based on the discussion, we formulate the second hypothesis below.
H2: 
State-owned firms are more likely to make opportunistic use of corporate foundations to manipulate earnings than comparable privately-owned firms.

2.2.3. Earnings Management around the Zero Earnings Threshold

Existing research on earnings management has identified three major earnings thresholds: zero earnings, prior earnings, and analyst forecasted earnings. In contrast to employing various versions of accrual-based models to examine earnings management, some scholars detect earnings management by investigating whether earnings distributions around particular earnings thresholds are discontinuous [49,50]. Their findings document an unusually high number of firms’ annual reports showing small profits and an unusually low number with small losses, which partly reflect earnings management behavior. More specifically, the discontinuity in earnings distribution around the zero earnings threshold is widely interpreted as evidence that firms, that would otherwise report losses, manipulate earnings to report small profits. In principle, if a firm’s pre-managed earnings are just slightly below the zero earnings threshold, the firm would prefer engaging in income-increasing behavior that beats the zero earnings threshold marginally rather than over-stating earnings excessively [51]. Beaver et al. [52] examined discretionary loss reserve accruals for insurers around the zero earnings threshold and found that firms with small profits engage in greater income-increasing behavior than firms with small losses. Ayers et al. [53] and Hansen [54] also found that firms just above the loss-avoidance benchmark had discretionary accruals that were significantly higher than firms just below the loss-avoidance benchmark.
Moreover, China’s special stock delisting system makes the zero earnings threshold as the most important threshold for listed firms. In 2004, China issued the Stock Listing Rules, which stated that a listed firm with two consecutive annual losses would have the special characters “*ST” (Special Treatment) shown in front of its stock abbreviation, which indicates that the firm has been warned of possible delisting. Once the listed firm suffers special treatment designation, its managers could be replaced or have their salaries reduced, its financing costs rise, and its stock trading is subject to a considerable number of restrictions. If the “*ST” firm sustains losses in the subsequent year, it faces the risk of suspension or termination from the stock market. Given the negative impact that ST status can have, there is a powerful incentive for listed firms to employ earnings management to realize small profits that would maintain their valuable listing qualifications [55]. The foregoing discussion leads to our third hypothesis below.
H3: 
Founder firms with small profits record lower discretionary donation expenditures (i.e., greater income-increasing behavior) than those with small losses.

2.2.4. Stock Price Sensitivity and Earnings Management around the Prior Earnings Threshold

Accounting earnings, especially the prior period earnings, play an important role in the pricing of the stock market. There is a significantly positive relationship between stock prices and earnings changes. This means that firms with patterns of consecutive earnings increases have higher stock premiums and firms with patterns of decreasing earnings have lower stock premiums. Some researchers have provided strong reasons to explain why firms prefer to report consecutive earnings increases. Barth et al. [56] found that firms that reported at least five years of consecutive earnings increases were priced at a premium to otherwise similar firms. They also found that this premium increased almost monotonically with the strings of earnings increases and the premium was reduced when the strings of earnings increases ended. However, they did not investigate whether these firms engaged in earnings management. Beatty et al. [57] found that publicly traded banks always utilized managerial discretion to achieve longer strings of consecutive earnings increases. Ke [58] used the number of quarters of consecutive earnings increases as an earnings management proxy and found that CEOs who held high equity-based incentives were more likely to manipulate earnings to report strings of consecutive earnings increases. Myers et al. [59] presented evidence that firms consistently enjoyed abnormally strong stock market performance over periods during which they reported strings of earnings increases. Conversely, the firms suffered significant stock price declines when the strings were broken. They argued that this phenomenon was likely to be at least partially attributable to earnings management and provided evidence that these firms had strong incentives to use various earnings management tools to sustain and extend a run of consecutive earnings increases.
This phenomenon is more serious in China because of its weak-form efficiency market. Thus, the hypothesis of functional fixation holds that investors are more likely to pay attention to reported earnings because they are unable to see through earnings management, let alone incorporate the quality of earnings into stock prices. As a result, listed firms in China have strong incentives to engage in income-increasing earnings management to give investors the impression that they have good underlying performance. Based on the view that the strings of consecutive earnings increases can serve as a proxy for stock price sensitivity to earnings news [24] and, given recent evidence, we predict that firms with longer strings of consecutive earnings increases will have stronger incentives to engage in income-increasing earnings management to boost their stock prices and avoid disproportionately large stock price declines. This discussion leads to the fourth hypothesis, which is stated below.
H4: 
Founder firms with higher stock price sensitivity record lower discretionary donation expenditures (i.e., greater income-increasing behavior) than founder firms with lower stock price sensitivity.

2.2.5. Earnings Management to Create Earnings Reserves

Much of the literature concerning earnings management suggests that some firms can be predicted to engage in income-decreasing earnings management to create earnings reserves. The earnings reserves then can be used to achieve financial reporting objectives in subsequent periods. In general, the firms with pre-managed earnings above the relevant earnings thresholds create “cookie jar” reserves. Firms with low pre-managed earnings and insufficient reserves to meet relevant earnings thresholds take a loss to create earnings reserves that can be drawn down in later periods [52,60]. As discussed above, prior period earnings are an important threshold for the stock market [60] and for executive bonus contracts [61]. There are three general predictions about the use of managerial discretion relevant to the prior earnings threshold [62]. First, if pre-managed earnings are above prior earnings, firms may engage in income-decreasing earnings management that results in the current year earnings above prior earnings, but simultaneously they can save some earnings from the current year for the future. Second, if pre-managed earnings are below prior earnings, but earnings reserves are available to beat prior earnings, firms may draw from their earnings reserves, which, thereby, manipulates earnings to be slightly above prior earnings. Lastly, if pre-managed earnings are below prior earnings, and available earnings reserves are insufficient to meet prior earnings, firms may take a “big-bath” in earnings by engaging in extreme income-decreasing behavior that creates earnings reserves for use in future periods.
Bartov [63] found that firms timed asset disposal strategically to smooth earnings changes and demonstrate steady growth to the public. Especially in the case of multi-period earnings, firms have a strong motivation to create earnings reserves to reduce the difficulty of reporting consecutive earnings increases in subsequent periods. Potentially, corporate foundations are more likely to be used as off-balance sheet reserves by their for-profit founder firms. During the years when the founder firms’ current earnings are significantly higher than prior earnings or significantly lower than prior earnings, there is no possibility of beating prior earnings by means of earnings management and they may confirm more donation expenditures in the current period to create earnings reserves. The earnings reserves can be drawn down by making payouts without corresponding payins in subsequent periods. Thus, we expect that founder firms with high discretionary donation expenditures in the current period may create earnings reserves and, thus, are more likely to report consecutive earnings increases in subsequent periods. Based on above discussions, we formulate the fifth hypothesis in an alternative form.
H5: 
Founder firms that record high discretionary donation expenditures (i.e., income-decreasing behavior) create earnings reserves that they use to report consecutive earnings increases in subsequent periods.

3. Research Design

3.1. Sample Identification and Data Source

For our research on corporate foundations, our sample period is 2010 to 2016. We choose 2010 as the starting year because it is the year when CFC, which is an information service platform that imitates the U.S. Foundation Center, is co-sponsored by 35 famous foundations to collect and publicize data on charitable foundations. So far, the information and data have been very limited and preliminary. We collect data on corporate foundations mainly from CFC and the official website of the Ministry of Civil Affairs. In addition, we verify and supplement these data by using annual reports, audit reports, and project reports provided by the official websites of corporate foundations. In this way, we reduce possible research deviations that result from incomplete data.
We begin with 768 corporate foundations and then use the following selection process. (1) We exclude corporate foundations that are established by unlisted firms or overseas listed firms. (2) We eliminate corporate foundations that do not receive funds from their founder firms from 2010 to 2016. (3) When one corporate foundation is established by a business group that has more than one listed subsidiary, we exclude the corporate foundation if none of the subsidiaries issue CSR reports. Otherwise, we check the CSR reports of the subsidiaries. If one subsidiary’s CSR report involves foundation operation, we regard the subsidiary as the founder firm and, if none of the subsidiaries’ CSR reports involve a foundation operation, we exclude the corporate foundation. (4) If a firm has more than one associated corporate foundations, we add the data of the corporate foundations to one corporate foundation. (5) We eliminate corporate foundations that lack sufficient data to estimate discretionary donation expenditures. Lastly, we arrive at 653 annual data of corporate foundations.
Our initial sample also includes all Chinese A-Share listed firms during the period from 2010 to 2016. The China Foundation Center enables us to match corporate foundations with specific founder firms. We divide the sample firms into the treated group and the control group based on whether they have established corporate foundations. The firm-specific data set is obtained from the China Stock Market and Accounting Research Database and the Wind Database. We winsorize all continuous variables at the top and bottom 1% to mitigate the influence of extreme observations. The data procession and empirical tests rely on STATA 14.0.

3.2. Variable Definitions

3.2.1. Discretionary Accruals

Following Dechow et al. [64] and Ayers et al. [53], we use the modified Jones Model to estimate discretionary accruals, which can eliminate the conjectured tendency of the Jones Model to measure discretionary accruals with error when discretion is exercised over revenues. The specific formula is given as follows.
First, we calculate Total Accruals using Equation (1), where i and t represent the firm and time subscript indicators, respectively. TAC represents total accruals, Net represents net income, and CFO represents net cash flow from operating activities.
TACit = NetitCFOit
Then we run an OLS regression in the division of year and industry of Equation (2) and we place the calculated coefficients into Equation (3) to calculate non-discretionary total accruals.
T A C i t T A i t 1 = 0 ( 1 T A i t 1 ) + 1 ( ( Δ S A L E S i t Δ A R i t ) T A i t 1 ) + 2 ( P P E i t T A i t 1 ) + ε i t
N D A i t = 0 ( 1 T A i t 1 ) + 1 ( ( Δ S A K E S i t Δ A R i t ) T A i t 1 ) + 2 ( P P E i t T A i t 1 )  
In Equations (2) and (3), TAit-1 represents total assets at the end of the year t − 1, ΔSALES represents the increase in the main business income, PPE represents total fixed assets, ΔAR represents the increase in accounts receivable, and NDA represents non-discretionary total accruals.
Lastly, we calculate discretionary accruals (DA) using Equation (4).
D A i t = T A C i t T A i t 1 N D A i t

3.2.2. Discretionary Donation Expenditures

To determine whether founder firms strategically manipulate donated funds to corporate foundations, an estimate of discretionary donation expenditures is necessary. Following the work of Petrovits [24], we first develop a model of expected donation expenditures in the absence of manipulation. Then we define discretionary donation expenditures as the difference between actual donation expenditures and expected donation expenditures equaling the residual in Equation (5).
P a y i n s t = β 0 + β 1 P a y o u t s t + β 2 P a y o u t s t + 1 + β 3 F N A t 1 + β 4 N i n c o m e t + β 5 G o v G r a n t s + β 6 O t h e r i n c o m e t + β 7 A d E x p e n s e s t + β 8 S a l a r i e s t + β 9 T a x r a t e t + β 10 R O A t + β 11 C a s h t + + γ Y e a r t + λ I n d u s t r y t + ε t
The detailed definition of all variables in Equation (5) can be seen in Table A1 in Appendix A. To control for cross-sectional differences, all foundation-related variables are scaled by FNAt.

3.2.3. Earnings Levels Classification

Following Wang et al. [65], we classify the earnings levels variable as scaled net income, which equals net income in year t divided by total assets in year t − 1. We define founder firms with scaled net income (SNI) in the range of 0 to 0.01 as firms with small profits and founder firms with scaled net income (SNI) in the range of −0.01 to 0 as firms with small losses. Similarly, we calculate earnings change by subtracting net income in year t − 1 from net income in year t and scaling the amount by the total assets in year t − 1. We define founder firms with scaled net income change (ΔSNI) in the range of 0 to 0.01 as firms with small earnings increases and founder firms with scaled net income (ΔSNI) in the range of −0.01 to 0 as firms with small decreases in earnings.

3.3. Methodology and Model Specification

3.3.1. Propensity Score Matching Method

To empirically test H1 and H2, we classify the sample firms into two groups: the treated group including firms with corporate foundations and the control group including firms without corporate foundations. We use the propensity score matching method to search the most matched firms in multiple dimensions, which can simultaneously address the sample selection bias problem. We use a Logit model for Equation (6) to calculate the propensity score that measures the extent of matching between firms with and without corporate foundations in multi-dimensions.
In Equation (6), the dependent variable Establish is a dummy variable that equals one if the firm establishes a corporate foundation and zero otherwise. We refer to prior studies [66,67] to choose the matching variables in Equation (6). The detailed definition of all the matching variables can be seen in Table A1 in the Appendix A.
E s t a b l i s h t = β 0 + β 1 S i z e t + β 2 C a s h t + β 3 C u s t o m e r t + β 4 S O E t + β 5 H e r f i n d a l t + β 6 T o b i n q t + β 7 D u a l t + β 8 I n d e p t + β 9 A d v e r t t + β 10 E m p l o y e e t + β 11 F i r s t t + β 12 C o n t r a l t + β 13 R e g i o n t + β 14 M s h t + β 15 L i s t t + β 16 A u d i t t + γ Y e a r t + λ I n d u s t r y t + ε t
We simultaneously use nearest-neighbor matching, radius matching, and the kernel matching method to provide a robust examination of the net effect of corporate foundations on earnings management of their founder firms. One problem of the statistical analysis in this study is that the sample size is small. To reduce the small sample size bias, we use the bootstrap approach (K = 500) to estimate the standard errors of the average treated treatments (ATTs) statistic.

3.3.2. Earnings Distribution Method and Univariate tests

To test H3, we use the earnings distribution method to examine whether there is a discontinuity in earnings distribution around the zero earnings threshold that can provide partial evidence of founder firms exercising discretion to avoid losses. Given the inherent defects of the earnings distribution method for detecting earnings management and following Hansen [54], we then compare the difference in discretionary donation expenditures of founder firms around the zero earnings threshold (i.e., firms with small profits and small losses) by using univariate tests. The difference in discretionary donation expenditures can provide complementary and direct evidence that the discontinuity in earnings distribution around the zero earnings threshold arises from earnings management.
To test H4, referencing Barth et al. [56], we predict that founder firms reporting at least five years of consecutive increases in earnings through year t − 1 would have high stock price sensitivity to earnings news. Then we use univariate tests to compare the difference of discretionary donation expenditures between founder firms with consecutive increases in earnings lasting at least five years to those with consecutive increases in earnings for fewer than five years. We also conduct a robustness test on the research results by using a cut-off at four years and six years.
To test H5, we place founder firms that make positive discretionary donation expenditures into a high and a low group based on the size of their discretionary donation expenditures. First, we use univariate tests to compare the number of founder firms in the two groups that report consecutive increases in earnings in two or three subsequent years. Then we calculate a measure of earnings reserves that equal a foundation’s net assets in year t divided by Payouts in year t + 1 and analyze the change of earnings reserves over time.

3.3.3. Multiple Regression Analysis

To further test H4, following Myers et al. [59], we introduce an additional variable, String, to measure stock price sensitivity to accounting earnings and then estimate Equation (7) based on Equation (5).
P a y i n s t = β 0 + β 1 P a y o u t s t + β 2 P a y o u t s t + 1 + β 3 F N A t 1 + β 4 N i n c o m e t + β 5 G o v G r a n t s t + β 6 O t h e r i n c o m e t + β 7 A d E x p e n s e s t + β 8 S a l a r i e s t + β 9 T a x r a t e t + β 10 R O A t + β 11 C a s h t + β 12 A b o v e t + β 13 S t r i n g t + β 14 A b o v e t * S t r i n g t + γ Y e a r t + λ I n d u s t r y t + ε t
In Equation (7), the dependent variable is Payins and the model includes all the variables in Equation (5). The additional variable Above is a dummy variable that equals one if the firm’s earnings change (ΔSNI) is in the range of 0 to 0.01 and zero otherwise. String equals the number of years of consecutive increases in earnings through year t − 1. The interaction between Above and String is used to examine whether discretionary donation expenditures are decreasing with the length of the earnings strings for founder firms with small earnings increases.

4. Empirical Results

4.1. Descriptive Statistics and Pearson Correlation Analysis

Table 1 presents the descriptive statistical results of the main variables used in our study. The mean value and standard deviation value of discretionary donation expenditures (DDEs) are −0.112 and 5.204, respectively, which indicates a substantial difference between the values for discretionary donation expenditures. The mean value and standard deviation value of Payins are 0.980 and 2.684, respectively, while the mean value and standard deviation value of Payouts are 0.882 and 1.668, respectively. This suggests that Payins are more changeable than Payouts. A preliminary explanation of these results is that founder firms always make the desired level of Payouts without recording matching donation expenditures by using corporate foundations as off-balance sheet fund pools. Thus, the mean (median) value of earnings reserves (Reserve) is 5.327 (5.655), which are significantly higher than necessary. The values suggest that founder firms have excessive earnings reserves created by high donation expenditures in a period when founder firms choose to decrease earnings.
Table 2 reports the results of the Pearson correlations of the main variables. The Pearson correlation matrix shows that the coefficients of Payins, Payouts, FNA, and Nincome are all significant in the predicted direction. The coefficient between discretionary donation expenditures (DDEs) and discretionary accruals (DA), which is the proxy of the overall earnings management level, is 0.062. This is significant at the 10% level. This finding provides preliminary evidence that corporate foundations are only one possible tool in a portfolio of options available to manipulate earnings and founder firms make consistent use of the portfolio of earnings management tools to achieve specific earnings targets.

4.2. Results for H1 and H2: Corporate Foundations and Earnings Management

4.2.1. Propensity to Establish Corporate Foundations

To get a good specification of the logit model, we estimate Equation (6) four times with various specifications since some of the matching variables are chosen (Model1–Model4) and the results are presented in Table 3. In line with previous literature [68], we use two diagnostic proxies called pseudo-R2, which is widely used in logit analysis, and the area under the ROC curve (AUC). Comparing the values of Pseudo-R2 and AUC in Model 1–Model 4, we can see that Model 4 provides better results than the other three models. For this reason, we use Model 4 as the basic specification to calculate propensity scores and then compare discretionary accruals between the treated group and the control group.
As shown in Table 3, the results demonstrate that the probability of establishing corporate foundations is significantly positively correlated with firm size (Size), cash holdings (Cash), growth opportunity (Tobinq), sales cost (Advert), employee numbers (Employee), shareholding concentration (First), managerial stockholding (Msh), audit quality (Audit), and location of the headquarters (Region). The probability is significantly negatively correlated with CEO duality (Dual), independent director proportion (Indep), and the number of listed years (List). The probability is not significantly related to industry competition (Herfindal). Moreover, the propensity to establish corporate foundations is lower in state-owned firms when compared to privately-owned firms since the dummy variable of final control rights (SOE) is negatively significant in all models.

4.2.2. Results for H1: Corporate Foundations and Earnings Management

Table 4 shows the average treated treatments (ATTs) based on the nearest-neighbor matching, radius matching, and kernel matching methods including both pre-matching and post-matching. The following discussion is based on the nearest-neighbor matching method. The results from the other two methods are used as robustness tests. In the analysis of either pre-matching or post-matching, we find that discretionary accruals are significantly different from zero at the 5% level. In detail, before matching, discretionary accruals of the treated group and the control group are −0.012 and 0.0013, respectively, which are significant at the 5% level. After matching, discretionary accruals of the two groups are −0.012 and −0.0005, respectively, which are still significant at the 5% level. The results indicate that corporate foundations significantly increase the overall earnings management levels of their founder firms, which is consistent with H1. The result, thus, is consistent with the argument that charitable contributions transferred to corporate foundations represent an agency problem [11,25,26,27].
According to the results in Table 4, if the sample does not match the above matching variables, we directly compare discretionary accruals between the treated group and the control group. The value of the ATTs is −0.0133 before matching, which is greater than −0.0115. The value after matching overestimates the effects of corporate foundations on the overall earnings management levels of their founder firms. At the same time, the results also prove that PSM can reduce the error of sample selection to a certain extent, which makes the conclusions more accurate and reliable.

4.2.3. Results for H2: The Impact of Ownership Property on Earnings Management of Founder Firms

To examine H2, we further divide the sample firms into the stated-owned subgroup and the privately-owned subgroup. Table 5 shows the comparison of the state-owned subgroup and the privately-owned subgroup with respect to the effect of ownership property on earnings management of the founder firms. Using the nearest-neighbor matching method, we find a significant difference between the two subgroups. Specifically, discretionary accruals are not significantly different within the state-owned subgroup while they are different within the privately-owned subgroup, which is significant at the 1% level. Thus, we may argue that the difference of discretionary accruals in Table 4 between the treated group and the control group is driven mainly by the privately-owned firms. The results, however, negate hypothesis 2 that state-owned firms are more likely to make opportunistic use of corporate foundations to manipulate earnings than comparable privately-owned firms. However, the result is consistent with the findings of Wang and Yung [40] and Ding et al. [69]. One possible explanation of this result is that corporate giving of state-owned firms is subject to strict regulation by various government agencies and privately-owned firms have strong motivations to report better-than-real financial performance to reassure the stock market.
Furthermore, we use both radius matching and kernel matching as robustness tests to reexamine the first and second hypotheses. Focusing on the full sample in Table 4, we find similar results by using the radius matching method and the kernel matching method. Hence, the robustness tests further confirm H1. Focusing on the subgroups in Table 5, we also identify similar patterns by using the two methods and the results are qualitatively similar to the main specification.

4.3. Results for H3: Earnings Management around the Zero Earnings Threshold

4.3.1. Discontinuity in Earnings Distributions around the Zero Earnings Threshold

The histogram of earnings distributions in Figure 2 uses equal intervals of the earnings level in the range of −0.10 to 0.10 as the abscissa and takes the frequency of founder firms in each interval as the ordinate. According to Figure 2, we can see obvious discontinuity in the histogram of earnings distributions around the zero earnings threshold. The frequency of firms with small profits is significantly larger than the frequency of firms with small losses, which is consistent with prior research. The discontinuity in earnings distributions around the zero earnings threshold can be attributed to earnings management techniques used to meet or beat zero earnings [70]. Thus, we predict that the region of small profits is a potentially fruitful region to explore earnings management.

4.3.2. Univariate Tests

To further determine whether the discontinuity in earnings distributions around the zero earnings threshold is caused by earnings management, we explore whether founder firms with small profits and small losses have different levels of discretionary donation expenditures. If founder firms do not use corporate foundations to manipulate earnings, discretionary donation expenditures will equal zero.
As shown in Table 6, the mean value of discretionary donation expenditures (DDEs) of firms with small profits and with SNI in the range of 0 to 0.01 equals −0.885, which is significantly different from zero at the 5% level (p = 0.048). In comparison, the mean value of DDEs of firms with small losses, with SNI in the range of −0.01 to 0, equals −0.001, which is not much different from zero (p = 0.299). Moreover, the difference of mean DDEs between the firms with small profits and small losses yield a p-value of 0.089 by using a one-sided t-test, which is significant at the 10% level. Therefore, the results reported in Table 6 are consistent with H3. Founder firms with small profits record lower discretionary donation expenditures than those with small losses. This finding confirms that the discontinuity around the zero earnings threshold arises from discretionary foundation funding choices that are made to realize small profits, which is consistent with empirical results that firms have strong motivations to adopt different earnings management behavior to avoid losses [71,72].

4.4. Results for H4: Stock Price Sensitivity and Earnings Management around the Prior Earnings Threshold

Table 7 reports statistical tests used to determine whether discretionary donation expenditures made by founder firms with small earnings increases are correlated with stock price sensitivity to earnings news. As shown in Table 7, the mean value of discretionary donation expenditures (DDEs) of founder firms with consecutive increases in earnings (String) lasting at least five years or fewer than five years are −2.207 and 1.056, respectively. The one-sided t-test of the difference between the means of discretionary donation expenditures (DDEs) of the two portfolios yields a p-value of 0.001, which is significant at the 1% level. These results are consistent with H4: founder firms with higher stock price sensitivity, measured by the strings of consecutive increases in earnings, and record lower discretionary donation expenditures than firms with lower stock price sensitivity. In addition, we use a cut-off at both four years and six years to examine H4 robustly and the results are similar quantitatively to the main specification.
Table 8 reports the multiple regression results for whether discretionary donation expenditures decrease with the length of earnings strings for founder firms with small earnings increases. As seen in Model 1, the coefficient of Above is −0.325, which is significant at the 5% level. This suggests that firms with small earnings increases have lower discretionary donation expenditures. In Model 2, the coefficient of String is −0.163, but it is not significant, i.e., the relationship between stock price sensitivity and the donated income from founder firms is not significant. In Model 3, the coefficient of the interaction between Above and String is −0.037 and is significant at the 5% level while the coefficient of Above is now insignificant, which suggests that the lower discretionary donation expenditures of firms with small earnings increases can be attributed to higher stock price sensitivity. These results further confirm H4.

4.5. Results for H5: Earnings Management to Create Reserves

Table 9 reports statistical tests regarding whether founder firms that make income-decreasing discretionary donation expenditures are more likely to report earnings increases in subsequent periods. As seen in Panel A, 35.72% (24.11%) of founder firms in the High group report consecutive increases in earnings in the subsequent two (three) years. In contrast, only 27.68% (14.29%) of the founder firms in the low group report consecutive increases in earnings in the subsequent two (three) years. The p values of the difference of String between the high and low groups equal 0.097 (0.086), which is significant at the 10% level. These results indicate that founder firms with high discretionary donation expenditures create earnings reserves that can be drawn down if necessary. Thus, they are more likely to report consecutive increases in earnings in subsequent periods. Therefore, they support H5.
Based on the high and low group in Panel A, we then place the founder firms into a Yes or a No group according to whether they report a string of earnings increases in the subsequent three years in Panel B. As shown in Panel B, the mean value of earnings reserves (Reserve) is 5.873 in the High-No group while the mean value of earnings reserves (Reserve) is 5.327 in the High-Yes group. In comparison, the mean values of earnings reserves (Reserve) in the Low-No and Low-Yes group are only 3.687 and 2.427, respectively. Moreover, in the High-Yes group alone, the earnings reserves (Reserve) decrease monotonically over time, which suggests that these founder firms with high discretionary donation expenditures make more payouts than payins. These findings can be understood as the action of drawing down created earnings reserves to achieve earnings increases in the subsequent periods. The results further confirm H5.

4.6. Further Robustness Checks

Although not tabulated for brevity, we also conduct the following robustness checks:
  • Since the lagging variable method is a simple but crude way to examine the direction of causality in the time-series lead-lag relationship between the potentially endogenous variables [73], we use lagging matching variables in Equation (6) to prevent the endogeneity problem that is not linked to the constant unobservable heterogeneity. The results are similar to those presented in Table 3. As such, our conclusion on the probability of establishing corporate foundations remains unaltered.
  • We include firm fixed effects in Equation (7) to control for unobservable determinants of payins, which can extract the unobservable firm-specific characteristics (e.g., culture and ethics) from the error term and, thus, provide an unbiased or less biased estimate. The results are the same as those presented in Table 8.
  • We also perform a robustness check on various control variables, e.g., for firm size. In the main test, we use the natural logarithm of total assets to measure the firm size in order to control the fundamental firm characteristic in the main tests. As a robustness check, following Dang et al. [74], we further employ natural logarithm forms of the other two firm size measures: total sales and market value of equity. The coefficients of the three firm size measures are robust in sign and statistical significance.
  • We also find that the results are robust to the effect of potential outliers, based on tests with winsorizing at the 5 percent and 95 percent levels, instead of 1 percent and 99 percent.

5. Conclusions and Discussion

Although some studies attempt to explore the association between CSR and earnings management, they provide two opposite views that limit our understanding of their true relationship. In this paper, we target a significant approach to philanthropic CSR that is relatively under-researched in China, which involves corporate foundations and their potential role in the earnings management efforts of their founder firms. Based on a sample of corporate foundations and firms listed on the A-share market from 2010 to 2016, we provide strong and consistent evidence consistent with the hypotheses that for-profit firms use their corporate foundations strategically as off-balance sheet fund pools to help achieve self-serving earnings objectives. Specifically, our results indicate that firms with corporate foundations behave differently from those without corporate foundations in overall discretionary accruals and, in contrast with the conventional belief that state ownership is the root of corporate inefficiency, we find that privately-owned firms are more likely to make opportunistic use of corporate foundations to manipulate earnings than comparable state-owned firms. In addition, our findings suggest that corporate foundations offer an opportunity for their founder firms to exercise substantial discretion regarding the amount of donation expenditures to increase earnings in order to avoid losses and decreases in earnings or to decrease earnings in order to create earnings reserves.
Overall, our findings demonstrate that for-profit firms strategically make income-increasing or income-decreasing foundation funding choices to pursue self-serving earnings objectives. The findings, thus, are consistent with an agency problem that the visibly ethical behavior of establishing corporate foundations does not represent the consistent embodiment of philanthropic CSR, but becomes a vehicle that enables firms to achieve self-serving earnings objectives. Since corporate foundations are burdensome to create, costly to administer, constrained by payout requirements and income taxes, and are not necessary for firms to make charitable donations, our findings also provide an enriched understanding of the motivations of profit-oriented firms for establishing non-profit corporate foundations. Moreover, documenting the opportunistic use of corporate foundations as off-balance sheet fund pools to manipulate reported earnings lends support to the argument that social responsible firms behave in an irresponsible manner to achieve self-serving earnings objectives, which contributes to drawing conclusions about the nature of the relationship between CSR and earnings management. More importantly, our findings not only have important implications for legislators and regulators concerning the governance of corporate charitable giving but also can provide new ideas for corporate foundations governance, which can guide the healthy and sustainable development of public welfare services in China.
We note that our findings should be interpreted considering several limitations. First, due to data limitations, our sample might not be so large as to represent the entire corporate foundation sector. This is especially true because corporate foundations are a novelty in China, statistics and data were rare for this new foundation sector before the China Foundation Center was launched in July 2010. In addition, our sample excludes corporate foundations that are established by unlisted firms or overseas listed firms, which occupy a large proportion of all corporate foundations. As such, our results need to be regarded as preliminary findings. Second, this study is only the first step in a broader research agenda. We view our findings as a credible demonstration that corporate foundations are a signal of agency problems in the founder firms. However, we do not further study the governance mechanisms of corporate foundations in the implementation of CSR initiatives. As boundary organizations facilitating relationships between the founder firms and public charities, corporate foundations and their governance research is increasingly the focus in the transformation process of corporate governance to social organization governance. This study provides a platform for future research among corporate foundations with a specific focus on governance.

Author Contributions

The manuscript was written through joint contributions from all authors. L.X. proposed the main idea, wrote the initial draft, and gave guidance to the problems during the work. S.Z. conceived the theory part, designed the empirical study, and drafted and revised the manuscript. N.L. put in a lot of effort on the introduction and data collection. L.C. reviewed related studies and made insightful comments on different versions of this paper. All authors have given approval to the financial version of the manuscript.

Funding

This paper is financially supported by the National Natural Science Foundation of China (71774050 and 71573075); the Ph.D. Innovation Programs Foundation of Ministry of Education of Hunan Province (Grant No. CX2017B132).

Conflicts of Interest

The authors declare no conflict of interest.

Appendix A

Table A1. Variable definitions.
VariablesDefinition
PSM variables
EstablishA dummy variable that equals one if the firm establishes a corporate foundation and zero otherwise
SizeFirm size, measured as the natural logarithm of total assets
CashNatural logarithm of cash holdings at the end of the year
CustomerA dummy variable that equals one if the firm’s products come in direct contact with customers and zero otherwise
HerfindalIndustrial competition extent, calculated as the ratio of each firm’s revenues from each industry per year divided by the total revenues of all firms in the industry, and the sum of squares of the ratios per year in accordance with the industry of all firms
SOEA dummy variable that equals one if the firm is state-owned and zero otherwise
TobinqGrowth opportunity, measured as market value divided by total assets
DualA dummy variable that equals one if the chairman and general manager are the same person and zero otherwise
IndepThe number of independent directors divided by the total number of members on the board of directors
AdvertRate of sale costs, measured as sale costs divided by sale revenues
EmployeeNatural logarithm of the number of employees
FirstContralThe ratio of the largest shareholder’s shares to the total sharesThe ratio of the top five shareholders’ shares to the total shares
MshThe proportion of shares held by management
AuditA dummy variable that equals one if the firm’s auditor is one of the Big 4 and zero otherwise
ListNatural logarithm of the number of years that the firm has been listed on the stock market
RegionA dummy variable that equals one if the firm’s headquarters is in the coastal area and zero otherwise
DADiscretionary accruals calculated by the modified version of the Jones Model
Corporate foundations variables
PayinsThe funds donated by founder firms to their corporate foundations
PayoutsThe funds donated by corporate foundations to external charitable causes
FNANet assets of corporate foundations at the end of the year
NincomeInvestment incomes after deducting income tax of corporate foundations
GovGrantsGovernment subsidy incomes of corporate foundations
OtherincomeIncomes from non-founder firms, service income, and fee income
AdExpensesAdministrative office expenses of corporate foundations
SalariesStaff wages and benefits of corporate foundations
ReserveEarnings reserves, measured as the net assets of corporate foundations in year t and divided by expected payouts in year t+1
Founder firms variables
TaxrateActual income tax rate, calculated as income tax expenses and divided by total profits
ROAReturn-on-assets ratio, calculated as net income before donation expenditures and divided by lagged total assets
CashCash and cash equivalents before donation expenditures scaled by total assets
SNIScaled net income, calculated as net income in year t and divided by total assets in year t − 1
ROEReturn-on-equity ratio, calculated as net income and divided by net assets
DDEsDiscretionary donation expenditures calculated by the difference between actual donation expenditures and expected donation expenditures from Equation (5) by measuring the magnitude of earnings management provided by corporate foundations
StringThe number of years of consecutive increases in earnings through year t − 1, measuring stock price sensitivity to earnings news
AboveA dummy variable that equals one if the corporation’s earnings change is in the range of 0 to 0.01 and zero otherwise

References

  1. Godfrey, P.C. The Relationship between Corporate Philanthropy and Shareholder Wealth: A Risk Management Perspective. Acad. Manag. Rev. 2005, 30, 777–798. [Google Scholar] [CrossRef]
  2. Porter, M.E.; Kramer, M.R. The link between competitive advantage and corporate social responsibility. Harv. Bus. Rev. 2006, 85, 78–92. [Google Scholar] [CrossRef]
  3. Peterson, D.K.; Su, Y. Relationship between Corporate Foundation Giving and the Economic Cycle for Consumer and Industrial Oriented Firms. Bus. Soc. 2017, 56, 1169–1194. [Google Scholar] [CrossRef]
  4. Westhues, M.; Einwiller, S. Corporate foundations: Their role for corporate social responsibility. Corp. Reput. Rev. 2006, 9, 144–153. [Google Scholar] [CrossRef]
  5. Chen, G.; Li, W. Corporate Foundations and Their Governance: Research Development and Future Prospects. China Econ. Manag. 2016, 38, 21–35. (In Chinese) [Google Scholar] [CrossRef]
  6. Feng, X. China’s charitable foundations: Development and policy-related issues. Chin. Econ. 2015, 48, 130–154. [Google Scholar] [CrossRef]
  7. Xu, L.; Zhang, S.; Xu, P.; Liu, N.; Zhao, G.; Zhao, L. A Concealed Wrongdoing of Corporate Philanthropy: Evidence from China. Voluntas 2017, 28, 721–744. [Google Scholar] [CrossRef]
  8. Pedrini, M.; Minciullo, M. Italian corporate foundations and the challenge of multiple stakeholder interests. Nonprofit Manag. Leadersh. 2011, 22, 173–197. [Google Scholar] [CrossRef]
  9. Minciullo, M.; Pedrini, M. Knowledge Transfer between For-Profit Firms and Their Corporate Foundations. Nonprofit Manag. Leadersh. 2015, 25, 215–234. [Google Scholar] [CrossRef]
  10. Webb, N.J. Tax and government policy implications for corporate foundation giving. Nonprofit Volunt. Sect. Q. 1994, 23, 41–67. [Google Scholar] [CrossRef]
  11. Brown, W.O.; Helland, E.; Smith, J.K. Corporate philanthropic practices. J. Corp. Financ. 2006, 12, 855–877. [Google Scholar] [CrossRef] [Green Version]
  12. Lev, B.; Petrovits, C.; Radhakrishnan, S. Is doing good good for you? How corporate charitable contributions enhance revenue growth. Strateg. Manag. J. 2010, 31, 182–200. [Google Scholar] [CrossRef]
  13. Hategan, C.D.; Sirghi, N.; Curea-Pitorac, R.I.; Hategan, V.P. Doing well or doing good: The relationship between corporate social responsibility and profit in romanian companies. Sustainability 2018, 10, 1041. [Google Scholar] [CrossRef]
  14. Hao, D.Y.; Qi, G.Y.; Wang, J. Corporate social responsibility, internal controls, and stock price crash risk: The Chinese stock market. Sustainability 2018, 10, 1675. [Google Scholar] [CrossRef]
  15. Scholtens, B.; Kang, F.C. Corporate Social Responsibility and Earnings Management: Evidence from Asian Economies. Corp. Soc. Responsib. Environ. Manag. 2013, 20, 95–112. [Google Scholar] [CrossRef]
  16. Hong, Y.; Andersen, M.L. The relationship between corporate social responsibility and earnings management: An exploratory study. J. Bus. Ethics 2011, 104, 461–471. [Google Scholar] [CrossRef]
  17. Kim, Y.; Park, M.S.; Wier, B. Is earnings quality associated with corporate social responsibility? Account. Rev. 2012, 87, 761–796. [Google Scholar] [CrossRef]
  18. Bozzolan, S.; Fabrizi, M.; Mallin, C.A.; Michelon, G. Corporate social responsibility and earnings quality: International evidence. Int. J. Account. 2015, 50, 361–396. [Google Scholar] [CrossRef]
  19. Gras-Gil, E.; Manzano, M.P.; Fernández, J.H. Investigating the relationship between corporate social responsibility and earnings management: Evidence from Spain. Bus. Res. Q. 2016, 19, 289–299. [Google Scholar] [CrossRef]
  20. Lee, D. Corporate social responsibility and management forecast accuracy. J. Bus. Ethics 2017, 140, 353–367. [Google Scholar] [CrossRef]
  21. Chih, H.L.; Shen, C.H.; Kang, F.C. Corporate social responsibility, investor protection, and earnings management: Some international evidence. J. Bus. Ethics 2008, 79, 179–198. [Google Scholar] [CrossRef]
  22. Prior, D.; Surroca, J.; Tribó, J.A. Are socially responsible managers really ethical? Exploring the relationship between earnings management and corporate social responsibility. Corp. Gov. Int. Rev. 2008, 16, 160–177. [Google Scholar] [CrossRef] [Green Version]
  23. Salewski, M.; Zülch, H. The Association between Corporate Social Responsibility (CSR) and Earnings Quality—Evidence from European Blue Chips; HHL Leipzig Graduate School of Management: Leipzig, Germany, 2014. [Google Scholar] [CrossRef]
  24. Petrovits, C.M. Corporate-sponsored foundations and earnings management. J. Account. Econ. 2006, 41, 335–362. [Google Scholar] [CrossRef] [Green Version]
  25. Masulis, R.W.; Reza, S.W. Agency problems of corporate philanthropy. Rev. Financ. Stud. 2015, 28, 592–636. [Google Scholar] [CrossRef]
  26. Duquette, N.J.; Ohrn, E.C. Corporate charitable foundations, executive entrenchment, and shareholder distributions. J. Econ. Behav. Organ. 2018, 152, 235–253. [Google Scholar] [CrossRef]
  27. Liang, H.; Renneboog, L. Corporate donations and shareholder value. Oxf. Rev. Econ. Policy 2017, 33, 278–316. [Google Scholar] [CrossRef]
  28. Minefee, I.; Neuman, E.J.; Isserman, N.; Leblebici, H. Corporate foundations and their governance: Unexplored territory in the corporate social responsibility agenda. Ann. Soc. Responsib. 2015, 1, 57–75. [Google Scholar] [CrossRef]
  29. Cour, A.L.; Kromann, J. Euphemisms and hypocrisy in corporate philanthropy. Bus. Ethics Eur. Rev. 2011, 20, 267–279. [Google Scholar] [CrossRef]
  30. Garriga, E.; Melé, D. Corporate social responsibility theories: Mapping the territory. J. Bus. Ethics 2004, 53, 51–71. [Google Scholar] [CrossRef]
  31. Mackey, A.; Mackey, T.B.; Barney, J.B. Corporate social responsibility and firm performance: Investor preferences and corporate strategies. Acad. Manag. Rev. 2007, 32, 817–835. [Google Scholar] [CrossRef]
  32. Wagner, T.; Lutz, R.J.; Weitz, B.A. Corporate hypocrisy: Overcoming the threat of inconsistent corporate social responsibility perceptions. J. Mark. 2009, 73, 77–91. [Google Scholar] [CrossRef]
  33. Hemingway, C.A.; Maclagan, P.W. Managers’ personal values as drivers of corporate social responsibility. J. Bus. Ethics 2004, 50, 33–44. [Google Scholar] [CrossRef]
  34. Werbel, J.D.; Carter, S.M. The CEO’s influence on corporate foundation giving. J. Bus. Ethics 2002, 40, 47–60. [Google Scholar] [CrossRef]
  35. Ho, S.J.; Huang, C. Managerial altruism and governance in charitable donations. Manag. Decis. Econ. 2017, 38, 1058–1068. [Google Scholar] [CrossRef]
  36. Singh, P.J.; Sethuraman, K.; Lam, J.Y. Impact of Corporate Social Responsibility Dimensions on Firm Value: Some Evidence from Hong Kong and China. Sustainability 2017, 9, 1532. [Google Scholar] [CrossRef]
  37. Du, X. Is corporate philanthropy used as environmental misconduct dressing? Evidence from Chinese family-owned firms. J. Bus. Ethics 2015, 129, 341–361. [Google Scholar] [CrossRef]
  38. Kim, H.; Hur, W.M.; Yeo, J. Corporate brand trust as a mediator in the relationship between consumer perception of CSR, corporate hypocrisy, and corporate reputation. Sustainability 2015, 7, 3683–3694. [Google Scholar] [CrossRef]
  39. Koehn, D.; Ueng, J. Is philanthropy being used by corporate wrongdoers to buy good will? J. Manag. Gov. 2010, 14, 1–16. [Google Scholar] [CrossRef]
  40. Wang, L.; Yung, K. Do state enterprises manage earnings more than privately owned firms? The case of China. J. Bus. Financ. Account. 2011, 38, 794–812. [Google Scholar] [CrossRef]
  41. Wang, Q.; Wong, T.J.; Xia, L. State ownership, the institutional environment, and auditor choice: Evidence from china. J. Account. Econ. 2008, 46, 112–134. [Google Scholar] [CrossRef]
  42. Nee, V. Organizational dynamics of market transition: Hybrid forms, property rights, and mixed economy in China. Adm. Sci. Q. 1992, 37, 1–27. [Google Scholar] [CrossRef]
  43. Park, S.H.; Luo, F.Y. Guanxi and organizational dynamics: Organizational networking in Chinese firms. Strateg. Manag. J. 2010, 22, 455–477. [Google Scholar] [CrossRef]
  44. Li, W.; Zhang, R. Corporate Social Responsibility, Ownership Structure, and Political Interference: Evidence from China. J. Bus. Ethics 2010, 96, 631–645. [Google Scholar] [CrossRef]
  45. Wang, H.; Qian, C. Corporate philanthropy and corporate financial performance: The roles of stakeholder response and political access. Acad. Manag. J. 2011, 54, 1159–1181. [Google Scholar] [CrossRef]
  46. Li, S.; Song, X.; Wu, H. Political connection, ownership structure, and corporate philanthropy in china: A strategic-political perspective. J. Bus. Ethics 2015, 129, 399–411. [Google Scholar] [CrossRef]
  47. Aharony, J.; Wang, J.; Yuan, H. Tunneling as an incentive for earnings management during the ipo process in China. J. Account. Public Policy 2009, 29, 1–26. [Google Scholar] [CrossRef]
  48. Zheng, Z.; Li, D.; Xu, R. The political promotion of the SOE executives: A case study on a certain corporation of a certain province. Manag. World 2012, 10, 146–156. (In Chinese) [Google Scholar]
  49. Burgstahler, D.; Dichev, I. Earnings management to avoid earnings decreases and losses. J. Account. Econ. 1997, 24, 99–126. [Google Scholar] [CrossRef]
  50. Gunny, K.A. The relation between earnings management using real activities manipulation and future performance: Evidence from meeting earnings benchmarks. Contemp. Account. Res. 2010, 27, 855–888. [Google Scholar] [CrossRef]
  51. Dechow, P.M.; Richardson, S.A.; Tuna, I.A. Why are earnings kinky? An examination of the earnings management explanation. Rev. Account. Stud. 2003, 8, 355–384. [Google Scholar] [CrossRef]
  52. Beaver, W.H.; Mcnichols, M.F.; Nelson, K.K. Management of the loss reserve accrual and the distribution of earnings in the property-casualty insurance industry. J. Account. Econ. 2003, 35, 347–376. [Google Scholar] [CrossRef]
  53. Ayers, B.; Jiang, J.; Yeung, E. Discretionary accruals and earnings management: An analysis of pseudo earnings targets. Account. Rev. 2006, 81, 617–652. [Google Scholar] [CrossRef]
  54. Hansen, J.C. The effect of alternative goals on earnings management studies: An earnings benchmark examination. J. Account. Public Policy 2010, 29, 459–480. [Google Scholar] [CrossRef]
  55. Chen, Y.; Chen, C.H.; Huang, S.L. An appraisal of financially distressed companies’ earnings management: Evidence from listed companies in China. Pac. Account. Rev. 2010, 22, 22–41. [Google Scholar] [CrossRef]
  56. Barth, M.E.; Elliott, J.A.; Finn, M.W. Market rewards associated with patterns of increasing earnings. J. Account. Res. 1999, 37, 387–413. [Google Scholar] [CrossRef]
  57. Beatty, A.; Ke, B.; Petroni, K. Differential earnings management to avoid earnings declines and losses across publicly and privately-held banks. Account. Rev. 2002, 77, 547–570. [Google Scholar] [CrossRef]
  58. Ke, B. Do equity-based incentives induce CEOs to manage earnings to report strings of consecutive earnings increases? SSRN Electron. J. 2004. [Google Scholar] [CrossRef]
  59. Myers, J.N.; Myers, L.A.; Skinner, D.J. Earnings momentum and earnings management. J. Account. Audit. Financ. 2007, 22, 249–284. [Google Scholar] [CrossRef]
  60. Bornemann, S.; Kick, T.; Memmel, C.; Pfingsten, A. Are banks using hidden reserves to beat earnings benchmarks? Evidence from Germany. J. Bank. Financ. 2012, 36, 2403–2415. [Google Scholar] [CrossRef] [Green Version]
  61. Matsunaga, S.R.; Park, C.W. The effect of missing a quarterly earnings benchmark on the CEO’s annual bonus. Account. Rev. 2001, 76, 313–332. [Google Scholar] [CrossRef]
  62. Abarbanell, J.; Lehavy, R. Can stock recommendations predict earnings management and analysts’ earnings forecast errors? J. Account. Res. 2003, 41, 1–31. [Google Scholar] [CrossRef]
  63. Bartov, E. The timing of asset sales and earnings manipulation. Account. Rev. 1993, 68, 840–855. [Google Scholar] [CrossRef]
  64. Dechow, P.M.; Sloan, R.G.; Sweeney, A.P. Detecting earnings management. Account. Rev. 1995, 70, 193–225. [Google Scholar] [CrossRef]
  65. Wang, F.; Cheng, F.; Ji, S. Discontinuities in Earnings Distributions around Thresholds: An Empirical Examination of the Earnings Management Explanation. Account. Res. 2013, 5, 19–26. (In Chinese) [Google Scholar] [CrossRef]
  66. Du, X.; Jian, W.; Du, Y.; Feng, W.; Zeng, Q. Religion, the nature of ultimate owner, and corporate philanthropic giving: Evidence from China. J. Bus. Ethics 2014, 123, 235–256. [Google Scholar] [CrossRef]
  67. Chen, J.; Dong, W.; Tong, J.; Zhang, F. Corporate philanthropy and tunneling: Evidence from China. J. Bus. Ethics 2016, 150, 135–157. [Google Scholar] [CrossRef]
  68. Stürmer, T.; Joshi, M.; Glynn, R.J.; Avorn, J.; Rothman, K.J.; Rothman, K.J.; Schneeweiss, S. A review of the application of propensity score methods yielded increasing use, advantages in specific settings, but not substantially different estimates compared with conventional multivariable methods. J. Clin. Epidemiol. 2006, 59, 437–447. [Google Scholar] [CrossRef] [PubMed]
  69. Ding, Y.; Zhang, H.; Zhang, J. Private vs. state ownership and earnings management: Evidence from Chinese listed companies. Corp. Gov. 2010, 15, 223–238. [Google Scholar] [CrossRef]
  70. Degeorge, F.; Patel, J.; Zeckhauser, R. Earnings management to exceed thresholds. J. Bus. 1999, 72, 1–33. [Google Scholar] [CrossRef]
  71. Jiang, G.; Wang, H. Should earnings thresholds be used as delisting criteria in stock market? J. Account. Public Policy 2008, 27, 409–419. [Google Scholar] [CrossRef]
  72. Li, Y.; Niu, J.; Zhang, R.; Largay, J.A. Earnings Management and the Accrual Anomaly: Evidence from China. J. Int. Financ. Manag. Account. 2011, 22, 205–245. [Google Scholar] [CrossRef]
  73. Li, F. Endogeneity in CEO power: A survey and experiment. Investig. Anal. J. 2016, 45, 149–162. [Google Scholar] [CrossRef]
  74. Dang, C.Y.; Li, Z.C.; Yang, C. Measuring firm size in empirical corporate finance. J. Bank. Financ. 2018, 86, 159–176. [Google Scholar] [CrossRef]
Figure 1. Corporate foundations and earnings management.
Sustainability 10 03991 g001
Figure 2. Histogram of Earnings.
Sustainability 10 03991 g002
Table 1. Descriptive statistics of variables.
VariablesMeanSDMinMedianMax
Founder firm variables
String3.1232.416037
DA−0.0190.147−2.134−0.0030.333
DDEs−0.1125.204−29.471.05617.77
Cash0.1480.1140.0010.1170.62
ROA0.0340.072−0.250.0290.467
Taxrate0.1910.306−1.8050.2180.907
Corporate foundation variables
Payins0.9802.68400.96519.05
Payouts0.8821.66800.23411.87
FNA7.3117.1701.809129.9
Nincome0.0890.2640.0580.2181.552
GovGrants0.0020.01500.0310.13
Otherincome0.0720.27200.0211.841
AdExpenses0.010.02500.0040.153
Salaries0.0080.02600.0020.172
Resvere5.3275.65503.97332.462
Note: The details of measurements and definitions of all the variables are reported in Table A1 in the Appendix A.
Table 2. Pearson correlation matrix.
Foundation VariablesPayinsPayoutsFNANincomeGovGrantsOtherincomeAdExpensesSalaries
Payins1
Payouts0.160 ***1
FNA−0.037 **0.273 ***1
Nincome−0.018 *0.205 ***0.154 ***1
GovGrants−0.0060.056−0.007−0.0161
Otherincome−0.015 *0.165 ***0.0190.0290.0121
AdExpenses0.0010.079 *−0.0040.071 **−0.0060.0511
Salaries0.0020.118 ***−0.013−0.0120.0090.026−0.130 ***1
Firm variablesStringDDEsDASNISOE
String1
DDEs−0.0541
DA−0.088 **0.062 *1
SNI−0.0680.0110.625 ***1
SOE−0.104 **−0.079 *0.032−0.0171
Note: Please see Table A1 in Appendix A for variables definitions. ***, **, and * represent 1%, 5%, and 10% levels of significance, respectively.
Table 3. The estimation results of logit models.
VariablesModel 1Model 2Model 3Model 4
Size0.562 ***0.486 ***0.480 ***0.482 ***
(6.083)(4.708)(4.656)(4.659)
Cash0.212 ***0.185 **0.181 **0.183 **
(2.805)(2.327)(2.281)(2.287)
Customer0.249 *0.0340.120
(1.876)(0.047)(0.906)
SOE−0.845 ***−0.708 ***−0.717 ***−0.727 ***
(−6.760)(−5.599)(−5.783)(−5.793)
Herfindal−0.110
(−0.202)
Tobinq0.096 ***0.117 ***0.117 ***0.118 ***
(3.012)(3.570)(3.585)(3.588)
Dual−0.705 ***−0.688 ***−0.677 ***−0.672 ***
(−4.332)(−4.206)(−4.147)(−4.149)
Indep−2.476 **−3.039 ***−2.554 **−2.354 **
(−2.237)(−2.706)(−2.478)(−2.387)
Advert2.761 ***2.971 ***2.965 ***2.865 ***
(4.697)(4.598)(4.587)(4.487)
Employee0.093 *0.189 ***0.181 ***0.184 ***
(1.647)(2.960)(2.838)(2.738)
First0.015 ***0.012 **0.012 **0.014 **
(3.032)(2.364)(2.371)(2.376)
Contral−0.018 ***−0.016 ***−0.016 ***−0.017 ***
(−3.599)(−3.180)(−3.141)(−3.148)
Msh1.029 *1.149 **1.134 **1.124 **
(1.924)(2.118)(2.092)(2.192)
Audit0.239 ** 0.235 *0.232 *
(1.966) (1.895)(1.885)
List−0.012 *−0.016 **−0.017 **−0.016 **
(−1.707)(−2.164)(−2.134)(−2.130)
Region0.1240.180 * 0.183 *
(1.210)(1.743) (1.769)
IndustryControlControlControlControl
_cons−19.253 ***−17.722 ***−18.169 ***−18.579 ***
(−14.483)(−11.919)(−13.916)(−13.900)
Observations16,07316,07316,07316,073
Pseudo-R20.1630.1760.1740.182
AUC0.7930.8020.8090.813
Note: The dependent variable is “Establish,” which is a dummy variable that equals one if the firm establishes a corporate foundation and zero otherwise. ***, ** and * represent significance at 1%, 5%, and 10% level, respectively, with t-values in parentheses.
Table 4. Comparison of ATTs.
VariableSampleTreated GroupControl GroupATTs.e.t-Value
Nearest-Neighbor Matching (Matching Number is 3)
Discretionary AccrualsPre-matching−0.0120.0013−0.01330.0052−2.53 **
Post-matching−0.012−0.0005−0.01150.0058−1.97 **
Radius Matching (Matching Radius is 0.005)
Discretionary AccrualsPre-matching−0.0120.0013−0.01330.0052−2.53 **
Post-matching−0.0122−0.0017−0.01050.005−2.07 **
Kernel Matching (Matching Coefficient is 0.01)
Discretionary AccrualsPre-matching−0.0120.0013−0.01330.0052−2.53 **
Post-matching−0.0117−0.0013−0.01040.0049−2.10 **
Note: “Pre-matching” refers to the sample without matching the Treated group with the Control group and “Post-matching” refers to the sample after matching. “Treated group” and “Control group” refer to firms with and without corporate foundations. ** represents significance at 5% level. Standard errors are calculated using bootstrap with 500 replications.
Table 5. The impact of ownership property on earnings management of founder firms.
VariableSampleState-Owned SubgroupPrivately-Owned Subgroup
TreatedControl ATTt-ValueTreated ControlATTt-Value
Nearest-neighbor matching (matching Number is 3)
Discretionary AccrualsPre-matching−0.0069−0.0056−0.0013−0.16−0.0150.0112−0.026−3.02 ***
Post-matching−0.0069−0.0038−0.0031−0.38−0.0150.0067−0.022−2.75 ***
Radius matching (matching radius is 0.005)
Discretionary AccrualsPre-matching−0.0069−0.0056−0.0013−0.16−0.0150.0061−0.021−3.02 ***
Post-matching−0.003−0.00840.00540.8−0.01620.004−0.02−2.82 ***
Kernel matching (matching coefficient is 0.01)
Discretionary AccrualsPre-matching−0.0069−0.0056−0.0013−0.16−0.0150.0061−0.021−3.02 ***
Post-matching−0.0069−0.00820.00130.19−0.01520.0019−0.017−2.48 **
Note: ***, ** represent significance at 1%, 5% level, respectively. Standard errors are calculated by using bootstrap with 500 replications.
Table 6. Discretionary donation expenditures in portfolios.
SNInMean DDEsIncome Increasing %Test of DDEs = 0
(p-Value)
>0.10660.38825.760.165
0.07 to 0.10520.1936.540.643
0.05 to 0.07 810.24832.090.337
0.04 to 0.0552−0.22526.920.617
0.03 to 0.0469−0.25634.780.283
0.02 to 0.0356−0.86935.710.094 *
0.01 to 0.02600.38734.610.232
0 to 0.0178−0.88548.330.048 **
−0.01 to 015−0.00133.330.299
<−0.0146−0.69136.950.201
p-value 0.089 *
Note: The last column reports the p-values from a two-sided t-test of whether DDEs for each portfolio equals zero. The bottom row reports p-value of the difference of DDEs between the portfolios with small profits (0 < SNI < 0.01) and small losses (−0.01 < SNI < 0). The fourth column is calculated by the number of firms with negative DDEs divided by the total number of firms in the portfolio. ** and * represent significance at 5% and 10% level, respectively.
Table 7. Discretionary donation expenditures based on strings of consecutive increases in earnings.
Small Earnings Increasing Founder FirmsnMean DDEsIncome Increasing %
String ≥ 5 years40−2.20752.5
String < 5 years981.05626.53
p-value 0.001 ***
String ≥ 4 years54−0.7946.3
String < 4 years840.68926.19
p-value 0.065 *
String ≥ 6 years26−1.03646.15
String < 6 years1120.37631.25
p-value 0.044 **
Note: ***, ** and * represent significance at 1%, 5%, and 10% level, respectively. p-value is t-test of the difference of DDEs between the portfolios with long and short earnings strings.
Table 8. Regression results of string length and discretionary donation expenditures.
VariableModel 1Model 2Model 3
Payoutst1.324 ***1.320 ***1.324 ***
(8.565)(8.547)(8.56)
Payoutst+10.589 ***0.589 ***0.587 ***
(5.379)(5.388)(5.359)
FNAt−1−0.283 ***−0.284 ***−0.284 ***
(−11.494)(−11.983)(−11.433)
Nincomet−4.451 ***−4.392 ***−4.469 ***
(−6.772)(−6.678)(−6.803)
GovGrantst−7.704 ***−7.528 ***−7.626 ***
(−3.392)(−3.317)(−3.348)
Otherincomet−1.082 **−1.149 **−1.086 **
(−1.992)(−2.112)(−1.999)
AdExpensest8.850 **9.058 **8.856 **
(2.447)(2.506)(2.448)
Salariest16.478 ***16.138 ***16.245 ***
(4.388)(4.313)(4.318)
Taxratet0.341 **0.357 **0.346 **
(2.315)(2.427)(2.348)
ROAt−0.006−0.01−0.007
(−0.104)(−0.168)(−0.111)
Casht0.7110.1650.46
(0.292)(0.068)(0.189)
Above−0.325 ** −0.56
(−2.485) (−0.52)
String −0.163−0.138
(−1.375)(−1.02)
Above * String −0.037 **
(−2.10)
_cons−1.972 ***−1.306 **−1.824 ***
(−3.808)(−2.088)(−3.649)
YearYesYesYes
IndustryYesYesYes
Observations653653653
Adjusted R20.6560.6490.658
Note: ***, ** and * represent significance at 1%, 5%, and 10% level, respectively. T statistics are reported in parentheses.
Table 9. Discretionary donation expenditures and reserve creation.
Panel A
DDEs RanknMean DDEsMedian DDEs2 Years String %3 Years String %Median ΔNIMean ΔNI
Low1121.0771.31127.6814.290.0010.041
High1123.2292.30635.7224.110.0150.122
p-value (High > Low)0.097 *0.086 *
Panel B
DDEs Rank3 Years String nMean ReservetMean Reservet+1Mean Reservet+2Mean Reservet+3
LowNo443.6874.8093.1147.298
LowYes202.4273.8422.0453.478
HighNo405.8734.8093.0988.203
HighYes235.3274.4394.1314.063
Note: This table only includes founder firms that make positive discretionary donation expenditures in the current year. p-value is the t-test of the difference of string between the groups with high and low discretionary donation expenditures. * represents significance at 10% level.

