Article

Low-Emission Modeling for Energy Demand in the Household Sector: A Study of Pakistan as a Developing Economy

College of Earth & Environmental Sciences, University of the Punjab, Lahore 54590, Pakistan
*
Author to whom correspondence should be addressed.
Sustainability 2018, 10(11), 3971; https://doi.org/10.3390/su10113971
Submission received: 14 September 2018 / Revised: 24 October 2018 / Accepted: 25 October 2018 / Published: 31 October 2018

Abstract

:
In the developing world, the energy needs of the household sector have grown manifold, due to rapid urbanization and the introduction of affordable technology. However, constraints in the power supply and underutilization of renewable resources, coupled with inefficient fuel use and obsolete technology, have increased the average energy usage cost and emissions. Hence, the current study provides a long-term sustainable energy management plan for the urban household, in terms of energy savings, social cost, and greenhouse gas (GHG) mitigation. To address energy security and climate change challenges, a demand-side management scenario (DSM) is proposed through integration of efficient policies and nationally determined contributions. On the basis of policy analysis and energy consumption patterns, macro-economic modeling was carried out for the period 2011–2050, using the Long-range Energy Alternative Planning (LEAP) modeling tool. Results show that the “efficient water heating” scenario offers the maximum energy-saving potential (up to 270 M.TOE) whereas “efficient space cooling” is the lowest-cost scenario. To achieve the best-fit mitigation scenario (MIT), targets for renewable energy supply were also incorporated. Findings were weighed against the reference scenario (REF), which reveals a huge GHG reduction under the DSM. Moreover, the cost required to implement MIT is estimated to be 3.4 US $/tonne of carbon dioxide-equivalent, less than the REF.

1. Introduction

Rapid urbanization and the desire for luxurious lifestyles have increased energy demand in the household. The situation is most apparent in the developing world, due to growing energy needs of an increasing population. The future of world energy hence relies upon developing countries, especially those in Sub-Saharan Africa and Asia. Among these countries, Pakistan has one of the highest electrification rates [1]. However, more than a quarter of its population does not have access to modern energy. Moreover, the rate of access to clean cooking fuels and technologies is only 43.32% [2].
Currently, out of a total 32.205 million households in Pakistan, 12.192 million are urban. The major share of the electricity and natural gas supply is consumed by urban households [3,4]. However, these resources remain supply-constrained, due to multiple factors that have compromised the sustainability of energy systems. While growing energy consumption is a positive indicator for the economy, it is also responsible for increased greenhouse gas (GHG) and particulate emissions.
As per global estimates, indoor air pollution from the use of unsafe cooking fuel and inefficient appliances causes 4 million causalities annually [5]. Such low consideration towards clean energy is directly linked to global environmental quality. The International Energy Agency (IEA) estimated that carbon dioxide emissions from non-Annex I countries will exceed Annex-I’s by 61% in 2030 [6]. A country analysis of GHG emission from 1994 to 2015 indicates that the energy sector is responsible for 51% of the total emissions from Pakistan. These emissions rose from 85.8 million tonnes of carbon dioxide equivalent (M.T.CO2e) in 1994 to 185.97 M.T.CO2e in 2015 [7].
According to the World Bank 2018 estimates, energy conservation and efficiency in households can reduce energy needs by 15% [2]. Many developing nations started implementing demand-side management, energy efficiency, and renewable energy initiatives during the 1970s. In the case of Pakistan, the only step taken was the formulation of the Renewable Energy Policy in 2006, with few outcomes up until now.
The consequent power crisis in Pakistan caused prolonged load-shedding. This directly impacted the economy and societal peace. To deal with supply shortfall, different short-term efforts were made by government. These efforts included an increase in indigenous fuel supplies, varying fuel imports, and encouraging inter-regional collaborations like the China–Pakistan Economic Corridor (CPEC). This resulted in considerable cuts in the frequency of load-shedding in urban areas—i.e., 6 h during 2015–2016 compared to 12 h in 2013 [8].
Studies from developing countries have identified various factors affecting energy demand in households [9,10,11,12,13,14,15]. The main factors that have been identified are agro-climatic set-up, socio-economic conditions, literacy, gender roles, religion, and psychological factors. Other variables include consumer choice, lack of efficiency standards for electric goods, employment, safety risks, social acceptability, reliability, and resource potential. In addition to these, policy design and governmental roles also play a significant part in determining fuel inequity and equipment availability among different income groups. Figure 1 shows the factors affecting the uncontrolled rise in the energy demand of the urban household sector of Pakistan.
The importance of considering the household sector in overall energy planning and emissions policies is evident from a literature review. Various energy models are being used worldwide to explore energy systems’ sustainability. However, their applicability and outcomes differ from local to regional, developed to developing economies, time horizon, energy importers to producers, technique used, data requirement, level of disaggregation, and validation. The models are also influenced by planners’ own interests and uncertainties related to modeling techniques [16,17]. One such energy model is the Long-range Energy Alternative Planning (LEAP) tool, which has been applied in numerous studies of developing countries to explore energy transition pathways and GHG assessments [18].
Various international studies have assessed the benefits of household energy optimization through the integration of renewable options, energy storage systems, load scheduling, etc. Benefits include high-performance smart grids, reducing the demand–supply gap, and CO2 mitigation [19,20,21,22,23,24,25,26,27,28]. The mitigation plan of Pakistan’s Nationally Determined Contributions also emphasizes the potential of energy savings in the residential sector [29]. However, no local or community level disaggregated plan exists for the sustainable management of energy demand in the household sector of Pakistan.
With the aim of controlling excessive energy demand and consumption in the household, the current study provides a long-term energy demand side management plan for the household sector of Pakistan. This includes sustainable policies that represent Nationally Determined Contributions (NDCs), a mix of efficient and conventional technologies, and targets for renewable energy. By using the LEAP modeling tool, proposed policies were analyzed in terms of socioeconomic value and GHG emissions. The findings were further optimized to reach a final mitigation scenario for the study period 2012–2050. Consideration of socioeconomic and climate change variables makes this study applicable to other developing economies in achieving their NDCs related to the energy–GHG nexus.

2. Materials and Methods

A detailed review of the energy policies of Pakistan and international energy sector reports formed the basis of this study. To determine the current domestic energy consumption patterns in Pakistan, the findings of the Pakistan Social and Living Standards Measurement (PSLM) survey reports [30] were used. In Pakistan, most of the population belongs to the middle income level. Therefore, the energy demand of a common middle-income urban household was chosen in this study to represent the energy needs of the highest proportion of households.

2.1. Mathematical Calculations

To carry out the simulation and optimization functions, bottom-up energy modeling software LEAP was selected, due to its strong accounting and evaluation capabilities. The base and end years of the study were selected as 2011 and 2050, respectively. The database acquired for energy modeling is detailed in Table 1. This data was statistically aligned and converted into time-series data.
The annual energy demand of existing and proposed technologies was calculated as follows:
Ef = ∑ ∑ Am,h,f × Im,h,f
h m
where E is the final energy demand, A represents the activity level, I is the energy intensity, f is the fuel type, h represents the sector, and m is the appliance.
Emission analysis of existing household appliances and proposed technologies was carried out using the in-built “Technology and Environmental Database” of LEAP. The carbon emissions of all fuel groups were calculated as follows:
C = ∑ ∑ ∑ Af,m,h × EIf,m,h × EFf,m,h
h m f
where C represents carbon emissions and EF is the carbon emissions factor.

2.2. Construction of Energy Policy Scenarios

This paper conducted extensive policy review [3,4,7,30,31,32,33,34,35,36,37,38,39] while considering the maximum variables of energy demand. These variables can be broadly classified into climatic and socioeconomic conditions, fuel prices, energy consumption patterns, trends in use of household energy appliances, cost of the technology used, technological performance, and emissions factors. Details of these scenarios are as follows.

2.2.1. Reference Scenario (REF)

Based upon the following hypotheses, the current and historical database was projected from the base year of study (2011) to the end year (2050), using extrapolation and growth rate functions:
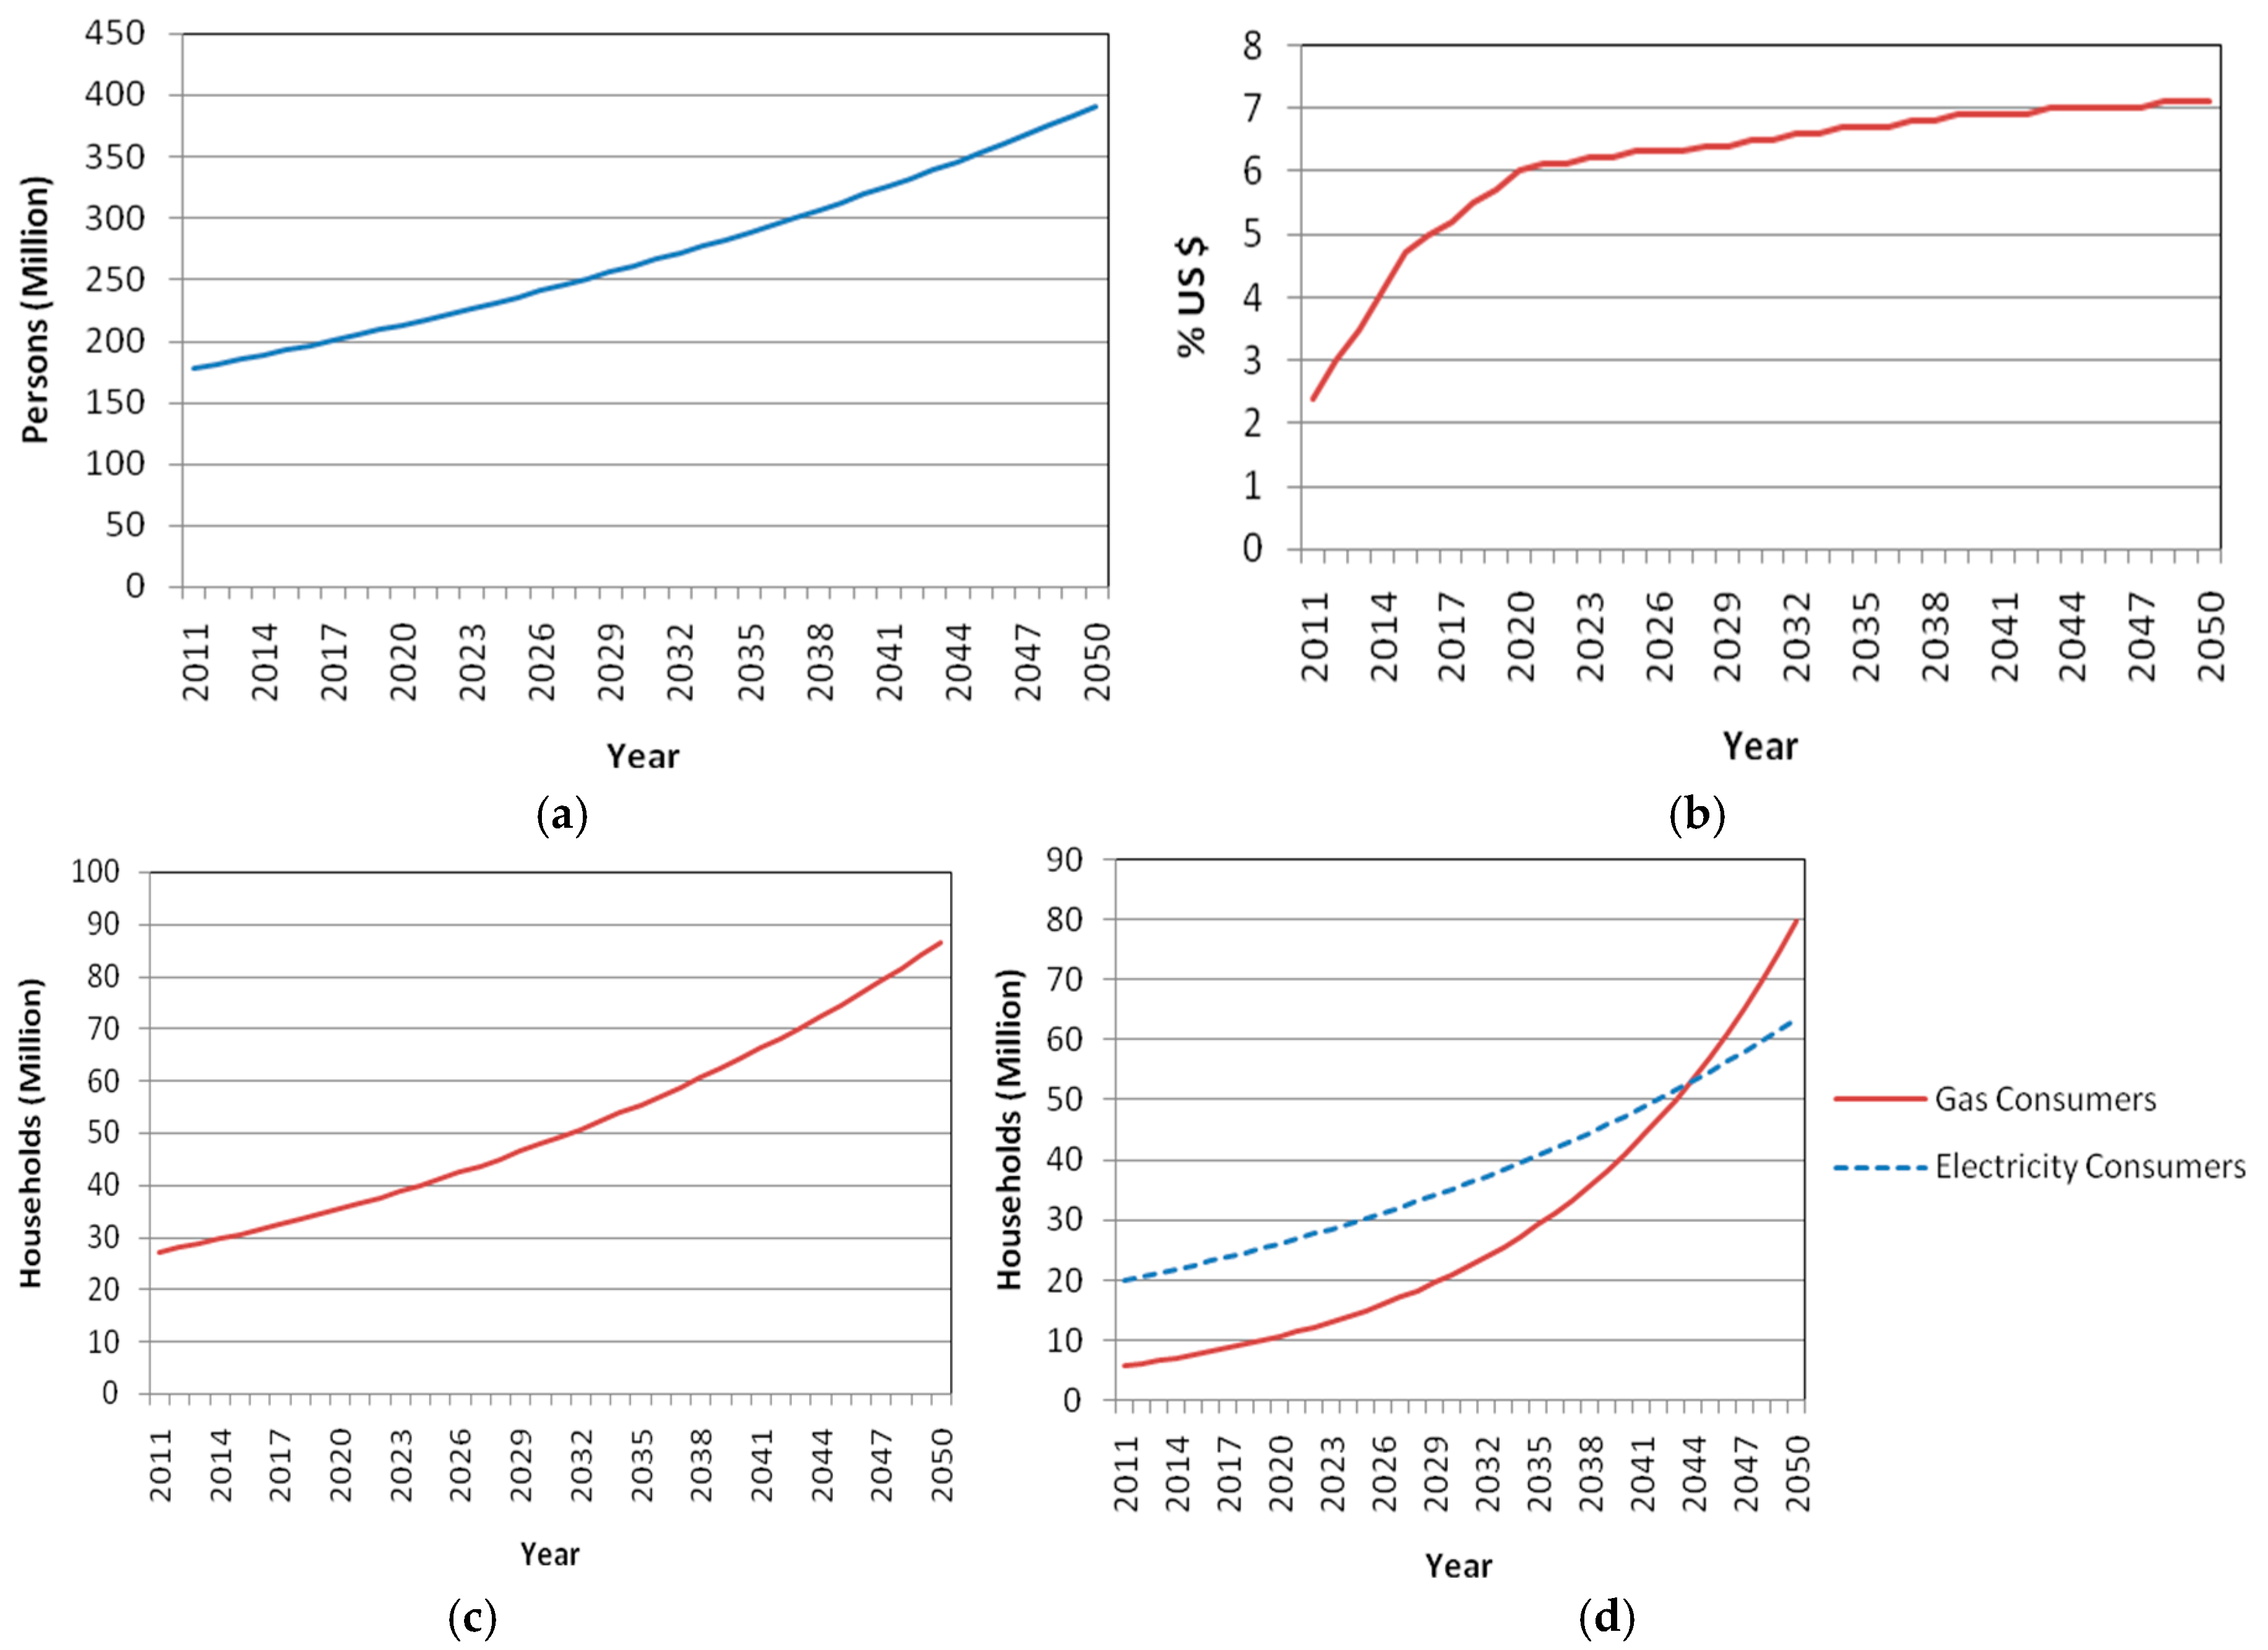
  • Rapid urbanization and excessive population growth in developing countries has resulted in haphazard and unplanned growth of big-city settlements. Under the usual scenario, the urban households are expected to increase at an annual growth rate of 3%.
  • Increased access to electricity and natural gas will gradually decrease biomass and liquefied petroleum gas (LPG) consumption.
  • With increasing income levels and government incentives for energy-efficient devices, people will shift toward less energy-intensive devices. This is interpreted as reduced energy intensities of existing devices per household.
  • Transmission and distribution (T&D) losses will decrease.

2.2.2. Demand-Side Management Scenario (DSM)

In this scenario, alternative policies were introduced into the model to explore their potential in comparison with the findings of the REF. These policies are in line with the Nationally Determined Contributions of Pakistan for mitigation across the energy sector. Descriptions of these policies is given in Table 2.

2.2.3. Mitigation Scenario (MIT)

The final scenario, the mitigation scenario (MIT), was developed by linking the findings of REF and DSM and the integration of a new supply-side scenario (SSS). The SSS exhibits existing energy supply in addition to a target of 10% renewable electricity generation by 2025. Hence, MIT is a combination of energy-efficient household devices and renewable energy options from hydel solar, wind, and biomass. Further refining of MIT was done at the “valuation step” by incorporating a cost benefit analysis of those policies.

2.3. Economic Valuation of Scenarios

An integrated cost-benefit analysis of the proposed policies was done from a societal perspective. DSM policies were compared in terms of the costs of proposed technologies, their performance, and penetration in households. The activity cost method was used to calculate annualized demand cost of efficient devices per household over a lifetime. Data on device costs was gathered from a market survey. All calculations were done in cumulative terms, discounted at 5% to the year 2011 value. For cost-benefit analysis of renewable options, plant performance characteristics were evaluated in the model.

3. Results and Discussion

Despite rapid urbanization and accessibility to modern technologies, about 1.3 billion people in the developing world still lack access to electricity. Additionally, 2.5 billion people lack access to safe cooking fuels [40]. However, more than 80% of the power generated dissipates due to irresponsible consumer behavior [41].
The past several years of planned and unplanned electricity and gas load-shedding has affected the economy and society of Pakistan. The consequences are huge in the urban household sector, which is expanding at an annual growth rate of 2.4% with average size of 6.45 persons. This calls for immediate measures to meet the energy needs of the urban household sector. However, such measures must be sustainable, and recognize all aspects of residential energy demand.
Hence, this study was undertaken with the aim of proposing an efficient and effective demand-side management plan for adoption into the policy-making of Pakistan. It has been observed that primary electricity demand comes from lighting, cooling, and electrical goods. Cooking and heating consumes natural gas and liquefied petroleum gas (LPG). Accordingly, a demand-side framework is designed in Figure 2.
In order to analyze and forecast energy demand of urban households, along with related emissions under alternative policy strategies, the LEAP model was used. This energy model has been applied by many countries to study energy transition and determine policies. Some of its applications in developing countries include India, Iran, Thailand, China, Mongolia, Panama, Korea, and nations in Africa [42,43,44,45,46,47,48,49]. In Pakistan, LEAP has been applied in some studies at the city and national levels [50,51,52,53,54,55]. However, no single study has been undertaken to explore the energy-saving potential of the household sector in Pakistan, and in many developing countries.

3.1. Results of Reference Scenario

While determining the cause of increasing energy demand, numerous studies highlight income level as a key determinant of energy transition in households. Studies conducted in the urban residential sector of China, India, South Africa, Zimbabwe, and other African countries also identify various sub-variables associated with the income factors that determine final energy usage [56,57,58,59,60]. The objective of such studies is low-cost energy supply though optimization techniques. Similarly, most of the studies conducted in Pakistan focus on the energy demand forecast and economic growth [61,62,63,64,65,66,67,68,69,70,71,72,73].
More recent studies suggest that income is an important variable, but its key reliance on achieving a sustainable demand-side system is irrational [74,75,76,77]. These studies highlight the importance of institutional, social, and environmental aspects of energy systems. For instance, evaluation of GHG contribution from household energy usage demonstrates that a 1% rise in per-capita energy usage leads to a 1.65% increase in per-capita carbon emissions [78].
In terms of clean energy, renewable energy constitutes only 2.16% (i.e., 0.6 M TOE CO2) of the total electricity generation in Pakistan. This small proportion is made up of solar (23.6%), bagasse (26.7%), and wind (49.7%) energy resources. The hydropower contribution is only 9.7% (i.e., 7.7 M TOE CO2). On the other hand, energy losses have reached 18% [79]. The government plans to enhance its previous goal of renewable energy allocation from 5% to 15–20% by 2030. It also plans to increase the share of nuclear-based electricity by 8%, which would avoid up to 58.8 M.T.CO2e of GHG emissions by 2030 [29].
Current trends in energy development scenarios explore the implication of future energy consumption and emissions. The findings of the household energy survey were also compared and aligned with the national reports. Some key parameters were integrated into the study, for which the projected results are shown in Figure 3. These projections are built upon the assumptions of the REF.
Results show that in the base year (2011) of the study, out of the total 10.04 million urban households in Pakistan, approximately 9.84 million were electrified consumers that consumed 27,509 GWh of electricity in total. The findings suggest that access to electricity is quite high, but the proportion of consumers using less than 50 units per month is equally high. This depicts unevenness in electricity consumption among different income levels.

3.2. Results of Demand-Side Management Scenario

The Pakistan’s NDCs aim to cut 20% of GHG emissions below its projected 2030 emissions under business-as-usual conditions. To achieve this, targets have been set to increase energy efficiency, at both the energy demand and supply sides. This also involves the introduction of efficient technology in the building sector, in addition to energy standards and labels for household appliances.
As per energy usage trends, power consumed by electric home appliances represents 50% of the total power consumed by domestic and commercial buildings in Pakistan. These appliances are mainly refrigerators, air-conditioners, electric motors, fans, and lighting systems. It is assumed that the introduction of efficient appliances will save energy by 10%, which makes up over 350 MW. The annual percentage load from household devices has been estimated to be 34% from electric lighting, 33% from fan usage, 13% by refrigerators or freezers, 7% by irons, 5% by room air-conditioners, 1% by air coolers, and 7% from miscellaneous uses [80].
Conventional technology and inefficient electronic devices have been successfully phased out from the households of all developed and some developing countries. Similarly, the import and sale of incandescent light bulbs (IBs) is banned in most European countries. The United States’ Clean Energy Act (2007) and the Australian Clean Energy Act (2011) also commit to the replacement of conventional lighting devices with efficient ones. According to a national household survey of Pakistan [81], 40 W fluorescent tube lights (FTLs) with an average of 11 W electromagnetic ballasts are commonly used in Pakistan. Replacing these with 32 W FTLs with ballast losses of 1 W could achieve as much as 80% of the technical savings potential.
With regard to energy efficiency measures in Pakistan, one such step was taken under a USAID program for the distribution of efficient light bulbs among households. However, its benefits were undermined due to prolonged load-shedding, which increased the sale of diesel-run generators, illegal gas compressors, and cheap fuels for household usage. This further increased the average energy usage cost and GHG emissions.
Recently, the World Bank and the German Financial and Technical Development Cooperation planned to provide strategic support for promotion of energy efficiency measures. However, no serious effort has been made until now for the sustainable management of energy demand in the household sector.
In this study, the results of proposed policies under the DSM exhibit a marked decline in energy demand and GHG emissions, compared to the REF (Figure 4 and Figure 5). A major reduction in energy demand was observed for natural gas. This is due to the introduction of efficient water heating appliances and conical baffles. Implementation of this scenario can prevent further exhaustion of natural gas supplies.
Details of energy savings due to the introduction of efficient appliances are presented in Table 3. It has been found out that air conditioner/AC is the second most energy-consumptive device, especially in high-income-level households. However, its replacement with roof insulation technology could save 500 million tonnes of oil equivalent (M.TOE) in year 2050, as compared to the REF.
Pakistan, the second-fastest urbanizing country in South Asia, continues to rank low on Yale’s 2018 Environmental Performance Index. Out of 180 countries, it ranks 169th on the scale of environmental performance and 177th on the environmental health sub-index [82]. In view of the long-term risks from climate change, Pakistan ranks eighth globally with regard to fatal consequences, due to extreme vulnerability. Air pollution alone is accountable for one-fourth of the annual death toll in the country, in addition to associated welfare losses and forgone labor.
As indicated in Figure 5, the alternative policies under the DSM exhibit remarkable potential to successively lower GHG emissions. Figure 5b shows a marked decline of carbon-dioxide non-biogenic emissions, followed by sulfur dioxide and methane emissions. A study of prospective electricity analysis using 450 scenarios also found that a huge reduction in GHG emissions and water-footprint can be achieved through sustainable measures [83]. Therefore, the importance of the pre-assessment of energy policies has been emphasized in many studies for allotting finances to green policies [84].

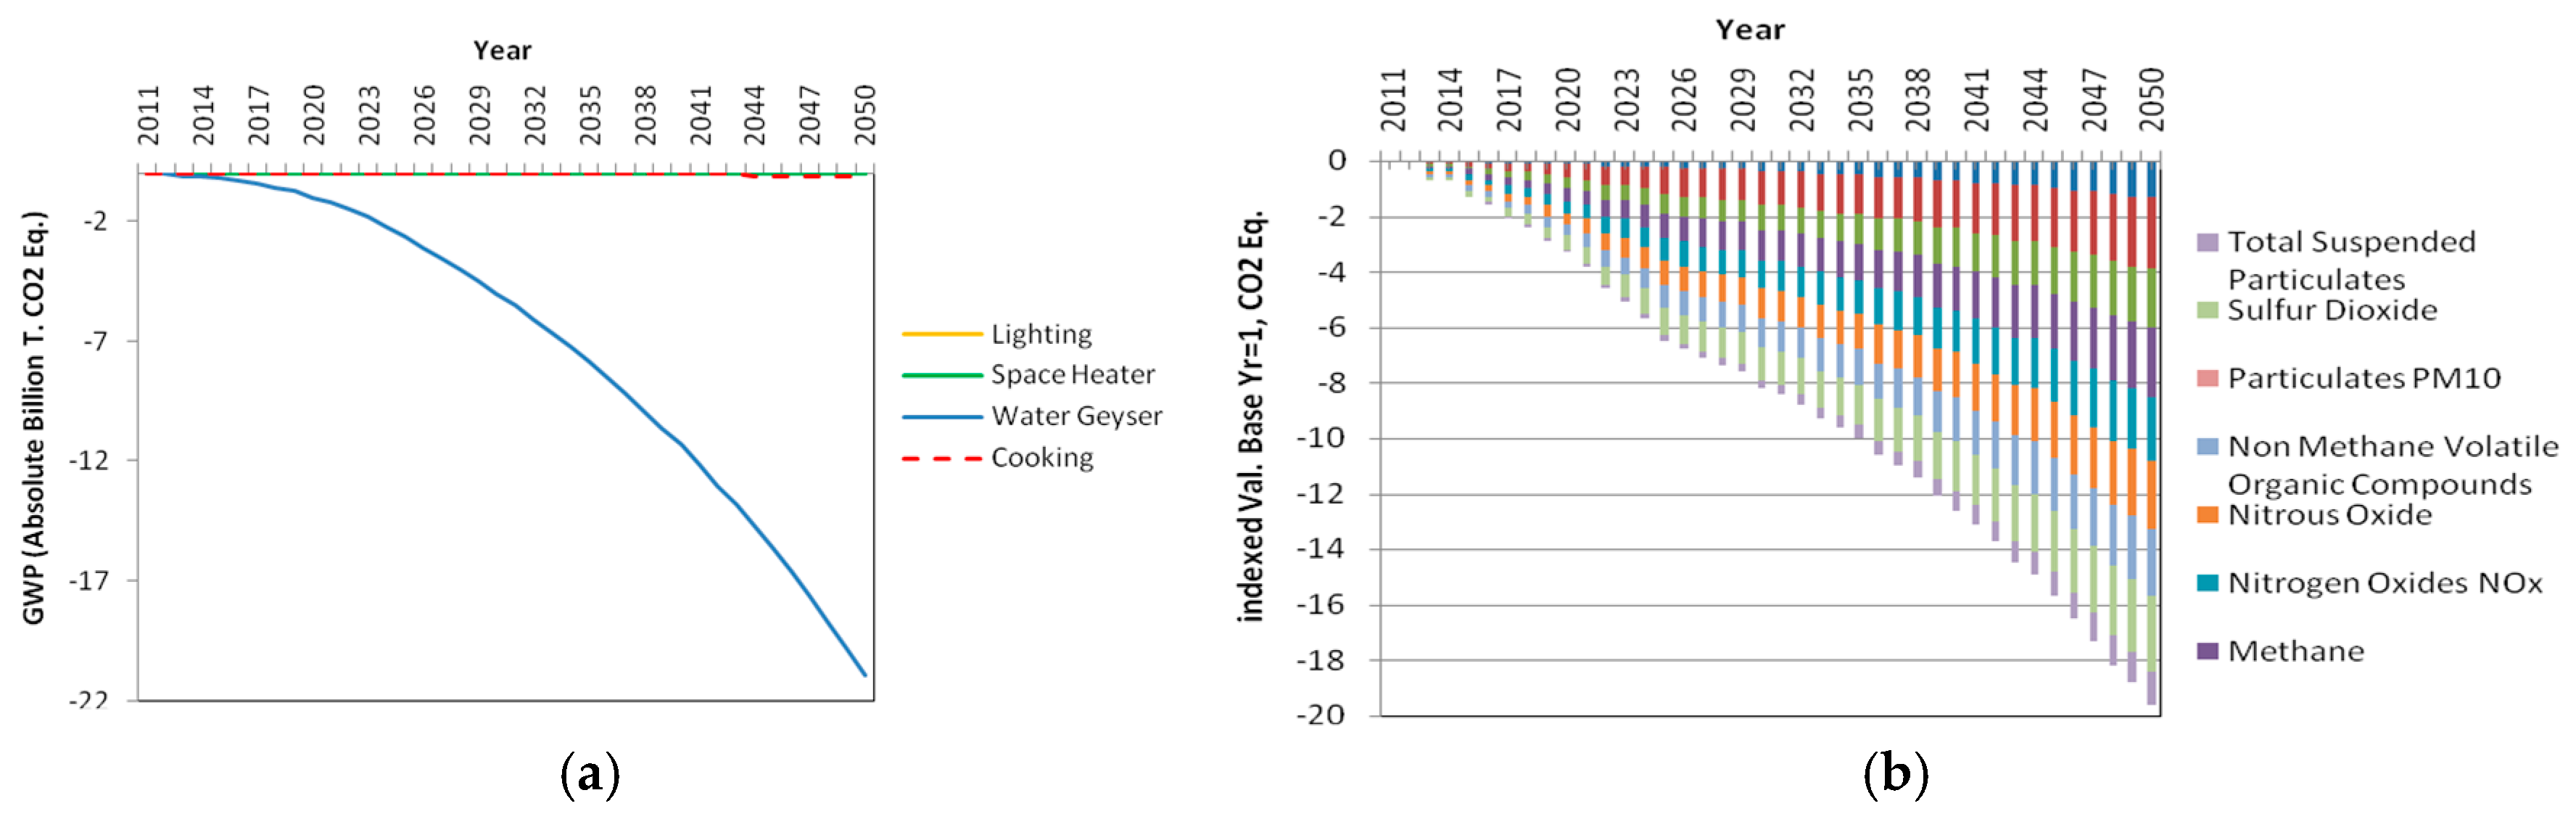
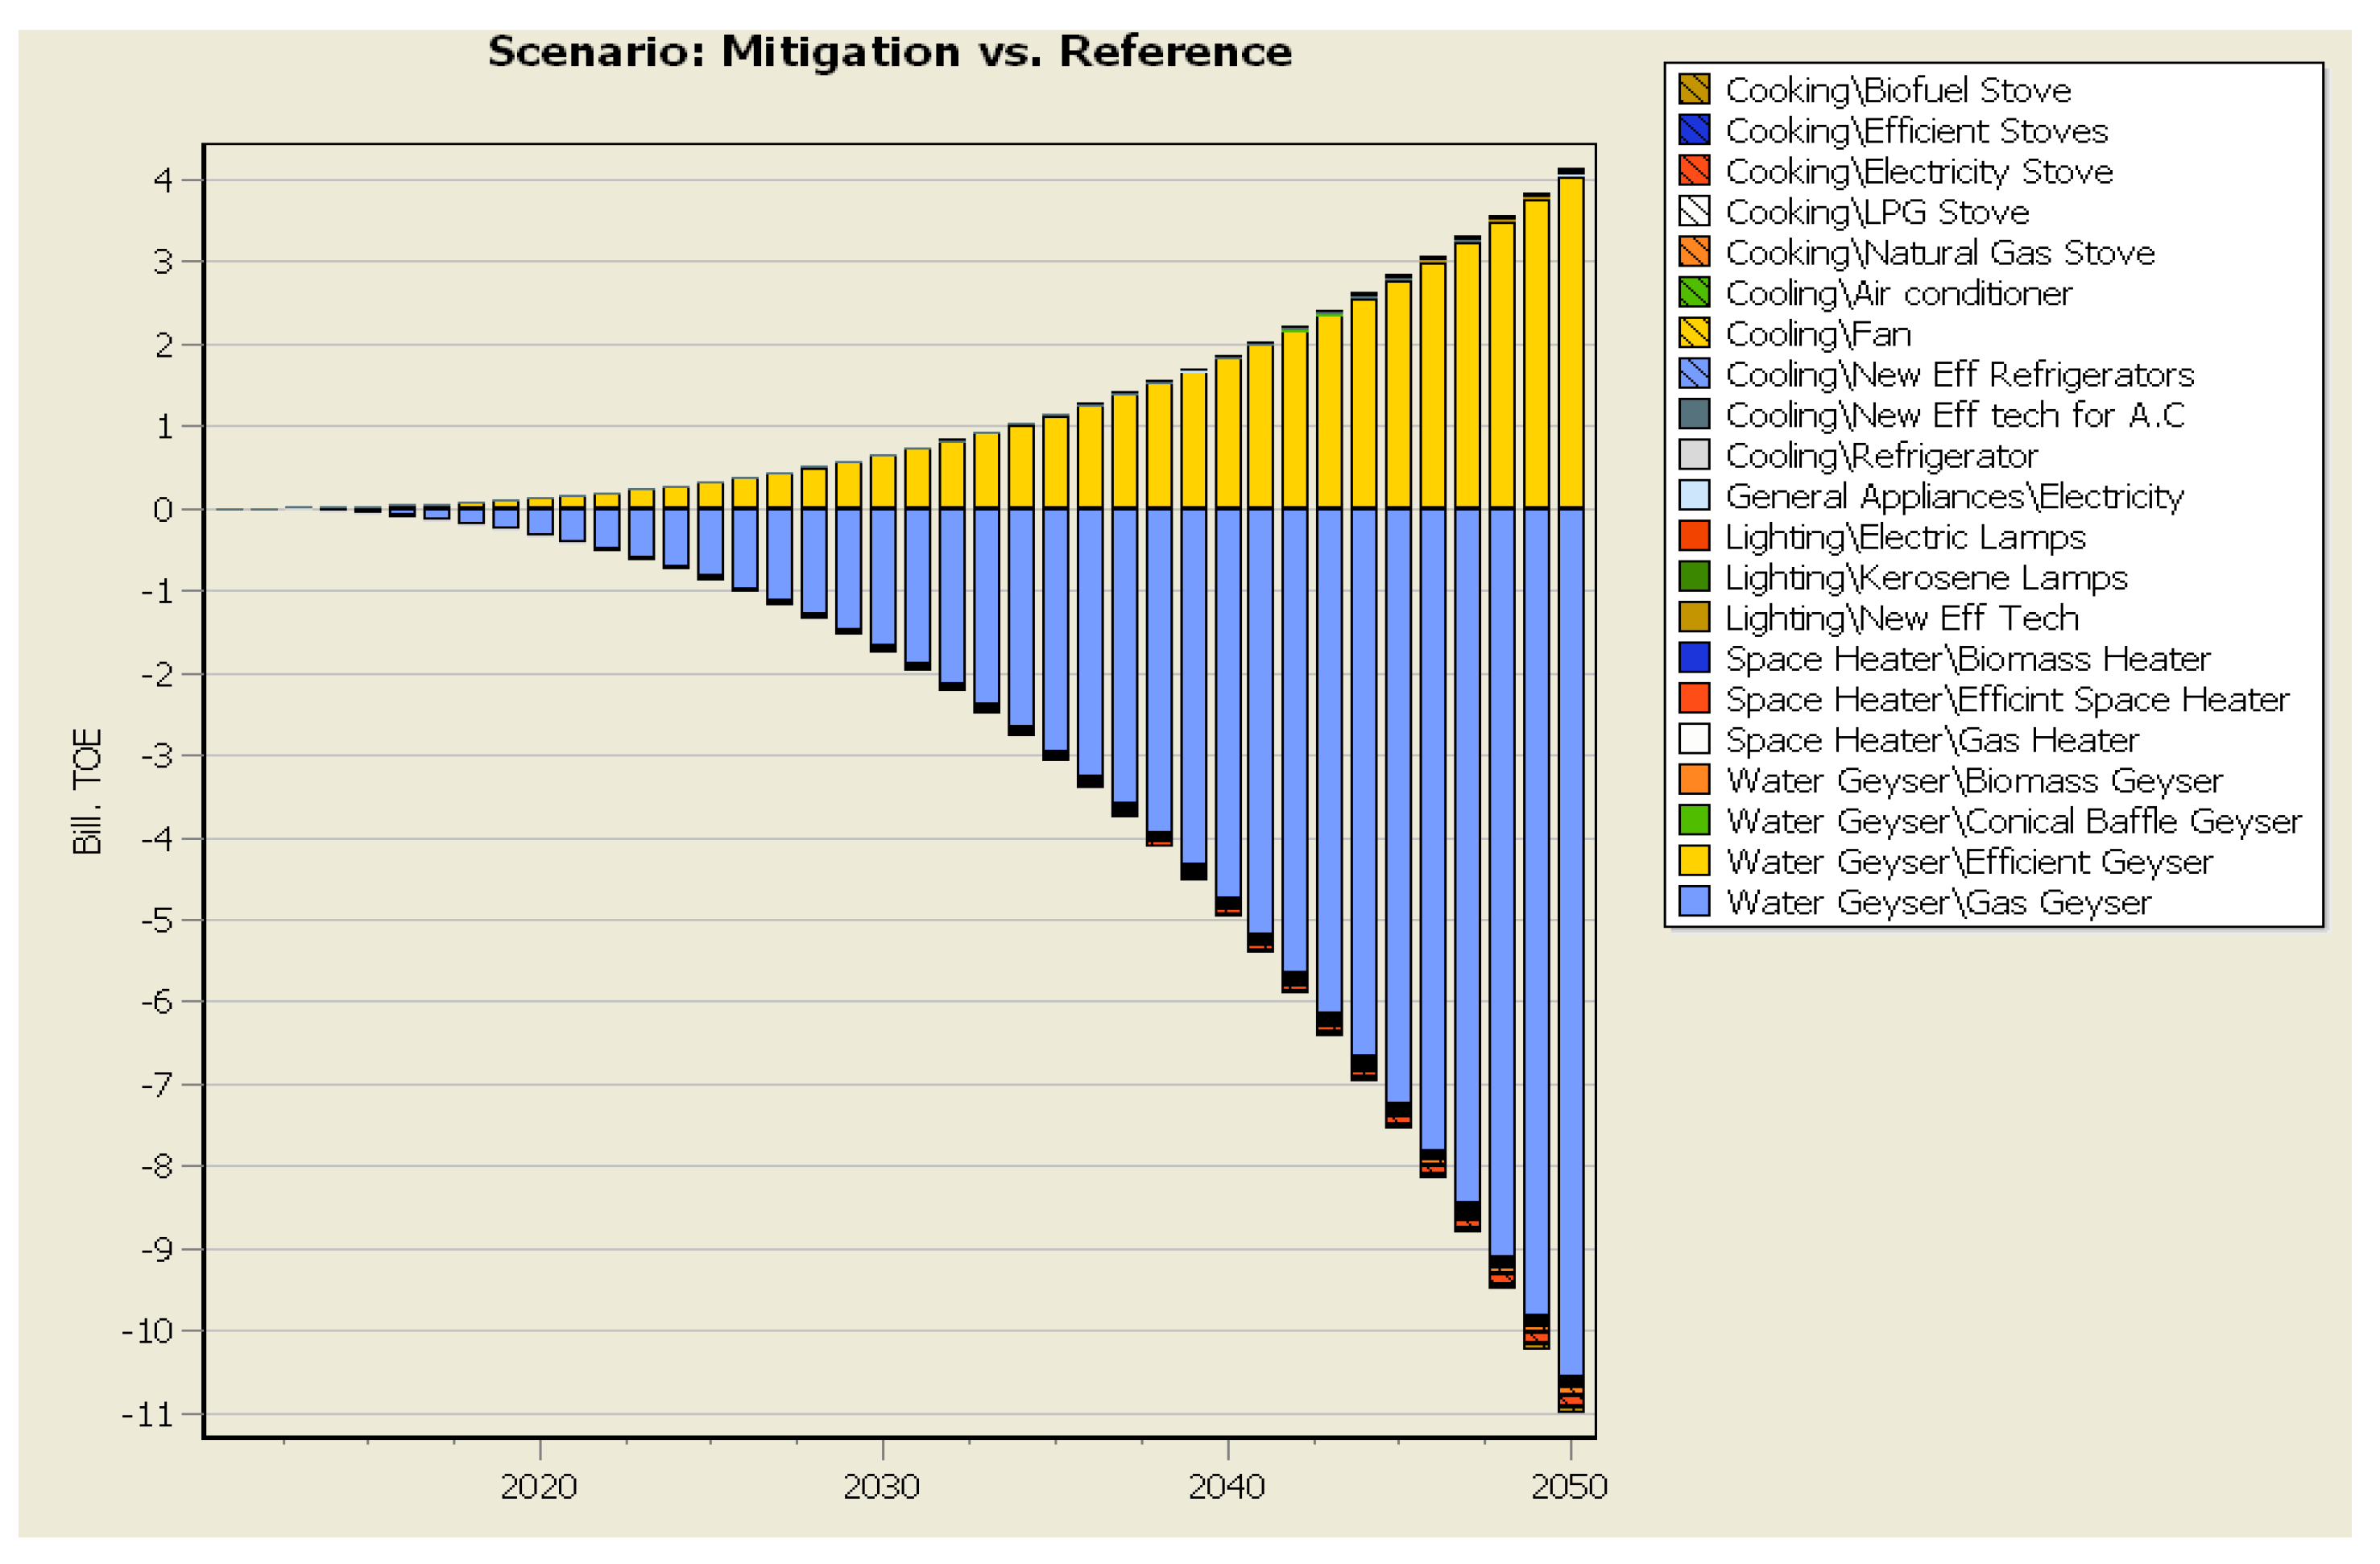
3.3. Results of Mitigation Scenario

The main outcome of this study is the development of a mitigation scenario (MIT) that is best-suited in terms of energy saving, social cost, and GHG emissions. Owing to the vast renewable energy potential in Pakistan, targets for the deployment of renewable energy were also introduced in this scenario. For further refining of the findings of this study, each DSM policy was separately compared with the REF.
Results show that among all of the proposed scenarios, maximum energy saving can be achieved under the “efficient water heating scenario”—i.e., up to 270 M.TOE in year 2050 (Figure 6). In terms of fuel usage, a high potential of natural gas saving is anticipated through the introduction of the “efficient cooking stoves” and “efficient water heaters” scenarios.
Results of a cost–benefit analysis between the DSM and REF show a huge decline of GHG emissions under DSM. In terms of social cost, “efficient space cooling” comes out to be the lowest-cost scenario in 2050, due to roof insulation technology. Figure 7 and Figure 8 show a comparison between the MIT and REF, with regard to social cost and environmental benefits. Implementation of the MIT policy options will not only lift the demand load in the household sector, but also reduce GHG emissions.
In today’s world, the strong relationship between sustainable development and environmental quality has reshaped overall energy planning, analysis, and policy formulation. The importance of the environmental aspect is backed with the historic highs of energy-related emissions, up to 32.5 gigatons in 2017 (i.e., two-thirds of GHGs and 80% of total carbon-dioxide emissions). During this period, the lowest contribution came from the United States, due to high renewable input [2].
However, the crisis needs to be dealt through a long-term integrated approach, in order to eliminate energy poverty and supply–demand gap issues. This can be done through the integration of energy security issues into climate and sustainable development programs. The requirement has also been highlighted in the mitigation plan of Pakistan’s Nationally Determined Contributions, submitted to the United Nations Framework Convention on Climate Change (UNFCCC) [29].

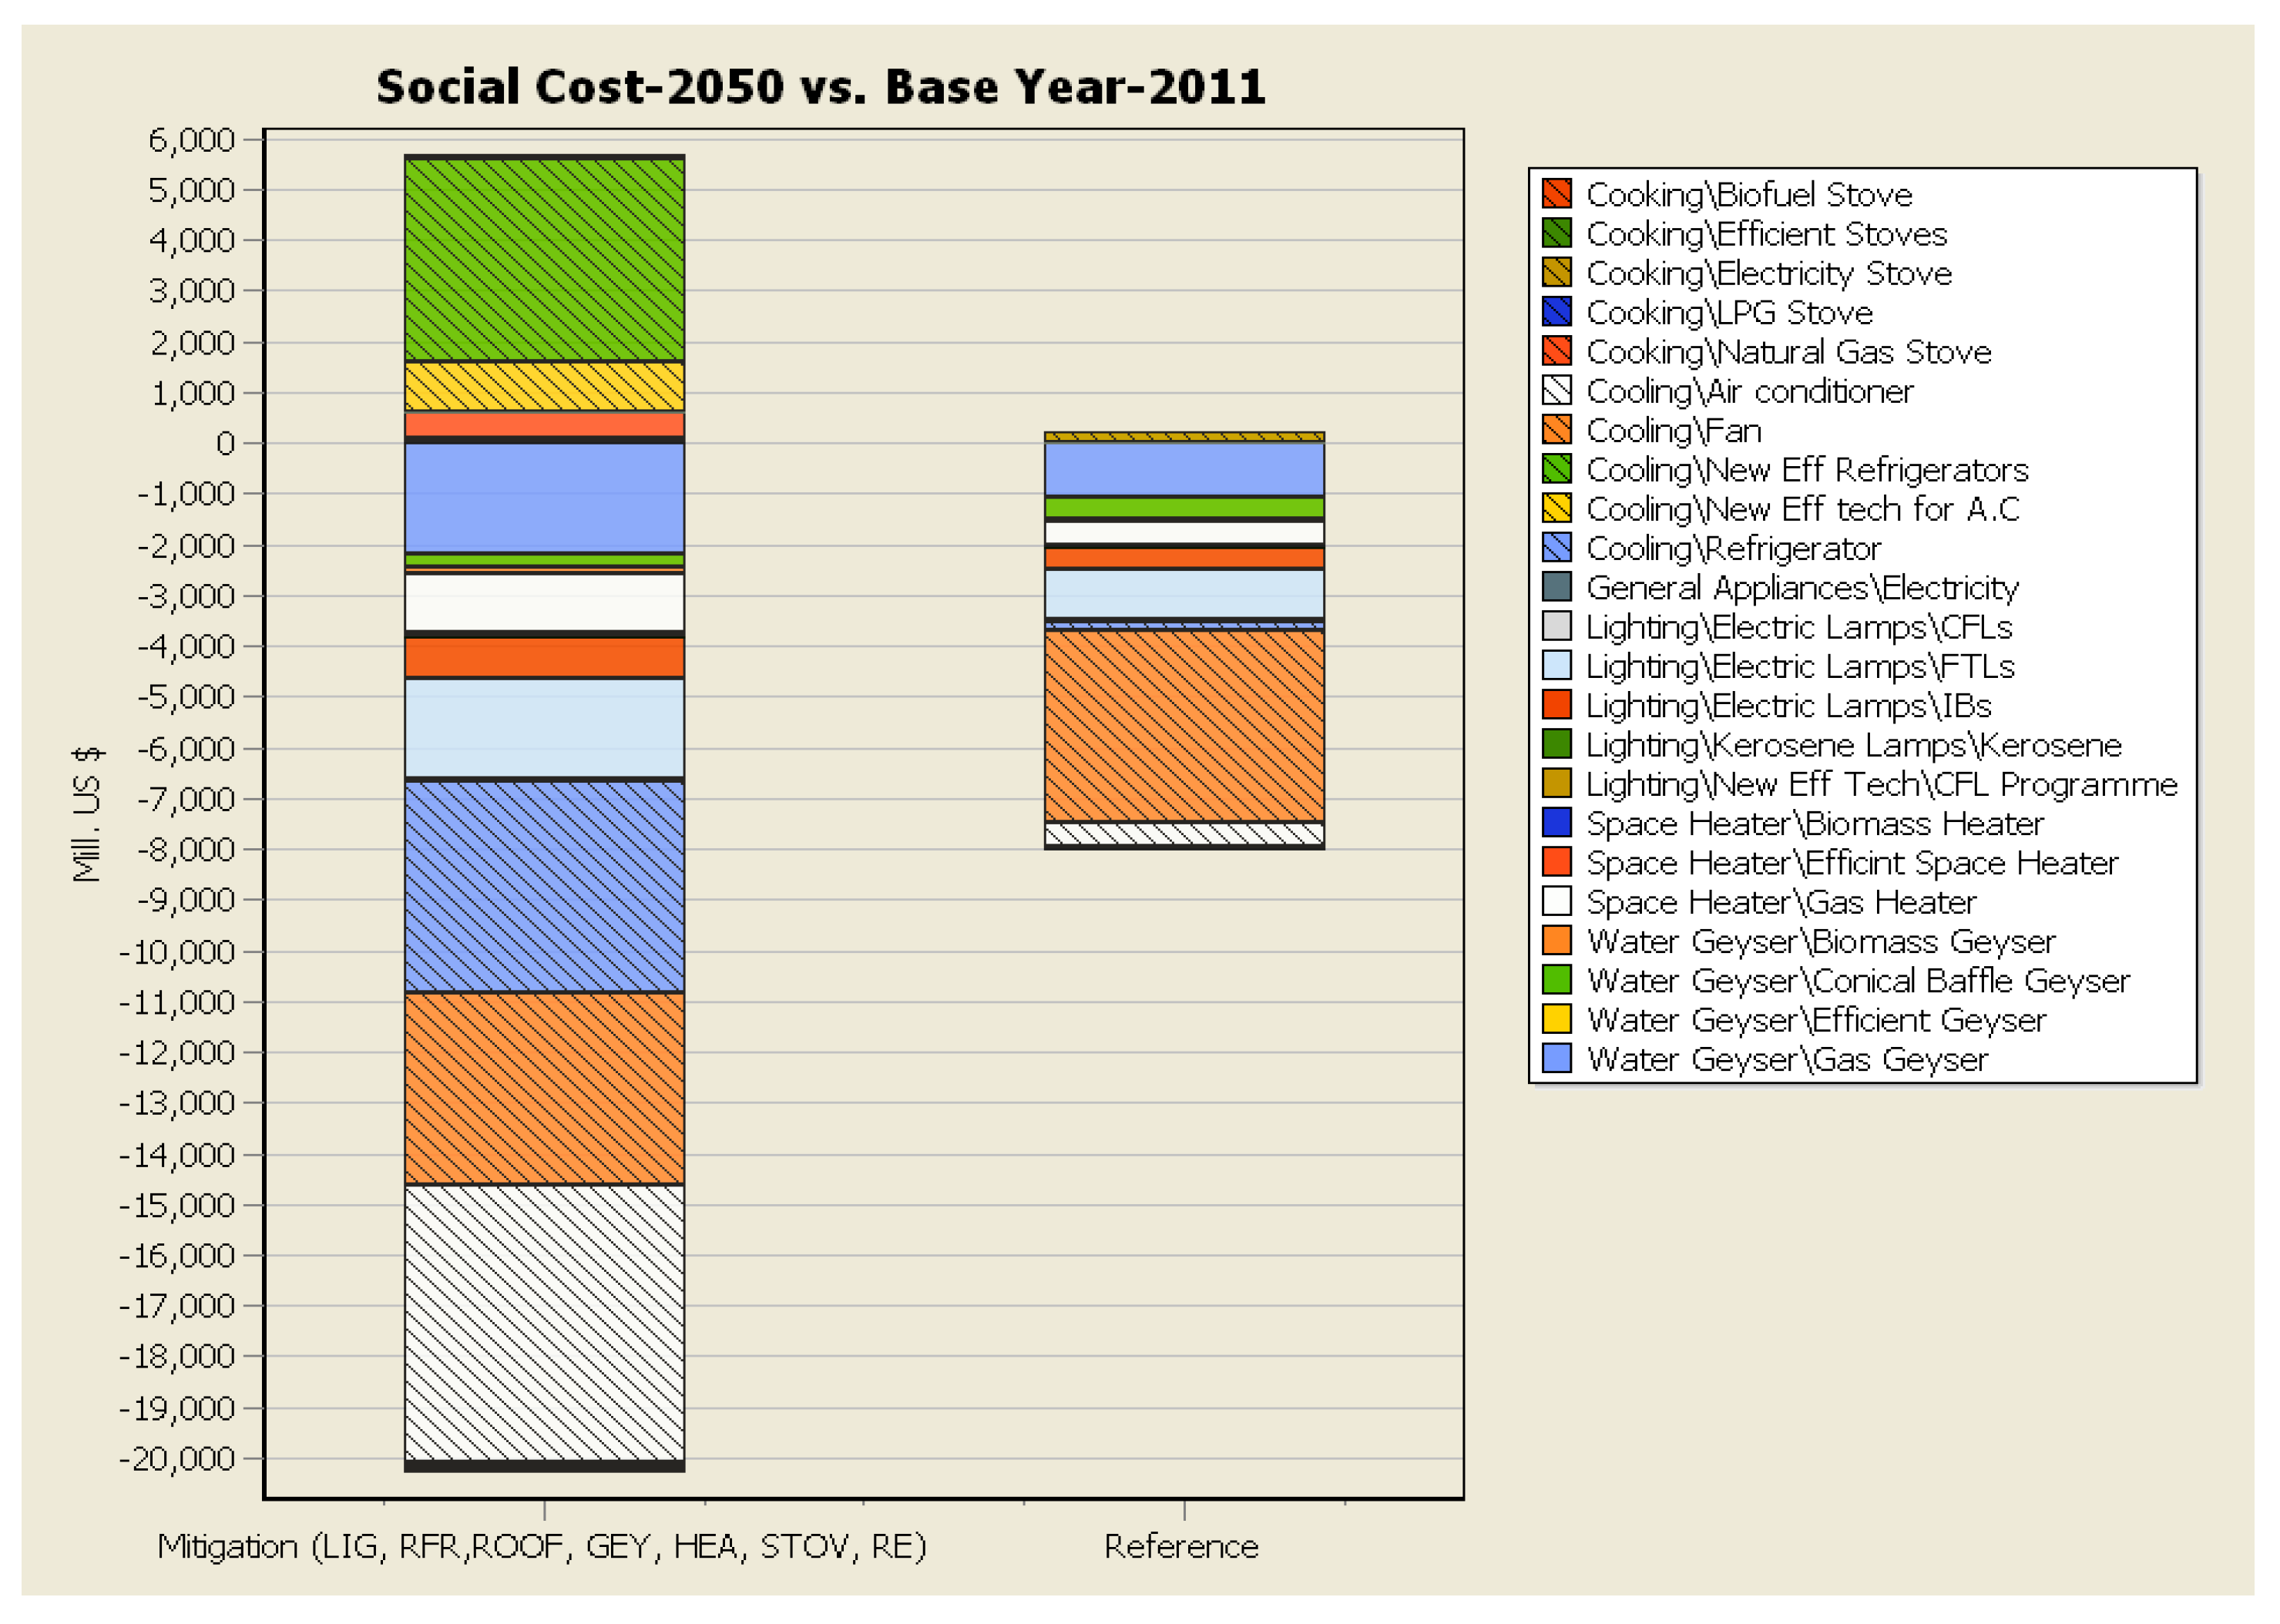
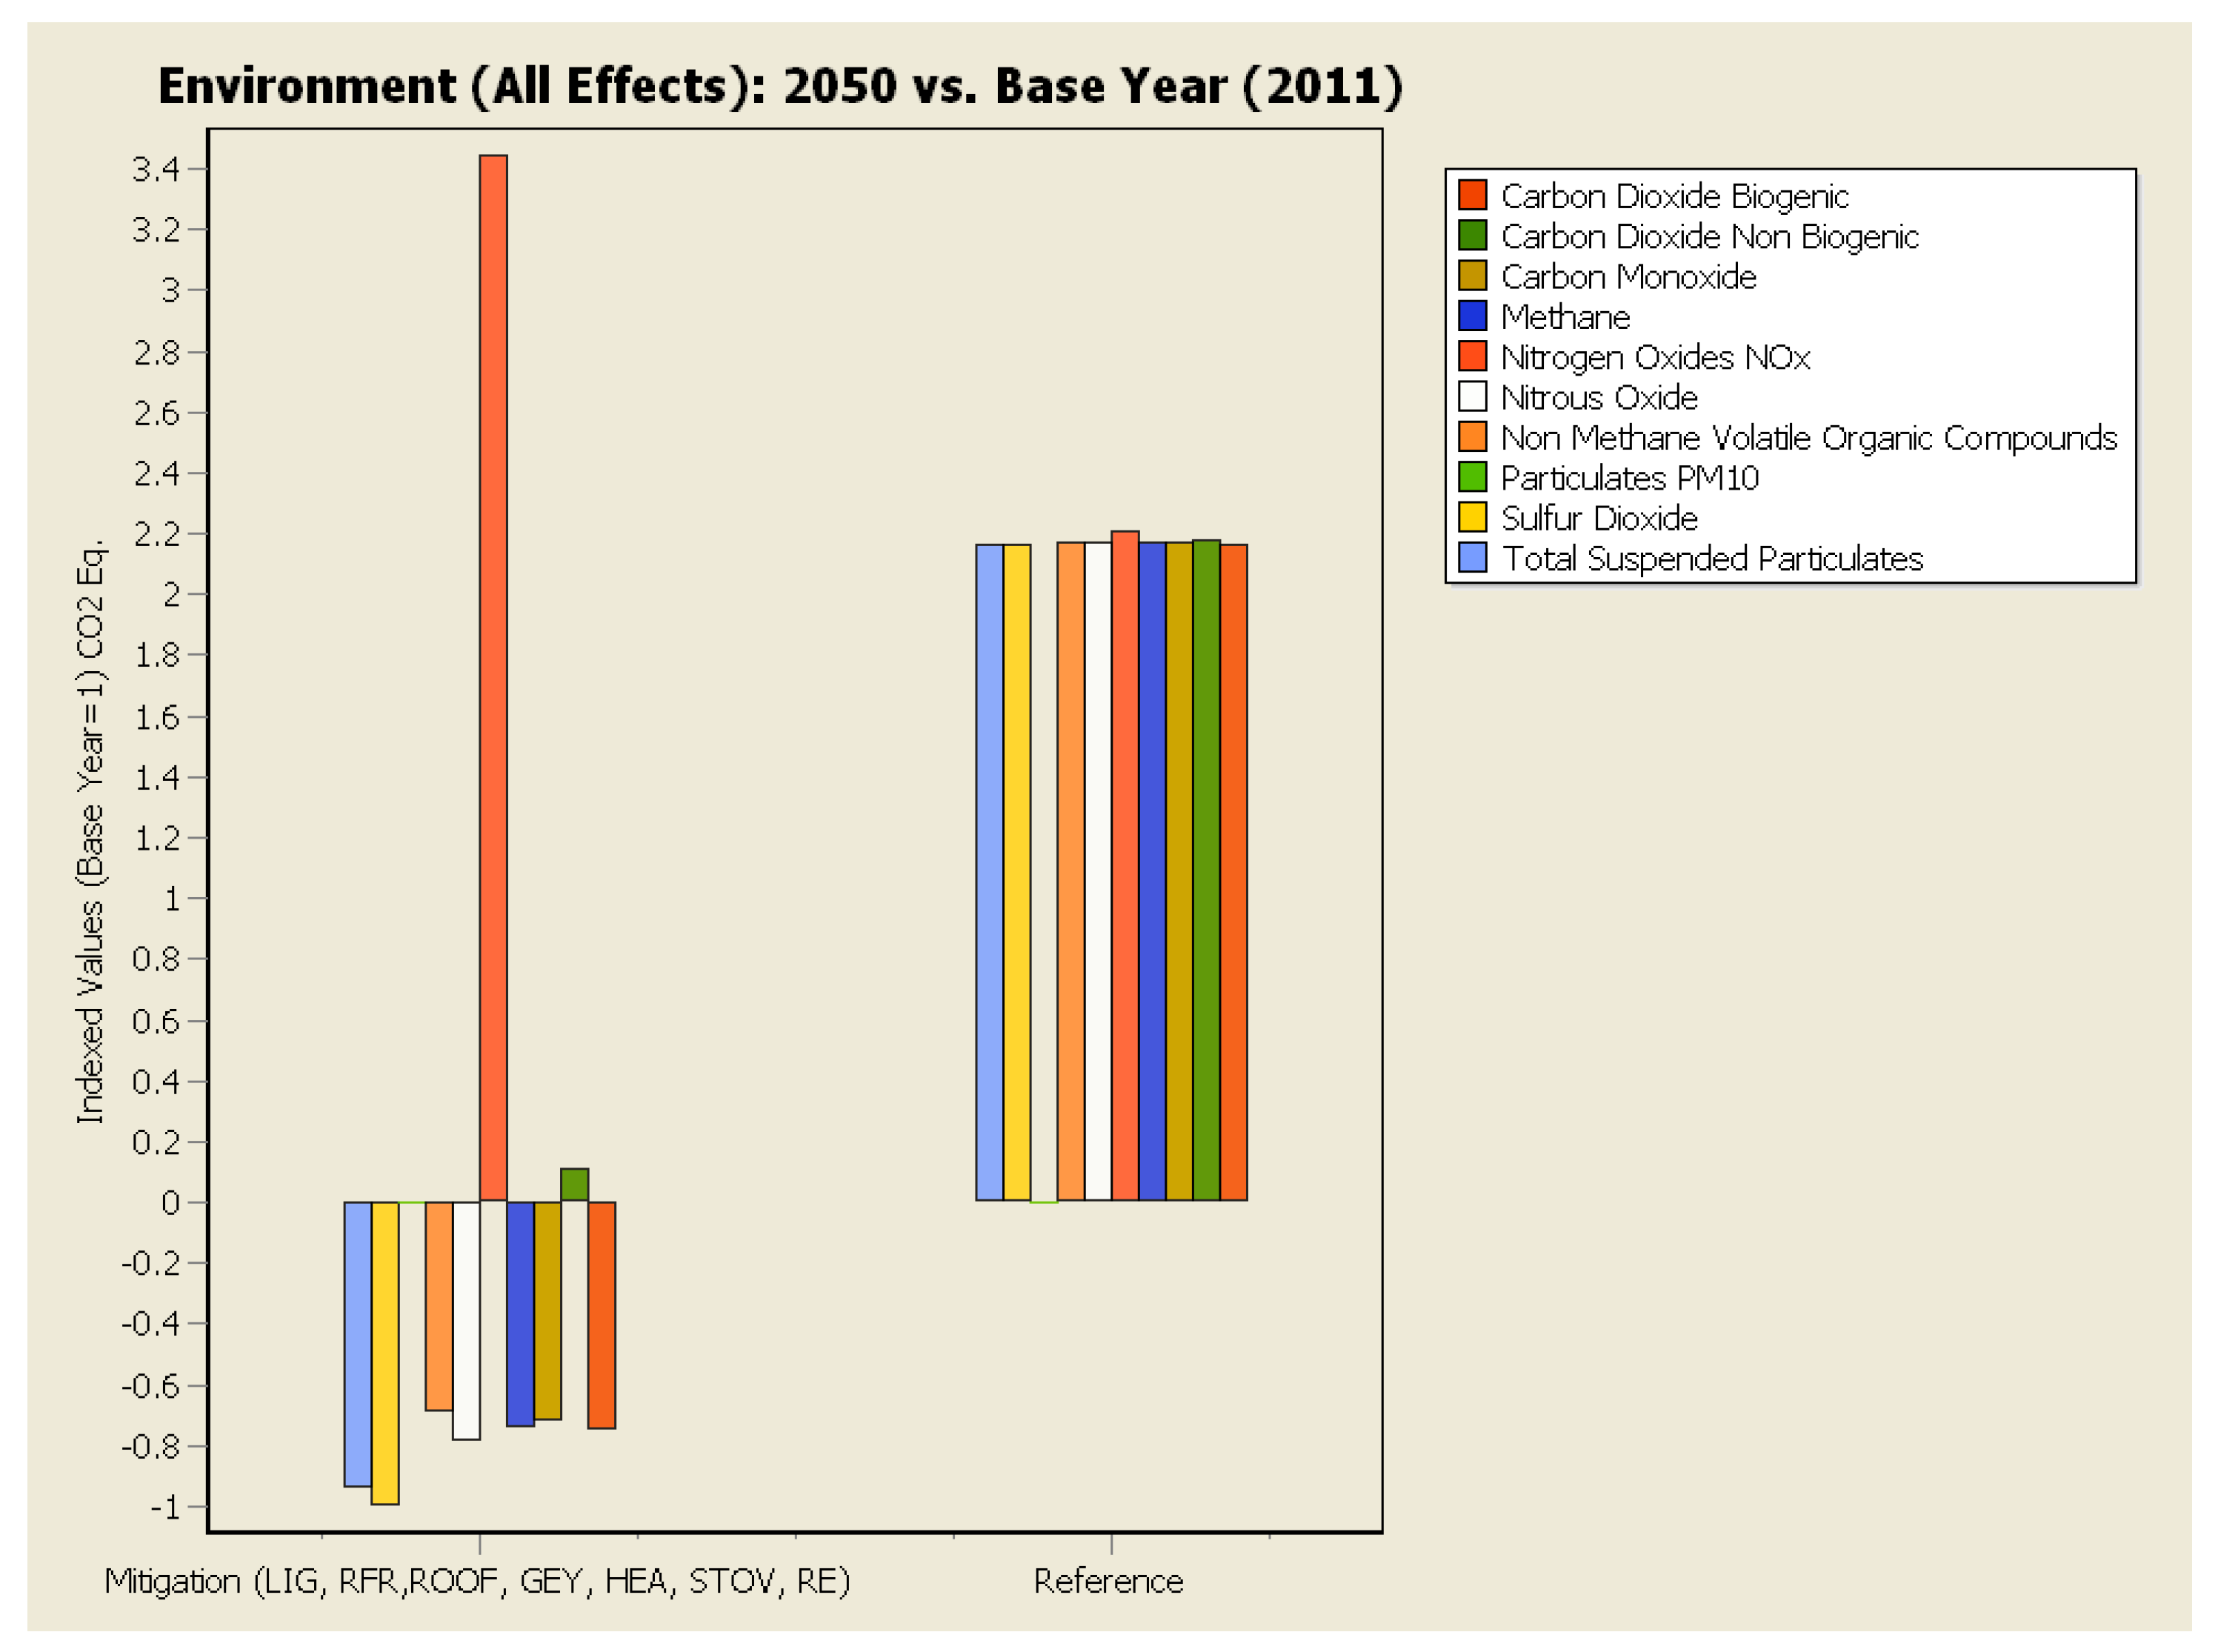
3.4. Economic Valuation of Alternative Policies/Scenarios

As per the mitigation plan of Pakistan’s NDCs, the total implementation cost of the energy sector plan is US $40 billion [29]. With the aim of increasing energy security and reducing energy poverty, 7650 MW coal power plants are to be installed. However, implantation of this plan requires an investment of US $27.6 billion through the CPEC.
Pakistan is home to some of the world’s largest reserves of coal and natural gas. However, unplanned usage is rapidly causing their exhaustion. Shortages of gas supplies during winters further add to the supply–demand gap. Due to this, the majority of power stations, which are furnace oil-based, are being run on expensive imported fuel. The capital and energy generation cost from these fuels is much less than renewable; however, excessive emissions of sulfur, nitrogen, and particulate matter are responsible for various environmental problems and reduced cost-effectiveness.
In contrast to the NDCs, which provide sectoral targets for GHG emissions reductions, this study offers more realistic strategies to achieve maximum targets in the most energy-intensive sector. Deployment of renewable energy will further reduce environmental emissions and promote clean energy in developing economies. A simplified summary of cost–benefit results of these scenarios is shown in Table 4. The overall net present value (NPV) is negative, which shows a reduction in cost compared to REF.
Hence, it can be concluded that the incorporation of renewable energy targets multiplied the benefits gained under the MIT. The capital cost incurred by these renewable alternatives is high, up to 2300–2500 $/MW, but insignificant emissions and longer plant life covers their cost economics. The National Renewable Energy Laboratory (NREL) in the United States estimated that the wind energy potential of Pakistan is 346,000 MW, while the wind corridor of Gharo-Ketibander alone can generate 43,000 MW [85]. With regard to the solar energy potential of Pakistan, irradiation of more than 5–6 kWh/m2/day has been estimated in many areas by the Alternate Energy Development Board [86].

4. Conclusions

This study provides a long-range plan for energy demand management in the household sector of developing economies. Various policy options were proposed and analyzed to achieve maximum energy savings in households, with the lowest cost and GHG emissions. Pakistan was chosen as case study because of the characteristic energy crisis despite its highest electrification rate among developing countries. The data set used in the study represents socioeconomic and environmental conditions of a developing economy that is facing multiple challenges, including rapid urbanization, uncontrolled population growth, technological and financial constraints, capacity issues, energy security, and climate change vulnerability. These challenges account for shaping the future of world energy.
The findings of the study reveal that the “efficient water heating” scenario has the highest energy-saving potential—up to 270 M.TOE by 2050. Meanwhile, the “efficient cooking stoves” and “efficient water heaters” scenarios offer significant savings of natural gas fuel. In terms of the social cost, “efficient space cooling” promises to be the lowest-cost scenario in 2050. A cost–benefit analysis of the proposed policies suggests their immediate adoption in national plans. In comparison with the usual case, the implementation cost of these policies is US $157.3 billion less, with an additional savings of US $3.4 billion due to avoided CO2 emissions.
The final MIT is hence obtained is a triple-win in all aspects of sustainability. It also incorporates targets to utilize the untapped renewable energy potential from the supply side. It is anticipated that the long-term benefits of renewable energy will overcome its huge capital cost. The resultant policy set features a best-fit sustainable management plan in terms of its energy saving potential, social cost, and environmental impacts. Hence, the findings of this study are extremely important for developing countries, in order to meet their energy and GHG targets under their Nationally Determined Contributions.

Author Contributions

Conceptualization, methodology, writing of original draft and editing, S.B.; Project administration and review, S.R.A. and I.A. All authors read and approved the final manuscript.

Funding

No specific funding was provided for this research paper.

Acknowledgments

The authors would like to acknowledge the role of the Higher Education Commission of Pakistan in facilitating this study through the award of Indigenous Scholarship.

Conflicts of Interest

The authors declare no conflict of interest.

References

  1. International Energy Agency. Energy Access Outlook 2017: From Poverty to Prosperity; International Energy Agency: Paris, France, 2017; Available online: https://www.iea.org/weo2017/ (accessed on 3 May 2018).
  2. World Bank. Tracking SDG7: The Energy Progress Report 2018; World Bank Publications; The World Bank Group: Washington, DC, USA, 2018; pp. 156–159. [Google Scholar]
  3. Pakistan Bureau of Statistics. Press Release on Provisional Summary Results of 6th Population and Housing Census—2017; Ministry of Statistics, Statistics Division, Government of Pakistan: Islamabad, Pakistan, 2017; pp. 1–2. Available online: http://www.pbs.gov.pk/content/provisional-summary-results-6th-population-and-housing-census-2017-0 (accessed on 16 August 2018).
  4. Government of Pakistan. Energy. In Pakistan Economic Survey 2016–2017; Adviser’s Wing, Finance Division, Government of Pakistan: Islamabad, Pakistan, 2017; Chapter 14; p. 143. [Google Scholar]
  5. World Health Organization. Accelerating SDG 7 Achievements, Policy Brief 10 Health and Energy Linkages-Maximizing Health Benefits from the Sustainable Energy Transition; United Nations Division for Sustainable Development Goals, Department of Economic and Social Affairs, United Nations: New York, NY, USA, 2018; p. 3. Available online: https://sustainabledevelopment.un.org/content/documents/17486PB10.pdf (accessed on 8 July 2018).
  6. International Energy Agency. World Energy Outlook 2013; International Energy Agency (IEA) Publications: Paris, France, 2013; pp. 19–22. ISBN 978-92-64-20130-9. Available online: http://www.worldenergyoutlook.org/weo2013/ (accessed on 5 May 2017).
  7. Ministry of Climate Change. Pakistan National GHG Inventory 2014–2015; Government of Pakistan: Islamabad, Pakistan, 2016; pp. 2–3.
  8. Punjab Economic Research Institute. Punjab Economic Report-2017; Publication No. 425; Planning and Development Department, Government of the Punjab: Lahore, Pakistan, 2017; p. 471.
  9. Shaaban, M.; Scheffran, J.; Böhner, J.; Elsobki, M.S. Sustainability Assessment of Electricity Generation Technologies in Egypt Using Multi-Criteria Decision Analysis. Energies 2018, 11, 1117. [Google Scholar] [CrossRef]
  10. Frederiks, E.R.; Stenner, K.; Hobman, E.V. The Socio-Demographic and Psychological Predictors of Residential Energy Consumption: A Comprehensive Review. Energies 2015, 8, 573–609. [Google Scholar] [CrossRef] [Green Version]
  11. Blázquez, L.; Boogen, N.; Filippini, M. Residential Electricity Demand in Spain: New Empirical Evidence Using Aggregate Data. Energy Econ. 2013, 36, 648–657. [Google Scholar] [CrossRef]
  12. Clark, M.L.; Peel, J.L.; Balakrishnan, K.; Breysse, P.N.; Chillrud, S.N.; Naeher, L.P.; Rodes, C.E.; Vette, A.F.; Balbus, J.M. Health and Household Air Pollution from Solid Fuel Use: The Need for Improved Exposure Assessment. Environ. Health Perspect. 2013, 121, 1120–1128. [Google Scholar] [CrossRef] [PubMed] [Green Version]
  13. Rosen, M.A. Energy Sustainability: A Pragmatic Approach and Illustrations. Sustainability 2009, 1, 55–80. [Google Scholar] [CrossRef]
  14. Yamamoto, Y.; Suzuki, A.; Fuwa, Y.; Sato, T. Decision-Making in Electrical Appliance Use in the Home. Energy Policy 2008, 36, 1679–1686. [Google Scholar] [CrossRef]
  15. Larsen, B.M.; Nesbakken, R. Household Electricity End-Use Consumption: Results from Econometric and Engineering Models. Energy Econ. 2004, 26, 179–200. [Google Scholar] [CrossRef]
  16. Farhad, D.R. On Sustainability in Local Energy Planning [Doctoral Dissertation]; Division of Efficient Energy Systems, Tryckeriet E-huset Lund University: Lund, Sweden, 2011; pp. 34–73. ISBN 978-91-7473-110-1. [Google Scholar]
  17. OECD/IEA. Real-World Policy Packages for Sustainable Energy Transitions Shaping Energy Transition Policies to Fit National Objectives and Constraints; International Energy Agency: Paris, France, 2017. [Google Scholar]
  18. Heaps, C.G. Long-Range Energy Alternatives Planning (LEAP) System; Stockholm Environment Institute: Somerville, MA, USA, 2016; Available online: https://www.energycommunity.org (accessed on 5 February 2015).
  19. Supasa, T.; Hsiau, S.; Lin, S.; Wongsapai, W.; Chang, K.; Wu, J. Sustainable Energy and CO2 Reduction Policy in Thailand: An Input-Output Approach from Production-and Consumption-Based Perspectives. Energy Sustain. Dev. 2017, 41, 36–48. [Google Scholar] [CrossRef]
  20. Ahmad, A.; Khan, A.; Javaid, N.; Hussain, H.M.; Abdul, W.; Almogren, A.; Alamri, A.; Niaz, I.A. An Optimized Home Energy Management System with Integrated Renewable Energy and Storage Resources with Integrated Renewable Energy and Storage Resources. Energies 2017, 10, 549. [Google Scholar] [CrossRef]
  21. Chaudhry, A.A. A Panel Data Analysis of Electricity Demand in Pakistan. Lahore J. Econ. 2010, 15, 7. [Google Scholar]
  22. Phdungsilp, A. Integrated Energy and Carbon Modeling with a Decision Support System: Policy Scenarios for Low-Carbon City Development in Bangkok. Energy Policy 2010, 38, 4808–4817. [Google Scholar] [CrossRef]
  23. Sheikh, M.A. Energy and Renewable Energy Scenario of Pakistan. Renew. Sustain. Energy Rev. 2010, 14, 354–363. [Google Scholar]
  24. Chaudhry, T. Estimating Residential Electricity Demand Responses in Pakistan’s Punjab. Lahore J. Econ. 2010, 15, 109–110. [Google Scholar]
  25. Avami, A.; Farahmandpour, B. Analysis of Environmental Emissions and Greenhouse Gases in Islamic Republic of Iran. WSEAS Trans. Environ. Dev. 2008, 4, 303–312. [Google Scholar]
  26. McNeil, M.A.; Letschert, V.E. Forecasting Electricity Demand in Developing Countries: A Study of Household Income and Appliance Ownership. In Proceedings of the European Council for Energy Efficient Economy (ECEEE) Summer Study 2005, Mandelieu la Napoule, France, 30 May–4 June 2005. [Google Scholar]
  27. El-Fadel, M.; Zeinati, M.; Ghaddar, N.; Mezher, T. Mitigating Energy-Related GHG Emissions through Renewable Energy. Energy Policy 2001, 29, 1031–1043. [Google Scholar] [CrossRef]
  28. Ghanadan, R.; Koomey, J.G. Using Energy Scenarios to Explore Alternative Energy Pathways in California. Energy Policy 2005, 33, 1117–1142. [Google Scholar] [CrossRef]
  29. World Resources Institute. NDC Country Outlook-Pakistan 2017; NDC Partnership Support Unit, World Resources Institute: Washington, DC, USA, 2017; pp. 1–7. Available online: https://ndcpartnership.org/sites/all/themes/ndcp_v2/docs/country-engagement/countries/NCDP_Outlook_Pakistan_v6a.pdf (accessed on 17 August 2017).
  30. Pakistan Bureau of Statistics. Brief on Pakistan Social & Living Standard Measurement (PSLM) Survey 2004–2015. Available online: http://www.pbs.gov.pk/content/pakistan-social-and-living-standards-measurement (accessed on 27 October 2017).
  31. Ministry of Environment. National Environmental Policy—2005; Government of Pakistan: Islamabad, Pakistan, 2005.
  32. Pakistan Bureau of Statistics. Compendium on Environmental Statistics of Pakistan, 2015. Available online: http://www.pbs.gov.pk/sites/default/files//crops_and_climates/compendium_environment/compendium_environment_2015.pdf (accessed on 11 April 2016).
  33. Gallup Pakistan Limited. Trends in the Use of Electric Goods in Pakistan, 2015. Available online: http://gallup.com.pk/trends-in-the-use-of-electric-goods-in-pakistan-2/ (accessed on 3 January 2016).
  34. World Energy Council. Climate Change: Implications for the Energy Sector, Key Findings from the Intergovernmental Panel on Climate Change Fifth Assessment Report; World Energy Council: London, UK, 2014; Available online: http://www.worldenergy.org/wp-content/uploads/2014/06/Climate-Change-Implications-for-the-Energy-Sector-Summary-from-IPCC-AR5-2014-Full-report.pdf (accessed on 3 March 2016).
  35. Asian Development Bank (ADB). Asian Development Outlook 2012: Confronting Rising Inequality in Asia; Asian Development Bank: Mandaluyong City, Philippines, 2012; pp. 180–181. ISBN 978-92-9092-606-1. [Google Scholar]
  36. Asian Development Bank (ADB). Proposed Multi-Tranche Financing Facility and Administration of Co-Financing Islamic Republic of Pakistan; Project No. 42051; Report and Recommendation of the President to the Board of Directors; Energy Efficiency Investment Program, Asian Development Bank: Mandaluyong, Philippines, 2009; pp. 2–4. [Google Scholar]
  37. Hagler & Bailly; Econoler International. Pakistan Sustainable Energy Efficiency Development Program; Project No. ADB TA 7060-PAK, ADB Technical Assistance Consultant’s Final Report; Asian Development Bank: Islamabad, Pakistan, 2009; pp. 90–96. Available online: https://www.adb.org/sites/default/files/project-document/64867/42051-PAK-TACR.pdf (accessed on 15 May 2014).
  38. Khan, M.A.A.; Amir, P.; Ramay, S.A.; Munawar, Z.; Ahmad, V. National Economic and Environmental Development Study (NEEDS) Report of Pakistan; UNFCCC: Islamabad, Pakistan, 2011; pp. 12–65. Available online: https://unfccc.int/files/adaptation/application/pdf/pakistanneeds.pdf (accessed on 4 May 2014).
  39. Snc Inc. Lavalin International; National Engineering Services Pakistan (Pvt) Limited. Power System Statistics 2016–2017, 42nd ed.; Power System Planning, National Transmission and Dispatch Company Ltd.: Lahore, Pakistan, 2017; pp. 15–31. Available online: http://www.ntdc.com.pk/Files/ps42ed.pdf (accessed on 28 August 2018).
  40. Saxenaa, V.; Bhattacharya, P.C. Inequalities in LPG and Electricity Consumption in India: The Role of Caste, Tribe, and Religion. Energy Sustain. Dev. 2018, 42, 44–53. [Google Scholar] [CrossRef]
  41. Hafeez, G.; Javaid, N.; Iqbal, S.; Khan, F.A. Optimal Residential Load Scheduling under Utility and Rooftop Photovoltaic Units. Energies 2018, 11, 611. [Google Scholar] [CrossRef]
  42. German Centre for Sustainability (IGCS). Long-Term Energy and Development Pathways for India; Shakti Sustainable Energy Foundation, IGCS, IIT: Chennai, India, 2014; p. 2. [Google Scholar]
  43. Amirnekooei, K.; Ardehali, M.; Sadri, A. Integrated Resource Planning for Iran: Development of Reference Energy System, Forecast and Long-Term Energy-Environment Plan. Energy 2012, 46, 374–385. [Google Scholar] [CrossRef]
  44. Von Hippel, D.E.P.; Tempest, K.L.M. Strategies for Development of Green Energy Systems in Mongolia Final Report; Global Green Growth Institute: Seoul, Korea, 2014; pp. 5–9. [Google Scholar]
  45. McPherson, M.; Karney, B. Long-Term Scenario Alternatives and Their Implications: LEAP Model Application of Panama’s Electricity Sector. Energy Policy 2014, 68, 146–157. [Google Scholar] [CrossRef]
  46. Phdungsilp, A.; Wuttipornpun, T. Energy and Carbon Modeling with Multi-Criteria Decision-Making towards Sustainable Industrial Sector Development in Thailand. Low Carbon Econ. 2011, 2, 165–172. [Google Scholar] [CrossRef]
  47. Park, N.B.; Yun, S.J.; Chan, J.E. An Analysis of Long-Term Scenarios for the Transition to Renewable Energy in the Korean Electricity Sector. Energy Policy 2013, 52, 288–296. [Google Scholar] [CrossRef]
  48. Nadia, S.O. Africa Energy Future: Alternative Scenarios and Their Implications for Sustainable Development Strategies. Energy Policy 2017, 106, 457–471. [Google Scholar] [CrossRef]
  49. Xing, R.; Hanaoka, T.; Kanamori, Y.; Masui, T. Greenhouse Gas and Air Pollutant Emissions of China’s Residential Sector: The Importance of considering Energy Transition. Sustainability 2017, 9, 614. [Google Scholar] [CrossRef]
  50. Erum, S.; Ahmad, S.S. Energy Demand and Emission Analysis of Islamabad Industrial Area using Energy Model. World Appl. Sci. J. 2010, 8, 900–905. [Google Scholar]
  51. Shabbir, R.; Ahmad, S.S. Monitoring Urban Transport Air Pollution and Energy Demand in Rawalpindi and Islamabad using LEAP Model. Energy 2010, 35, 2323–2332. [Google Scholar] [CrossRef]
  52. Gul, M.; Qureshi, W.A. Modeling Diversified Electricity Generation Scenarios for Pakistan. In Proceedings of the IEEE Power and Energy Society General Meeting, San Diego, CA, USA, 22–26 July 2012; pp. 1–7. [Google Scholar]
  53. Mengal, A.; Harijan, K.; Uqaili, M.A.; Mirjat, N.H. Electricity Demand and Emissions under Different Policy Scenarios for Pakistan. In Proceedings of the 3rd International Conference on Energy, Environment and Sustainable Development (EESD 2014), Jamshoro, Pakistan, 22–24 October 2014. [Google Scholar]
  54. Syed, M.S.; Chaudhry, I.A.; Farooq, M.; Qamar, A. Modeling and Forecasting of Energy Scenario in Pakistan with Application of Decentralized Energy Planning. J. Fac. Eng. Technol. 2014, 21, 9–22. [Google Scholar]
  55. Perwez, U.; Sohail, A.; Hassan, S.F.; Zia, U. The Long-Term Forecast of Pakistan’s Electricity Supply and Demand: An Application of Long Range Energy Alternatives Planning. Energy 2015, 93, 2423–2435. [Google Scholar] [CrossRef]
  56. Gupta, G.; Kohlin, G. Preferences for Domestic Fuel: Analysis with Socioeconomic Factors and Rankings in Kolkata, India. Ecol. Econ. 2006, 57, 107–121. [Google Scholar] [CrossRef]
  57. Farsi, M.; Filipini, M.; Pachauri, S. Fuel Choices in Urban Indian Households. Environ. Dev. Econ. 2007, 12, 757–774. [Google Scholar] [CrossRef]
  58. Hosier, R.H.; Dowd, J. Household Fuel Choice in Zimbabwe: An Empirical Test of the Energy Ladder Hypothesis. Resour. Energy 1987, 9, 347–361. [Google Scholar] [CrossRef]
  59. Davis, M. Rural Household Energy Consumption: The Effects of Access to Electricity-Evidence from South Africa. Energy Policy 1998, 26, 207–217. [Google Scholar] [CrossRef]
  60. Zhao, C.-S.; Niu, S.W.; Zhang, X. Effects of Household Energy Consumption on Environment and Its Influence Factors in Rural and Urban Areas. Energy Procedia 2012, 14, 805–811. [Google Scholar]
  61. Aqeel, A.; Butt, M.S. The Relationship between Energy Consumption and Economic Growth in Pakistan. Asia-Pac. Dev. J. 2001, 8, 101–110. [Google Scholar]
  62. Shahbaz, M.; Zeshan, M.; Afza, T. Is Energy Consumption Effective to Spur Economic Growth in Pakistan? New Evidence from Bounds Test to Level Relationships and Granger Causality Tests. Econ. Model. 2012, 29, 2310–2319. [Google Scholar] [CrossRef] [Green Version]
  63. Khan, M.A.; Ahmad, U. Energy Demand in Pakistan: A Disaggregate Analysis. Pak. Dev. Rev. 2008, 47, 437–455. [Google Scholar] [CrossRef]
  64. Siddiqui, R. Energy and Economic Growth in Pakistan. Pak. Dev. Rev. 2004, 43, 175–200. [Google Scholar] [CrossRef]
  65. Shahbaz, M.; Lean, H.H. The Dynamics of Electricity Consumption and Economic Growth: A Revisit Study of Their Causality in Pakistan. Energy 2012, 39, 146–153. [Google Scholar] [CrossRef] [Green Version]
  66. Hye, Q.M.A.; Riaz, S. Causality between Energy Consumption and Economic Growth: The Case of Pakistan. Lahore J. Econ. 2008, 13, 45–58. [Google Scholar]
  67. Zaman, K.; Khan, M.M.; Ahmad, M.; Rustam, R. Determinants of Electricity Consumption Function in Pakistan: Old Wine in a New Bottle. Energy Policy 2012, 50, 623–634. [Google Scholar] [CrossRef]
  68. Raza, S.A.; Shahbaz, M.; Nguyen, D.K. Energy Conservation Policies, Growth and Trade Performance: Evidence of Feedback Hypothesis in Pakistan. Energy Policy 2015, 80, 1–10. [Google Scholar] [CrossRef]
  69. Ahmed, K.; Shahbaz, M.; Qasim, A.; Long, W. The Linkages between Deforestation, Energy and Growth for Environmental Degradation in Pakistan. Ecol. Indic. 2015, 49, 95–103. [Google Scholar] [CrossRef]
  70. Komal, R.; Abbas, F. Linking Financial Development, Economic Growth and Energy Consumption in Pakistan. Renew. Sustain. Energy Rev. 2015, 44, 211–220. [Google Scholar] [CrossRef]
  71. Shahbaz, M.; Lean, H.H.; Farooq, A. Natural Gas Consumption and Economic Growth in Pakistan. Renew. Sustain. Energy Rev. 2013, 18, 87–94. [Google Scholar] [CrossRef] [Green Version]
  72. Shahbaz, M.; Loganathan, N.; Zeshan, M.; Zaman, K. Does Renewable Energy Consumption Add in Economic Growth? An Application of Auto-Regressive Distributed Lag Model in Pakistan. Renew. Sustain. Energy Rev. 2015, 44, 576–585. [Google Scholar] [CrossRef]
  73. Arshad, A.; Zakaria, M.; Junyang, X. Energy Prices and Economic Growth in Pakistan: A Macro-Econometric Analysis. Renew. Sustain. Energy Rev. 2016, 55, 25–33. [Google Scholar] [CrossRef]
  74. Zeng, Y.; Cai, Y.; Huang, G.; Dai, J. A Review on Optimization Modeling of Energy Systems Planning and GHG Emission Mitigation under Uncertainty. Energies 2011, 4, 1624–1656. [Google Scholar] [CrossRef] [Green Version]
  75. Alam, S.; Fatima, A.; Butt, M.S. Sustainable Development in Pakistan in the Context of Energy Consumption Demand and Environmental Degradation. J. Asian Econ. 2007, 18, 825–837. [Google Scholar] [CrossRef]
  76. Nasir, M.; Ur Rehman, F. Environmental Kuznets Curve for Carbon Emissions in Pakistan: An Empirical Investigation. Energy Policy 2011, 39, 1857–1864. [Google Scholar] [CrossRef]
  77. Ali, G.; Abbas, S. Exploring CO2 Sources and Sinks Nexus through Integrated Approach: Insight from Pakistan. J. Environ. Inform. 2013, 12, 112–122. [Google Scholar]
  78. Rehman, S.A.U.; Cai, Y.; Fazal, R.; Das Walasai, G.; Mirjat, N.H. An Integrated Modeling Approach for Forecasting Long-Term Energy Demand in Pakistan. Energies 2017, 10, 1868. [Google Scholar] [CrossRef]
  79. Hydrocarbon Development Institute of Pakistan (HDIP). Energy Year Book 2016–2017; Ministry of Petroleum and Natural Resources, Government of Pakistan: Islamabad, Pakistan, 2017; pp. 15–45.
  80. National Energy Conservation Centre (ENERCON). Energy Efficient Lighting—A Triple Win for People, Environment and the Economy; ENERCON, Government of Pakistan: Islamabad, Pakistan, 2009. Available online: https://sari-energy.org/oldsite/PageFiles/What_We_Do/activities/RCEEL/presentations/Pakistan-CaseStudiesonEnergyEfficientLighting.pdf (accessed on 9 February 2011).
  81. Kojima, M. Pakistan Household Use of Commercial Energy; Report 320/06; Energy Sector Management Assistance Program (ESMAP) c/o Energy and Water Department, the World Bank Group: Washington, DC, USA, 2006; pp. 9–75. Available online: http://climateinfo.pk/frontend/web/attachments/data-type/ESMAP%20(2006)%20Pakistan%20Household%20Use%20of%20Commercial%20Energy.pdf (accessed on 12 May 2016).
  82. Yale University. 2018 Environmental Performance Index. Available online: https://epi.envirocenter.yale.edu/downloads/epi2018policymakerssummaryv01.pdf (accessed on 3 August 2018).
  83. Mekonnen, M.M.; Gerbens-Leenes, P.W.; Hoekstra, A.Y. Future Electricity: The Challenge of Reducing both Carbon and Water Footprint. Sci. Total Environ. 2016, 569–570, 1282–1288. [Google Scholar] [CrossRef] [PubMed]
  84. Cellura, M.; Cusenza, M.A.; Longo, S. Energy-Related GHG Emissions Balances: IPCC versus LCA. Sci. Total Environ. 2018, 628–629, 1328–1339. [Google Scholar] [CrossRef] [PubMed]
  85. Lahmeyer International GmbH; IPEK Energy GmbH. Environmental Impact Assessment of 50MW FFC Wind Power Plant Jhimpir; Report No. TD-06-401-2 (Revision-04); Fauji Fertilizer Company Limited: Rawalpindi, Pakistan, 2008; pp. 19–25. [Google Scholar]
  86. Tahir, Z.R.; Asim, M. Surface Measured Solar Radiation Data and Solar Energy Resource Assessment of Pakistan: A Review. Renew. Sustain. Energy Rev. 2017, 81 Pt 2, 2839–2861. [Google Scholar] [CrossRef]
Figure 1. Problem tree.
Sustainability 10 03971 g001
Figure 2. Framework for energy demand management in the urban household sector of Pakistan.
Sustainability 10 03971 g002
Figure 3. Key parameters of the study projected to year 2050 under the reference scenario (REF): (a) population growth projection (2011–2050); (b) gross domestic product (GDP) growth rate projection (2011–2050); (c) increase in household number (2011–2050); (d) growth in household consumers of natural gas and electricity (2011–2050).
Sustainability 10 03971 g003
Figure 4. Trend of energy-saving potential under the DSM versus the REF (2011–2050).
Sustainability 10 03971 g004
Figure 5. The DSM versus the REF: (a) decline in global warming potential (2011–2050); (b) avoided greenhouse gas (GHG) effects (2011–2050).
Sustainability 10 03971 g005
Figure 6. Comparison between the mitigation scenario (MIT) and REF with regard to energy demand.
Sustainability 10 03971 g006
Figure 7. Comparison between the MIT and REF with regard to social cost.
Sustainability 10 03971 g007
Figure 8. Comparison between the MIT and REF for Global Warming Potential.
Sustainability 10 03971 g008
Table 1. Database for energy modeling.
Socio-Economic Characteristics:
  • GDP/value added, population, no. of households, household size
Energy Demand Data:
  • Sector and subsector totals;
  • End use and technology;
  • Characteristics by sector and subsector.
Fuel Use by Sector or Subsector:
  • Usage breakdown by end use or device (i.e., new vs. existing devices), device stock by type;
  • Technology cost and performance.
Energy Supply Data:
  • Characteristics of energy supply and conversion facilities;
  • Energy supply plans;
  • Energy resources and prices.
  • Capital cost, fixed and variable operational & maintenance costs, performance factors of power plants.
  • Exogenous or endogenous capacity additions.
  • New capacity online dates, costs, and characteristics.
  • Reserves of fossil fuels, and the potential for renewable resources.
Technology Options:
  • Technology cost and performance;
  • Penetration rates;
  • Emission factors;
  • Capital and O&M costs, foreign exchange, performance factors of power plants
  • Percent of new or existing stock replaced per year
  • Emissions per unit energy consumed, produced or transported
Table 2. Alternative energy policies for the demand-side management scenario (DSM).
Policy MeasureDescription
Efficient Lighting
  • Modern lighting standards will cut down 1% of existing energy intensity annually. The remaining share of existing lighting devices targeted for incandescent bulbs (IBs) and fluorescent tube lights (FTLs) is 15% and 30%, respectively, by 2050.
Efficient Cooking
  • Introduction of retrofits for stoves is already in place by natural gas transmission and distribution companies in the country. This is expected to reduce the energy intensity of cooking per household by 70% in 2050.
  • Increased access to natural gas will also decrease the household share of LPG and bio-fuel cooking devices by 20% and 10%, respectively.
  • Increased future adoption of electric stoves is assumed to increase the household energy intensity at 0.3% per year.
Efficient Space Heating
  • Household efficiency standards will lower biomass consumption for space heating through reducing its share to 7% of households by 2050.
Efficient Water Geysers
  • High-efficiency heating appliances will be promoted to replace 40% of household shares of existing natural gas geysers by 2050. It will reduce households’ major energy consumption by 70% in 2025 and 90% in 2050.
Efficient Cooling
  • Efficient-energy labels will reduce average intensity to 5% in 2020 and 20% in 2050, and 20% for air conditioners.
  • Conventional refrigerators and air-conditioners will be replaced with high-efficiency ones by 75% and 40% respectively, by 2050.
T&D Loss Reduction
  • Power losses will decline up to 18% by 2025 and 14% by 2050. In addition, natural gas pipeline losses will be reduced to 2%.
Table 3. Energy saving potential in the household sector under the DSM (absolute values in M.TOE).
DEVICE201120152020202520302035204020452050
Bio-fuel Stove0−0.1−0.2−0.3−0.5−0.7−1−1.4−1.8
Electricity Stove00.20.611.72.53.54.96.6
LPG Stove00−0.1−0.1−0.2−0.2−0.3−0.5−0.6
Natural Gas Stove00−0.1−0.2−0.3−0.6−0.9−1.3−1.9
Air conditioner0−0.1−0.2−0.4−0.8−1.3−2.1−3.4−5.2
Fan000000000
Refrigerator0−0.3−1−2.6−6.1−13.2−27.7−56.8−114.6
Electric Lamps00−0.1−0.1−0.2−0.2−0.3−0.4−0.5
Kerosene Lamps000000000
Biomass Heater000000000
Gas Heater0000.10.10.10.10.20.2
Biomass Geyser000−0.1−0.1−0.2−0.3−0.4−0.5
Efficient Geyser00.20.611.62.33.24.45.8
Existing Geyser0−29.1−82.6−160.7−195−237.9−291.7−359.1−443.3
TOTAL0−29.2−83−162.5−199.8−249.6−317.5−413.7−555.8
Table 4. Cost–benefits analysis of the DSM versus the REF (2011–2050) (in billions of US dollars in 2010, discounted at 5% to the year 2011).
DSM versus REFCumulative Costs
Net Present Value−157.3
GHG Savings (M.T.CO2e)46,932.6
Cost of Avoided CO2 (US $/Tonne CO2e)−3.4

