Article

The Economic Potential to Support Sustainability through Household Consumption Choices

Sustainability Science, School of Energy Systems, Lappeenranta University of Technology, Saimaankatu 11, 15140 Lahti, Finland
*
Author to whom correspondence should be addressed.
Sustainability 2018, 10(11), 3961; https://doi.org/10.3390/su10113961
Submission received: 10 October 2018 / Revised: 26 October 2018 / Accepted: 29 October 2018 / Published: 31 October 2018
(This article belongs to the Section Economic and Business Aspects of Sustainability)

Abstract

:
The amount of money that could potentially be saved by households by reducing unnecessary consumption and directed to sustainable investments without compromising the social needs in Finnish households was studied. The study was conducted by using statistical data and by creating short- and long-term scenarios to assess potential savings resulting from changes in household behaviour. According to the results, a Finnish household could save and subsequently allocate an average of €3400–€15,000 annually to invest in sustainability. The greatest potential for preventing unnecessary consumption is related to (1) food and drinks, and (2) transportation. In the long-term scenario, reducing expenditures in the category of housing also provides opportunities for high savings. A significant share of the saving created by sustainable patterns of consumption can be directed for example to investments in renewable energy.

1. Introduction

The world is currently facing challenges calling for immediate action. The climate is changing rapidly, and even though globally emitted carbon dioxide emissions were levelling for three years, the emissions are growing again [1,2]. According to Figueres et al. [3], humankind has three years to safeguard the climate by decreasing the amount of greenhouse gas emissions. Otherwise, the temperature goal of the 2015 Paris climate agreement will be nearly unobtainable, and achieving the UN Sustainable Development Goals will be extremely difficult [3].
A solution to the sustainability crisis does exist. In fact, scientists have offered a variety of possible pathways [3], but large-scale concrete results are lacking. The Paris Agreement, an accord to curb greenhouse gas emissions [4], is a step forward and offers the world a roadmap in the right direction. Action must be taken by entities and individuals at all levels: nations, companies and corporations, cities and municipalities; and above all, individual citizens. It is often thought that actions promoting sustainability are costly, especially when it comes to individual customers and the micro level in general [5,6,7,8,9,10]. However, societies and consumers are already spending a great deal of money on operations with minor importance for human well-being. Today, the environmental discourse seems to embrace two built-in assumptions used to downplay consumer environmental responsibility.
The first assumption is that the possible role of consumers in resolving the sustainability crisis is often incorrectly considered to be small [10,11,12,13]. However, for instance, in Finland, the greenhouse gas emissions from private household final consumption (later on referred to as household consumption) amounted to 47.9 million tonnes of CO2-eq in 2012 [14]. The amount includes greenhouse gas emissions from production and distribution chains, and from the consumption use of products [14]. According to Seppälä et al. [15], individual consumption accounted for 68% of GHG emissions caused by the domestic final use of products on the Finnish level. Housing causes roughly one-third of the total household-related emissions [14], mainly because of the considerable amount of energy needed for the heating of homes in northern latitudes. In 2012, the household sector accounted for 21% of the total end-use of energy in Finland, space heating comprising 71% of the total residential use [16]. Furthermore, sustainability in other consumption sectors, such as transportation or food, is compromised because of the excessive consumption patterns. Material-intensive consumption has been identified as a major threat to sustainability in many studies and contexts [17,18,19]. Consumer choices may potentially have a high impact on production and on society in general, as the world economy is based on consumption. The final consumption expenditure of households in Finland accounted for 52% of the total gross domestic product (GDP, expenditure approach) [20].
The second assumption is that environmental preservation is costly, and sustainable products are too expensive compared to conventional choices [5,6,7,8,9,10]. However, it could be argued that resolving the sustainability crisis should be highly prioritised, and as this requires immediate action, cost should not be the determining factor. Furthermore, from the standpoint of sustainability, an average Finnish citizen’s consumption is clearly on “overshoot”. Basic needs are met relatively easily, and more money can be allotted towards unnecessary consumption than ever before. The term “unnecessary consumption” is used in this paper to refer to, in the context of the Western welfare society, consumption that does not support the fulfilment of basic needs. In this paper, basic needs refer to Raworth’s Donught’s [21] inner ceiling of the social foundation, which consists of health, education, networks, income and work, political voice and social equity. An example of unnecessary consumption could be the excessive usage of unhealthy foods (e.g., sweets) or drinks (e.g., soft drinks), superfluous electric kitchen appliances (e.g., popcorn machines), or any material-intensive luxury product.
Environmental impacts of the household expenditure structure in the EU were studied by Liobikienė & Mandravickaitė [22]. Of the consumption categories studied, food and beverages, transport, and housing were found to be the most polluting ones in terms of greenhouse gas emission and acidifying compound emission intensities. The three consumption categories of clothing and footwear, furnishings and household equipment, and restaurants and hotels were found to be moderately polluting. The lowest intensities of greenhouse gas emissions were attributed to the remaining five categories of health, communications, education, recreation and culture, and miscellaneous good and services. Similar results were obtained by the European Environmental Agency (EEA) [23]. Liobikienė & Mandravickaitė [22] point out that it is not possible to achieve more sustainable consumption patterns by only changing the household consumption structure. Governmental policies affecting technological development and inducing more sustainable production and consumption are required as well.
Ivanova et al. [24] analyzed the environmental impact of household consumption using data from 43 countries. Similar to Liobikienė & Mandravickaitė [22], they also found that mobility, shelter and food are the most influencing categories for environmental footprints in terms of greenhouse gas emissions, land use, water use and material use. Similarly, Poom & Ahas [25] found shelter, transport, and food and non-alcoholic beverages to be the three main causes of the carbon load of household consumption in Estonia. Kalbar et al. [26] assessed lifestyle aspects such as the choice of diet, the use of a private car and the household size, and found these aspects to have a significant influence on consumption related environmental impacts of Danish. Girod et al. [27] reviewed the carbon footprints of products in five main categories including food, shelter, transportation, goods and service. According to their findings, in all of the categories, there are consumption options, which enables the limiting the global temperature rise to 2 °C.
This paper focuses on Finnish households’ economic potential to contribute to a solution to the sustainability crisis. The main goal is to estimate the amount of money that could be directed toward sustainable investments while staying above the ceiling of a social foundation. First, in this paper, the expenditure structure of an average Finnish household is presented and analysed to find out what portion of disposable income is used to cover the basic needs [28] in the context of the Finnish welfare society, and how much is available for purchasing other products and services referred to as unnecessary consumption. This latter proportion of spending is examined more closely, as its necessity may be questioned from the sustainability perspective. A calculation model is then created to indicate how customers could change their spending habits and to approximate the amount of economic potential that could be directed towards sustainable investments. In addition to an average household, the calculation model is applied to the first and fifth income class quintiles to assess the different potentials the income classes hold. This paper focuses on the calculation of the potential amount of money instead of focusing on ways of how to encourage consumers to adopt the change. These ways, in reality, are manifold and studied for example by Sheth et al. [29], Thøgersen [30], de Boer et al. [31], and Byerly et al. [32]. Presumably, households are not likely to reduce their consumption but rather shift towards more sustainable choices. At the end of this paper, a rough calculation is presented where households purchase solar panels or EV’s with the total savings. More generally, investing in sustainable businesses could be profitable for both customers and the environment.
This paper answers the following research questions:
  • How much an average Finnish household could reduce its consumption of disposable income by reducing unnecessary consumption while simultaneously reducing the environmental impact?
  • What is the economic potential for making sustainable consumption choices in Finland?

2. Materials and Methods

2.1. Background Information

In 2016, the average Finnish household spent €37,551, and the number of households was 2.68 million [33]. Hence, the total expenditure of households accounted for €101 billion. The consumption of Finnish households has been studied in terms of the classification of individual consumption by purpose (COICOP) and divided into 12 categories, A01–A12 (Table 1). The categories of housing, transport, and food, and non-alcoholic beverages have the largest shares of the total expenditure as well as the highest environmental impacts, as stated earlier. By this account, it is clear that the consumption pattern of Finnish households causes a major environmental burden.

2.2. Data Collection

The consumption expenditure of Finnish households was explored at a more detailed level of COICOP classification than that expressed in Table 1. The data were obtained from an online database maintained by Statistics Finland [33]. The data were used in their original format, in which the 12 main consumption categories are divided into several subgroups. Depending on the main category, these subgroups are further divided as many times as required to describe an exact product or service. The amount of annual expenditure is available separately for each product and service; therefore, it was possible to make specific calculations.

2.3. Calculation Model

In order to estimate the amount of the economic potential in question, a calculation model was created to calculate both the short-term and long-term potential values. Similar scenario methodology has been used e.g., by Bonilla et al. [34]. Every product and service included in the consumption data was evaluated separately to determine whether the product or service was essential to human well-being. If the necessity of any product or service was debatable, a percentage of deduction was defined and applied to the original amount of expenditure. The total economic potential value was approximated by adding up the possible savings of all consumption components. Additionally, background information from relevant entities and other reliable sources was used as a reference to support the choices of the deduction percentages.
No reductions were made in the consumption categories of health, communication and education. Firstly, these categories can be seen as an essential core of any welfare state; and secondly, they represent multiple sectors of Raworth’s [21] and Donught’s inner ceiling of social foundation (health, education, networks, income and work, political voice and social equity). They are also part of Gough’s [35] three basic needs (participation, health, and autonomy). In addition, these categories compose only 5.9% of Finnish household consumption expenditure. In the consumption category of miscellaneous goods and services, no reductions were made for insurance or items falling outside of consumption expenditure, which includes, for example, tax-like charges, membership fees, fines and interest payments, as their necessity and role in the future economy are difficult to predict.
The following two scenarios were formed to calculate the short-term and long-term economic potential values:
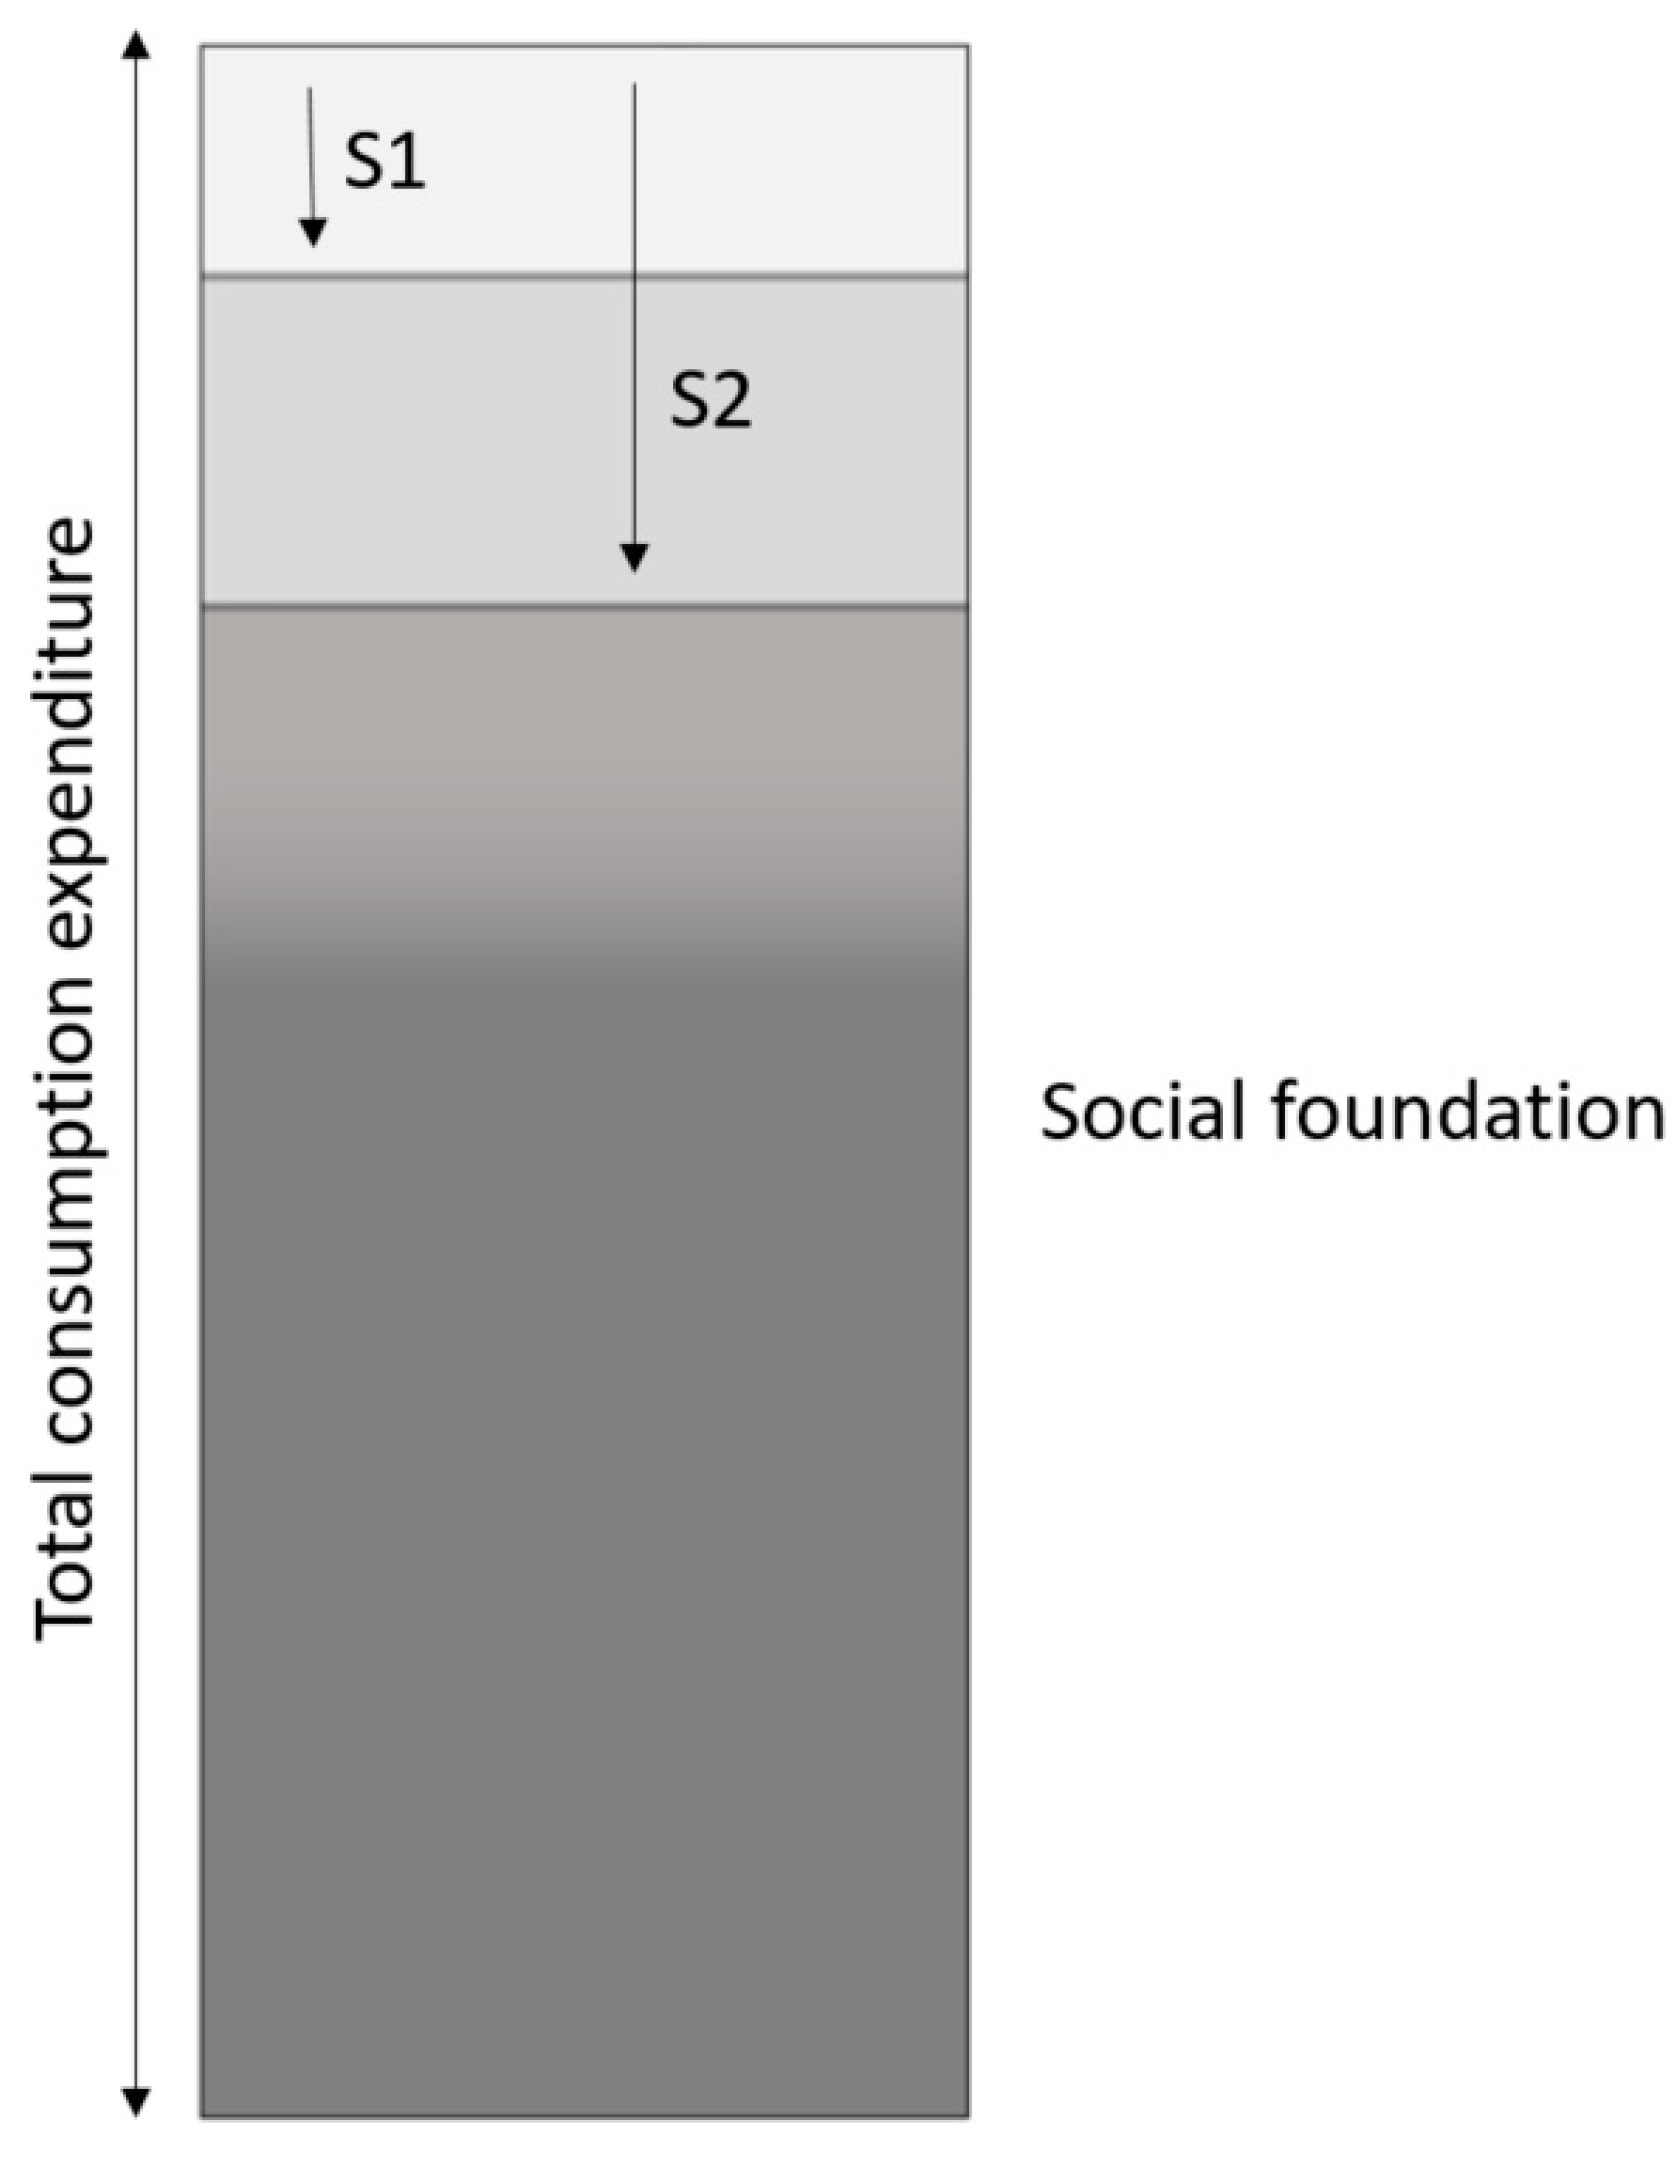
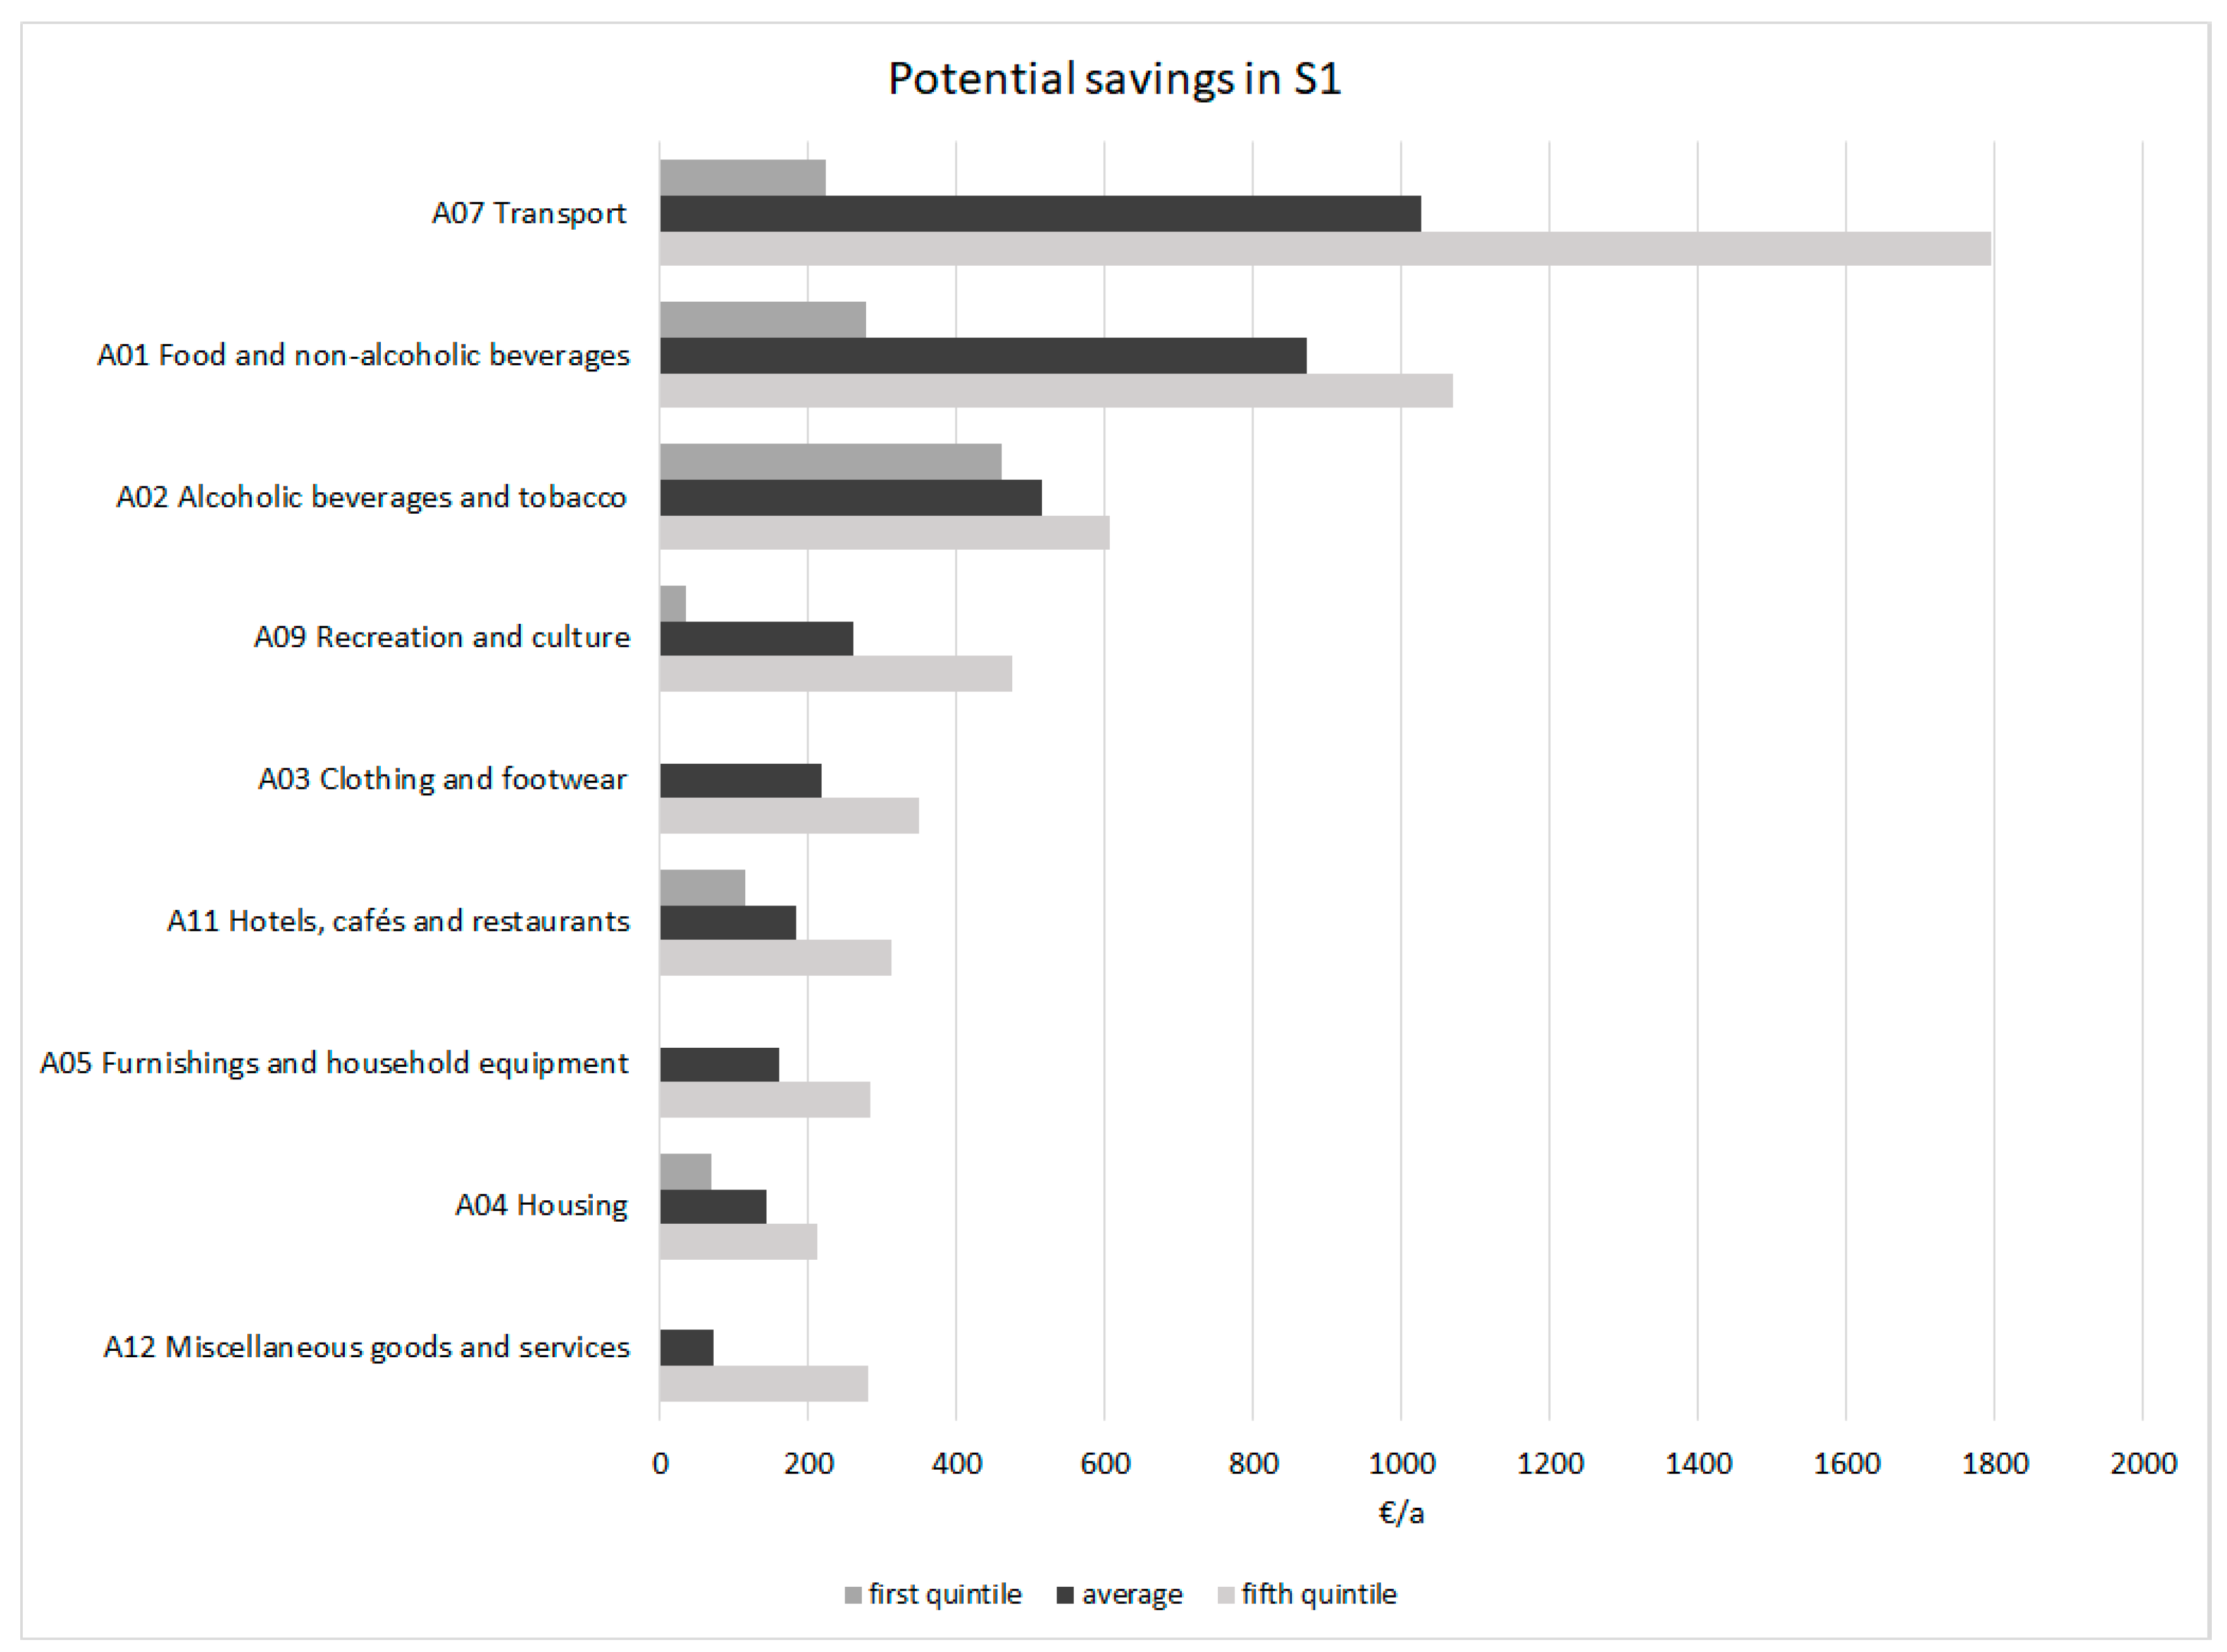
  • Scenario 1 (S1) describes an incremental situation which may be achieved quickly and easily over the next couple of years. In S1, the savings can be reached with rather simple and small actions, and a radical change of lifestyle is not required. These small actions include for example reducing the consumption of meat and reducing household energy consumption by performing small energy-saving actions.
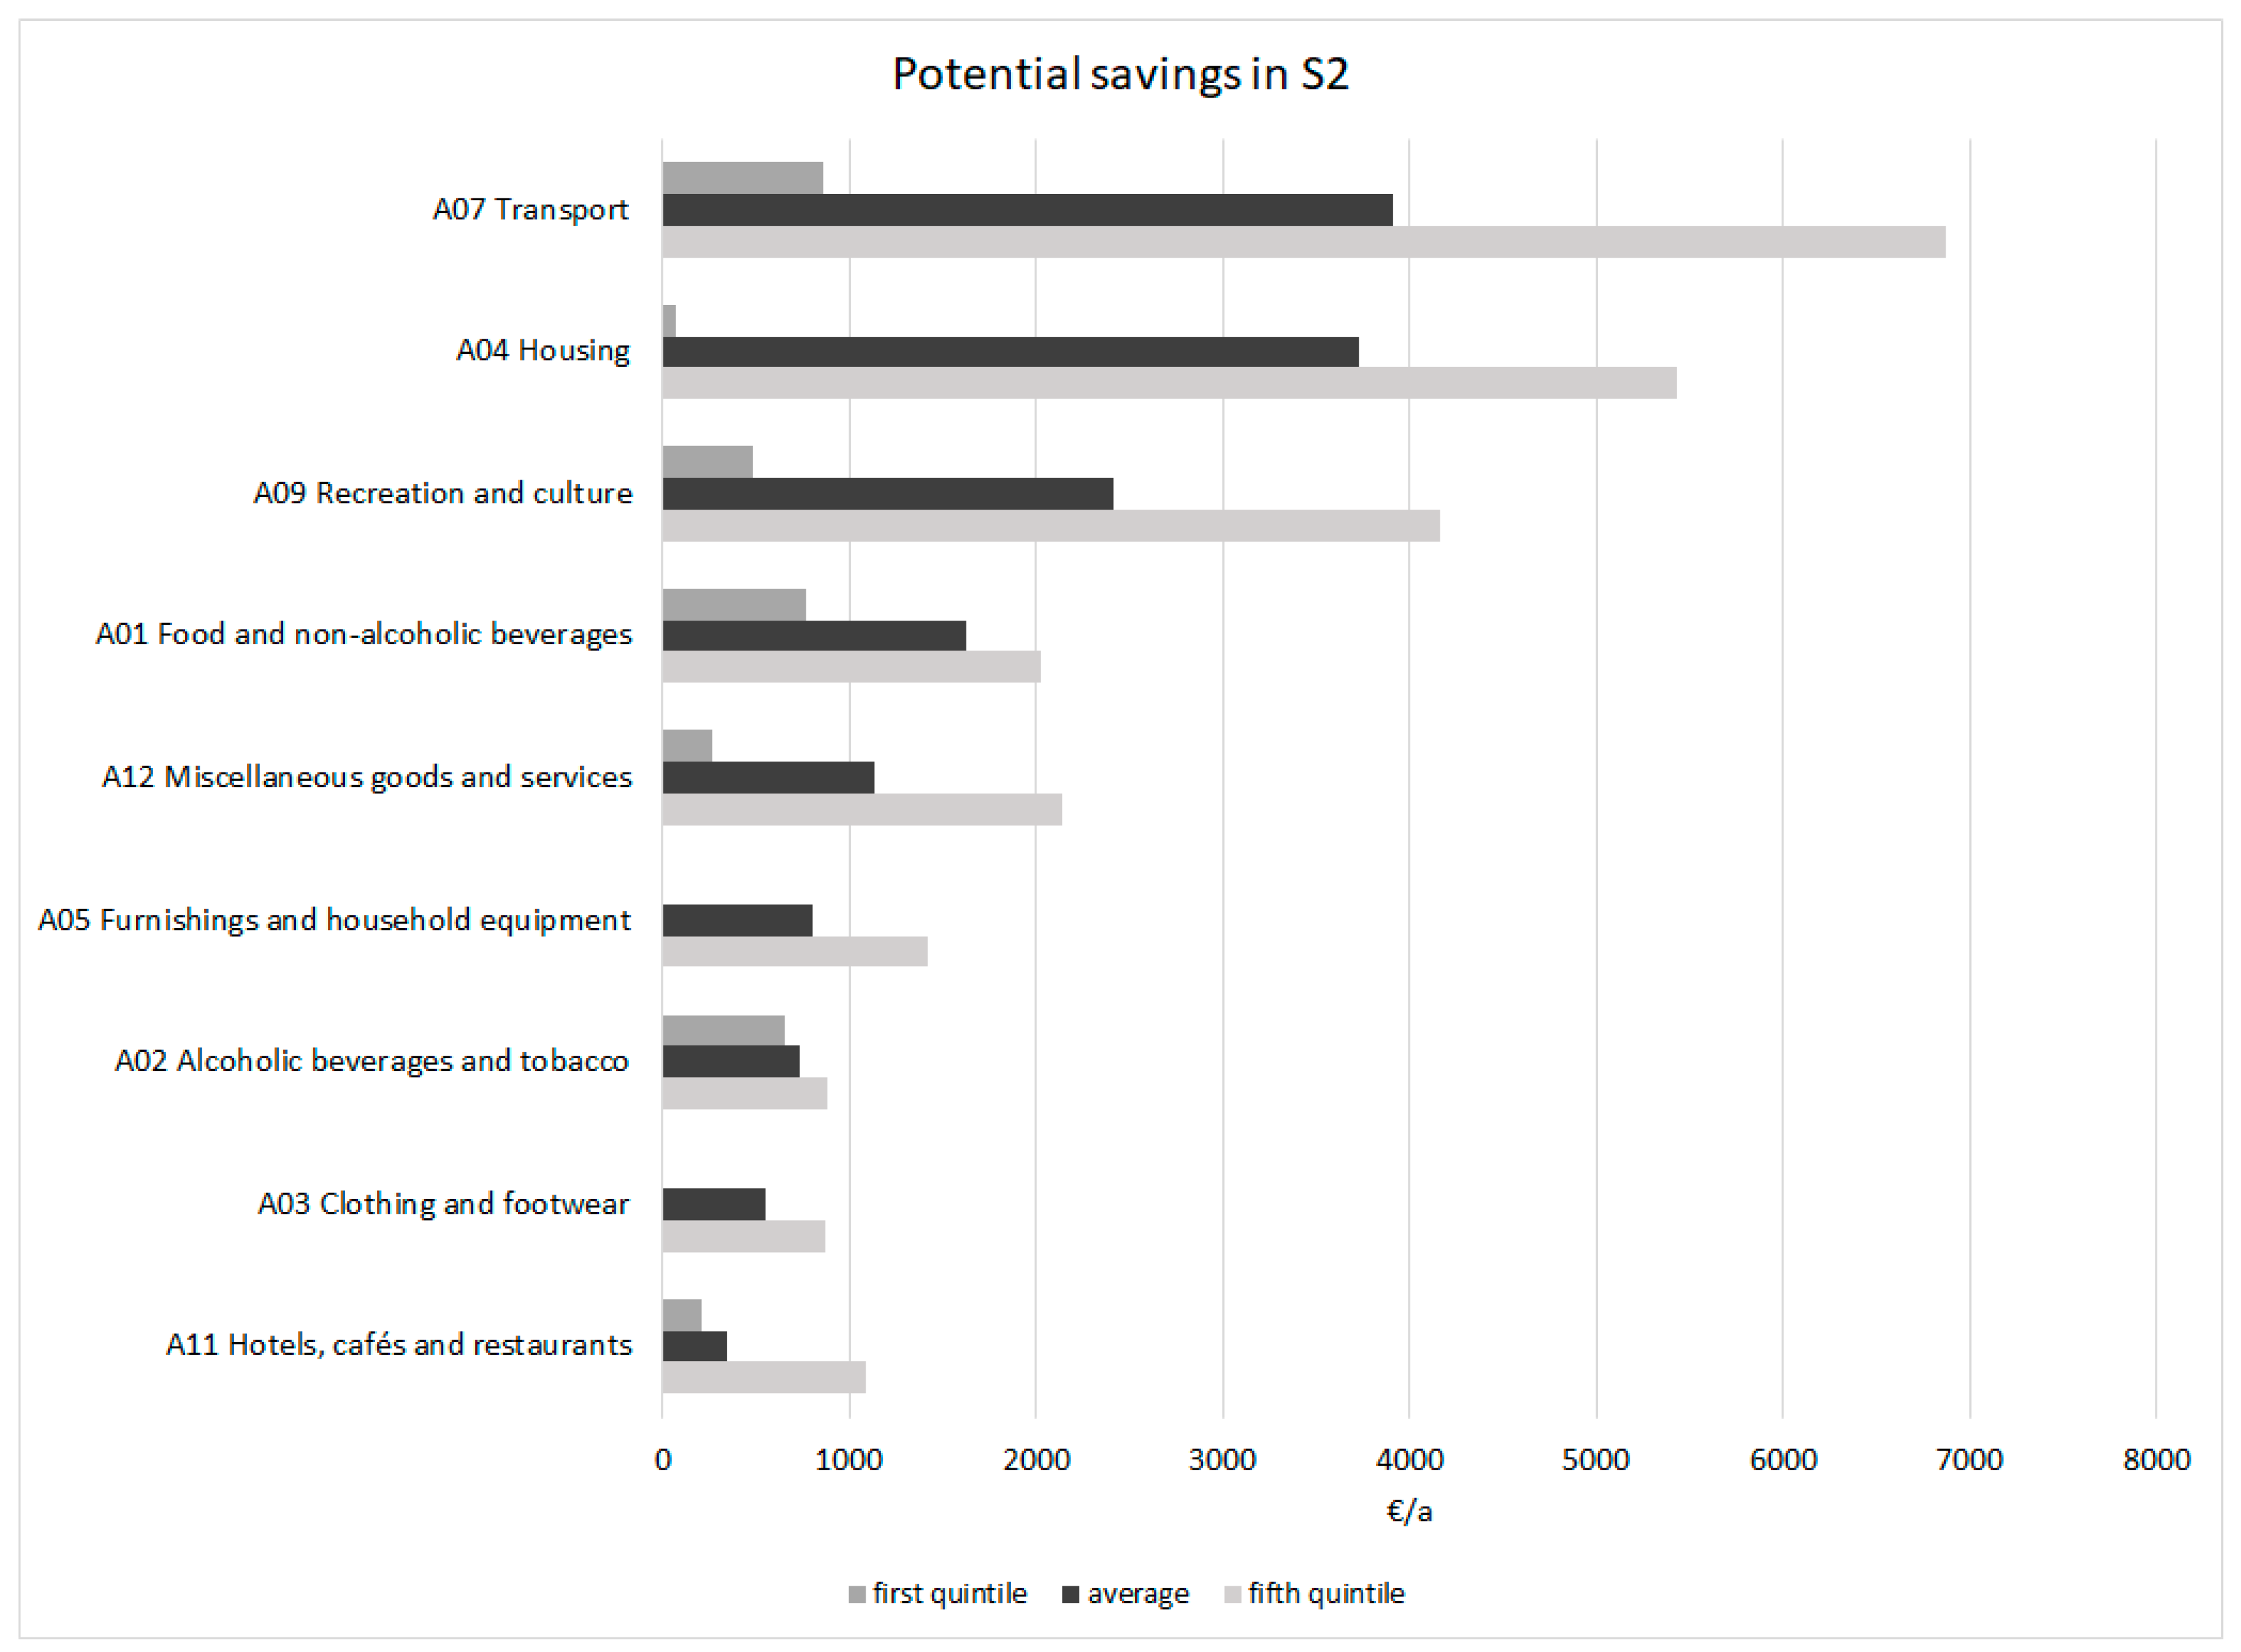
  • Scenario 2 (S2) is a long-term-goal scenario, which is also realistic provided that Finnish society is ready to implement fundamental changes. To be able to achieve the S2 situation, considerable willingness and action to shift towards more sustainable lifestyles would also be required globally. In S2, the ceiling of the social foundation is not risked, but almost all unnecessary consumption has been cut out. S2 may be viewed as describing the target for the next 15–20 years, as it requires significant changes at many societal levels.
Figure 1 presents how the total consumption expenditure is reduced in Scenario 1 and in Scenario 2. The ceiling of the social foundation is not risked in either of the scenarios.
Next, both of the two Scenarios are presented by category and quintiles with descriptions of the done reductions, reasoning, and reduction percentages. The changes in consumption can be either qualitative or quantitative. In our scenarios, the changes are quantitative with the exception of category A01 Food and non-alcoholic beverages in which the changes are partly qualitative. The deduction percentages can be found from Table 2. For category A01, Food and non-alcoholic beverages reductions are made in the consumption of meat, dairy and egg products, and unhealthy foods such as foodstuff containing lots of sugars, salt, and/or saturated fats. Reductions are based both into health and environmental sustainability claims. In Scenario 2, consumption of coffee, tea, and cocoa is also reduced. In category A02 (Alcoholic beverages and tobacco), the reductions are health based in both scenarios. In category A03 (Clothing and footwear), the reductions are based on the current amount of textile waste and reductions on the synthetic material used. In category A04 (Housing), the reductions are based on reductions on residential energy consumption, and room density per person. For category A05 (Furnishing and household equipment), the reductions are based on material footprint and the decreased need for furnishing following from the decreased floor area. In category A07 (Transport), the reductions are achieved with decreased purchase and usage of private vehicles and decreased purchase of overseas travel tickets. For category A09 (Recreation and culture), for example, the decrease in package tours and cruises abroad was estimated. For category A11 (Hotels, cafés and restaurants), the reductions are based on the reductions in unhealthy foods and alcoholic beverages, and accommodation services. For category A12 (Miscellaneous goods and services), a reduction in personal care and in consumption abroad were assumed.
As meat consumption was decreased in both scenarios, a rough calculation was made to estimate the necessary addition in plant-based protein intake. The average price per gram of protein was studied in eight common meat products and plant-based products. The nutritional information and prices were obtained from a Finnish retailer’s online service, Foodie.com [36]. According to the calculation, the average price of a plant-based protein gram is 32% lower than that of meat protein. In the final expenditure calculation, a conservative estimate of 25% was used, in which case 75% of the hypothetical savings from meat was used to purchase plant-based products. Possible other feedback loops were not identified and considered in this study.
In addition to calculating the Scenarios with a consumption structure in an average Finnish household, the Scenarios were also calculated for the first and fifth quintiles of income classes. The reductions for the first quintile were done so that the money available for consumption in each category equals the money available of an average household. This does not apply to unhealthy foods, alcohol and tobacco as the reduction are health based. Additionally, the reduction percentages are equal to an average households in categories A072 Operation of personal transport equipment and A045 Electricity, gas and other fuels because of there are alternative ways for private car use, and small changes in electricity use are generally doable in lower income households as well. For the fifth quintile, the same reduction percentages are applied as to average households. The reduction percentages for the scenarios are presented in Table 2.
More detailed description of the deduction percentages used in the calculation model and background information can be found in the Supplementary Materials, a link to which is provided at the end of this paper.

3. Results and Discussion

After applying the reduction percentages, the Finnish household’s economic potential to support sustainability can be calculated. The results for average households and the first and fifth quintiles by scenarios are presented in Figure 2 and Figure 3.
In Scenario 1, for an average household and fifth quintile, the largest savings in monetary terms are made in the consumption categories of transport and food, which also result in significant environmental impacts. For the fifth quintile, the savings in transport are noticeably higher than in other categories compared to an average household. This is because the quintile spends approximately twice as much on transport than an average household. The consumption categories of food and transport are among the top three in terms of the present household expenditure as well. While housing makes up almost one-third of the total expenditure, the savings in S1 are minor because the only reductions in this category are made in the household energy consumption. A large amount of money could be saved in alcoholic beverages and tobacco as well, according to S1. In other categories, the savings are more marginal. The largest monetary savings for the first quintile are made in the consumption categories of alcoholic beverages and tobacco, and food and non-alcoholic beverages. In some categories, there are no reductions at all.
Savings in Scenario 2 present a potential future scenario in which the most polluting consumption categories are reduced considerably. For an average household and the fifth quintile, the largest savings are made in the areas of transport, housing, recreation and culture, and food and non-alcoholic beverages. While the recreation and culture category is of a low environmental intensity, it is substantial in monetary terms and broadly consists of unnecessary consumption. Significant savings may also be achieved in miscellaneous goods and services, furnishings and household equipment, and alcoholic beverages and tobacco. The smallest savings are found in the consumption groups of clothing and footwear and hotels, cafés and restaurants, but these groups also represent some of the smallest in terms of the present expenditure.
Whereas for an average household and fifth quintile household there are large savings in the category of housing, there are almost no savings in that category for the first quintile. The biggest savings are made in the categories of transport, food, and alcoholic beverages and tobacco.
In Table 3, the total economic potential values in Scenario 1 and Scenario 2 for an average household are presented. Even though the implementation of expenditure reductions in S1 is not very demanding for individual households, the total amount of economic potential is remarkable. In the case of S2, households are expected to save 40.5% of their expenditure. This is a challenging amount, but it is clear that sustainability cannot be achieved without a drastic shift towards much more frugal lifestyles. With approximately 41 billion €—19% of Finland’s GDP [20]—per annum, Finnish households would have the opportunity to enhance sustainability significantly. The potential savings are calculated using the consumption expenditure and euro value of 2016, and the future value of the savings is not considered. In Table 4, the total economic potential values are calculated for the first and fifth quintiles. In S2, the economic potential of a fifth quintile household is 62% higher compared to an average household. The savings of the first quintile household in S2 approximately equals the savings of an average household in S1.
According to the results, it could be argued that private households have the opportunity to take a leading role or at least play a significant part in sustainability crisis management. Investment possibilities for the money saved are numerous. Figueres et al. [3] have set six milestones which identify the ideal situation for 2020 concerning energy, infrastructure, transport, land use, industry, and finance. Households could impact all of these categories, either directly or indirectly. The most concrete actions could likely be taken in the energy and transport sectors, as individual households become able to purchase, for example, solar panels or electric vehicles for themselves. Two rough calculations were made to estimate the potential to support solar energy production or electric private transportation with S1 savings (Table 5).
The results indicate that, with only small changes in behaviour and consumption expenditure, households have the opportunity to choose to support sustainability with a high financial input. According to the calculations, 60% of Finnish residential buildings could be solar powered in one year with the potential savings from Scenario 1. This represents 16% of the total Finnish electricity consumption in households, as the average annual electricity production of solar panel system is 4450 kWh [37], and the total annual Finnish electricity consumption on housing is 21 TWh [41]. Concerning electric transportation, Figueres et al. [3] suggest that globally, 15% of annual new car sales should consist of electric cars. With the savings from Scenario 1, virtually double the amount of newly registered cars could be purchased as electric vehicles. Investments into solar power, and to some extent into electric vehicles, will be paid back because of reduced operating costs. The earned savings can be used, for example, for further investments in renewable energy. It is also a possibility that some of the savings may be invested into additional free time by, for example, reducing working hours. However, our aim was to focus more on calculating the potential of initial savings instead of discussing further investment opportunities.
While Scenario 1 is achievable without major systemic changes within Finnish society, the situation with Scenario 2 is different. Radical reduction in consumption as we know it will have far-reaching effects on many levels. Transitions must occur everywhere: the global economy and politics must be based on more ecological and humane values than what they are today; the dominance of fossil-fuel based industries must vanish; businesses that destroy nature beyond repair or do not contribute to sustainability in any way, shape, or form must be radically decreased; the concepts of private ownership and materialism must be praised no longer; and more generally, the global mindset and focus should be directed squarely at solutions to the sustainability crisis. As entire industries disappear, jobs must be created elsewhere. This shift will require more than a couple of years, but change must begin immediately.
Liobikienė & Mandravickaitė [22] point out that it is not possible to achieve more sustainable consumption patterns by only changing the household consumption structure. Government policies affecting technological development and inducing more sustainable production and consumption are required as well. Political decision-making can indeed be a major contributor to the change towards a more sustainable society. However, as our calculations indicate, it is indeed possible to support sustainability by changing consumption patterns. Political action should be taken to support sustainable consumption choices and to induce general household-level participation. Examples of possible policies include taxation systems favouring sustainable choices, science-based decision-making or leading by example. The results of the study could also be linked to the managerial use of sustainable factors [42] or collaborative economy analyses [43]. In the EU level, the potential savings are even higher. According to a rough calculation based on an average consumption per capita in EU [44], the total household consumption is approximately 9.2 trillion €. If similar redirection of consumption potential than in Finnish S1 and S2 is assumed, the economic potential in EU level would be from 0.92 to 3.9 trillion €. The study of household expenditure in other countries is necessary in order to understand the economic situation globally.
This research was carried out using the average consumption pattern of Finnish households. The first and fifth quintiles of income classes were studied as well. There are major differences in the relative and absolute potentials between these quintiles. It is possible that with the fundamental changes needed in Scenario 2, the savings achievable by the fifth quintile could be even higher.
Much of the existing research [22,24,25,26] conclude that housing, transportation and food are the three most polluting consumption categories in terms of greenhouse gas emissions. Categories of transportation and housing are also the ones which provide the biggest possibilities for monetary savings in S2. Category of food and non-alcoholic beverages is also among the four biggest potentials, whilst the category of recreation and culture has the third biggest potential. For future research, it would be a point of interest to assess the greenhouse gas reductions achieved by reducing unnecessary consumption. Additionally, what should be done with the saved money in order to avoid consumption shifting from unsustainable consumption category to another unsustainable use should be studied. Another point of interest would be performing an analysis for a scenario in which the households shift their spending towards more sustainable categories instead of mostly reducing their consumption. Additionally, a topic for future research could be studying the possible consumers’ decisions which would not only benefit the environment but also enhance individuals’ well-being such as reducing housing area and spending the amount saved for recreational and cultural activities that do not require a lot of resources.

4. Conclusions

In this study, two scenarios were formulated to estimate the amount of money that Finnish households could use to support sustainability after changing their consumptive behaviour. Scenario 1 only requires relatively easy and small changes in household consumption, whereas Scenario 2 requires households to change their lifestyles more radically. In S1, an average household could save €3400 annually, which translates into €9.2 billion in total in Finland. In S2, the economic potential of an average household is €15,000 per year, adding up to €40.8 billion in total. The largest savings would be realised in the four consumption categories of transport, housing, recreation and culture, and food and non-alcoholic beverages. Out of these categories, transport, housing and food are the three most polluting consumption categories in terms of greenhouse gas emissions as well. Therefore, a relevant topic for future research is to assess the greenhouse gas reduction impact, which is created together by reduced consumption and money directed to sustainable investments.
The results of the study suggest that Finnish households could significantly impact sustainability without compromising the fulfilment of basic needs in the context of the Finnish welfare society. In Scenario 1, savings can be reached with rather simple and small actions, and a radical change of lifestyle is not required. With the amount saved in Scenario 1, solar power could be installed in 60% of Finnish residential buildings, which is more than all the detached houses of Finland. Alternatively, all new car registrations could be for electric cars. In Scenario 2, a considerable willingness and action to shift towards more sustainable lifestyles would be required, and fundamental changes would be needed as almost all unnecessary consumption would have to be cut out. Some businesses would have to vanish, but there would be a need for new ones. This change will take time, but the transition should start immediately. Based on an average consumption per capita in the EU, the savings of Scenario 2 would add up to 3.9 trillion €. The results show that although governmental policies are needed to support sustainability, the consumption choices of households indeed have a significant role in safeguarding the planet.

Supplementary Materials

The following are available online at https://www.mdpi.com/2071-1050/10/11/3961/s1, Table S1: Deduction percentages used in the calculation model for Scenario 1, Table S2: Deduction percentages used in the calculation model for Scenario 2.

Author Contributions

S.J. and A.C. analysed the data. A.C., S.J., V.U., M.L. and L.L. wrote the paper.

Funding

This research received no external funding.

Acknowledgments

Helka Mustonen calculated the economic potential of the quintiles.

Conflicts of Interest

The authors declare no conflict of interest.

References

  1. Le Quéré, C.; Andrew, R.M.; Friedlingstein, P.; Sitch, S.; Pongratz, J.; Manning, A.C.; Korsbakken, J.I.; Peters, G.P.; Canadell, J.G.; Jackson, R.B.; et al. Global Carbon Budget 2017. Earth Syst. Sci. Data 2018, 10, 405–448. [Google Scholar] [CrossRef] [Green Version]
  2. Energy Sector’s Carbon Emissions to Grow for Second Year Running. Available online: https://www.theguardian.com/environment/2018/oct/08/energy-sector-carbon-emissions-grow-second-year-climate-change-coal (accessed on 25 October 2018).
  3. Figueres, C.; Schellnhuber, H.J.; Whiteman, G.; Rockström, J.; Hobley, A.; Rahmstorf, S. Three years to safeguard our climate. Nature 2017, 543, 593–595. [Google Scholar] [CrossRef] [PubMed]
  4. UNFCCC. Adoption of the Paris Agreement. Available online: http://unfccc.int/resource/docs/2015/cop21/eng/l09.pdf (accessed on 25 September 2017).
  5. Claudelin, A.; Uusitalo, V.; Pekkola, S.; Leino, M.; Konsti-Laakso, S. The Role of Consumers in the Transition toward Low-Carbon Living. Sustainability 2017, 9, 958. [Google Scholar] [CrossRef]
  6. Lindgreen, A.; Hingley, M.K.; Angell, R.J.; Memery, J. A Stakeholder Approach to Managing Food: Local, National and Global Issues, 1st ed.; Routledge: Abingdon, ON, Canada; New York, NY, USA, 2017; ISBN 978-1-315-26526. [Google Scholar]
  7. Xia, T.; Zhang, Y.; Braunack-Mayer, A.; Crabb, S. Public attitudes toward encouraging sustainable transportation: An Australian case study. Int. J. Sustain. Transp. 2017, 11, 593–601. [Google Scholar] [CrossRef]
  8. Fitzpatrick, M. Obstacles to Going Green: Survey Results! What Prevents You from Being More Green? Available online: http://www.keenforgreen.com/obstacles-to-going-green-what-prevents-you-from-being-green (accessed on 13 September 2017).
  9. 4 in 5 Consumers Think Eco-Friendly Products Cost More “Green”. Available online: http://retailmenot.mediaroom.com/2015-04-07-4-in-5-Consumers-Think-Eco-Friendly-Products-Cost-More-Green (accessed on 13 September 2017).
  10. Inter IKEA Systems B.V. Climate Action Starts at Home—Climate Action Research Report 2018. Available online: https://www.ikea.com/ms/en_US/pdf/reports-downloads/IKEA Climate Action Report 20180906 (002).pdf (accessed on 26 October 2018).
  11. Leviston, Z.; Greenhill, M.; Walker, I. Australian Attitudes to Climate Change and Adaptation: 2010–2014; CSIRO: Canberra, Australia, 2015. [Google Scholar]
  12. Dryzek, J.; Norgaard, R.; Schlosberg, D. Climate Change and Society: Approaches and Responses. In The Oxford Handbook of Climate Change and Society; Dryzek, J., Norgaard, R., Schlosberg, D., Eds.; Oxford University Press: Oxford, UK, 2011; ISBN 9780199566600. [Google Scholar]
  13. Van der Linden, S.; Maibach, E.; Leiserowitz, A. Improving Public Engagement with Climate Change: Five “Best Practice” Insights from Psychological Science. Perspect. Psychol. Sci. 2015, 10, 758–763. [Google Scholar] [CrossRef] [PubMed]
  14. Statistics Finland. Greenhouse Gas Emissions Caused by Households’ Consumption Have Decreased. Available online: http://tilastokeskus.fi/til/ktutk/2012/ktutk_2012_2014-10-07_tie_001_en.html (accessed on 25 September 2017).
  15. Seppälä, J.; Mäenpää, I.; Koskela, S.; Mattila, T.; Nissinen, A.; Katajajuuri, J.; Härmä, T.; Korhonen, M.; Saarinen, M.; Virtanen, Y. An assessment of greenhouse gas emissions and material flows caused by the Finnish economy using the ENVIMAT model. J. Clean. Prod. 2011, 19, 1833–1841. [Google Scholar] [CrossRef]
  16. Lorek, S.; Trotta, G. Consumers and Energy Efficiency—Country Report Finland. An Inventory of Policies, Business and Civil Society Initiatives, Focusing on Heating, Hot Water and the Use of Electricity. 2015. Available online: http://www.utu.fi/en/units/euforie/Research/deliverables/country-reports/PublishingImages/Pages/home/EUFORIE%20D%205%201%20%20Country%20Report%20Finland.pdf (accessed on 25 September 2017).
  17. United Nations. Agenda 21: Programme of action for sustainable development: Rio declaration on environment and development. In Proceedings of the Statement of Forest Principles the Final Text of Agreements Negotiated by Governments at the UN Conference on Environment and Development (UNCED), Rio de Janeiro, Brazil, 3–14 June 1992; Department of Public Information: New York, NY, USA, 1992. Available online: https://sustainabledevelopment.un.org/content/documents/Agenda21.pdf (accessed on 25 September 2017).
  18. Kok, R.; Benders, R.M.J.; Moll, H.C. Measuring the environmental load of household consumption using some methods based on input-output energy analysis: A comparison of methods and a discussion of results. Energy Policy 2006, 34, 2744–2761. [Google Scholar] [CrossRef]
  19. Kerkhof, A.C.; Nonhebel, S.; Moll, H.C. Relating the environmental impact of consumption to household expenditures: An input-output analysis. Ecol. Econ. 2009, 68, 1160–1170. [Google Scholar] [CrossRef]
  20. OECD Stat. 5. Final Consumption Expenditure of Households. Available online: https://stats.oecd.org/Index.aspx?DataSetCode=SNA_TABLE5 (accessed on 25 September 2017).
  21. Raworth, K. Doughnut Economics—Seven Ways to Think Like a 21st-Century Economist, 1st ed.; Random House Business Books: London, UK, 2017; ISBN 9781847941398. [Google Scholar]
  22. Liobikienė, G.; Mandravickaitė, J. Convergence of new members of the EU: Changes in household consumption expenditure structure regarding environmental impact during the prosperous period. Environ. Dev. Sustain. 2013, 15, 407–427. [Google Scholar] [CrossRef]
  23. European Environmental Agency. The European Environment—State and Outlook 2010: Synthesis; State of Environment Report No 1; Publications Office of the European Union: Luxembourg, 2010. [Google Scholar]
  24. Ivanova, D.; Stadler, K.; Steen-Olsen, K.; Wood, R.; Vita, G.; Tukker, A.; Hertwich, E.G. Environmental Impact Assessment of Household Consumption. J. Ind. Ecol. 2015, 20, 526–536. [Google Scholar] [CrossRef] [Green Version]
  25. Poom, A.; Ahas, R. How Does the Environmental Load of Household Consumption Depend on Residential Location? Sustainability 2016, 8, 799. [Google Scholar] [CrossRef]
  26. Kalbar, P.P.; Birkved, M.; Hauschild, M.; Kabins, S.; Nygaard, S.E. Environmental impact on urban consumption patterns: Drivers and focus points. Resour. Conserv. Recycl. 2018, 133, 260–269. [Google Scholar] [CrossRef]
  27. Girod, B.; van Vuuren, D.P.; Hertwich, E.G. Climate policy through changing consumption choices: Options and obstacles for reducing greenhouse gas emissions. Glob. Environ. Chang. 2014, 25, 5–15. [Google Scholar] [CrossRef]
  28. Gough, I. Heat, Greed and Human Need: Climate Change, Capitalism and Sustainable Wellbeing, 1st ed.; Edward Elgar Publishing Limited: Cheltenham, UK, 2017; ISBN 978 178536511 9. [Google Scholar]
  29. Sheth, J.; Sethia, N.; Srinivas, S. Mindful consumption: A customer-centric approach to sustainability. J. Acad. Mark. Sci. 2011, 39, 21–39. [Google Scholar] [CrossRef]
  30. Thøgersen, J. How May Consumer Policy Empower Consumers for Sustainable Lifestyles? J. Consum. Policy 2005, 28, 143–177. [Google Scholar] [CrossRef]
  31. De Boer, J.; Schösler, H.; Aiking, H. “Meatless days” or “less but better”? Exploring strategies to adapt Western meat consumption to health and sustainability challenges. Appetite 2014, 76, 120–128. [Google Scholar] [CrossRef] [PubMed]
  32. Byerly, H.; Balmford, A.; Ferraro, P.J.; Hammond Wagner, C.; Palchak, E.; Polasky, S.; Ricketts, T.H.; Schwartz, A.J.; Fisher, B. Nudging pro-environmental behavior: Evidence and opportunities. Front. Ecol. Environ. 2018, 16, 159–168. [Google Scholar] [CrossRef]
  33. Statistics Finland. Household Consumption Expenditure by Income Bracket by Price, Consumption Expenditure, Year, Consumption Unit and Income Bracket 1985–2016. Available online: https://pxnet2.stat.fi:443/PXWeb/sq/767fcc8c-f025-410d-abb1-d4cee288d19b (accessed on 13 September 2018).
  34. Bonilla, S.; Silva, H.; Silva, M.T.; Gonçalves, R.F.; Sacomano, J. Industry 4.0 and Sustainability Implications: A Scenario-Based Analysis of the Impacts and Challenges. Sustainability 2018, 10, 3740. [Google Scholar] [CrossRef]
  35. Gough, I. Climate change and sustainable welfare: The centrality of human needs. Camb. J. Econ. 2015, 39, 1191–1214. [Google Scholar] [CrossRef]
  36. Foodie.fi. Available online: https://www.foodie.fi/ (accessed on 25 September 2017).
  37. Fortum. Tee Oma Sähkösi Auringolla. Available online: https://www.fortum.com/countries/fi/energiansaasto-ja-ratkaisut/aurinkopaneelit-aurinkopaketti/pages/default.aspx?ad=search&gclid=Cj0KCQjwqvvLBRDIARIsAMYuvBF0EGfsfhxnb359EIVYqYQ9K03PVKaLwRY1NDPot53c8JV4YiByE98aAuxoEALw_wcB (accessed on 25 September 2017).
  38. Statistics Finland. Buildings by Area, Year of Construction, Information and Intended Use of Building. Available online: http://pxnet2.stat.fi/PXWeb/sq/ef7a5e8a-c34c-455f-83d4-8786b62e2747 (accessed on 26 October 2018).
  39. Association of Automobile Importers in Finland. Autotietokanta. Available online: https://media.autotietokanta.fi/ (accessed on 25 September 2017).
  40. The Finnish Information Centre of Automotive Sector. New Registrations of Passenger Cars. Available online: http://www.autoalantiedotuskeskus.fi/en/statistics/new_registrations/long-term_statistics/new_passenger_car_registrations (accessed on 25 September 2017).
  41. Statistics Finland. Warm Weather Decreased Energy Consumption in Households in 2015. Available online: http://tilastokeskus.fi/tup/suoluk/suoluk_tulot_en.html (accessed on 17 October 2017).
  42. Saura, J.R.; Reyes-Menendez, A.; Alvarez-Alonso, C. Do Online Comments Affect Environmental Management? Identifying Factors Related to Environmental Management and Sustainability of Hotels. Sustainability 2018, 10, 3016. [Google Scholar] [CrossRef]
  43. Palos-Sanchez, P.R.; Correia, M.B. The collaborative economy based analysis of demand: Study of Airbnb case in Spain and Portugal. J. Theor. Appl. Electron. Commer. Res. 2018, 13. [Google Scholar] [CrossRef]
  44. Eurostat. Household Consumption by Purpose. Available online: http://ec.europa.eu/eurostat/statistics-explained/index.php/Household_consumption_by_purpose (accessed on 3 November 2017).
Figure 1. The reductions of S1 and S2 from the total consumption expenditure.
Sustainability 10 03961 g001
Figure 2. The potential savings in S1 for an average household and the first and fifth quintiles.
Sustainability 10 03961 g002
Figure 3. The potential savings in S2 for an average household and the first and fifth quintiles.
Sustainability 10 03961 g003
Table 1. The consumption structure of an average, 1st and 5th quintile of Finnish households in 2016 [33].
Average1st Quintile5th Quintile
€/a%€/a%€/a%
Aver. household consumption expenditure37,551100.018,545100.059,453100.0
A04 Housing11,48030.6690937.316,86928.4
A07 Transport580815.5196410.610,46217.6
A12 Miscellaneous goods and services499813.317669.5859914.5
A01 Food and non-alcoholic beverages438111.7245713.256069.4
A09 Recreation and culture34459.215168.2594310.0
A11 Hotels, cafes and restaurants17694.77283.934835.9
A05 Furnishings and household equipment15954.26033.328264.8
A06 Health12573.37253.917583.0
A03 Clothing and footwear10912.95452.917422.9
A08 Communication8812.35863.211101.9
A02 Alcoholic beverages and tobacco7922.16983.89601.6
A10 Education550.1480.3970.2
Table 2. The reduction percentages for S1 and S2 for an average household and first and fifth quintiles.
Consumption CategoryS1S2
Average1st Quintile5th QuintileAverage1st Quintile5th Quintile
A01 Food and non-alcoholic beverages
A0112 Meat (ND)50%3%50%80%61%80%
A0114 Milk, cheese and eggs20%0%20%80%63%80%
A0121 Coffee, tea and cocoa 50%22%50%
Unhealthy foods *75%36–65%75%90%75–86%90%
A02 Alcoholic beverages and tobacco
A021 Alcoholic beverages60%60%60%90%90%90%
A022 Tobacco75%75%75%100%100%100%
A03 Clothing and footwear20%0%20%50%0%50%
A04 Housing, water, electricity, gas, and other fuels
A041 Rental housing 35%0%35%
A0421 Housing of owner-occupiers 35%0%35%
A045 Electricity, gas and other fuels10%10%10%30%10%30%
A05 Furnishings, household equipment and routine maintenance of the house10%0%10%50%0%50%
A07 Transport
A071 Purchase of vehicles20%0%20%75%075%
A072 Operation of personal transport equipment20%20%20%75%75%75%
A0730 Overseas travel tickets20%20%20%90%90%90%
A09 Recreation and culture 70%32%70%
A09611S1 Package tours and cruises abroad20%20%20%
Toys, hobby equipment, major durables for sport and leisure30–50%0–15%30–50%
A11 Hotels, cafés and restaurants
Unhealthy foods *, alcohol50%50%50%90%90%90%
A112 Accommodation services 50%0%50%
A12 Miscellaneous goods and services
A121 Personal care10%0%10%50%0%50%
A122 Personal effects 50%0%50%
A1271002 Consumption n.e.c. abroad10%0%10%80%80%80%
Note: * incl. soft drinks and processed food containing lots of sugar, salt and/or saturated fat.
Table 3. The economic potential values for an average Finnish household in Scenario 1 and in Scenario 2.
2016S1S2
Total consumption expenditure, €/a37,55134,10720,327
Economic potential per household, €/a 344515,224
Economic potential per household, % of present expenditure 9.240.5
Total economic potential in Finland 1 in bn €/a 9.240.8
1 2.68 million households.
Table 4. The economic potential values for the first and fifth quintile of Finnish households in Scenario 1 and Scenario 2.
1st Quintile5th Quintile
2016S1S22016S1S2
Total consumption expenditure, €/a18,54517,41015,24659,45354,07034,816
Economic potential per household, €/a 11353299 538324,637
Economic potential per household 6.117.7 9.141.4
% of present expenditure
Table 5. The potential to invest in solar energy production or electric private transportation with Scenario 1 savings.
Solar Energy
Solar power system [37]10,00
Residential buildings in Finland [38]1,290,300pcs
Estimated that 60% of the buildings could be installed with solar power774,180pcs
Total price7.74bn €
Electric Transportation
Average price of a new electric car in Finland [39]38,617
Average amount of new car registrations in Finland in 2010–2016 [40]122,500pcs/a
Possible new electric car registrations with S1 savings238,238pcs/a

