Article

Identifying Risk Indicators of Building Damage Due to Typhoons: Focusing on Cases of South Korea

1
Department of Architectural Engineering, Mokpo National University, Mokpo 58554, Korea
2
School of Architectural Engineering, University of Ulsan, Ulsan 44610, Korea
3
Department of Social Welfare, Pusan National University, Busan 46241, Korea
4
Department of Architectural Engineering, Hanbat National University, Daejeon 34158, Korea
5
Department of Architectural Engineering, Pusan National University, Busan 46241, Korea
*
Author to whom correspondence should be addressed.
Sustainability 2018, 10(11), 3947; https://doi.org/10.3390/su10113947
Submission received: 23 September 2018 / Revised: 18 October 2018 / Accepted: 25 October 2018 / Published: 30 October 2018

Abstract

:
This study identifies the risk indicators of building damage from typhoons and determines the correlations among this damage, typhoon information, geographic vulnerability, construction environment, and socioeconomic vulnerability. This fundamental research aids the development of a typhoon loss prediction model for building construction projects in South Korea. Extreme weather events have become increasingly prevalent around the world, with subsequent increases in related damages. Early attempts to meet the growing demands for a loss prediction model have been insufficiently comprehensive, and specifically in South Korea, research on risk indicators is needed that considers the geographic, building, and socioeconomic features. This research used the regional typhoon loss records from the annual report of the Ministry of Public Safety and Security (MPSS) to define the dependent variable of building damage. The results and findings of this study will inform the development of a typhoon loss prediction model in South Korea.

1. Introduction

The frequency of extreme meteorological events has increased exponentially in Korea, with resulting increases in damage [1]. In August 2002, Typhoon Rusa hit the southern coast of the Korean Peninsula with highly destructive force. The estimated losses were approximately 4600 million USD in this single event. Typhoon Maemi (2003) and Typhoon Olga (1999) struck the southern coast and the western part of the Korean Peninsula, incurring losses of approximately 3800 million USD and 900 million USD, respectively [2]. Tropical cyclones occur frequently during a short season, inducing losses and creating problems such as demand surges. Hurricanes occur year round, but 40% occur in September. On average, 6.1 hurricanes and 1.73 typhoons hit the United States annually [3]. To manage the tremendous and critical damage from tropical cyclones in the United States, the Federal Emergency Management Agency (FEMA) conducted a HAZUS-Multi Hazard (HAZUS-MH) analysis to predict loss due to floods, earthquakes, and hurricanes. In addition, Florida, a region frequently damaged by tropical cyclones, has developed the Florida Public Hurricane Loss Model (FPHLM) as an effective tool to estimate insurance premium rates according to the disaster risk.
Although prone to tropical cyclones, South Korea does not yet have such an assessment model to prepare against similar disasters. The models developed for use in the United States do not directly apply in South Korea due to the differences in the storm sizes, severity, and the difference in the vulnerability of domestic properties. There is a need to identify the risk indicators and build a loss prediction model for use in South Korea. Defining the indicators is the first stage in the model development. Moreover, the shortage of loss data and poor data quality in South Korea is a constraint for developing loss prediction models. Industrialized countries such as USA and Western European countries would be able to easily create the vulnerability function based on the stocked inventory data of buildings and explicit loss experiences. However, in a developing country such as South Korea, there is a shortage of the detailed damage data and building inventory information due to a lack of awareness of the importance of data, although there have been many extreme catastrophic events [4]. Therefore, it is necessary to develop the model considering the present low data quality and scarcity. Developing spatial scale models should be one of the possible solutions to resolve the difficulties.
Studies have investigated the economic losses from typhoons and defined major risk indicators, but there has been a shortage of comprehensive studies that consider the characteristics of typhoons, such as precipitation and wind speed. A loss analysis should consider various indicators, including meteorological indicators, the built environment, geographic vulnerability, and socioeconomic vulnerability because the risk arises from a combination of the hazards, exposure, and vulnerability [5]. However, the current typhoon damage research has focused on meteorological data and indicators. Lee and Chang (2009) studied a method to assess typhoon risk using precipitation and wind speed from the Geographic Information System (ArcGIS, Redlands, CA, USA) [6]. Lee (2013) created a natural hazard prediction model using a typhoon’s wind speed and precipitation [7]. Kim (2013) investigated the features and damage scale caused by the typhoon’s wind speed and suggested a management system for strong winds [8]. Jeon et al. (2008) conducted a damage analysis considering the regional characteristics of heavy rain and typhoon records [9]. Lee and Kim (2012) analyzed the typhoon damage from high winds in rural-area properties to establish a countermeasure strategy for the typhoon [10]. These studies focused on the typhoon’s information, such as wind speed and precipitation. Nevertheless, various additional vulnerability factors should be included because a typhoon is a complex disaster, and the damage is not solely decided by its magnitude. Therefore, a comprehensive risk analysis considering diverse vulnerability indicators is necessary to develop an effective typhoon damage prediction model.
On the other hand, a lot of research has been done to predict the damage caused by hurricanes. They used a number of vulnerability indicators and various hurricane indicators to explain their relationship to economic losses. Highfield et al. classified the connection between vulnerability indicators and hurricane damage to the Texas coastal region of the United States [11]. Built environment, Social, and geographical variables were utilized as vulnerability indicators. The study identified significant vulnerability indicators and demonstrated relationships between the various indicators. Burton investigated the relationship between hurricane losses, social vulnerability indicators and hurricane characteristics for the Mississippi coastal counties of the United States [12]. He explained the relationship between variables and suggested coefficient of significance. The study confirmed how the various vulnerability indicators affect hurricane damage and show relationships between the various indicators. Kim et al. explains the damage to the coast of Texas, USA, caused by Hurricane Ike, with various vulnerability indicators [13]. Geographical indications, building property information, and hurricane information were used as indicators. The study also showed relationships between the various indicators and identified hurricane damage and significant vulnerability indicators. Sparks et al. have confirmed the relationship between hurricane features and insurance losses in Florida and South Carolina to reduce hurricane damage [14]. This study identifies and explains areas of vulnerability to hurricanes that have a positive relationship between damage and wind speed. This research provides a means to classify the correlation between insurance losses and hurricane variables. Many researchers used vulnerability indicators to predict hurricane damage and provide a framework for predicting damage.
This study derives the indicators of regional building damages caused by typhoon and uses multiple regression analysis to define their relationships with influencing indicators. This study adopts various influencing indicators from previous studies, which are classified into four categories: meteorological concerns, built environment vulnerability, geographic vulnerability, and socioeconomic vulnerability. The results and findings will inform the development of a typhoon damage prediction model for use in South Korea. Moreover, at the provincial level, this model would be helpful to government emergency planners and insurance companies. For example, the government emergency planners can assign the budget to correspond with extreme events by regions. The primary insurance companies can also assess the amount of damages by each catastrophe zone to manage their accumulated risk.

2. Research Method and Design

To identify the risk indicators and the relationships among the damage and the indicators, first, this study collected typhoon damage records and classified them by regions. Second, the spatial distribution of the losses was examined to define the areas prone to typhoons. Third, risk indicators, such as typhoon information, geographic vulnerability, built environment, and socioeconomic vulnerability, were broken up into four categories and the data by region was classified. Fifth, a multiple regression analysis was employed to identify the indicators and the relationships.

2.1. Dependent Variable

This study used the typhoon loss records from annual reports of the Ministry of Public Safety and Security (MPSS) for ten years from 2003 to 2015 to define the dependent variable. The damage records are adjusted using the inflation rates to compare equivalent damages. The MPSS has published reports annually since 1979 to record the damages, including victims, causalities, and losses from natural disasters, such as floods, typhoons, heavy snow, and storm surges. The loss used in this study includes building damages caused by typhoons, covering all sectors of the public and private sectors. As shown in Figure 1, 15 typhoons have hit the Korean peninsula and caused critical damage. The western and southern coastal regions are the most frequently struck by typhoons. Figure 2 depicts the spatial distribution of typhoon damages. Table 1 shows the summary of typhoon damages by regions. The damage has occurred throughout all provinces. In particular, the southern part of South Korea has incurred deadly losses in terms of the dollar amount of damage in areas such as Gyongsangnam-do, Jeollanam-do, Gyongsangbuk-do, and Busan. The area most prone to typhoons is Gyongsangnam-do.

2.2. Independent Variable

2.2.1. Meteorological Indicators

A number of meteorological indicators could play significant roles in determining damage. The magnitude of a hurricane is determined by the combination of the forward motion speed, maximum wind speed, and radius of maximum wind speed [12,15,16]. Therefore, the indicators are always related to storm surges and losses. Many hurricane loss estimation models incorporate the maximum wind speed and the radius of maximum wind speed as their main indicators [12,16,17,18]. From the models, these two indicators mainly decide the amount of physical damage to a building. For instance, Watson and Johnson (2004) used the forward motion speed as a variable in their hurricane loss prediction model [18]. Additionally, Rego and Li (2009) found that the forward motion speed is a stronger indicator than the wind speed and the maximum wind speed of the storm flood damage, and the motion speed is related to the volume of the flood [19]. The volume of precipitation also strongly influences the damage of a storm. Brody et al. (2008) investigated the relationship between flood damage and the built environment [20]. They found precipitation to be the most powerful indicator of loss among the variables they examined. Choi and Fisher (2003) also found a positive relationship between the catastrophe loss and precipitation [21]. This study accepts the forward motion speed, maximum wind speed, radius of maximum wind speed, and precipitation to reveal the meteorological vulnerability.

2.2.2. Geographic Vulnerability Indicators

Geographic vulnerability is a vital determinant of damage from natural hazards because vulnerability represents the exposure to risk [22]. The diverse geographic characteristics vary greatly by site, and they influence the amount of exposure to natural disasters. These characteristics include altitude, distance from water, distance from water management infrastructure, and other environmental indicators [11]. Highfield et al. (2010) examined distance from water, distance from infrastructure, and building elevation using a multiple regression analysis to identify hurricane damage on Galveston Island and the Bolivar Peninsula [11]. They found that geographic vulnerability was the key predictor of damage. In order to investigate the vulnerability, the study adopted the coastline length as the geographic vulnerability index, taking into account the fact that the data of the study were drawn from the provincial level. In a typhoon invasion, coastal areas experience greater high gusts and storm surges than inland areas. This study expects this indicator to have a positive relationship with damage. A region with a longer coastline is likely to have more damages than a region with a shorter coastline. This study adopts the length of the coastline to reflect geographic vulnerability.

2.2.3. Built Environment Vulnerability Indicators

The built environment vulnerability arises from the man-made infrastructures and the structural vulnerability of the building [23,24]. The structural vulnerability of a building is fundamentally correlated with the built environment vulnerability to a natural disaster. Construction such as slope excavation and deforestation for road cuts can increase the occurrence of landslides [25,26]. Construction reduces the stability of the site and increases slope failures [27]. Ayalew and Yamagishi (2005) statistically examined the relationships of landslides with several risk indicators and found that slope works are connected with the occurrence of slope failure [28]. The structural vulnerability also plays a dominant role in the amount of damage from natural disasters [11,23,29,30]. Moreover, the number of stories in a building affects its vulnerability to windstorm damage. Khanduri and Morrow (2003) and De Silva et al. (2008) investigated windstorm damage to develop a loss estimation model [23,31]. Both studies quantified the structural vulnerability of the building and found that the building’s height was associated with the amount of damages. This study utilizes the total number of cutting slope and the total number of high-rise buildings to represent the built environment vulnerability.

2.2.4. Socioeconomic Vulnerability Indicators

Socioeconomic vulnerability is a well-established indicator of damage from natural disasters [11,12,18,20,32,33,34,35,36]. Vulnerability assessments for natural disasters have commonly focused on the vulnerability indicators that directly or indirectly affect financial losses, such as built environment, exposure to risk, physical damage, and physical parameters of the natural hazard. In addition, social vulnerability indicators (e.g., wealth and demographic features) affect the exposure of the building, the built environment, and the economic losses [12,37,38]. For instance, the crime rate reflects the socioeconomic status. De Sherbinin et al. (2007) and Zahran et al. (2009) found that the crime rate directly and indirectly affects the ability to cope with a natural disaster and also influences the natural disaster damages [39,40]. This study uses the total number of violent crimes to symbolize the socioeconomic vulnerability.

3. Data Collection and Analysis

The purpose of this research is to determine the relationships among the vulnerability indicators, hazard indicators, and financial losses. As data, typhoon damage records at the provincial level were from the MPSS. Statistical data and spatial information for each province were collected to estimate the vulnerabilities of each province. Each meteorological indicator was collected based on the time of the invasion of the affected area through the Korean Meteorological Society (KMA) record. The total coastal length of each region was extracted by the Geographic Information System using the coastal length of each region provided to the Korea Hydrographic and Oceanographic Agency (KHOA). As shown in Table 2, the data were obtained from the websites of government organizations. Table 3 shows the descriptive statistics of the data.

3.1. Multiple Regression Analysis and Results

Table 4 presents a summary of the regression model. The multiple regression analysis was adopted to obtain the best-fit regression model using multiple variables. The wind speed is squared to improve the R-squared value. The model is statistically significant (p = 0.000). The R-squared value of 0.431 indicates that the model explains 43.1% of the margin of variance. The dependent variable and building damage were transformed using a natural log.
Table 5 provides the coefficients of the regression model. There were eight significant indicators of typhoon damage: (1) forward movement speed, (2) wind speed, (3) radius of maximum wind speed, (4) precipitation, (5) coastline, (6) cutting slope, (7) high-rise building, and (8) crime rate. The other indicator was rejected (p > 0.10). The variance inflation factor (VIF) ranged from 1.087 to 1.806, which indicates that the indicators do not have critical multicollinearity.
The beta coefficients, also known as the standardized coefficients, provide the rank of the indicators; they represent the influence on the damage and can range from 0 to 1. Their order of influence was (1) radius of maximum wind speed, (2) precipitation, (3) cutting slope, (4) coastline, (5) wind speed, (6) crime, (7) forward movement speed, and (8) high rise building.
In the model, among the meteorological indicators, the typhoon’s forward movement speed has a positive relationship with the building damage from the typhoon; that is, as forward movement speed increases, the damage increases. This result is consistent with previous findings that the forward movement speed is a significant indicator of typhoon damages and tropical cyclone damages [18,19]. The maximum wind speed has a positive relationship with the typhoon damage, meaning that as the wind speed increases, the damage increases. This result is also consistent with previous studies showing that the maximum wind speed is a critical predictor of tropical cyclone damage [12,16,17,18]. The radius of maximum wind speed has a positive relationship with the typhoon damage, which means that as the radius of maximum wind speed increases, the damage also increases. This result is consistent with earlier findings that the radius of maximum wind speed is a predictor of tropical cyclone damage [12,16,17,18]. The precipitation has a positive relationship with the typhoon damage, meaning that as the precipitation increases, the damage increases. This result is also consistent with previous findings that precipitation is important in investigating natural disasters [20,21].
The geographical indicator of the total length of coastline has a positive relationship with the typhoon damage, which means that as the coastline increases, the damage also increases. This result is consistent with the concept that the amount of exposure to natural disasters is a critical factor for damage [11].
Among the built environment indicators, the number of cutting slopes has a positive relationship with the typhoon damage, which means that as the number of cutting slopes increase, the damage increases. This result is consistent with prior findings that the number of cutting slopes is connected to the damage and an important predictor of damage from natural disasters [28]. The number of high-rise buildings has a negative relationship with the typhoon damage, which means that as the number of high-rise building increases, the damage decreases. This result is consistent with previous findings that the number of high-rise buildings is associated with the damage, and is a strong predictor of wind storm damage [11,23,31].
The socioeconomic indicator, crime, has a positive relationship with the damage, which means that as the crime increases, the damage also increases. This result is consistent with previous findings that the crime rate is critically related with the damage from natural disasters [39,40]. The positive relationship between the damage and crime can be explained in that more damage can be caused to a metropolitan municipality than to a rural municipality owing to its high-density property and higher crime rate.

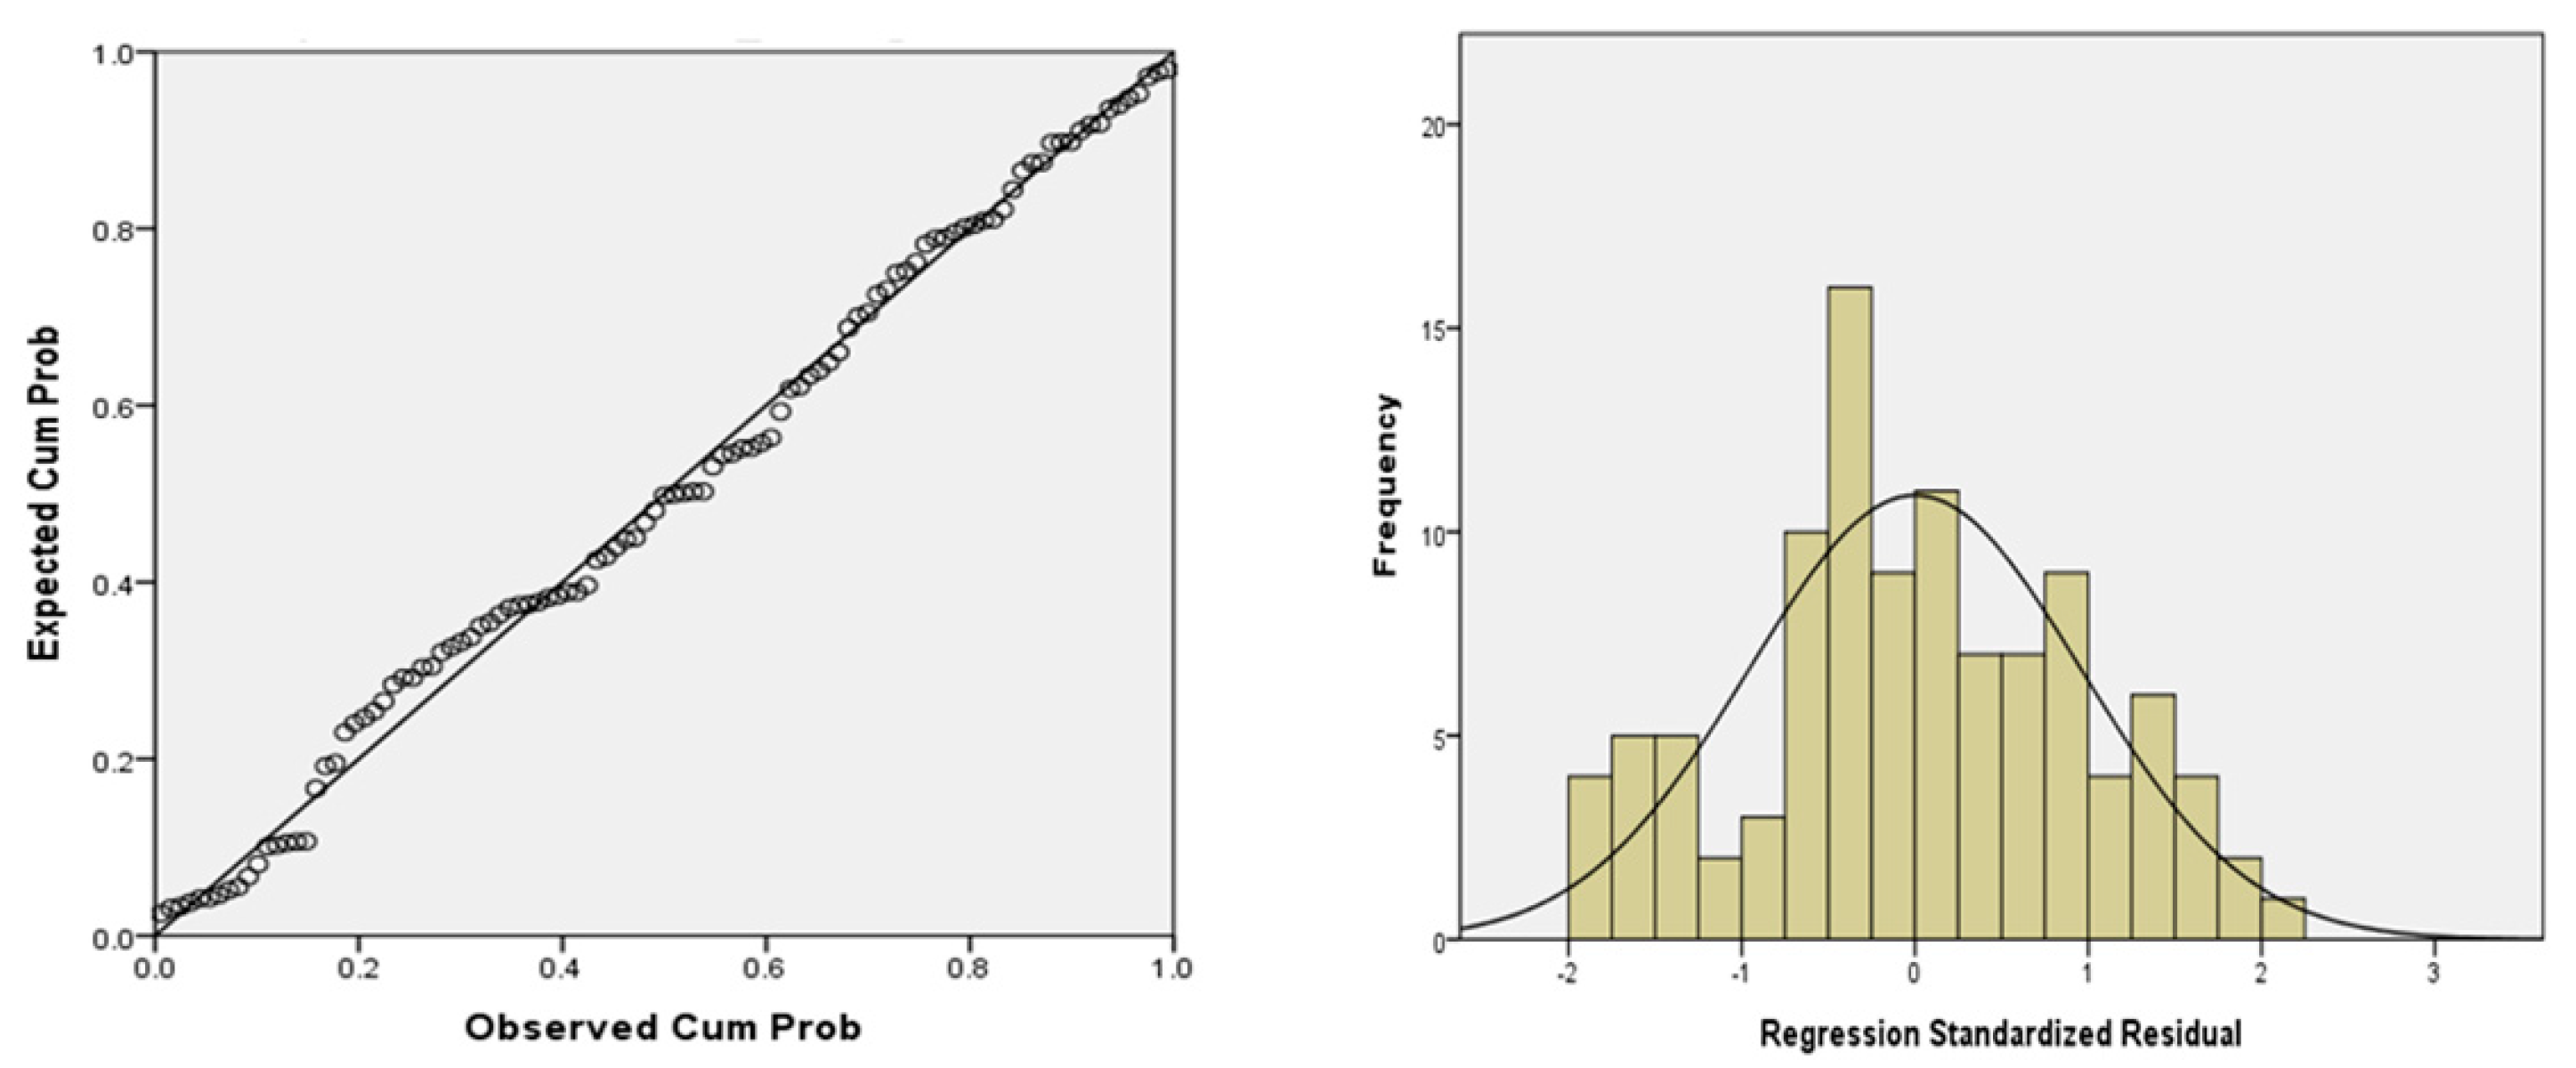
3.2. Investigation of the Model

The Kolmogorov–Smirnov test and the Shapiro–Wilk test were adopted to examine the normality of the residuals. These tests are based on verifying the observations against the predicted values converted to z-scores and the actual normal distribution. For instance, if the p-value of the test is not significant, the distribution of the observations means that the actual normal distribution is not different. On the other hand, if the p-value of the test is significant, it represents that the distribution of the observations is different from the actual normal distribution. As shown in Table 6, the p-value of 0.200 and 0.027 prove that the distribution is normal, since the p-value was higher than 0.05. The Q-Q plots and the standardized residuals histogram in Figure 3 also show that the model’s residuals were normally distributed. As shown in Figure 4, the residual plots for homoscedasticity were examined. The residuals are arbitrarily spread with unsystematic patterns. This indicates that the variance of the residuals is constant.

4. Discussion

The model developed in this study shows the relationships between the dependent and independent variables. The adjusted R-square of 0.431 indicates that the model explains 43.1% of the variability of the dependent variable using the selected indicators of forward movement speed, wind speed, radius of maximum wind speed, precipitation, coastline, cutting slope, high-rise building, and crime rate. In other words, this research neglects the remainder of the variability of 56.9%. The rest could be described by some undisclosed indicators. For instance, it is possible to extrapolate into this model the factors of climate change such as temperature of sea, which are related to climate change that have a lot of influence on recent extreme weather events. This will increase the explanatory power of this model.
As shown in the analysis results, there were no significant differences between the results of this study (South Korea) and other studies (other regions). However, due to the combined effects of various factors such as geographical characteristics, severity, and frequency of natural disasters, building codes, engineering practices, and construction type, the coefficients of indicators are different from each other. To reflect this, Catastrophe model vendors (such as AIR, RMS, and EQECAT) have created relative vulnerability metrics to reflect these various factors by investing large amounts of time and budget in each country or region, such as the United States and China [45,46].
Consequently, the model and result stated in this research is also of use as a reference for various tasks by the management worker and the disaster management director. For example, administrative staff can mitigate typhoon damage by predicting financial losses with the model and by establishing a hurricane damage prevention strategy based on expected losses. Because the model established in this research includes damage data from landslides and storms, the government would be able to improve land use plans along the expected storm path based on the estimated damages from landslides and storm surges. In addition, financial losses from typhoons can also estimate utilizing the metrics developed in this research. For example, reinsurance and insurance companies are able to use this metric to modify their business plan or in-house catastrophe model. They also set up the business strategies and estimate insurance premiums by estimating the maximum possible losses and event limits. This quantification process would reduce the retro excess of loss cost and lead to maximum profit. The metric can be also used to optimize portfolio and accumulation management. The construction industry is able to design storm-resistant buildings and improve design standards by assessing the degree of building damage based on building materials, building height, and other characteristics of the building.
Furthermore, the indicators and structure of this research can be adopted to related studies in other emerging countries where loss data due to natural catastrophes and building characteristics are not plentiful in order to predict extreme meteorological events. These countries can predict the typhoon damages using the indicators and structures utilized in this study. However, the indicators need to be reproduced by the weight of each province, and the coefficients are required to be adjusted to reflect the local building vulnerability in order to be of use to other areas. Therefore, in future research, it is necessary to verify or calibrate the results of the research through actual damage data in other centuries. It is also necessary to compare with other regional existing models.
From a data perspective, developing countries such as South Korea lack detailed damage data and building inventory information. This is due to the lack a awareness of the importance of data, and as a result it is necessary to construct data at the private and national level. This is because it is difficult to guarantee the accuracy of the model without constructing such detailed data. Once this data is built, the results of this model will also be validated and calibrated.

5. Conclusions

As extreme weather events have become much more frequent, with higher associated damage, some developed countries have established prediction models in order to prepare for and mitigate the damage to buildings from tropical cyclones. However, South Korea does not have such prediction models, and it is hard to apply the developed models due to the many differences in the size and severity of the disasters and the vulnerability of domestic properties. Although some prediction models have been developed, research that is more comprehensive is needed that reveals the connections among natural hazard characteristics, vulnerability, and building damage.
This study identifies vulnerability and risk indicators for typhoons as a first step toward developing a typhoon damage estimation system for South Korea. Regional typhoon loss records from the annual report of the Ministry of Public Safety and Security (MPSS) were used to define the dependent variable of building damage, and to define the magnitude and significance of the typhoon damage indicators. Typhoon information, geographical vulnerability, built environment vulnerability, and socioeconomic vulnerability indicators were designated as the independent variables. This study found that the radius of maximum wind speed, precipitation, cutting slope, coastline, wind speed, crime, forward movement speed, and high rise building have statistically significant relationships with building damage caused by typhoons, which is consistent with previous studies.
The findings of this study can inform government officials, insurance companies, and catastrophe model developers for predicting the loss caused by typhoons in South Korea or developing countries with low-quality data. For instance, this model is beneficial at the spatial scale because government officials can allocate the budget to correspond with extreme events by region. Primary insurance companies will be able to estimate the amount of damages by each catastrophe zone to manage the accumulated risk. This study supports the analysis of damage in order to reduce economic damages. Furthermore, this research identifies the distribution of typhoon damage and typhoon-prone regions, which can be used to reduce the risk of inhabitants who reside in typhoon vulnerable regions.
Nevertheless, this study covered only the damage to buildings in South Korea. As a result, these results may not apply directly to other countries. Future studies should deal with other national buildings using the same indicators. Moreover, the value of the adjusted R2 is 0.431, which indicates that the rest of the variability in the data is described by unknown predictors. Therefore, determining other potential predictors and adding them to the model will strengthen the model.

Author Contributions

J.-M.K., K.S., and D.L. conceived the idea for the analysis, contributed to typhoon information and building environmental data collection, and drafted the manuscript. Y.Y., and D.Y.K. checked the dataset, recoded the study variables, ran the regression models, and wrote the manuscript. All authors have read, provided feedback, and approved the final manuscript.

Acknowledgments

This work was supported by Basic Science Research Program through the National Research Foundation of Korea (NRF) funded by the Ministry of Education (NRF-2018R1C1B6008243).

Conflicts of Interest

The authors declare no conflict of interest.

References

  1. Yeon, H.J.; Jeong, K.C.A. Statistical Analysis of the Relationship among Frequency, Intensity, and Damage of Natural Hazard. Korean Rev. Crisis Emerg. Manag. 2018, 14, 149–156. [Google Scholar] [CrossRef]
  2. Ministry of Public Safety and Security. 2016 Yearbook of Disasters. Available online: http://www.korea.kr/common/download.do?tblKey=EDN&fileId=212054 (accessed on 7 December 2017).
  3. Hurricane Research Division. How Many Hurricanes Have There Been in Each Month? Available online: http://www.aoml.noaa.gov/hrd/ (accessed on 30 July 2017).
  4. Kim, J.M.; Kim, T.; Son, K. Revealing building vulnerability to windstorms through an insurance claim payout prediction model: A case study in South Korea. Geomat. Nat. Hazards Risk 2017, 8, 1333–1341. [Google Scholar] [CrossRef]
  5. Crichton, D. The risk triangle. Nat. Disaster Manag. 1999, 1, 102–103. [Google Scholar]
  6. Lee, S.S.; Chang, E.M. Application of GIS to typhoon risk assessment. J. Korean Spat. Inf. Soc. 2009, 17, 243–249. [Google Scholar]
  7. Lee, S.I. A Study on Damage Scale Prediction by Rainfall and Wind Velocity with Typhoon. Master’s Thesis, Sunchon National University, Suncheon, Korea, February 2013. [Google Scholar]
  8. Kim, J.S. On the Characteristics of Damage Scale and Risk Management System by Strong-Wind Speed of Typhoon. Master’s Thesis, Inje University, Gimhae, Korea, February 2013. [Google Scholar]
  9. Jeon, H.D.; Park, M.J.; Kim, K.Y. Damage analysis of meteorological disasters for each district considering the characteristics of a district. J. Korean Soc. Hazard Mitig. 2008, 8, 75–82. [Google Scholar]
  10. Lee, D.Y.; Kim, I.J. A study on typhoon damage prevention measures about the facility of the rural areas. J. Korean Inst. Rural Archit. 2012, 14, 117–124. [Google Scholar]
  11. Highfield, W.E.; Peacock, W.G.; Van Zandt, S. Determinants & Characteristics of Damage in Single-Family Island Households from Hurricane Ike1. Available online: https://law.utexas.edu/publicinterest/activities/fhdocs/Determinants_Damage_Van_Zandt.pdf (accessed on 22 May 2017).
  12. Burton, C.G. Social vulnerability and hurricane impact modeling. Nat. Hazards Rev. 2010, 11, 58–68. [Google Scholar] [CrossRef]
  13. Kim, J.; Woods, P.; Park, Y.; Son, K. Estimating the Texas Windstorm Insurance Association claim payout of commercial buildings from Hurricane Ike. Nat. Hazards 2016, 84, 405–424. [Google Scholar] [CrossRef]
  14. Sparks, P.R.; Schiff, S.; Reinhold, T. Wind damage to envelopes of houses and consequent insurance losses. J. Wind Eng. Ind. Aerodyn. 1994, 53, 145–155. [Google Scholar] [CrossRef]
  15. Dunion, J.P.; Landsea, C.W.; Houston, S.H.; Powell, M.D. A reanalysis of the surface winds for Hurricane Donna of 1960. Mon. Weather Rev. 2003, 131, 1992–2011. [Google Scholar] [CrossRef]
  16. Vickery, P.J.; Skerlj, P.F.; Lin, J.; Twisdale, L.A., Jr.; Young, M.A.; Lavelle, F.M. HAZUS-MH hurricane model methodology. II: Damage and loss estimation. Nat. Hazards Rev. 2006, 7, 94–103. [Google Scholar] [CrossRef]
  17. Huang, Z.; Rosowsky, D.; Sparks, P. Hurricane simulation techniques for the evaluation of wind-speeds and expected insurance losses. J. Wind Eng. Ind. Aerodyn. 2001, 89, 605–617. [Google Scholar] [CrossRef]
  18. Watson, C.C., Jr.; Johnson, M.E. Hurricane loss estimation models. Bull. Am. Meteorol. Soc. 2004, 65, 1713–1726. [Google Scholar] [CrossRef]
  19. Rego, J.L.; Li, C. On the importance of the forward speed of hurricanes in storm surge forecasting: A numerical study. Geophys. Res. Lett. 2009, 36, 1–5. [Google Scholar] [CrossRef]
  20. Brody, S.D.; Zahran, S.; Highfield, W.E.; Grover, H.; Vedlitz, A. Identifying the impact of the built environment on flood damage in Texas. Disasters 2008, 32, 1–18. [Google Scholar] [CrossRef] [PubMed]
  21. Choi, O.; Fisher, A. The impacts of socioeconomic development and climate change on severe weather catastrophe losses: Mid-Atlantic Region (MAR) and the US. Clim. Chang. 2003, 58, 149–170. [Google Scholar] [CrossRef]
  22. Cutter, S.L. Vulnerability to environmental hazards. Prog. Hum. Geogr. 1996, 20, 529–539. [Google Scholar] [CrossRef]
  23. Khanduri, A.; Morrow, G. Vulnerability of buildings to windstorms and insurance loss estimation. J. Wind Eng. Ind. Aerodyn. 2003, 91, 455–467. [Google Scholar] [CrossRef]
  24. Kim, J.M.; Woods, P.K.; Park, Y.J.; Kim, T.; Son, K. Predicting hurricane wind damage by claim payout based on Hurricane Ike in Texas. Geomatics. Nat. Hazards Risk 2015, 7, 1–13. [Google Scholar]
  25. Cui, B.; Wang, C.; Tao, W.; You, Z. River channel network design for drought and flood control: A case study of Xiaoqinghe River basin, Jinan City, China. J. Env. Manag. 2009, 90, 3675–3686. [Google Scholar] [CrossRef] [PubMed]
  26. Zhai, G.; Fukuzono, T.; Ikeda, S. Multi-attribute evaluation of flood management in Japan: A choice experiment approach. Water Environ. J. 2007, 21, 265–274. [Google Scholar] [CrossRef]
  27. Dai, F.; Lee, C.; Ngai, Y.Y. Landslide risk assessment and management: An overview. Eng. Geol. 2002, 64, 65–87. [Google Scholar] [CrossRef]
  28. Ayalew, L.; Yamagishi, H. The application of GIS-based logistic regression for landslide susceptibility mapping in the Kakuda-Yahiko Mountains, Central Japan. Geomorphology 2005, 65, 15–31. [Google Scholar] [CrossRef]
  29. Chock, G.Y.K. Modeling of hurricane damage for Hawaii residential construction. J. Wind Eng. Ind. Aerodyn. 2005, 93, 603–622. [Google Scholar] [CrossRef]
  30. Social Science Research Network (SSRN). Do Coastal Building Codes Mitigate Hurricane Damage to Residential Property? Available online: http://ssrn.com/abstract=928009 (accessed on 12 December 2017).
  31. De Silva, D.G.; Kruse, J.B.; Wang, Y. Spatial dependencies in wind-related housing damage. Nat. Hazards 2008, 47, 317–330. [Google Scholar] [CrossRef]
  32. Cutter, S.L.; Boruff, B.J.; Shirley, W.L. Social vulnerability to environmental hazards. Soc. Sci. Q. 2003, 84, 242–261. [Google Scholar] [CrossRef]
  33. Dixon, R.W.; Fitzsimons, D.E. Toward a quantified hurricane vulnerability assessment for Texas coastal counties. Texas J. Sci. 2001, 53, 345–352. [Google Scholar]
  34. Myers, C.A.; Slack, T.; Singelmann, J. Social vulnerability and migration in the wake of disaster: The case of Hurricanes Katrina and Rita. Popul. Environ. 2008, 29, 271–291. [Google Scholar] [CrossRef]
  35. Tate, E.; Cutter, S.L.; Berry, M. Integrated multi hazard mapping. Environment and planning. B Plan. Des. 2010, 37, 646–663. [Google Scholar]
  36. Wu, S.Y.; Yarnal, B.; Fisher, A. Vulnerability of coastal communities to sea-level rise: A case study of Cape May County, New Jersey, USA. Clim. Res. 2002, 22, 255–270. [Google Scholar] [CrossRef]
  37. Cardona, O.D. Indicators of Disaster Risk and Risk Management: Program for Latin America and the Caribbean: Summary Report. Available online: https://publications.iadb.org/bitstream/handle/11319/4801/Indicators%20of%20Disaster%20Risk%20and%20Risk%20Management.pdf?sequence=1&isAllowed=y (accessed on 1 January 2017).
  38. Mileti, D. Disasters by Design: A Reassessment of Natural Hazards in the United States, 1st ed.; Eric, K., Noji, M.D., Eds.; A Joseph Henry Press: Washington, DC, USA, 1999. [Google Scholar]
  39. De Sherbinin, A.; Schiller, A.; Pulsipher, A. The vulnerability of global cities to climate hazards. Environ. Urban 2007, 19, 39–64. [Google Scholar] [CrossRef] [Green Version]
  40. Zahran, S.; Shelley, T.O.C.; Peek, L.; Brody, S.D. Natural disasters and social order: Modeling crime outcomes in Florida. Int. J. Mass Emerg. Disasters 2009, 27, 26–52. [Google Scholar]
  41. Korea Meteorological Association. Available online: http://kma.go.kr (accessed on 1 January 2017).
  42. Korea Hydrographic and Oceanographic Agency. Available online: http://www.khoa.go.kr (accessed on 1 January 2017).
  43. Korean Statistical Information Service. Available online: http://kosis.kr (accessed on 1 January 2017).
  44. Korean National Police Agency. Available online: http://www.police.go.kr (accessed on 1 January 2017).
  45. Hua, H.; Vineet, J.; Guillermo, L.; Cagdas, K. Modeling Relative Spatial and Temporal Hurricane Wind Vulnerability of the Building Stock in the US. In Proceedings of the Americas Conference on Wind Engineering, San Juan, Puerto Rico, 22–26 June 2009. [Google Scholar]
  46. AIR Worldwide. AIR Hurricane Model for the United States. Available online: https://www.air-worldwide.com/ (accessed on 1 October 2018).
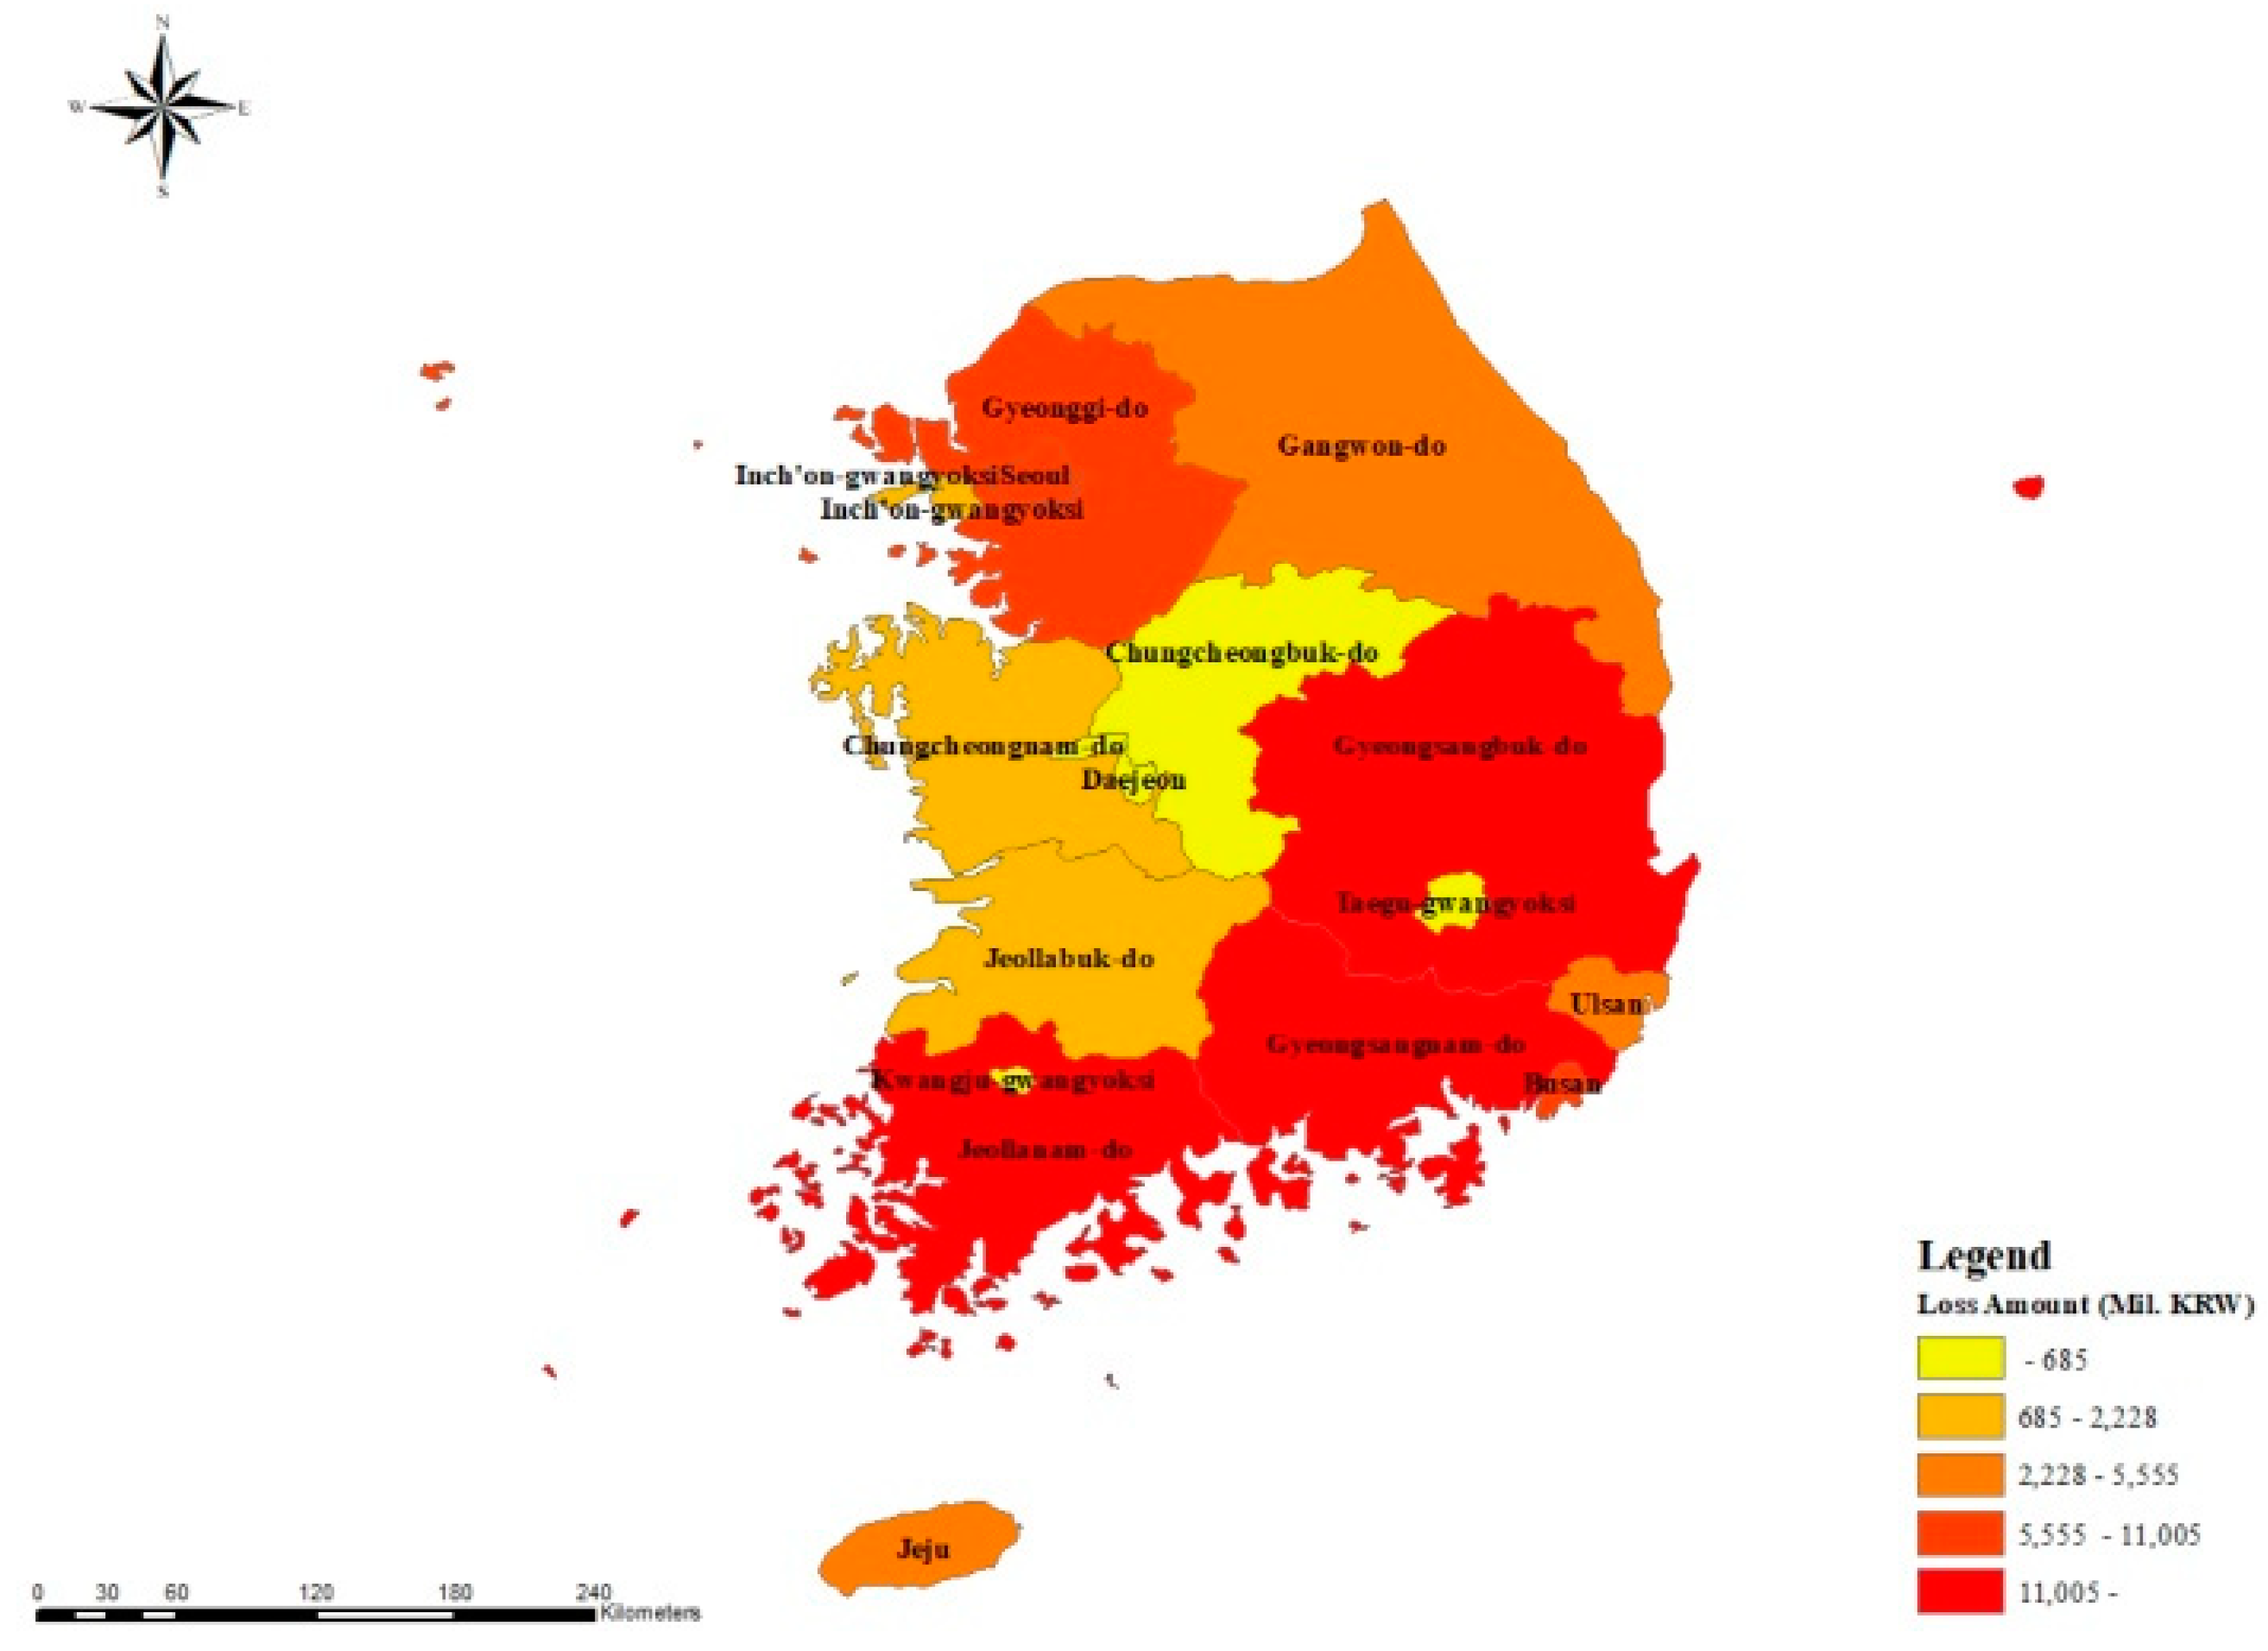
Figure 1. Typhoon tracks (2003–2015 year).
Sustainability 10 03947 g001
Figure 2. Spatial distribution of damage by region (2003–2015 year).
Sustainability 10 03947 g002
Figure 3. Q-Q Plots and histogram of residuals for the model.
Sustainability 10 03947 g003
Figure 4. Residuals plot for the model.
Sustainability 10 03947 g004
Table 1. Summary of Typhoon Damages by Regions.
RegionTotal Damages (Mil.KRW)Typhoon Name (Amount of Damage)
Gyongsangnam-do47,556Maemi (46,218), Sanba (931), Nari (150), Bolaven (136), Diamu (75), Muifa (44)
Jeollanam-do35,635Bolaven (20,841), Maemi (11,003), Nari (1,875), Sanba (964), Khanun (606), Meari (150), Kompasu (135), Diamu (45), Malou (15)
Gyongsangbuk-do18,548Maemi (13,767), Nari (3,015), Sanba (1506), Meari (78), Shanshan (75), Bolaven (46), Kompasu (30), Malou (15), Usagi (15)
Gyeonggi-do11,005Muifa (9099), Kompasu (1200), Bolaven (301), Meari (255), Kalmaegi (105), Sanba (18), Diamu (15), Khanun (9), Usagi (0.1)
Busan10,950Maemi (10,374), Muifa (420), Sanba (121), Nari (18), Diamu (15)
Seoul9328Muifa (9236), Malou (45), Meari (44), Khanun (1)
Gangweon-do5555Maemi (5346), Muifa (87), Nari (45), Bolaven (30), Kompasu (15), Usagi (15), Sanba (11.4), Meari (5)
Jeju3740Nari (1740), Maemi (1492), Bolaven (359), Sanba (72), Diamu (45), Kompasu (15), Malou (15)
Ulsan2229Maemi (1538), Nari (625), Sanba (64), Meari (0.6)
Jeollabuk-do2228Bolaven (2008), Nari (60), Sanba (60), Maemi (54), Kalmaegi (15), Khanun (15), Kompasu (15)
Incheon1665Muifa (1261), Kompasu (120), Meari (103), Kalmaegi (90), Bolaven (75), Khanun (13)
Chungcheongnam-do1556Bolaven (1382), Nari (75), Kalmaegi (60), Sanba (16), Muifa (15), Kompasu (7), Meari (0.6)
Gwangju685Bolaven (654), Khanun (15), Kompasu (15)
Daegu629Maemi (552), Nari (75), Daejun (15), Khanun (15), Sanba (1.2)
Chungcheongbuk-do469Bolaven (211), Nari (60), Meari (46), Kompasu (45), Maemi (30), Usagi (30), Sanba (15), Kalmaegi (15), Muifa (15)
Table 2. Data Collection.
CategoryVariablesPrevious StudiesDescriptionUnitSource
MeteorologicalForward motion speedBurton (2010) [12]
Vickery et al. (2006) [16]
Huang et al. (2001) [17]
Watson and Johnson (2004) [18]
Rego and Li (2009) [19]
Typhoon’s forward motion speedkm/hKorea Meteorological Association [41]
Maximum wind speed10 min sustained maximum wind speedm/s
Radius of maximum wind speedRadius of maximum wind speed (over 15 m/s)km
PrecipitationBrody et al. (2008) [20]
Choi and Fisher (2003) [21]
Total amount of precipitation mm/day
GeographicalLength of coastlineHighfield et al. (2010) [20]Total length of coastlinekmKorea Hydrographic and Oceanographic Agency [42]
Built environmentCutting slopeAyalew and Yamagishi (2005) [28]Total number of cutting slopeNumber per [1000 m2]Korean Statistical Information Service [43]
High rise buildingKhanduri and Morrow (2003) [23]
De Silva et al. (2008) [31]
Total number of high rise building (over 20 m)Number
Socio-economicViolent crimeDe Sherbinin et al. (2007) [39] Zahran et al. (2009) [40]Total number of violent crime (murder, rob, rape, and arson)NumberKorean National Police Agency [44]
Table 3. Descriptive Statistics.
VariablesMinimumMaximumMeanStd. Deviation
Dependent
Building Damage (Mil.KRW)0.0646218.721517.895495.65
Independent
Forward Movement Speed205232.069.7
Wind Speed174432.137.19
Radius of Wind Speed150600357.05118.76
Precipitation042085.2478.62
Length of coastline02104515.16618.57
Cutting Slope06925.0324.86
High rise building37033,4625339.486888.31
Crime337650903900.69458.01
Table 4. Summary of the Model.
ModelSum of SquaresMean SquareFSig.R2Adj-R2
Regression480.53160.06610.8350.0000.4740.431
Residual532.1995.544
Total1012.730
Table 5. Coefficients of the Model.
VariablesΒStd. ErrorBetaSig.VIF
Constant2.5522.862 0.000
Meteorological Indicators
Forward movement speed0.0620.0250.1930.0141.087
(Wind Speed)20.0010.0010.2010.0161.225
Radius of max. wind speed0.0110.0020.4110.0001.425
Precipitation0.0140.0030.3490.0001.113
Geographical Indicator
Coastline0.0010.0000.2300.0051.164
Built environment Indicator
Cutting slope0.0290.0100.2330.0051.206
High rise building−8.231 × 10−50.0000.1820.0621.690
Socio-economic Indicator
Crime0.0010.0010.1960.0521.806
Table 6. Test of Normality for the Model.
Dependent VariableKolmogorov–SmirnovShapiro–Wilk
StatisticSig.StatisticSig.
Ln (Building Damage)0.0260.2000.9740.027

