Article

Historical Arable Land Change in an Eco-Fragile Area: A Case Study in Zhenlai County, Northeastern China

1
Institute of Geographic Sciences and Natural Resources Research, Chinese Academy of Sciences, Beijing 100101, China
2
Faculty of Geographical Science, Beijing Normal University, Beijing 100875, China
3
Northeast Institute of Geography and Agroecology, Chinese Academy of Sciences, Changchun 130102, China
*
Author to whom correspondence should be addressed.
Sustainability 2018, 10(11), 3940; https://doi.org/10.3390/su10113940
Submission received: 21 August 2018 / Revised: 25 October 2018 / Accepted: 26 October 2018 / Published: 30 October 2018

Abstract

:
Long-term land changes are cumulatively a major driver of global environmental change. Historical land-cover/use change is important for assessing present landscape conditions and researching ecological environment issues, especially in eco-fragile areas. Arable land is one of the land types influenced by human agricultural activity, reflecting human effects on land-use and land-cover change. This paper selected Zhenlai County, which is part of the farming–pastoral zone of northern China, as the research region. As agricultural land transformation goes with the establishment of settlements, in this research, the historical progress of land transformation in agricultural areas was analyzed from the perspective of settlement evolution, and the historical reconstruction of arable land was established using settlement as the proxy between their inner relationships, which could be reflected by the farming radius. The results show the following. (1) There was little land transformation from nonagricultural areas into agricultural areas until the Qing government lifted the ban on cultivation and mass migration accelerated the process, which was most significant during 1907–1912; (2) The overall trend of land transformation in this region is from northeast to southwest; (3) Taking the topographic maps as references, the spatial distribution of the reconstructed arable land accounts for 47.79% of the maps. When this proxy-based reconstruction method is applied to other regions, its limitations should be noticed. It is important to explore the research of farming radius calculations based on regional characteristics. To achieve land-system sustainability, long-term historical land change trajectories and characteristics should be applied to future policy making.

1. Introduction

Land-use/cover change (LUCC) is a fundamental component of global environmental change [1]. Human activities over the last centuries have significantly transformed the Earth’s environment, primarily through the conversion of natural ecosystems to agriculture [2]. Both human-induced and natural land-cover/use changes interact with the global carbon cycle, biodiversity, climate change, landscape, and ecology [3,4,5,6]. The impact of changes in land cover over historical periods should be included in the process of building models that accurately simulate global environmental change [7]. Moreover, land-use history is very important for assessing present landscape conditions, because land-use legacies influence climatic and ecological processes that occur today [8,9]. This often requires the reconstruction of land-use/cover history over the time slice.
Yet, the availability of historical land-cover/use data is often limited. Historical land-cover/use data tend to be fragmented and difficult to obtain due to unfavorable restraints, including copyright, accessibility, language barriers, and secrecy status. The currently available global-scale reconstructions are based on a combination of data and modeling, which incorporates the dynamics of long-term human–environment relationships [2,4,10,11,12,13]. Most studies are restricted to local and regional levels using natural archives, historical documents, statistical datasets, old maps, pictures, and model simulations, which potentially filled the data gap before the advent of satellite archives [14,15,16,17,18,19,20]. Especially, this would be much more easily achieved when historical data are combined with GIS (Geographic Information Systems) tools [21,22,23]. Land cover/use often needs to be reconstructed in both quantity and spatial distribution. After selecting valid data, they must be implemented in a GIS tool to permit their spatial evaluation. Historical documents contain qualitative or semiquantitative information about past land cover, and are the main data sources for researching historical changes in land cover from regional to global levels. They are often recorded in administrative units such as towns, counties, cities, and provinces. Historical records provide land managers with information that can be used to understand LUCC trajectories, and a more complete picture of historical land use/cover could be obtained by integrating multisource data [24]. According to the data characteristics from historical documents, there are generally two reconstruction methods. First, useful information about historical land cover could be extracted directly from the old documents after a qualitative or semiquantitative analysis, and then uniform tabular data could be formed. However, it must be noted that large differences often occur between historical data and present statistics due to the impact of policies, economies, wars, and other factors, such as numerical characteristics and statistical standards. Therefore, it is necessary to revise and calibrate these historical data prior to use [25]. In this context, the second method is proposed: under some assumptions, circumstantial evidence is obtained from historical documents, and then, a quantitative land-cover analysis is performed based on the relationships between variables, such as between cropland areas and rates of population change, speed of urban sprawl and increase in population, or pastoral areas and numbers of animals.
Arable land is a land type that is influenced by agricultural activity, reflecting humanity’s impact on LUCC. In farming regions, transforming land from nonagricultural areas into agricultural areas often occurs with the establishment of residential settlements to satisfy the food demands of local residents. Arable land has a close relationship with settlements, which could comprehensively reflect the interaction between human activities and the natural environment. The site selection of settlements integrates such basic elements as human survival mode and environmental selection. Generally, human beings decide to locate or relocate to a certain site after considering water sources, the history of cultivation, traffic conditions, and other natural and social factors to form settlements. Then, natural land cover changes to meet agricultural land, resulting in significant LUCC. Therefore, in consideration of the law that the establishment of settlements is synchronized with the transformation from nonagricultural areas to agricultural areas, the development and evolution of settlement patterns may reflect the history of land transformation in a local region [26]. In a traditional agricultural production pattern, farmland is usually distributed around settlements and influenced by human activities. Thus, applying the mutual relationship between the location of settlements (residential land uses) and arable land potentially provides a way to reconstruct historical areas of arable land, which could be reflected through the farming radius.
The farming–pastoral ecotone of Northern China, as a sensitive region of terrestrial ecosystems, is very vulnerable to global change and human disturbance [27]. Human activities, such as excessive reclamation, grazing, excavation, and abandonment, have generated enormous negative environmental impacts in the region, especially regarding the destruction of natural vegetation, which has constantly drained the service functions of the local ecosystems [27]. Changes in land use are likely the most ancient of all human-induced environmental impacts [28]; therefore, large areas of grassland have been converted into cropland due to climate warming, increased population, and food demand, causing the pattern of land cover in the farming–pastoral ecotone of Northern China to change quickly and continually. With the encroachment of cropland in traditional pastoral zones, the picture of resilient and balanced rangeland ecology has been turned upside down.
Bearing all this in mind, this paper researches arable land change in an eco-fragile area after reconstructing historical arable land using available documents. Especially, this research tries to explore arable land reconstruction based on information about settlements from the local gazetteer according to their relationship, which could be reflected by the farming radius. Zhenlai County, a part of the farming–pastoral ecotone of Northern China, is located in northwestern Jilin Province, where the eco-environment is very fragile and vulnerable to disturbance. Over the past century, northeastern China has experienced dramatic land-cover/use changes. In this context, the study area was selected as the target for this research. The objectives of the research are as follows: (1) to analyze historical settlement changes and land transformation processes from gazetteer records through a historical lens; and (2) to reconstruct spatial arable land data based on the distribution of settlements and the farming radius in the 1930s.

2. Materials and Methods
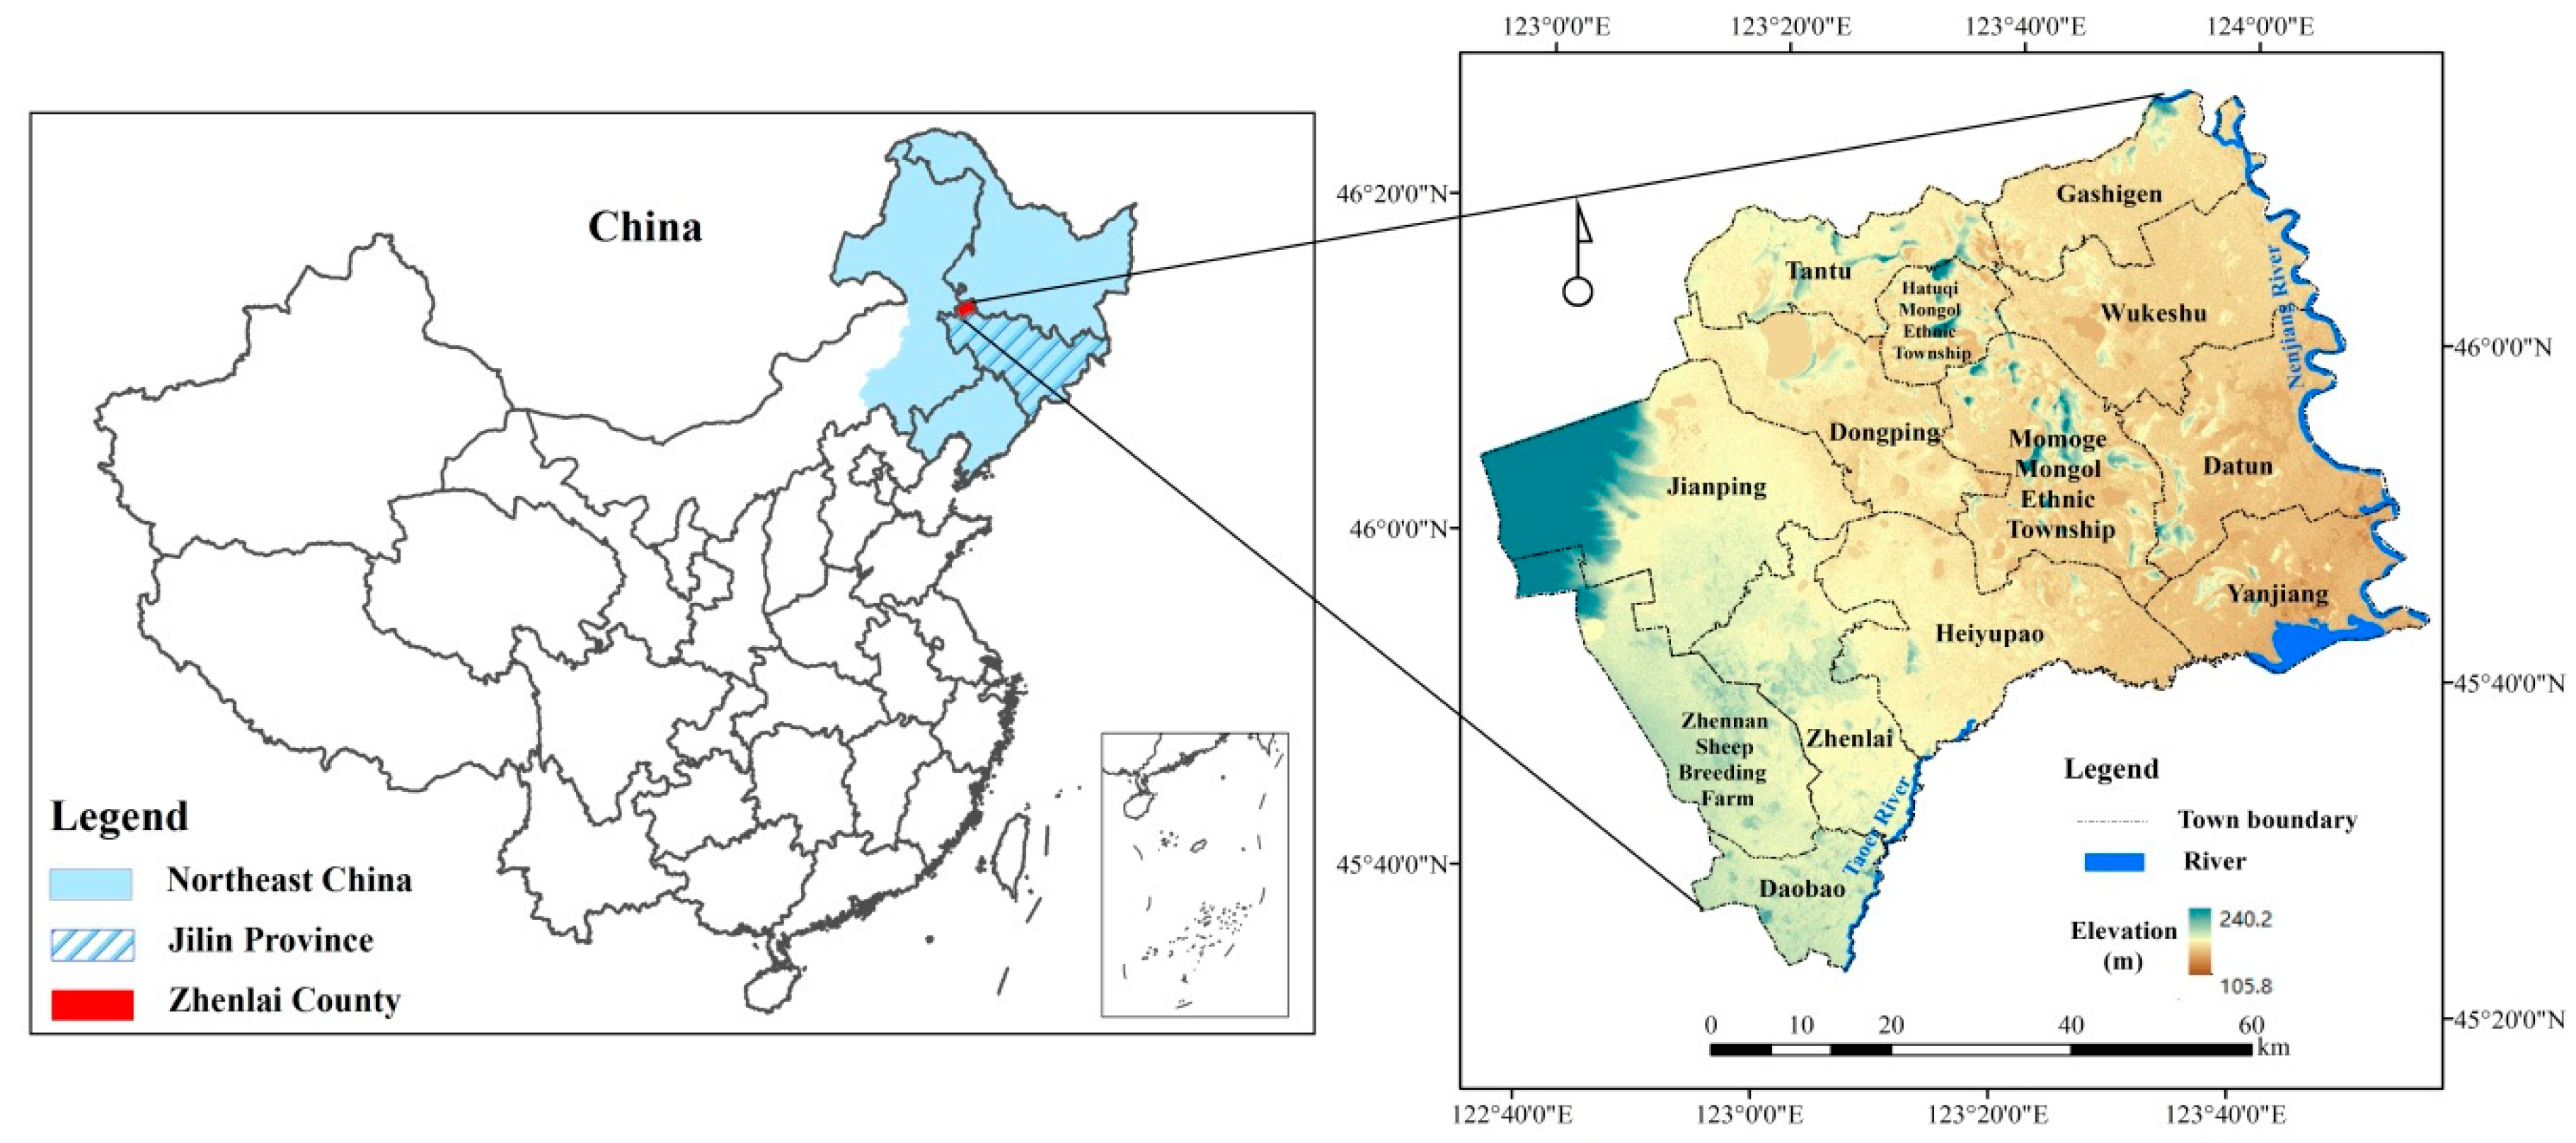
2.1. Study Area

Zhenlai County (45°28′ N–46°18′ N, 122°47′ E–124°04′ E) (Figure 1) lies in Baicheng City of northwestern Jilin Province, with a high-lying northwest and low southeast in its complex and diverse topography. Adjacent to the Great Khingan region in the northwest, the county’s central area is mostly fluctuant hilly land, while its south and east are surrounded by the Tao’er River and the Nenjiang River, respectively, shaping fertile alluvial plains lining the riverbanks. Located in inland areas of mid-latitude, the region has distinct seasons and a temperate continental monsoon climate. Its mean annual temperature is around 4.9 °C. The mean annual rainfall is 402 mm, which is unevenly distributed over time [29,30]. The low amount of precipitation and the high amount of evaporation mainly result in a drought-prone climate, especially in spring. The study area is located in the transition zone from the first step to the second step, and in the climate transition belt from the humid East Asian monsoon to arid inland. As part of the farming–pastoral region, its natural geographical conditions show marginal and transitional characteristics. The region, with a fragile eco-environment, is a sensitive area responding to global change [31]. In the past century, increasing human agricultural activities on land conversion mainly for grain crops has significantly influenced land-use and land-cover change.
The region was the nomadic land for Mongol princes, and inhabitants were not allowed to reclaim it until the enactment of the ban on transforming land from nonagricultural areas into agricultural areas in the late Qing Dynasty (1902). The county was established in 1910 as Zhendong County, and Laibei County was merged into this region in 1947, with the new name Zhenlai County. As Zhenlai County’s administrative border changed over the past century, this research used the border from Zhenlai Gazetteer (1985) as the study range, thereby ensuring comparability across different periods of time. According to the gazetteer, Zhenlai County includes 11 towns/townships and one farm, which are: Zhenlai (the county seat), Heiyupao, Yanjiang, Tantu, Datun, Wukeshu, Dongping, Jianping, Ganshigen Hatuqi Mongol Ethnic Township, Momoge Mongol Ethnic Township, and Zhennan Sheep Breeding Farm (Figure 1).

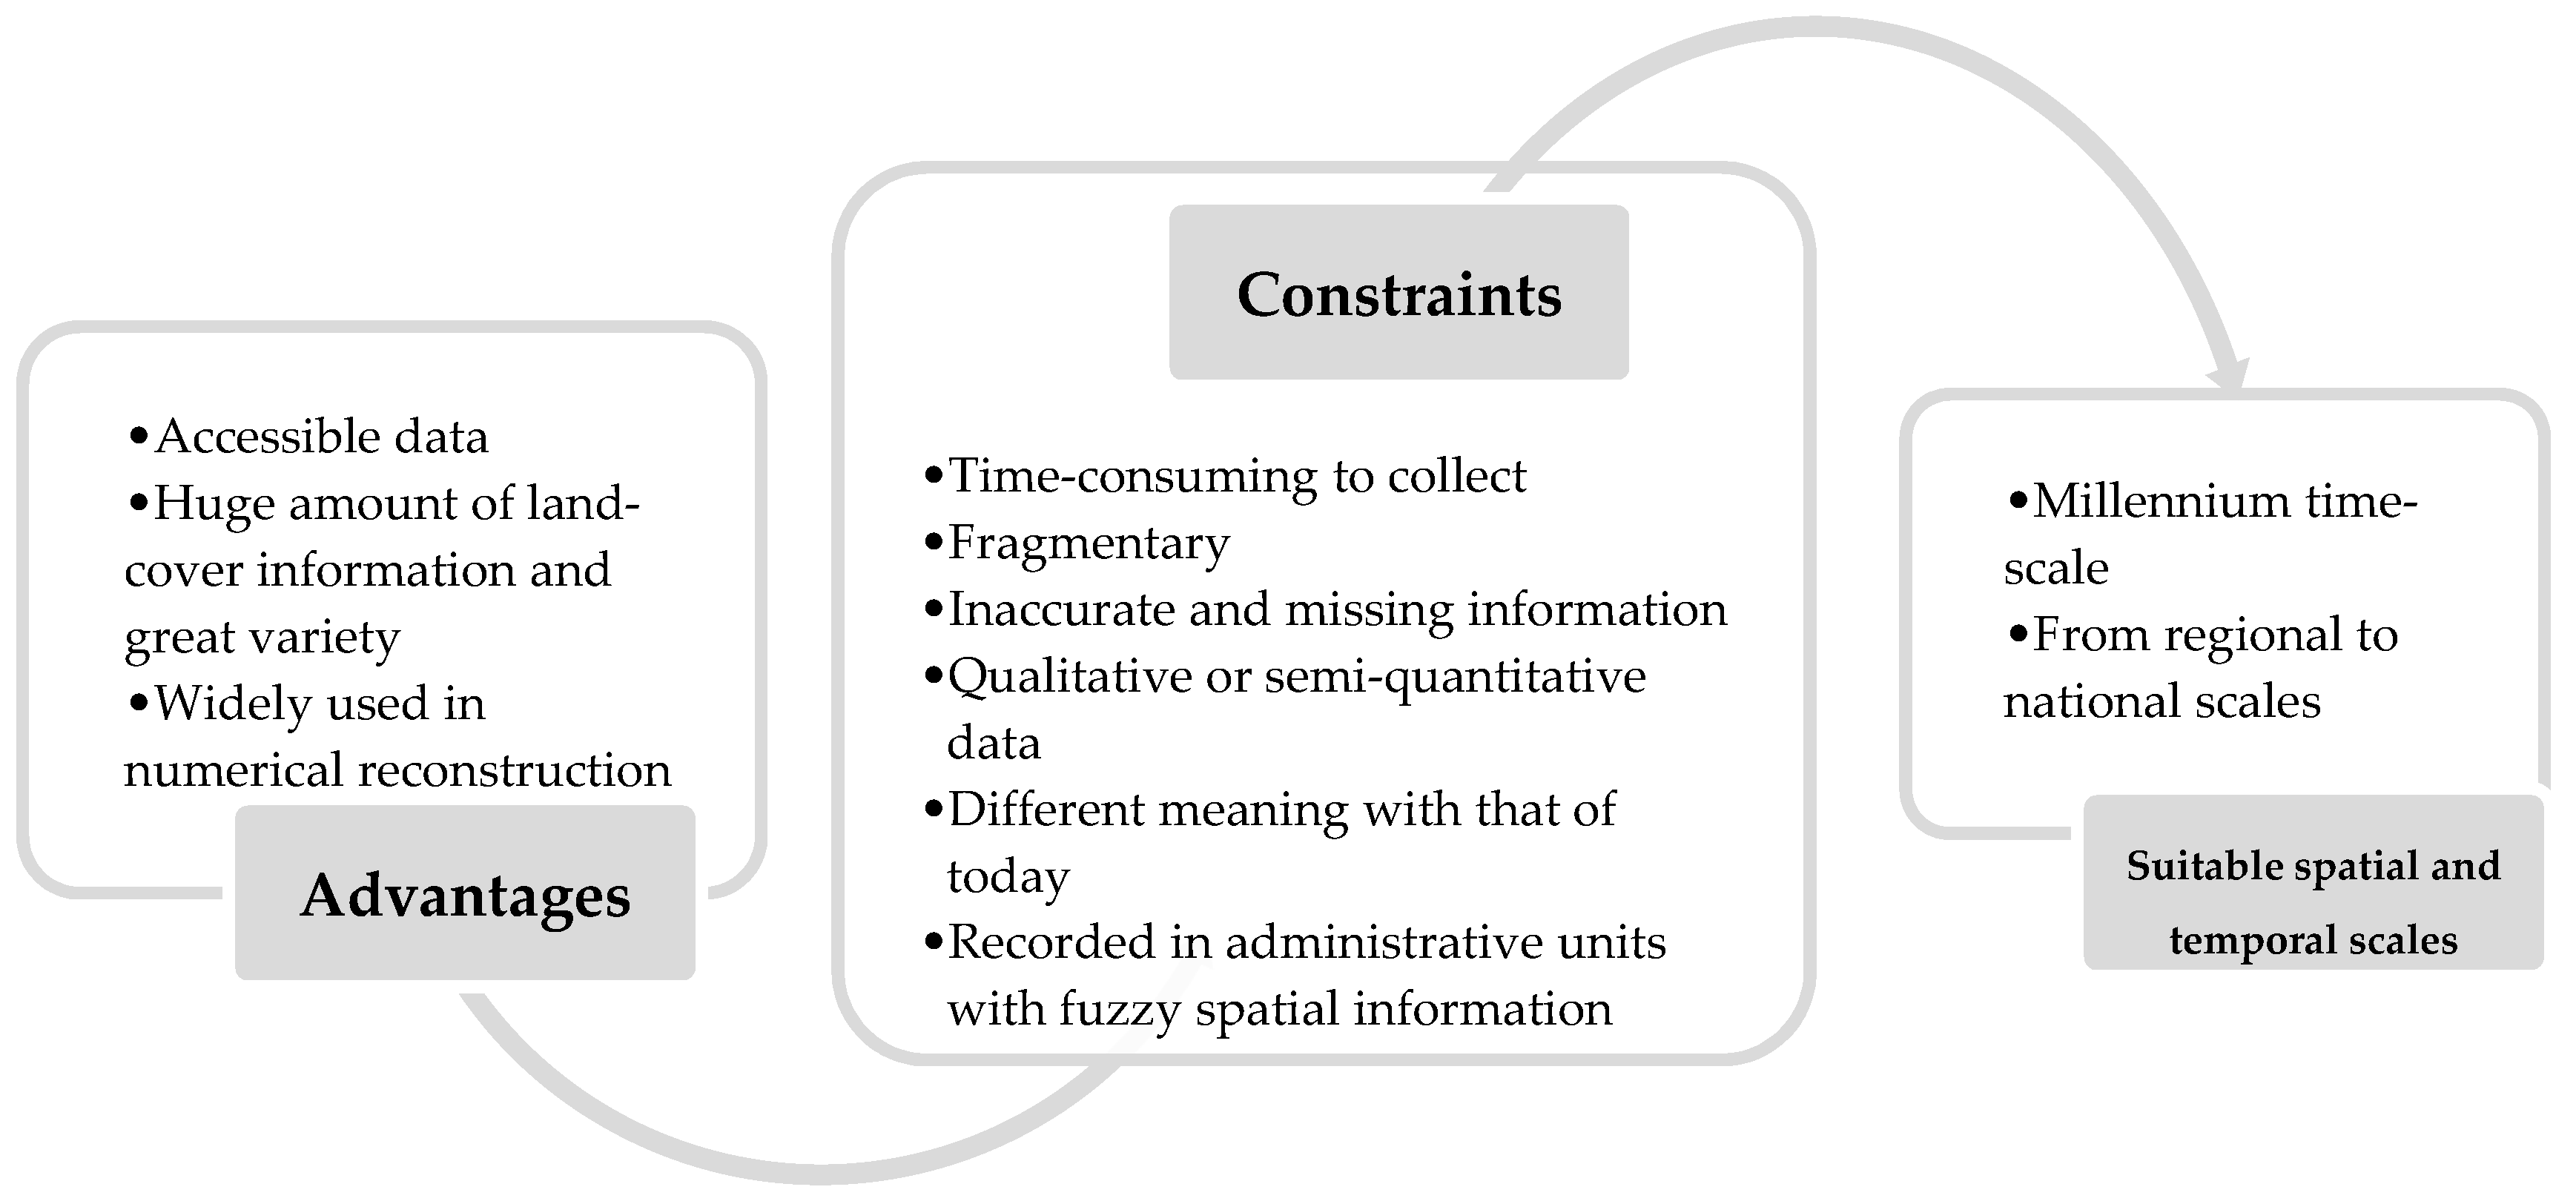
2.2. Data Collection and Processing

Considering the advantages and constraints regarding land use reconstruction through the historical documents [14] illustrated in Figure 2, in this study, historical documents were collected, including Zhenlai Gazetteer (1985) [32] and Geographic Names of Baicheng Region (1984), while other documents were also referred to, such as the Zhenlai County Annals, Dalai County Annals, and Zhendong County Annals in Integrated Local Records in China—Album of Jilin County Annals (1931).
Among those documents, the Zhenlai Gazetteer (1985) is very important for this research. The gazetteer records include detailed geographic names, definitions, history, land area, population, geographical entities, artificial construction, etc., and also describes and accurately investigates the regional scale, the size and number of villages or towns, and the main production modes, which could reflect the evolution of how people change natural land cover and how nature is influenced by human activities. These factors provide valuable information for research of the man–land relationship and the future development and utilization of the environment [26,33]. The Zhenlai Gazetteer (1985) mainly consists of the following information: village names and changes, year of founding, type of agriculture (e.g., cultivation or grazing), the ethnic groups that established the villages, the method of building villages, the locations, administrative subordination relationships, population, and number of households. For example, it is recorded that the Sibe people lived a nomadic life and built Wulinsibe village in Zhenlai County, while Ma’s family began to cultivate and build Yuanbaotu village in 1853 during the years of the Qing Emperor Kangxi. Data about settlements can be extracted, and an attribute table can be formed mainly from the Zhenlai Gazetteer (Table 1). So, making full use of these documents, detailed settlement information was obtained according to the flow path (Figure 3). In general, the establishment of settlements is synchronized with land transformation. Thus, the development and evolution history of settlement patterns may reflect the history of agricultural land transformation, and the reconstruction of arable land based on the distribution of settlements and farming radius is available. It should be noted that not all of the settlement data are from the gazetteer, and the missing data were collected from the other documents mentioned above. Then, the attribute table generated from the Zhenlai Gazetteer (Table 1) was joined to the spatial location of settlements with x and y axes using ArcGIS.
In addition, the study area is covered by a series of topographic maps dating back to the 1930s at a scale of 1:50,000, which were obtained from a project plan for the production of digital images of the Chinese mainland by the Japanese Academy of Sciences. In this study, the old maps were scanned at high resolution due to the high requirements for interpretation and the quality of the maps. Then, a minimum of four ground control points were chosen from the scanned maps to rectify them using polynomial equations in ArcGIS software. When the result proved to be unsatisfactory, new control points were chosen or uncertain control points were omitted, and the transformation was repeated. Manual geo-referencing is necessary when using the historical data. Map coordinates and unique landmarks such as churches, crossroads, and coastal shapes were used for geo-referencing [34]. Considering the lack of latitude and longitude information in the 1:50,000 topographic maps, geo-referencing was undertaken by identifying common objects such as settlements, unchanged road junctions, and other similar land features with the same position in the 1970s and 1930s maps. Although there were some name changes with the settlements, the majority of names were transliterated based on their pronunciation. The historical maps were used to calculate the farming radius, assuming that they could reflect the same real land-use/cover distribution as the reference maps.
For the research of historical arable land change, we also collected data of land-use and land cover from the Data Center for Resource and Environment Science of the Chinese Academy of Sciences. In this study, we adopted the current land-use classification system, including six categories and 25 subclasses [35], where arable land refers to agricultural land, including paddy fields and rainfed cropland.

2.3. Methodology

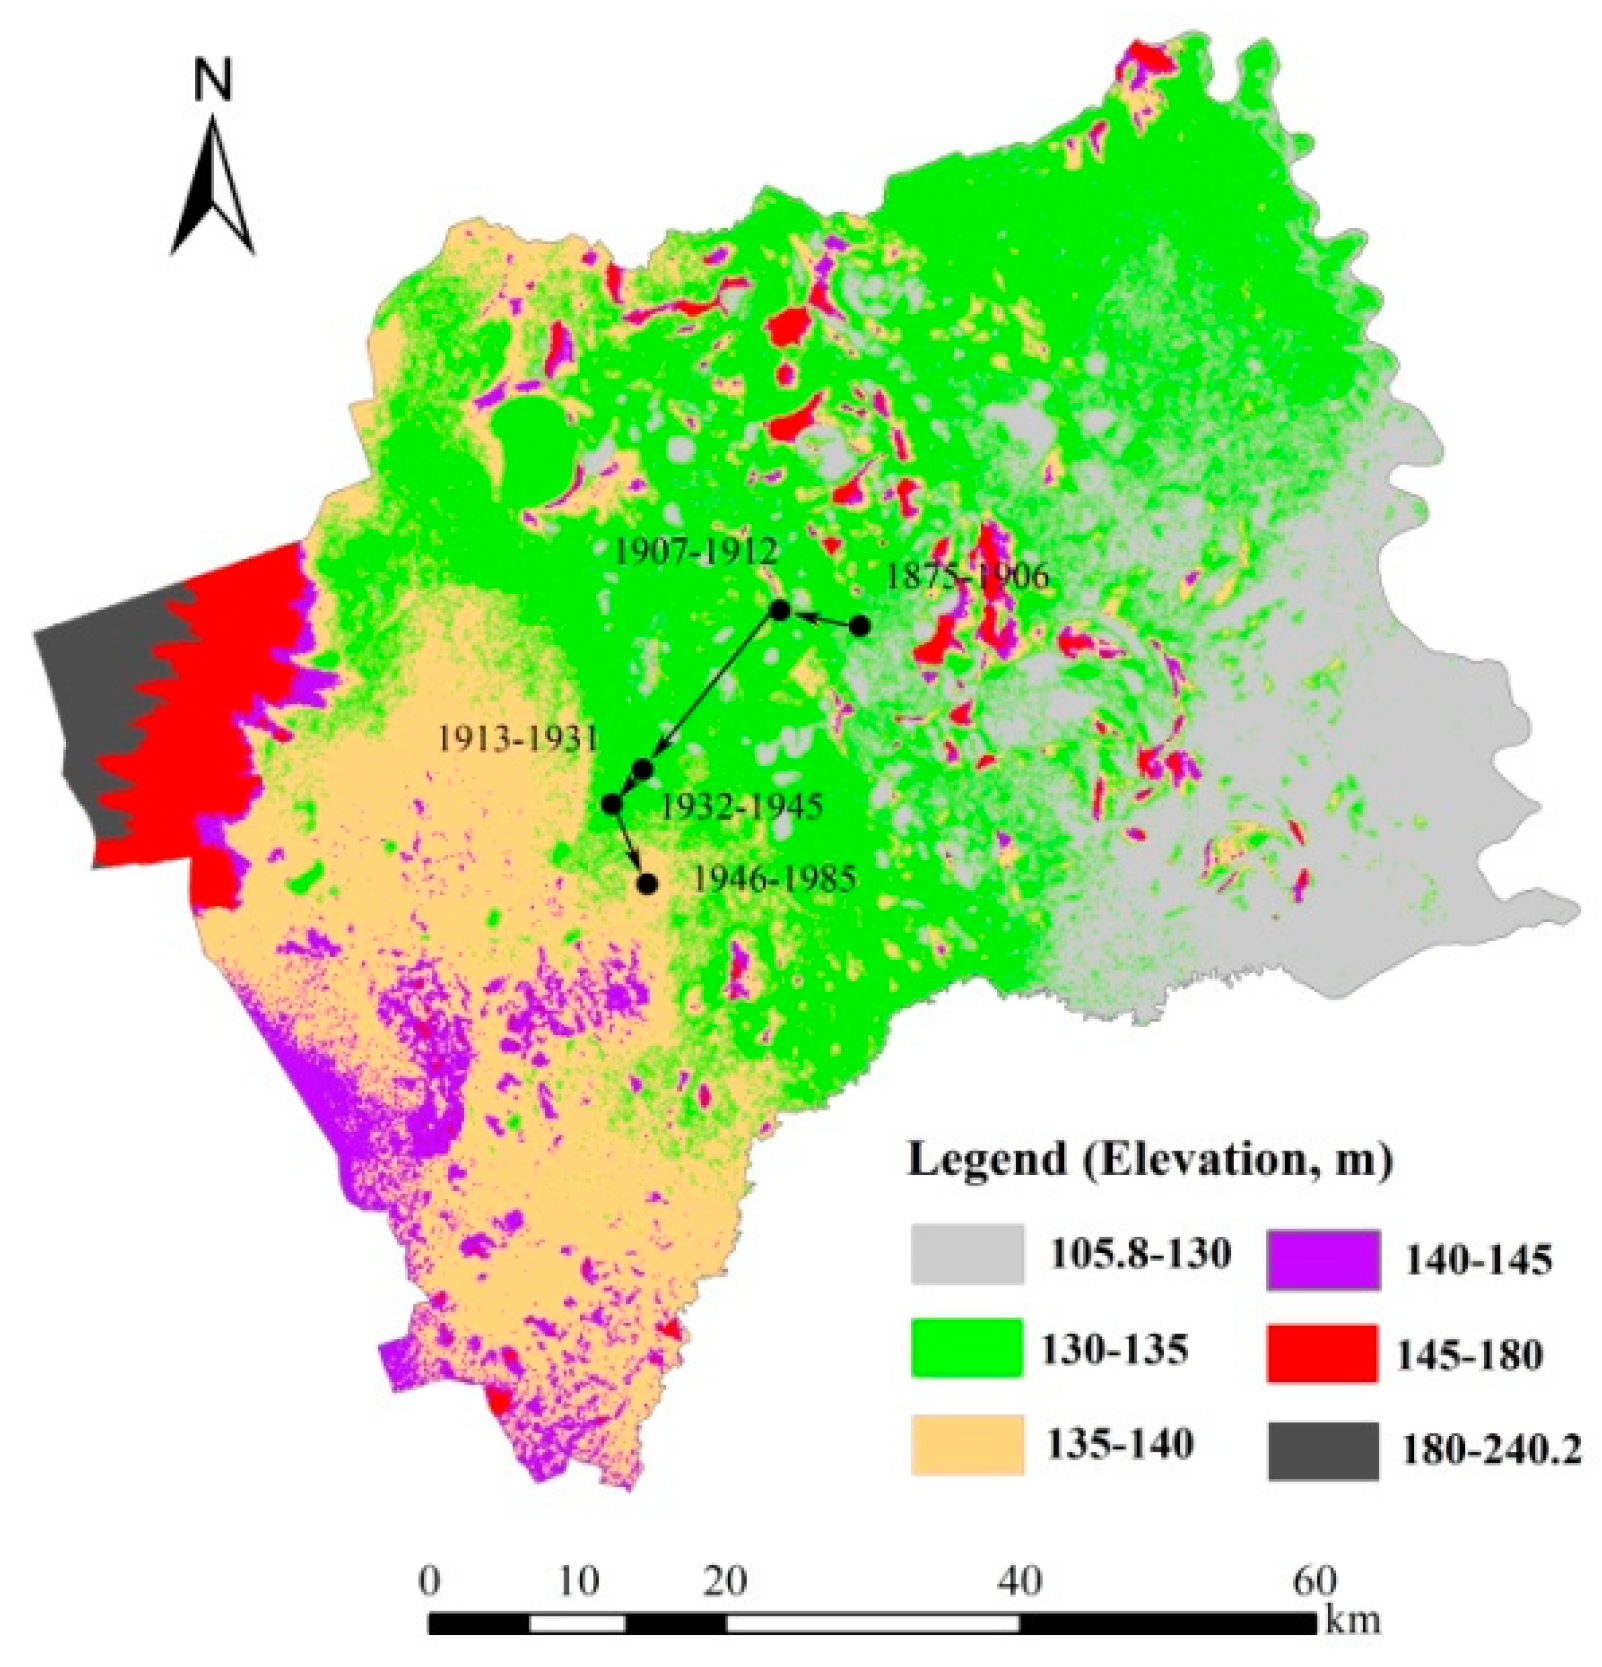
2.3.1. Gravity-Center Model

A gravity-center model, which has been extensively applied in the fields of land-use planning, economic geography, and land-use science, is a modeling approach that identifies the movement direction and distance to the center of gravity for targeted objects [36,37]. These can reflect changes in quantity and change trends of the targeted object over time. Gravity-center models are spatially explicit; the degree of spatial representation that they offer depends on the number of zones in which the study region is subdivided. The models are static or quasi-static (or comparatively static) at best, which means that they do not account for the dynamics underlying the observed interactions. In terms of the level of detail of the land uses considered and the spatial behavior modeled, the most common forms of gravity model concern two main types of land use, e.g., residential and commercial, residential and employment, or residential and recreational [38]. In this paper, the gravity-center model was applied to obtain the spatial changes of historical settlements (residential areas), and is not expected to explain driving forces of change. The land development stages were reclassified, and the gravity-center coordinates of each stage were calculated. As the attribute of settlements in this research is a point (not a polygon with area), the equation for the center of gravity of settlements was applied as follows:
X t = i = 1 n X t i / n  
Y t = i = 1 n Y t i / n  
where Xt and Yt are the X and Y gravity center coordinates, respectively, of settlements for period t; Xti and Yti are the x and y coordinates, respectively, of point i; and n is the total number of settlements in period t.

2.3.2. Proxy-Based Reconstruction Method

Historical documents, maps, models, and proxy-based reconstruction studies of LUCC and agricultural land cover have been widely used for reproducing past land-use information, not only for the quantity of land cover/use in a historical period, but also for the spatial distribution. In particular, proxy-based reconstruction is a convenient and effective method to reconstruct one type of land cover/use by using deductions from the relationship between the land type and other variables. The proxy method means that data recorded indirectly could be replaced by similar data according to different statistical standards (Equation (3)) [27]. For example, Goldewijk (2001) assumed that there should always be some agricultural activities where people are living (especially in the past), and therefore, he used population density as an acceptable proxy for the allocation of cropland and pasture when estimating global land-use change over the past 300 years [39]. The name of a settlement intuitively records conditions of new land transformation when humans arrive; therefore, it is important in understanding the land development process and the historical course of reconstructing land-use changes:
y = f ( x )  
where x refers to the acceptable proxy index, which is easy to obtain from historical documents, and y refers to the targeted reconstructed land.

2.3.3. GIS-Based Analysis Methodology

This research tried to reconstruct arable land based on its relationship with settlements, which could be reflected by the farming radius. So, how to calculate the farming radius is the key in this proxy-based reconstruction. In general, there are two ways to achieve it: an equalization-based calculation, and a cultivation–settlement ratio-based calculation. In this context, the use of a GIS tool that could capture, store, manipulate, analyze, manage and represent spatial data could be very helpful [21].
(1) Equalization-Based Calculation Method
Influenced by the actual conditions of farming and agricultural production levels, it is assumed that the farming radius of settlements is limited, with a fixed value in the region. Theoretically, when the buffer area, determined by taking the settlement as the center with a certain radius, is equal to the area of cultivated land in the study area, this radius represents the farming radius of the settlement [40,41].
(2) Cultivation–Settlement Ratio-Based Calculation Method
Jin (1988) [42] proposed a formula that could reflect the relationships among farming radius, number of population, and per capita cultivated farmland (Equation (4)). For a certain settlement, its total area of cultivated land could be calculated by the product of per capita cultivated land area and population number. The ratio of cultivated land and rural settlement represents the regional agricultural production level [41]. Combining Equations (4) and (5), the farming radius of a settlement can be deduced as Equation (6):
N M = K π R 2  
G = N M J  
R = G J K π  
where N is the population; M is the per capita cultivated land area; K is the ratio of cultivated land according to the area of the administrative region, and is also named the land transformation coefficient; G is the ratio of cultivated land to rural settlement; J is the area of settlement; and R is the farming radius.
(3) Comparison of the Two Methods
The equalization-based calculation method, as a regular method, assumes that the farming radius is a fixed value, and all of the settlements in the region cultivate land in the range of circles with the same radii. However, the cultivation–settlement ratio-based calculation method considers the sizes of settlements. When the environments are similar and the per capita rural residential land is basically the same in the study region, the settlements with large populations tend to have a relatively large farming radius to maintain a certain per capita amount of production land (Figure 4).
In this research, the digitized data from the topographic maps of the 1930s were considered as the actual spatial distribution of historical land use/cover. Here, land-use types mainly include settlements and arable land. GIS-based buffer analysis was used to calculate the farming radius. In the equalization-based calculation method, a buffer area map was generated with 100-m step lengths by taking each settlement from the 1930s maps as a center. After establishing topological relationships, the buffer area was revised according to the administration range of the study area, and its size was obtained after repeated calculations. Then, a distribution map of all of the settlements was produced. Next, comparing the produced buffer area with the actual farmland distribution map from the 1930s maps, the cultivation radius of Zhenlai County in the 1930s could be worked out. When the buffer area within the research region was closest to the value of arable land area determined from the topographic maps, the buffer distance could be considered as the farming radius. In the cultivation–settlement ratio-based calculation method, the farming radius varies according to different regions. The town/township administrative map of Zhenlai County was combined with the farmland area extracted from topographic maps from the 1930s to calculate the farming radius based on Equation (6).

3. Results

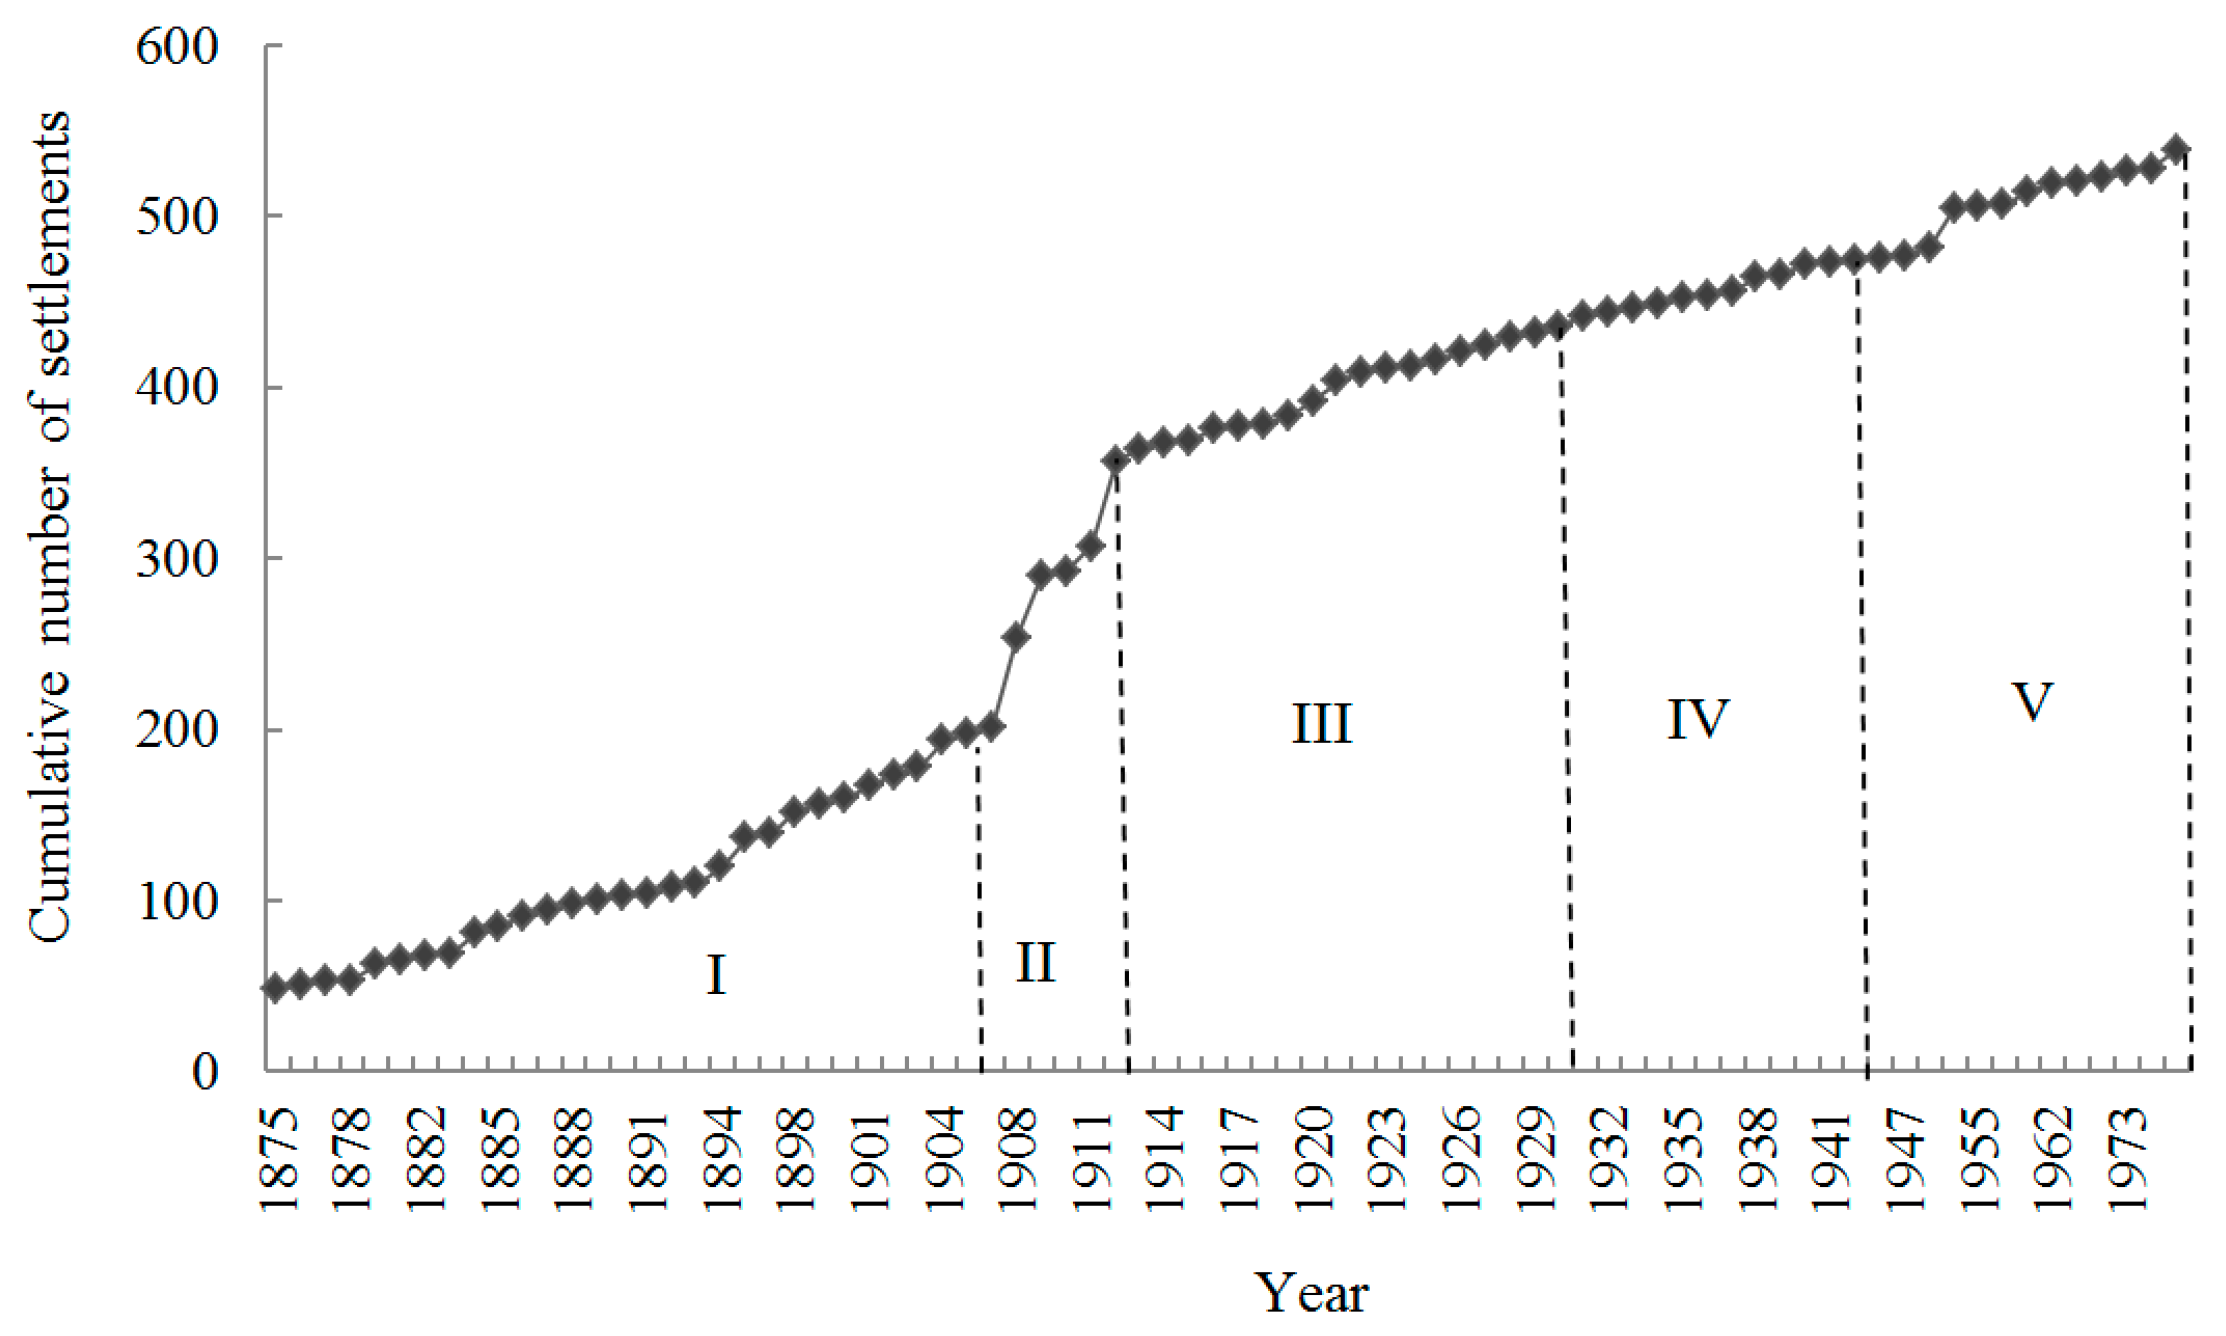
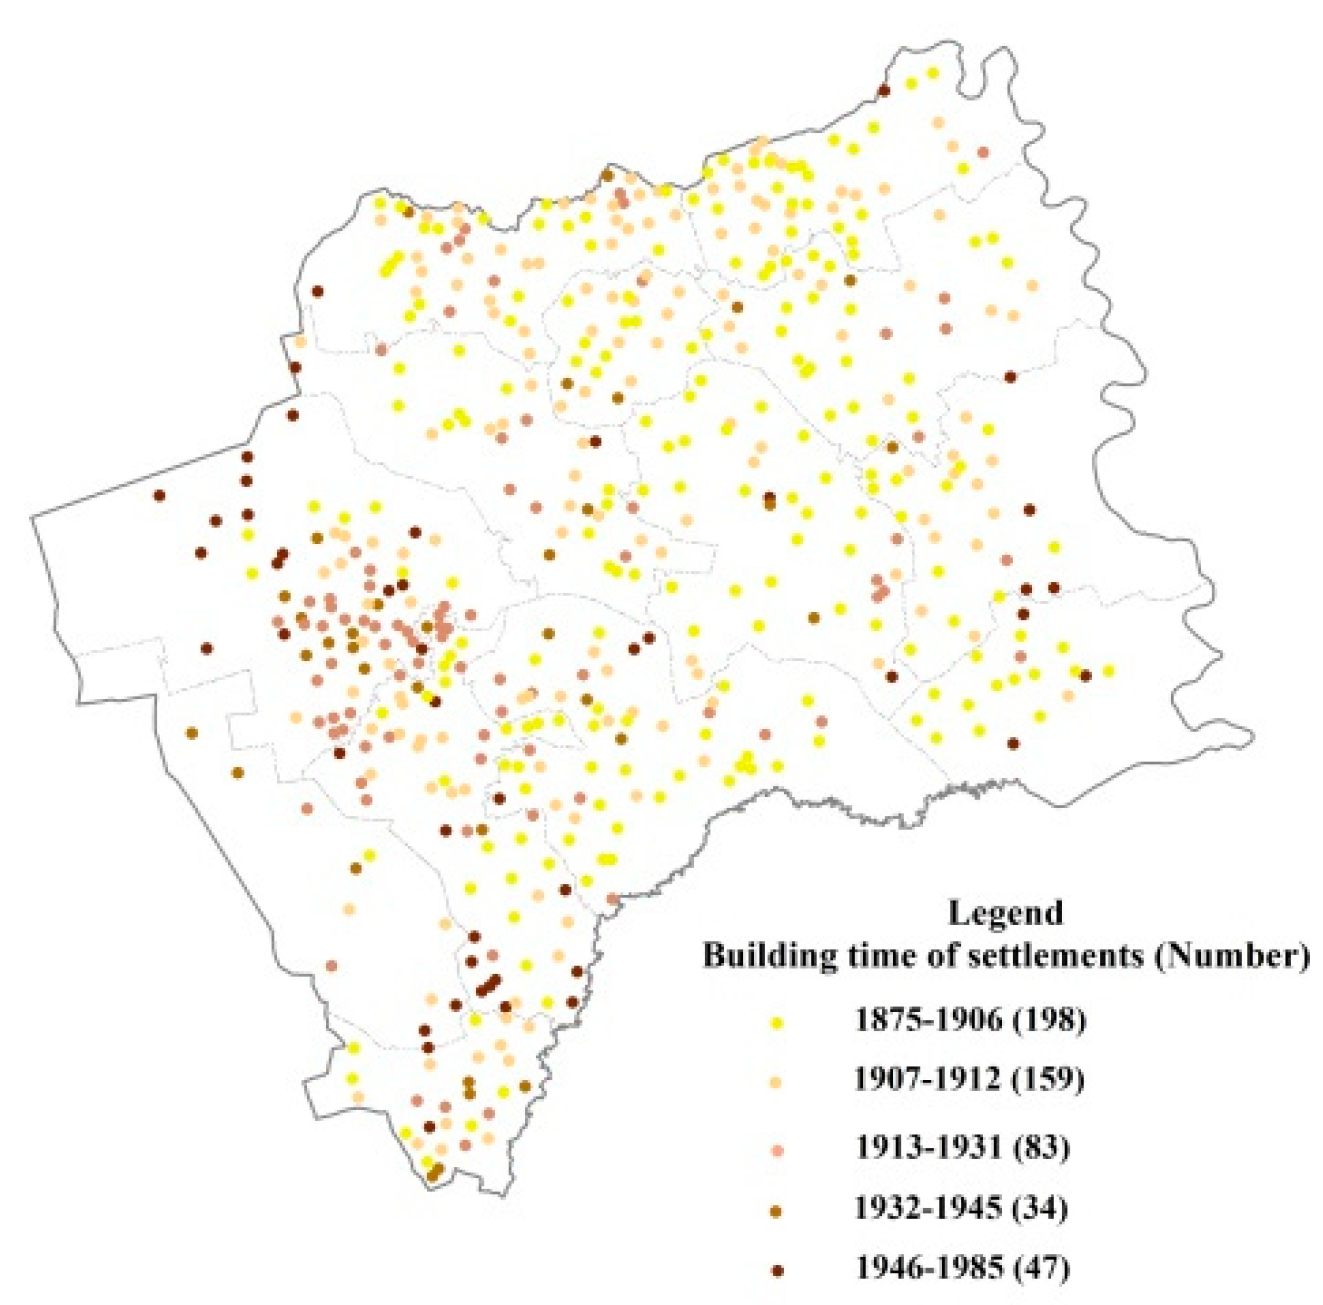
3.1. Settlement Change According to Zhenlai Gazetteer

According to the records of the Zhenlai Gazetteer, two villages were built in 1853 that reflect and represent the early land conversion after people settled in the study area, but these were small-scale land transformations due to the low technology level at that time, which had little influence on the overall land-use and land-cover change there. Large-scale development began in 1875 after the ban on cultivation was lifted, and the most recent settlement was founded in 1975.
Human activities have a profound impact on LUCC, and the evolution of settlements could reflect the transformation process of cultivated land. Combined with the history of Northeast China and the evolution characteristics of new villages, the process of land development in the study region is divided into the following five stages (Figure 5): (1) at the end of the Qing Dynasty (1875–1906), 198 new villages; (2) from Xuantong of the Qing Dynasty to the first year of the Republic of China (1907–1912), 159 new villages; (3) during the period of the Republic of China (1913–1931), 83 new villages; (4) during Manchoukuo (1932–1945), 34 new villages; and (5) after liberation (1946–1985), 47 new villages. Figure 6 shows the spatial distributions of villages, the years of founding, and the spatial development trend in the study area during 1875–1985.

3.2. Land Development and Transformation Process

Based on the above classification, the corresponding development process of land-cover/use change in each stage was as follows. (1) Before 1875, there was little land transformation, and the main land cover was natural land, including grassland and wetland, influenced by the Qing government’s prohibition policy; (2) After 1875, an influx of refugees migrated to the northeast, and the Qing government began to lift the ban on cultivation. The legal land-change policy, huge population pressure, and years of famine in the north in Shanhaiguan Pass prompted large-scale immigration. From 1875 to 1906, mass migration accelerated the natural land-cover change to meet agricultural land; (3) The period 1907–1912 had the greatest increase in villages, and was also the most prominent stage for land-use development in Zhenlai County; (4) Due to natural disasters and the warlord dogfight in Shanhaiguan Pass, many immigrants migrated to the northeast during 1913–1931. Land conversion extended to the west of Zhenlai based on the existing land development; (5) During 1932–1945, the western flat area in the research region was gradually reclaimed and developed based on the previously cultivated land; (6) There was mainly an expansion of existing cultivated land or preferential development in the undeveloped area after 1945. Laibei County was merged with Zhendong County in 1947 to create Zhenlai County, indicating that this region had been transformed from animal husbandry-dominated to agriculture-dominated. The cumulative curve of the number of villages that were built each year (Figure 5) shows that approximately 84% of land development and utilization occurred between 1875–1931, and the number of settlements increased most rapidly from 1907 to 1912. The Qing government announced the comprehensive opening of the area in 1905, and immigration and land transformation in Jilin Province experienced the most active period shortly thereafter. Zhenlai County is located in the northwest of Jilin Province; thus, its entry into the active period was a little later. After several years of rapid development, land transformation in the study region slowed down, and stepped into the normal development stage.
The elevation of Zhenlai County ranges from 105.8 m to 240.2 m, and most of the region is located between 130–140 m, with small fluctuations. The altitude of the northwest area is between 180–232.5 m. In the middle part, there are undulating sand dunes and scattered swamps, with altitudes of 130 m to 179.2 m. In the east, it is low-lying and flat, with altitudes between 129–149 m. Figure 5 reflects the general trend of land development in Zhenlai County from northeast to southwest. Zhenlai County has sloping terrain that is higher in the northwest and lower in the southeast. To analyze the influence of elevation on village distribution, equal intervals for elevation were not adopted, while elevation was divided into intervals that are suitable for the microslope in the study region according to the statistical analysis of actual regional elevation. The region is divided into six intervals of elevation: 105.8–130 m, 130–135 m, 135–140 m, 140–145 m, 145–180 m, and 180–240.2 m, which can be produced by the reclassification of a digital elevation model (DEM) raster. By overlapping the reclassified elevation and settlement files, a sketch map of the movement of settlement gravity on various elevations can be obtained (Figure 7, Table 2) to analyze the influence of elevation on the spatial location of villages. Table 2 reveals that most of the settlements were located at 130–140 m during the 1875–1985 period, and approximately half were at 130–135 m. After 1913, it is very obvious that settlements were concentrated at 135–140 m. During 1932–1945 and 1946–1985, most of the settlements were located at elevations of 140–145 m. Gradually, the southeastern area with lower elevation became a key area for people to build villages from 1946 to 1985. Overall, land development expanded from flat areas to higher terrain, as seen in Figure 7. That is, the land development and transformation of Zhenlai County started in the eastern and middle parts, the western part followed, and the high-elevation area in the northwest corner was developed last. By further referring to the river system map and disaster information in the historical records, it can be learned that few people at earlier stages lived or reclaimed land around rivers, such as the Nenjiang and Tao’er Rivers, to avoid floods. However, with the reinforcement of embankments, some places near rivers started to be exploited. Therefore, the eastern and southeastern edge of Zhenlai County was developed later.
After juxtaposing the soil type and settlement maps, the influence of soil type on settlement locations can also be analyzed. Table 3 shows that the settlements were mainly distributed on chernozem in each period. In addition, people liked to build their settlements on meadow soil and alkaline soil during 1875–1906, 1907–1912, 1913–1931, and 1932–1945. As for 1946–1985, most of the villages were located on dark chestnut and meadow soil, followed by alluvial and meadow soil. Overall, settlements were mainly built on fertile land, such as chernozem and meadow soil; however, the central alkaline soil area was also an important location where people constructed villages due to the limited land resources. During 1946–1985, alluvial soil near the eastern Nenjiang River and south of the Taoerhe River and dark chestnut calcium soil of the northwest also gradually became key areas where villages were founded.

3.3. Settlement as a Proxy for Historical Arable Land Reconstruction

In general, the circular buffer area obtained on the basis of a farming radius and using the settlement as the center of the circle becomes the maximum spatial scope of agricultural activity within the settlement. However, this type of settlement–farming distribution pattern is under ideal conditions. In reality, the practical distribution of farmland is affected by terrain, landform, gradient, soil, moisture, and other factors, and is usually irregular. The gross area of farmland in reality is often larger than it is within the buffer area. The larger the proportion of farmland area distributed in the buffer of settlements in total farmland area, the closer the degree of agricultural development. Farming radius is one of the important factors affecting the distribution of rural residential settlements. In turn, the distribution of settlements may indirectly reflect the farming radius of the study area.

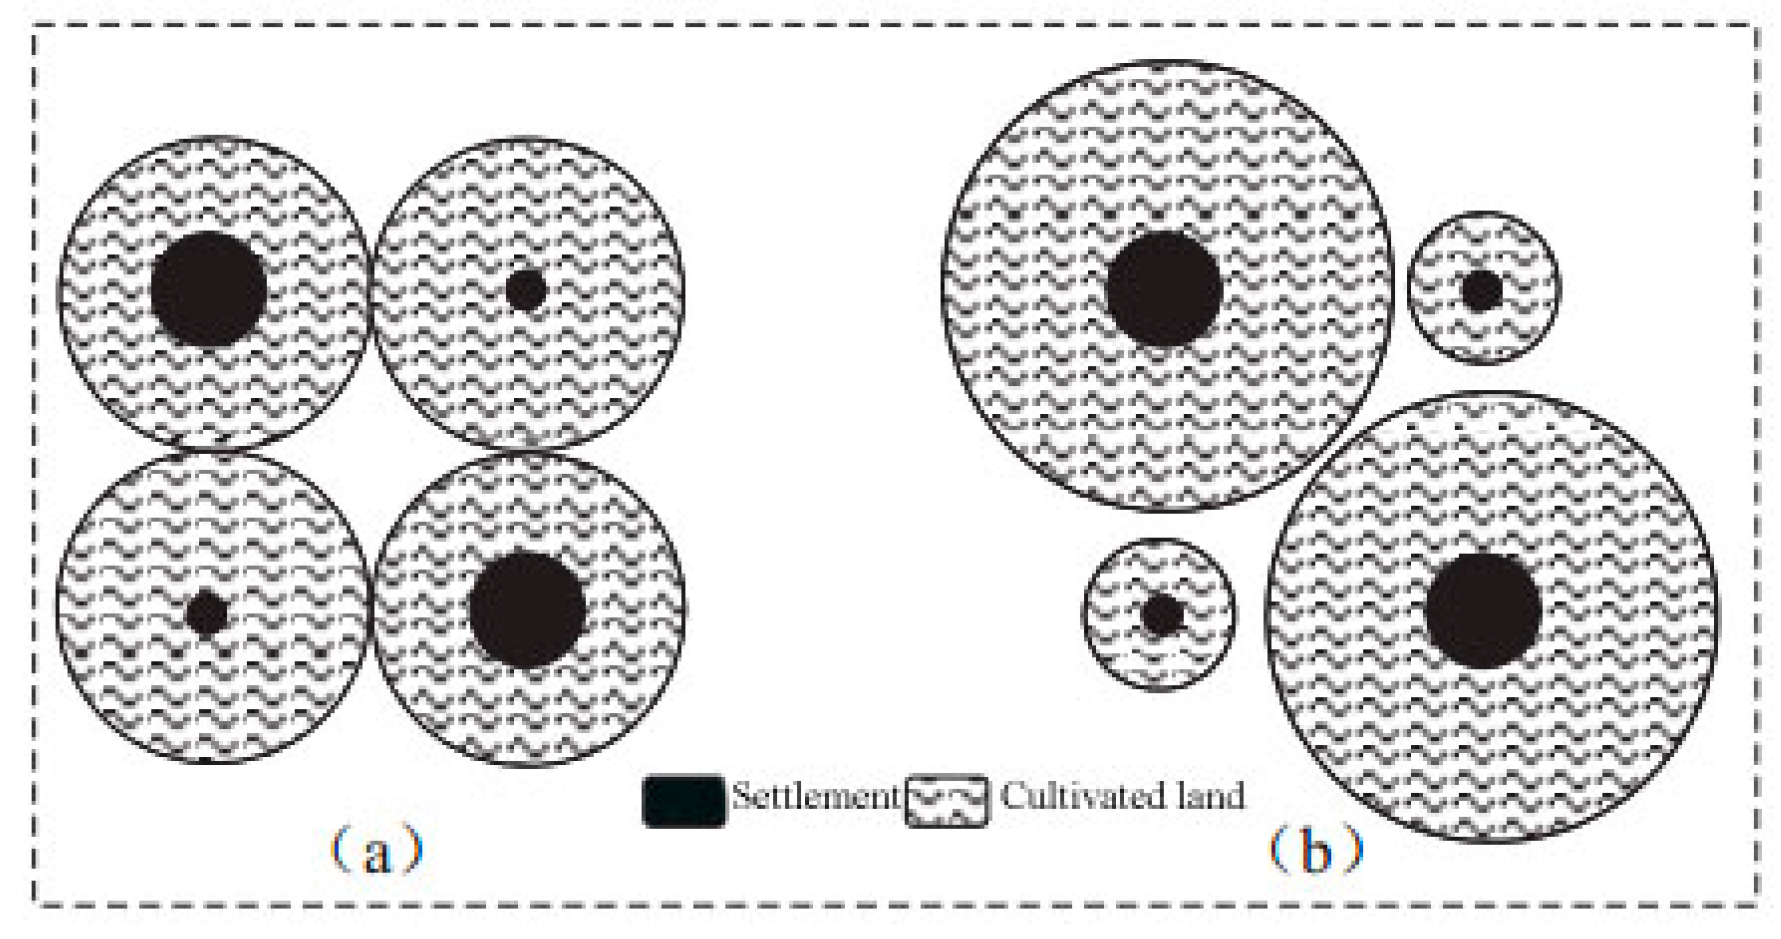
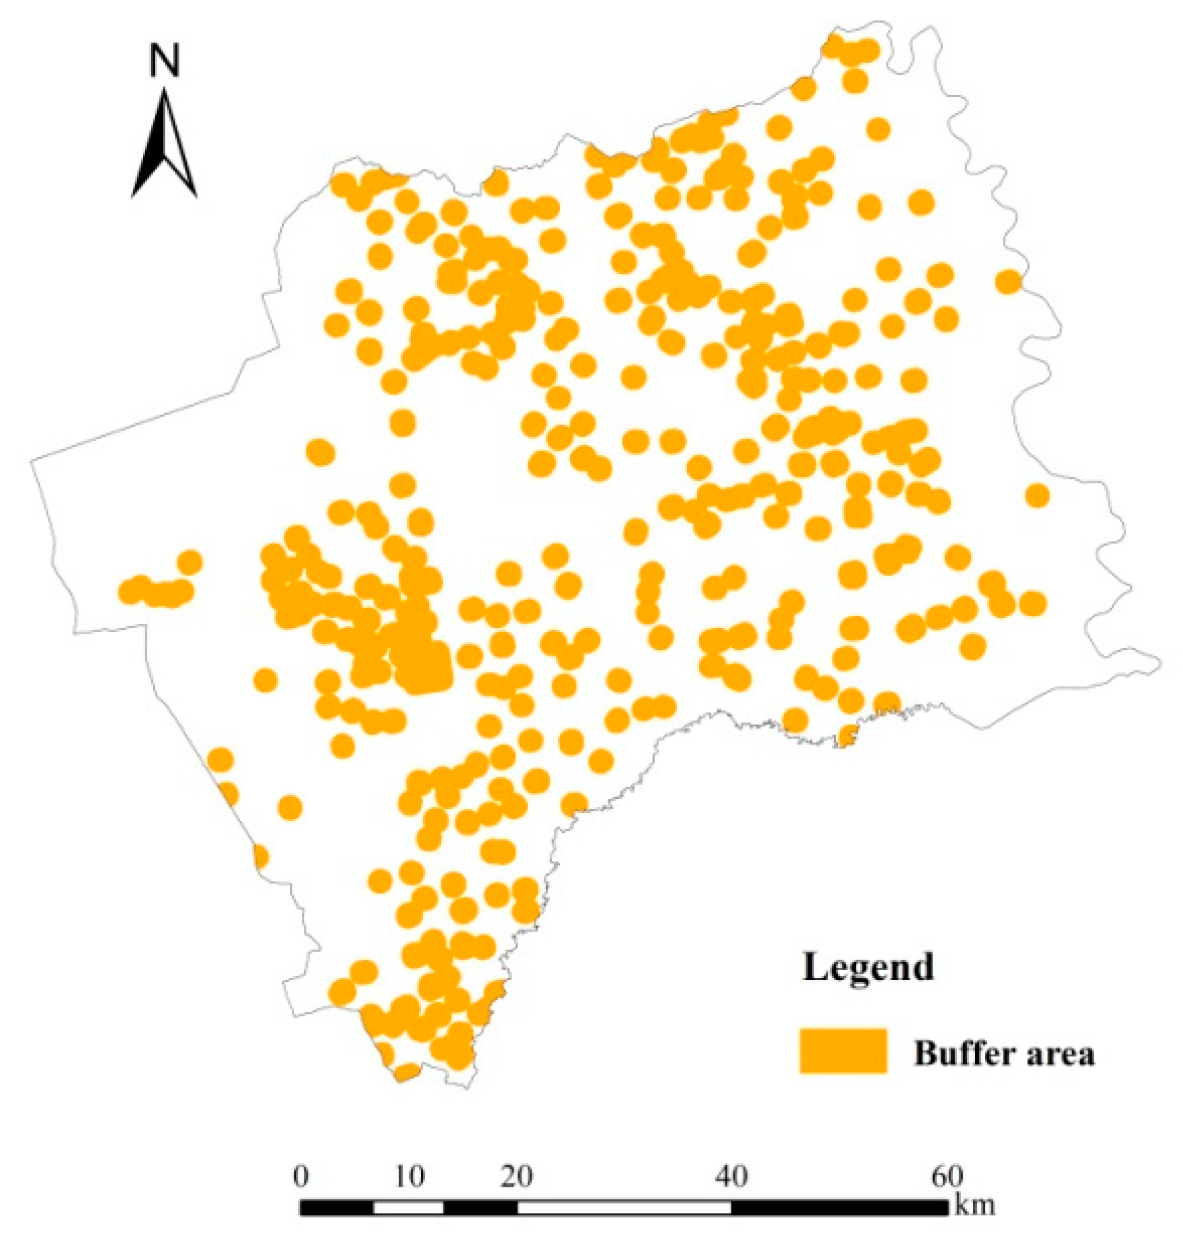
3.3.1. Calculation of Farming Radius Adopting Two Methods Based on Data from Topographic Maps

(1) Farming Radius Using the Equalization-Based Calculation
When the buffer distance is 1092 m (Figure 8), the buffer area in the research region reaches 143,749 hectares, and there is only a difference of 4.24 hectares (0.003%) compared to the total area of farmland determined from topographic maps (Figure 9). To analyze the spatial difference, the buffer area map is juxtaposed with the topographic maps. The farmland within the buffer area is 72,301.12 hectares, accounting for 50.30% of the practical farmland area (Figure 10). The result reveals that since the buffer distance constantly increases, the buffer area may gradually cover the entire county, and the farmland area within the buffer area will be closer to the practical farmland area.
(2) Farming Radius Based on Cultivation–Settlement Ratio
Considering that Zhenlai County has sloping terrain, tilting from northwest to southeast, the farming radius varies in different regions. The township administrative map of the county was combined with farmland area extracted from topographic maps from the 1930s to calculate the land transformation coefficients and cultivation–settlement ratios of all of the towns (Table 4).
According to the land-use map from the 1930s topographic maps, the buffer area is established based on the cultivation radius of rural residential areas in various towns, as shown in Table 4. After integrating the overlapping areas, a buffer area of 157,199 hectares is obtained (Figure 11). The area of cultivated land within the buffer area is 77,380.37 hectares, accounting for 53.83% of the actual cultivated land (Figure 12).
(3) Differences of Farming Radius from Different Methods
Through a comparative analysis of the results obtained from the two methods (Table 5), it could be learned that according to the equalization-based computing method, the farming radius is 1092 m, and the area of cultivated land within the buffer area accounts for 50.30% of the actual area of cultivated land, which is lower than the result (53.83%) obtained by the cultivation–settlement ratio computing method. Therefore, this research adopts the latter method, and uses the data extraction of historical settlements to reconstruct historical cultivated land based on the settlement distribution and farming radius.

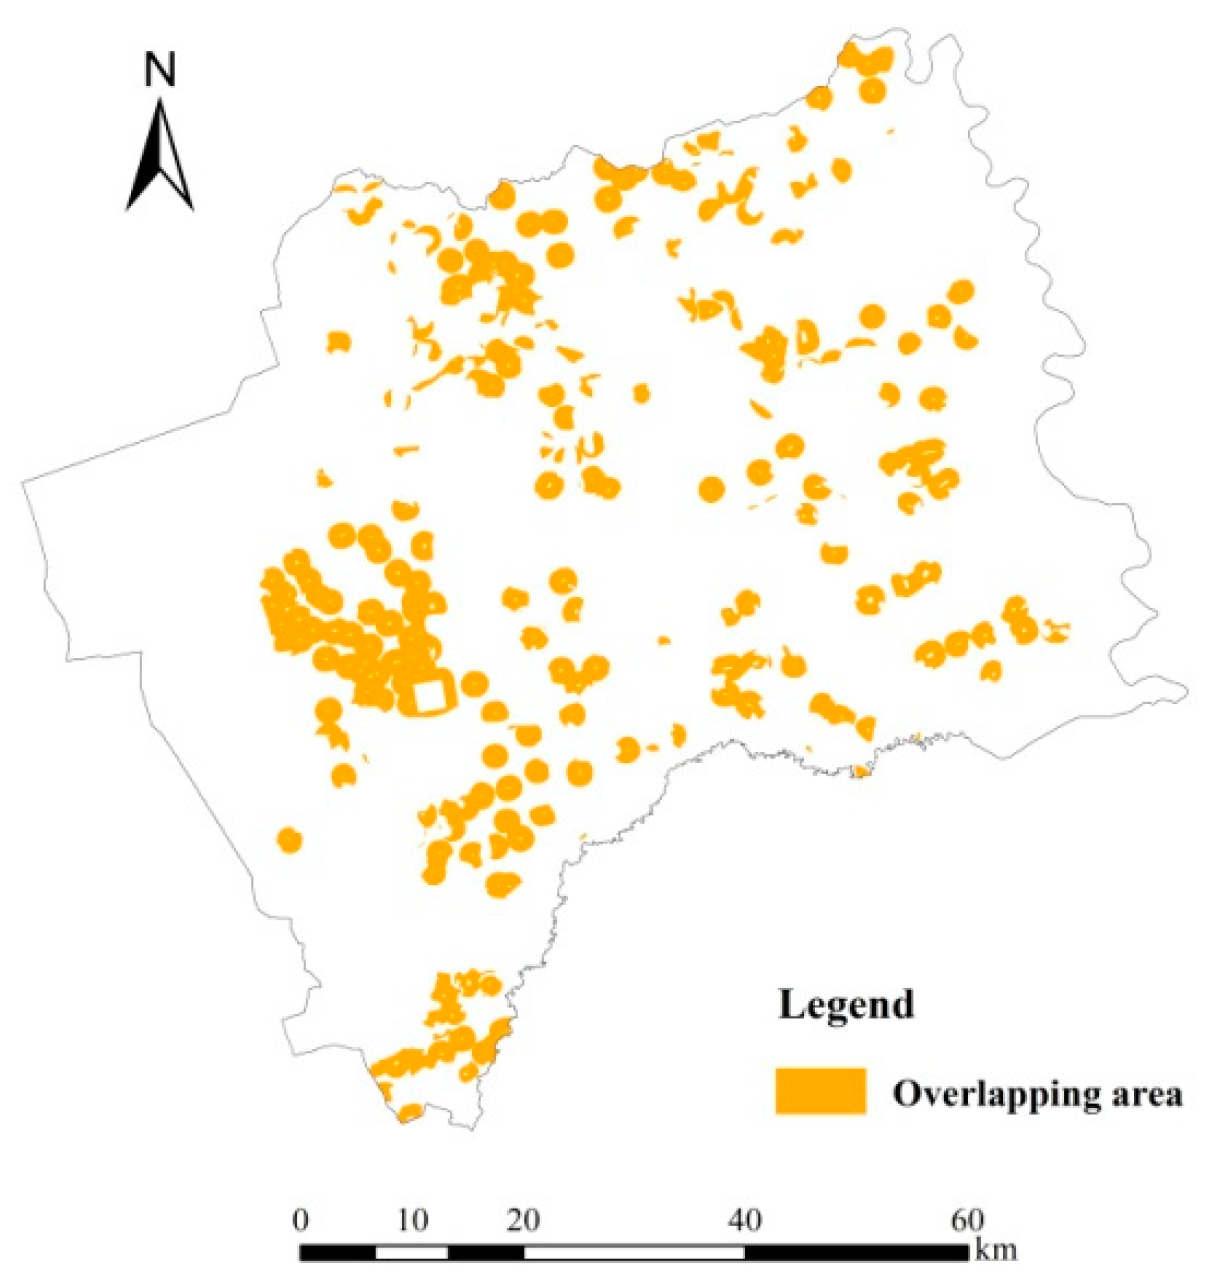
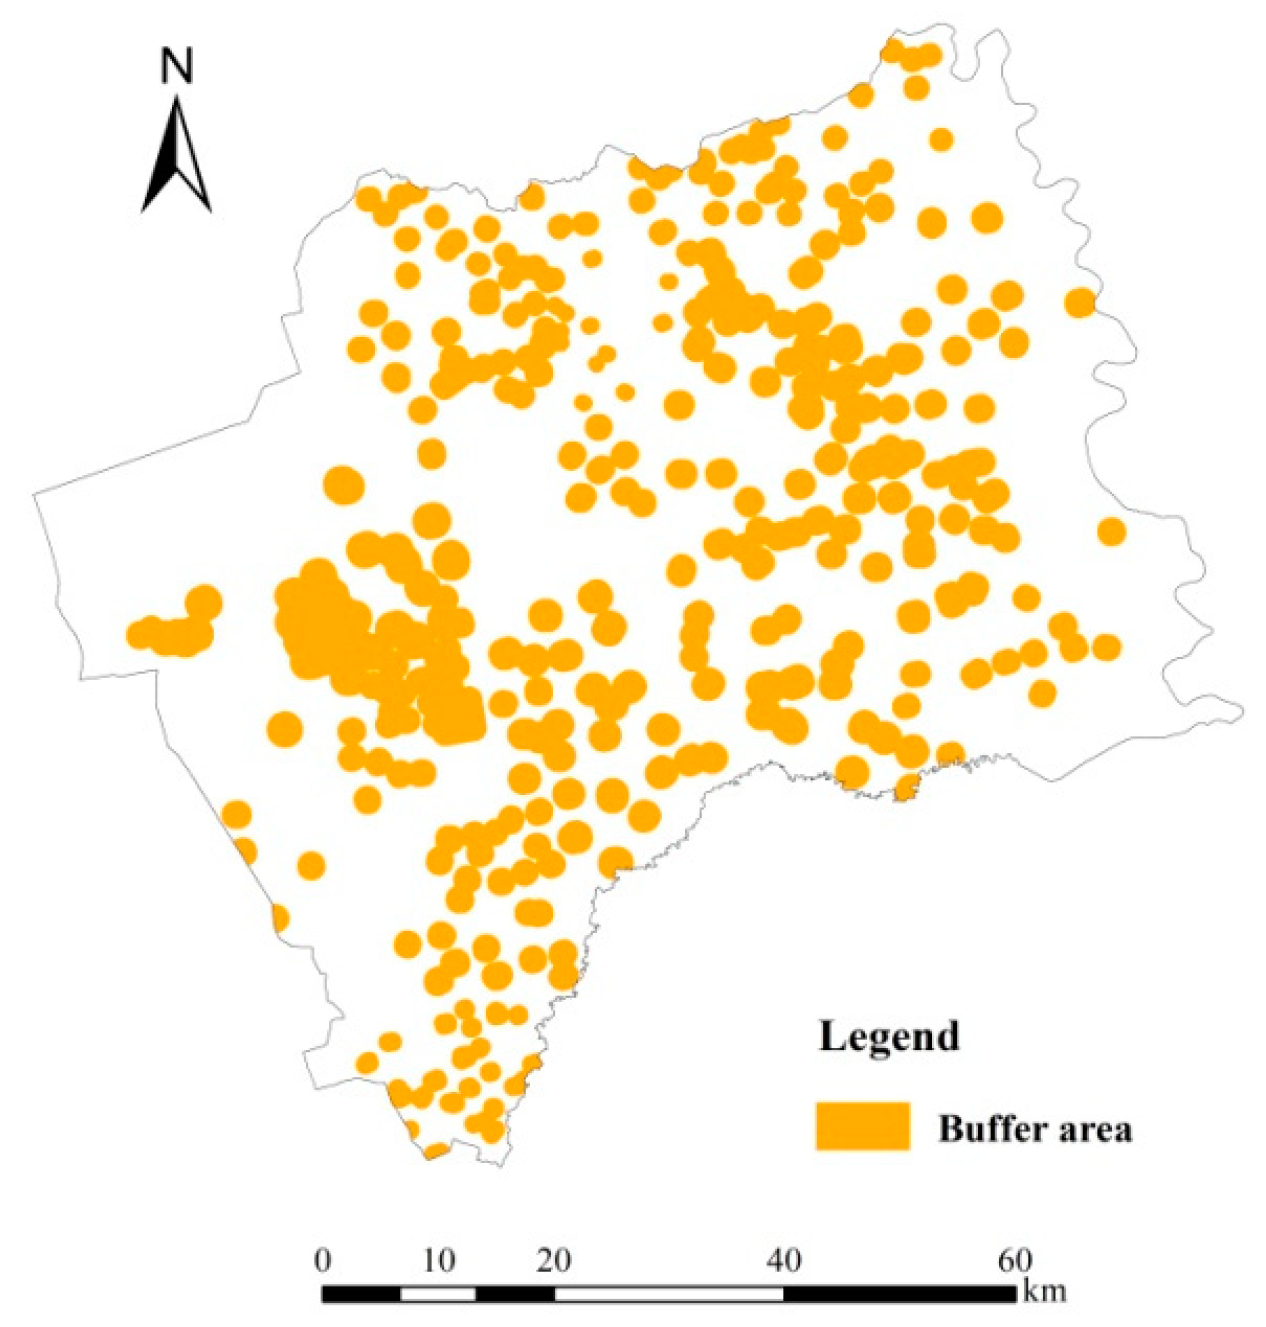
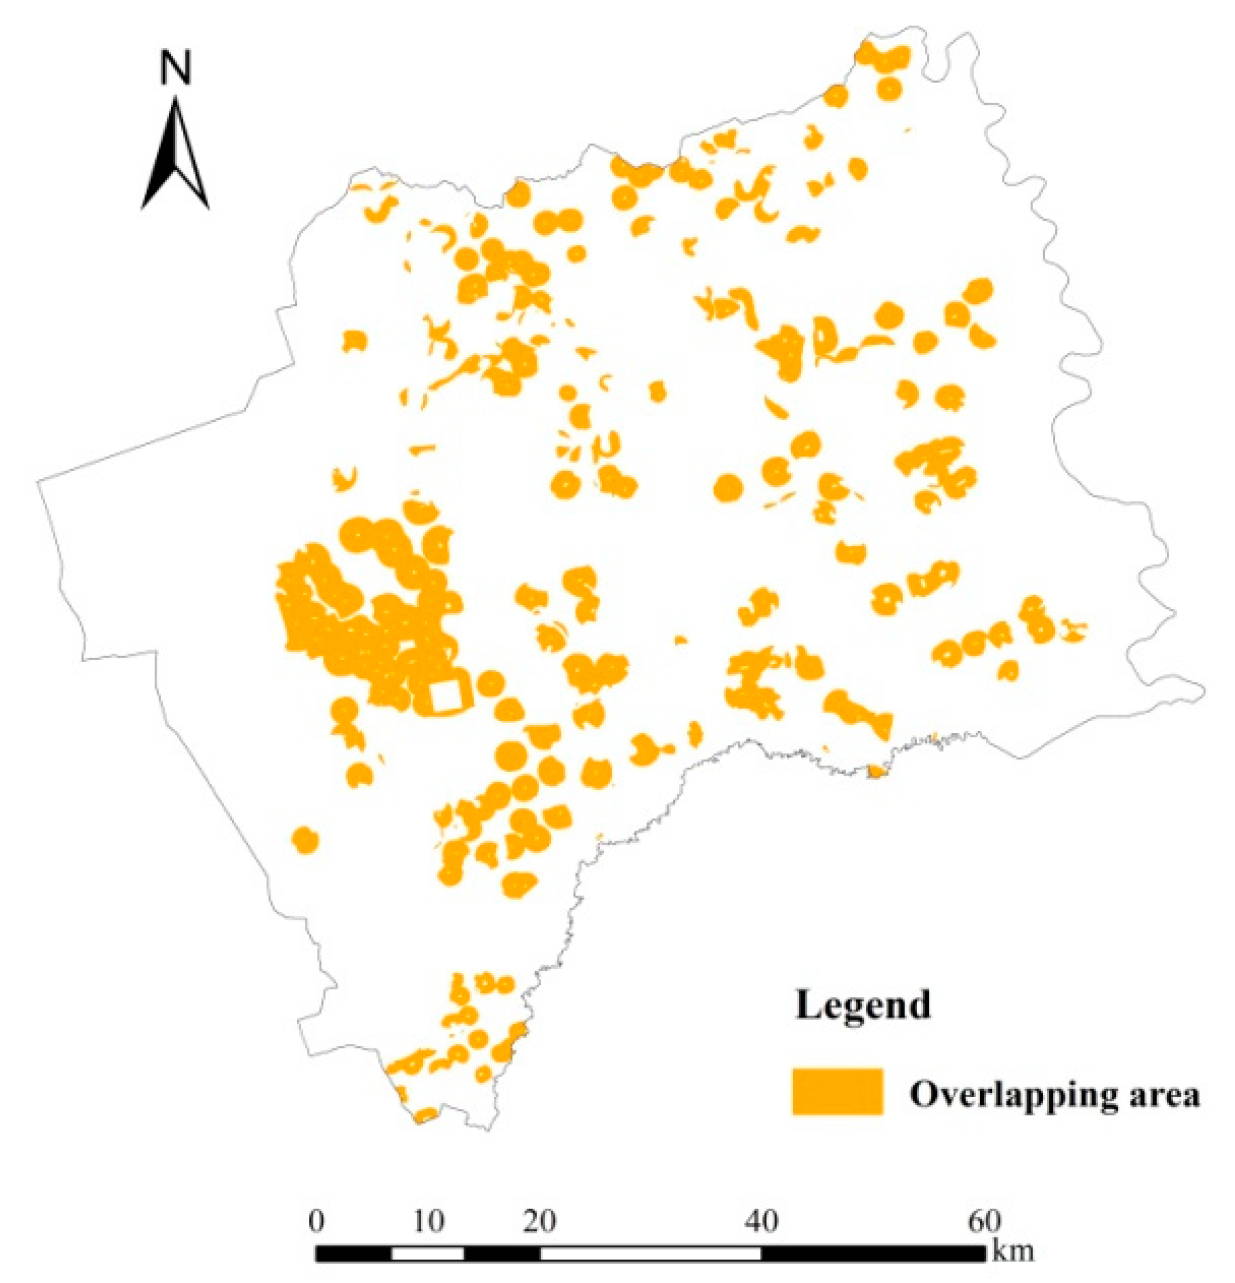
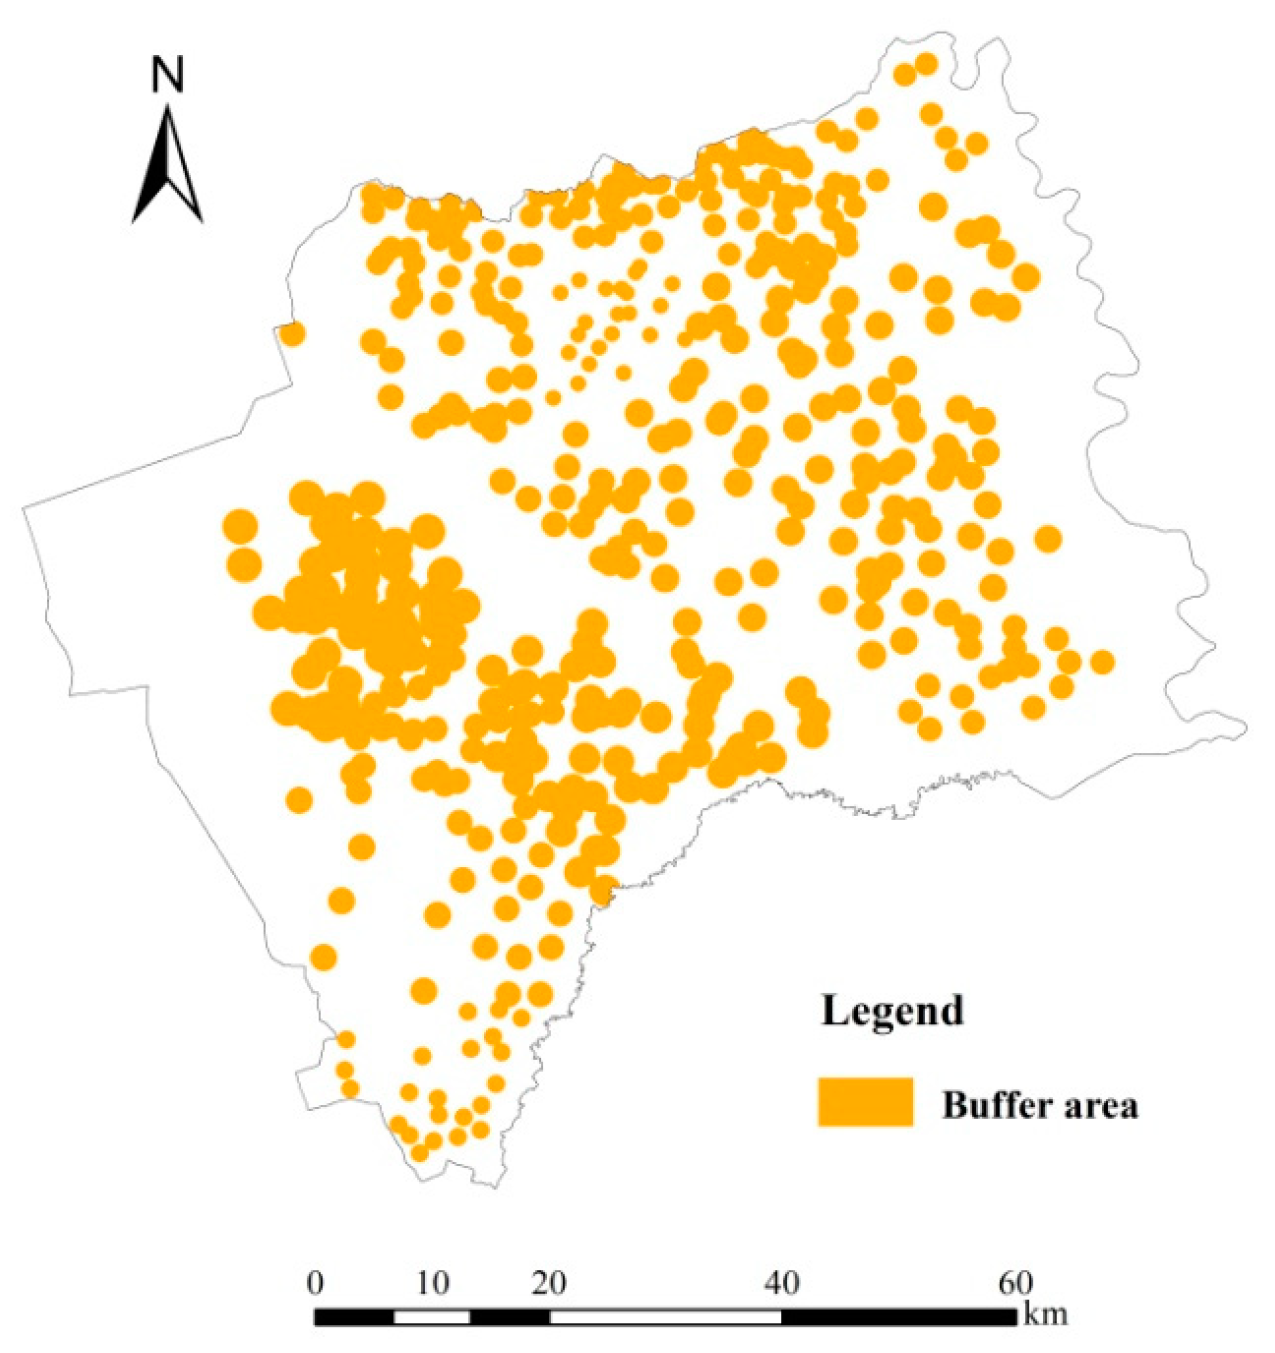
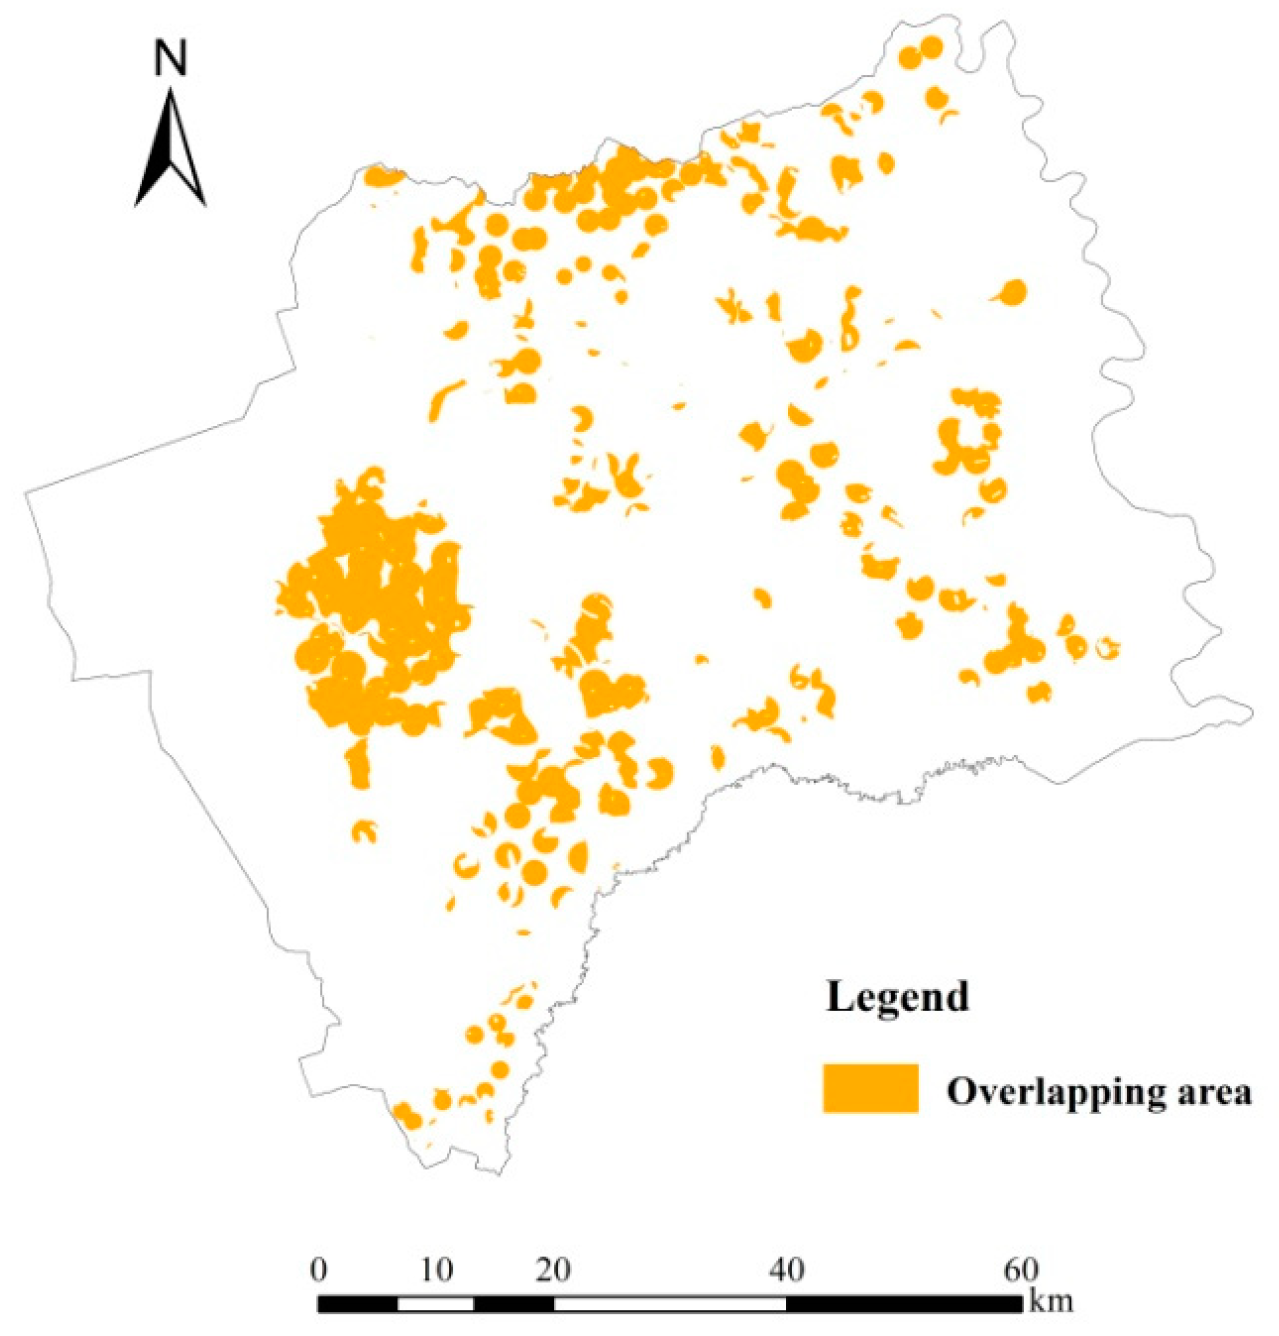
3.3.2. Historical Arable Land Reconstruction Based on Settlements and Farming Radius

Based on the above analysis, this study adopts the cultivation–settlement ratio-based method to reconstruct historical arable land based on spatial settlement distribution and farming radius. According to the distribution of settlements during 1875–1931 extracted from the Zhenlai Gazetteer, an analysis of the buffer areas of various villages (towns) is carried out by taking the buffer radii in Table 4 calculated using topographic data. After integrating the overlapped pattern spots, the spatial distribution of arable land within the study area in the 1930s can be obtained. The reconstruction results (Figure 13) indicate that Zhenlai County had 155,358 hectares of arable land in 1932.
By overlaying the arable land reconstruction map with the digitized arable land data from the topographic maps of the 1930s, we can see that the overlapping area amounts to 68,700.01 hectares, accounting for 47.79% of the arable land area in the topographic maps. The spatial distribution of overlapping sections is shown in Figure 14.

4. Discussion

Historical changes in arable land on decadal to centennial time scales could reflect the effects of human activities on environmental change, which are significant drivers of many environmental issues. Historical land-use/cover reconstruction is the key and a source of difficulty in the research of historical land-use/cover change. Before the advent of remote sensing technology, historical records provided land managers with information that could be used to understand LUCC trajectories, and a more complete picture of historical land use/cover could be obtained by integrating multisource data [24]. Agricultural expansion can also be conceived as a spatial diffusion process driven by a set of decisions by agents to migrate into frontier areas and clear land for crop production [43]. In this context, this paper uses the in-depth research and analysis of the historical progress of land transformation from nonagricultural areas into agricultural areas from the perspective of settlement evolution by referring to the Zhenlai Gazetteer and other historical documents.
The above results show that before 1875, there was little land transformation from nonagricultural to agricultural, and the main land cover was grassland and wetland. After that time, mass migration accelerated the process of land transformation, which was most significant during 1907–1912, revealing that settlement establishment was often accompanied by land transformation. It is easy to deduce from the aforementioned development process that policy has played an important role in the land development and utilization of Zhenlai County [44]. Over the last century, northeastern China also has experienced a large-scale population influx from Chuang Guandong migration, and a major land transformation process influenced by the ban on the Qing government’s prohibition policy being lifted [44,45]. This was mainly caused by the following. (1) North China had a large population and limited land at the time of the research, and frequent man-made and natural disasters forced local people to leave their homes and migrate to the northeast; (2) Northeast China is geographically vast, thinly populated, and has fertile soil. Regional development and construction require much labor, and the extensive railway network in northeastern areas provided convenient transportation for immigrants; (3) Relevant policies, such as lifting the ban on the Qing government’s prohibition policy, the immigration encouragement policy carried out by the Central Government of the Republic of China and local governments in the northeast, fare waivers, etc. facilitated the large-scale immigration of Chuang Guandong [46]. The overall trend of transformation to agricultural land in this region is from northeast to southwest. Settlements were mainly built on fertile land, such as chernozem and meadow soil, and gradually turned to other soil types due to the limited land resources. These characteristics reveal the agricultural change order in the spatial distribution. People prefer to first develop agricultural land that is easily reclaimed at low cost.
In addition, this paper also provides a basis for understanding land-use changes in eco-fragile areas, and serves as an attempt to reconstruct historical land transformation patterns on the basis of settlement evolution history. It innovates and establishes a new methodological framework for the historical reconstruction of arable land not only in quantity, but also in spatial distribution. By applying the mutual relationship between the location of settlements and arable land, which can be reflected by the farming radius, historical arable land can be built, and analyzing historical changes in land cover/use is feasible. It is more common to obtain agricultural activity using population as a proxy, and most of the current studies focus on the relationship between cropland area and rate of population change [47]. This method enriches the current historical methods of arable land reconstruction by using settlement as a proxy based on other proxies that integrate multisource data. As global agricultural land is impacted by human activities, it is also workable when this method is applied to other regions as long as the distribution of settlement and farming radius are available. Sometimes, the farming radius might be difficult to calculate in some regions due to data availability; if so, its value could be replaceable by the data in similar regions. Results indicate that farming radii calculated using the cultivation–settlement ratio method tends to have higher accuracy than those calculated using the equalization-based method, because the former fully considers the different influences of the sizes of settlements on the farming radius. In this research, spatial arable land data could be obtained from the topographical maps, but to offer a new thought for researchers when they face the difficulties in collecting historical data, a proxy-based reconstruction method is innovated based on the relationships between arable land and settlements, which could be reflected by the farming radius. Taking the topographic maps as the references, the spatial distribution of the reconstructed arable land accounts for 47.79% (almost half) of that in the topographic maps, which seems good, but still has space to advance. Yet, it is possible that any precise measurement of simulation accuracy is unattainable due to time point inconsistencies concerning land category definitions [48]. This inaccuracy could be explained as follows. (1) The majority of the topographic maps that were used in this research were produced between 1932–1935, and are limited primarily in that they were created with a specific military purpose. As paddy fields were rare in this study area in the 1930s, arable land mainly refers to rainfed land. Rainfed lands and blank areas lacking a symbol were often difficult to decipher from grassland and wildland, making it challenging to extract and digitize grassland data. Inevitably, the area of arable land is larger on topographic maps than in the proxy-based model due to the difficulties in deducing mixed grassland in the process of digitization; (2) The farming radius was calculated in each town or township, as the population data could be easily collected according to the administrative division. The spatial distribution of arable land deduced from the farming radius depends on the spatial zones into which the study region is subdivided. To improve the accuracy of historical arable land reconstruction, it will be necessary to explore the research of the farming radius calculation method based on regional characteristics such as terrain, water supplies, and population density in the future.
Human agricultural activity has greatly influenced the patterns of local land use/cover and landscape. Land-use transitions could be associated with negative feedback that arises from a depletion of key resources or a decline in the provision of important ecosystem goods and services [43]. From the current literature [27], human-induced land changes, constituting 26.89% of Zhenlai County during 1954–2005, played an important role in environmental change. Besides, demographic change often results in major land transformation and the expansion of agricultural areas to meet the food requirements of local people, which is the main cause of pressure on historical grassland and wetland in the research area. In this research, 521 settlements were established during 1875–1985 in the study area, reflecting intensive human activities. It is also said that the increasing annual average temperature and decreasing annual rainfall in Zhenlai County over the past century resulted in high evaporation and frequent droughts. These brought serious damage to natural ecosystems such as grassland and wetland [48]. Eventually, national political decisions that led to the agricultural land transition were also influenced by a perception of ecological degradation. Yet, a transition is not a fixed pattern, nor is it deterministic [43]. Economic development has created enough nonfarm jobs to pull farmers off the land, thereby inducing the conversion of fields into grasslands or other lands. It should be noted that a lot of arable land has been abandoned with the acceleration of urbanization. This is because the labor force is driven from agriculture to other economic sectors, and from rural to urban areas for better living and earnings. So, long-term historical land change trajectories and characteristics should be applied to future land policy making to achieve sustainable land development. Facing increasing land degradation, it is urgent to adjust and optimize the land-use structure to promote the integrated development of production–living–ecology.
In addition, the constraints of using historical documents should be noticed, as they are limited by the history of writing records and maps. In this context, paleoenvironmental research can provide information for reconstructing past vegetation in the millennial time-scale or longer [14]. It has its unique possibilities for the study of time periods where historical records are lacking [49]. Reconstructions based on natural archives, such as pollen, plant macrofossils, animal deposits, and annual plant and animal growth cycles were widely used to reconstruct paleoclimate and paleoecology, while also gradually being used to analyze historical land-use/cover change [49,50,51]. Especially, the modeling of pollen–vegetation relationships has made such spatial vegetation/landscape reconstruction feasible [52,53]. The pollen assemblages have close relationships with human-induced vegetation related to various traditional human activities. This offers a basis for the interpretation of past human impact on vegetation and the quantitative reconstruction of human-induced landscapes from fossil pollen data.

5. Conclusions

In this research, the historical progress of land transformation for agricultural areas was analyzed from the perspective of settlement evolution by referring to the Zhenlai Gazetteer and other historical documents. In addition, the historical reconstruction of arable land was established using settlement as a proxy between inner relationships, which could be reflected by farming radius. The farming radius was calculated at the town/township level using the digitized land-cover/use data from topographic maps, while settlement information was mainly obtained from gazetteer records within the research region. Then, we produced and reconstructed the spatial arable land data based on the distribution of settlements and the farming radius in Zhenlai County, Northeast China. The results show the following. (1) Before 1875, there was little land transformation from nonagricultural areas into agricultural areas, and the main land cover was grassland and wetland until mass migration accelerated the process of land transformation, which was most significant during 1907–1912, revealing that settlement establishment was often accompanied by land transformation; (2) The overall trend of land transformation for agricultural land in this region is from northeast to southwest. Land development and transformation in Zhenlai County started in flat areas in the eastern and middle parts; the western part followed, and the high-elevation areas in the northwest corner were developed last; (3) Settlements were mainly built on fertile land, such as chernozem and meadow soil, and gradually turned to other soil types due to the limited land resources; (4) Taking the topographic maps as references, the spatial distribution of the reconstructed arable land accounts for 47.79% of that in those maps. As for the proxy-based method reconstruction, most of the current studies have focused on the relationship between cropland area and rate of population change, and it is still necessary to explore the relationships and reconstruct arable land based on other proxies that integrate multisource data. This research innovates and establishes a new methodological framework for the historical reconstruction of arable land in both quantity and spatial distribution based on the distribution of settlements and the farming radius, making a certain contribution to the current literature. Meanwhile, the limitations of this proxy-based reconstruction method should be noted, and it is necessary to explore the research of the farming radius calculation method based on regional characteristics. Moreover, paleoenvironmental research can provide historical land-cover/use information for longer time series. By applying historical land change trajectories and characteristics to land use policy making, a better way could be realized to achieve sustainable development.

Author Contributions

Y.Y. and S.Z. conceived and designed the experiments; Y.Y. analyzed the data and wrote the paper. All authors have read and approved the final manuscript.

Funding

This research was supported by the National Natural Science Foundation for Young Scientists of China (Grant No: 41601173) and the China Postdoctoral Science Foundation (Grant No: 2016M600954). We thank Yan Lv from the second topographic survey team of the National Administration of Surveying, Mapping and Geo information for her data collection.

Conflicts of Interest

The authors declare no conflict of interest.

References

  1. International Geosphere-Biosphere Programme (IGBP). Global Change and Earth System: A Planet Under Pressure; IGBP Science Series; IGBP: Stockholm, Swedish, 2001; p. 4. [Google Scholar]
  2. Ramankutty, N.; Foley, J.A. Estimating historical changes in global land cover: Croplands from 1700 to 1992. Glob. Biogeochem. Cycles 1999, 13, 997–1027. [Google Scholar] [CrossRef] [Green Version]
  3. Goldewijk, K.K.; Verburg, P.H. Uncertainties in global-scale reconstructions of historical land use: An illustration using the HYDE data set. Landsc. Ecol. 2013, 28, 861–877. [Google Scholar] [CrossRef]
  4. Fuchs, R.; Herold, M.; Verburg, P.H.; Clevers, J.G.P.W.; Eberle, J. Gross changes in reconstructions of historic land cover/use for Europe between 1900 and 2010. Glob. Chang. Boil. 2015, 21, 299–313. [Google Scholar] [CrossRef] [PubMed]
  5. Fuchs, R. A Data–Driven Reconstruction of Historic Land Cover/Use Change of Europe for the Period 1900 to 2010; Wageningen University: Wageningen, The Netherlands, 2015. [Google Scholar]
  6. Petit, C.C.; Lambin, E.F. Impact of data integration technique on historical land-use/land-cover change: Comparing historical maps with remote sensing data in the Belgian Ardennes. Landsc. Ecol. 2002, 17, 117–132. [Google Scholar] [CrossRef]
  7. Turner, B.L.; Skole, D.L.; Sanderson, S.; Fischer, G.; Fresco, L.; Leemans, R. Land-Use and Land-Cover Change: Science/Research Plan; Report 35; International Geosphere-Biosphere Programme: Stockholm, Swedish, 1995. [Google Scholar]
  8. Leite, C.C.; Costa, M.H.; Soares-Filho, B.S.; de Barros Viana Hissa, L.C. Historical land use change and associated carbon emissions in Brazil from 1940 to 1995. Glob. Biogeochem. Cycles 2012, 26. [Google Scholar] [CrossRef] [Green Version]
  9. Chang-Martínez, L.A.; Mas, J.F.; Valle, N.T.; Torres, P.S.U.; Folan, W.J. Modeling Historical Land Cover and Land Use: A Review from Contemporary Modeling. ISPRS Int. J. Geo-Inf. 2015, 4, 1791–1812. [Google Scholar] [CrossRef]
  10. Goldewijk, K.K.; Beusen, A.; Janssen, P. Long-term dynamic modeling of global population and built-up area in a spatially explicit way: HYDE 3.1. Holocene 2010, 20, 565–573. [Google Scholar] [CrossRef]
  11. Goldewijk, K.K.; Beusen, A.; Drecht, G.V.; De Vos, M. The HYDE 3.1 spatially explicit database of human–induced global land–use change over the past 12,000 years. Glob. Ecol. Biogeogr. 2011, 20, 73–86. [Google Scholar] [CrossRef]
  12. Hurtt, G.C.; Chini, L.P.; Frolking, S.; Betts, R.A.; Feddema, J.; Fischer, G.; Fisk, J.P.; Hibbard, K.; Houghton, R.A.; Janetos, A.; et al. Harmonization of land–use scenarios for the period 1500–2100: 600 years of global gridded annual land–use transitions, wood harvest, and resulting secondary lands. Clim. Chang. 2011, 109, 117–161. [Google Scholar] [CrossRef]
  13. Olofsson, J.; Hickler, T. Effects of human land-use on the global carbon cycle during the last 6000 years. Veget. Hist. Archaeobot. 2008, 17, 605–615. [Google Scholar] [CrossRef]
  14. Yang, Y.Y.; Zhang, S.W.; Yang, J.C.; Bu, K.; Xing, X.X. A review of historical reconstruction methods of land use/land cover. J. Geogr. Sci. 2014, 24, 746–766. [Google Scholar] [CrossRef]
  15. Boucher, Y.; Arseneault, D.; Sirois, L.; Blais, L. Logging pattern and landscape changes over the last century at the boreal and deciduous forest transition in Eastern Canada. Landsc. Ecol. 2009, 24, 171–184. [Google Scholar] [CrossRef]
  16. Hamre, L.N.; Domaas, S.T.; Austad, I.; Rydgren, K. Land–cover and structural changes in a western Norwegian cultural landscape since 1865, based on an old cadastral map and a field survey. Landsc. Ecol. 2007, 22, 1563–1574. [Google Scholar] [CrossRef]
  17. Hurtt, G.C.; Frolking, S.; Fearon, M.G.; Moore, B.; Shevliakova, E.; Malyshev, S.; Pacala, S.w.; Houghton, R.A. The underpinnings of land–use history: Three centuries of global gridded land-use transitions, wood–harvest activity, and resulting secondary lands. Glob. Chang. Biol. 2006, 12, 1208–1229. [Google Scholar] [CrossRef]
  18. Kumar, S.; Merwade, V.; Rao, P.S.C.; Pijanowski, B.C. Characterizing Long–Term Land Use/Cover Change in the United States from 1850 to 2000 Using a Nonlinear Bi–analytical Model. AMBIO 2013, 42, 285–297. [Google Scholar] [CrossRef] [PubMed]
  19. Pongratz, J.; Reick, C.; Raddatz, T.; Claussen, M. A reconstruction of global agricultural areas and land cover for the last millennium. Glob. Biogeochem. Cycles 2008, 22. [Google Scholar] [CrossRef] [Green Version]
  20. Wulf, M.; Sommer, M.; Schmidt, R. Forest cover changes in the Prignitz region (NE Germany) between 1790 and 1960 in relation to soils and other driving forces. Landsc. Ecol. 2010, 25, 299–313. [Google Scholar] [CrossRef]
  21. García-Ayllón, S. Retro-diagnosis methodology for land consumption analysis towards sustainable future scenarios: Application to a mediterranean coastal area. J. Clean. Prod. 2018, 195, 1408–1421. [Google Scholar] [CrossRef]
  22. García-Ayllón, S. Predictive Diagnosis of Agricultural Periurban Areas Based on Territorial Indicators: Comparative Landscape Trends of the So-Called “Orchard of Europe”. Sustainability 2018, 10, 1820. [Google Scholar] [CrossRef]
  23. Wulf, M.; Rujner, H. A GIS–based method for the reconstruction of the late eighteenth century forest vegetation in the Prignitz region (NE Germany). Landsc. Ecol. 2011, 26, 153–168. [Google Scholar] [CrossRef]
  24. Bürgi, M.; Hersperger, A.M.; Hall, M.; Southgate, E.W.; Schneeberger, N. Using the past to understand the present land use and land cover. In A Changing World; Kienast, F., Wildi, O., Ghosh, S., Eds.; Springer: Cham, The Netherlands, 2007; pp. 133–144. [Google Scholar]
  25. He, F.N.; Li, S.C.; Zhang, X.Z. The reconstruction of cropland area and its spatial distribution pattern in the mid–northern Song dynasty. Acta Geogr. Sin. 2011, 66, 1531–1539. (In Chinese) [Google Scholar]
  26. Zeng, Z.Z.; Fang, X.Q.; Ye, Q. The Process of Land Cultivation Based on Settlement Names in Jilin Province in the Past 300 Years. Acta Geogr. Sin. 2011, 66, 985–993. (In Chinese) [Google Scholar]
  27. Yang, Y.Y.; Zhang, S.W.; Wang, D.Y.; Yang, J.C.; Xing, X.S. Spatiotemporal changes of farming-pastoral ecotone in Northern China, 1954–2005: A case study in Zhenlai County, Jilin Province. Sustainability 2014, 7, 1–22. [Google Scholar] [CrossRef]
  28. de Sherbinin, A. A Guide to Land-Use and Land-Use Cover Change (LUCC); A Collaborative Effort of SEDAC and the IGBP/IHDP LUCC Project; Columbia University: New York, NY, USA, 2002. [Google Scholar]
  29. Xie, R.Q.; Liu, F.M. Study on changes in landscape pattern of land use based on fractal theory-a case study of Zhenlai Town of Zhenlai County. Res. Soil Water Conserv. 2013, 20, 217–222. (In Chinese) [Google Scholar]
  30. Zhang, G.K.; Song, K.S.; Zhang, S.Q.; Liang, Y.H. The change of landscape pattern in Zhenlai Xian, Jilin Province in recent ten years. Acta Ecol. Sin. 2012, 32, 3958–3965. (In Chinese) [Google Scholar] [CrossRef]
  31. Cui, H.S.; Zhang, B.; Liu, X.N. Forecast of land desertification in northern Jilin province of China. J. Desert Res. 2004, 24, 235–239. (In Chinese) [Google Scholar]
  32. Geographical Names Committee Office of Zhenlai County. Zhenlai Gazetteer, Zhenlai County People’s Government; Geographical Names Committee Office of Zhenlai County: Baicheng, China. 1985. (In Chinese)
  33. He, F.; Li, M.; Li, S. Reconstruction of Lu-level cropland areas in the Northern Song Dynasty (AD976–1078). J. Geogr. Sci. 2017, 27, 606–618. [Google Scholar] [CrossRef]
  34. Fuchs, R.; Verburg, P.H.; Clevers, J.G.P.W.; Herold, M. The potential of old maps and encyclopaedias for reconstructing historic European land cover/use change. Appl. Geogr. 2015, 59, 43–55. [Google Scholar] [CrossRef]
  35. Liu, J.Y.; Liu, M.L.; Zhuang, D.F.; Zhang, Z.X.; Deng, X.Z. Study on spatial pattern of land-use change in China during 1995–2000. Sci. China 2003, 46, 374–384. [Google Scholar]
  36. He, Y.B.; Chen, Y.Q.; Tang, H.J.; Yao, Y.M.; Yang, P.; Chen, Z.X. Exploring spatial change and gravity center movement for ecosystem services value using a spatially explicit ecosystem services value index and gravity model. Environ. Monit. Assess. 2011, 175, 563–571. [Google Scholar] [CrossRef] [PubMed]
  37. Yang, Y.Y.; Liu, Y.S.; Li, Y.R.; Du, G.M. Quantifying spatio-temporal patterns of urban expansion in Beijing during 1985–2013 with rural-urban development transformation. Land Use Policy 2018, 74, 220–230. [Google Scholar] [CrossRef]
  38. Briassoulis, H. Analysis of Land Use Change: Theoretical and Modeling Approaches; West Verginia University: Morgantown, WV, USA, 2000. [Google Scholar]
  39. Goldewijk, K.K. Estimating global land use change over the past 300 years: The HYDE database. Glob. Biogeochem. Cycles 2001, 15, 417–433. [Google Scholar] [CrossRef]
  40. Ye, Q.L.; Wang, C.; Jiang, F.X.; Zhao, S.H. A farming radius-based research of clustering scale of pure agricultural rural households in hilly areas—A case study of Bailin Village, Shapingba district, Chongqing. J. Southwest Univ. Nat. Sci. Ed. 2013, 35, 1–8. (In Chinese) [Google Scholar]
  41. Qiao, W.F.; Wu, J.G.; Zhang, X.L.; Ji, Y.Z.; Li, H.B.; Wang, Y.H. Optimization of spatial distribution of rural settlements at county scale based on analysis of farming radius —Case study of Yongqiao district in Anhui province. Resour. Environ. Yangtze Basin 2013, 22, 1557–1563. (In Chinese) [Google Scholar]
  42. Jin, Q.M. Rural Settlement Geography; Science Press: Beijing, China, 1988. (In Chinese) [Google Scholar]
  43. Lambin, E.F.; Meyfroidt, P. Land use transitions: Socio-ecological feedback versus socio-economic change. Land Use Policy 2010, 27, 108–118. [Google Scholar] [CrossRef]
  44. Lv, Y.; Zhang, S.W.; Yang, J.C. Application of toponymy to the historic LUCC researches in Northeast China: Taking Zhenlai county of Jilin province as an example. J. Geo-Inf. Sci. 2010, 12, 174–179. (In Chinese) [Google Scholar]
  45. Lv, Y.; Zhang, S.W.; Yang, J.C. Reconstruct the spatial distribution of land use/land cover in the early reclaimed time of the western Jilin Province—Based on the GEOMOD model. J. Anhui Agric. Sci. 2015, 43, 304–308. (In Chinese) [Google Scholar]
  46. Fan, L.J. Immigration and Social Change in Modern Northeast China; Zhejiang University: Hangzhou, China, 2005. (In Chinese) [Google Scholar]
  47. Yang, Y.Y.; Zhang, S.W.; Yang, J.C.; Xing, X.S.; Wang, D.Y. Using a Cellular Automata–Markov Model to Reconstruct Spatial Land–Use Patterns in Zhenlai County, Northeast China. Energies 2015, 8, 3882–3902. [Google Scholar] [CrossRef]
  48. Yang, Y.Y.; Zhang, S.W.; Liu, Y.S.; Xing, X.S.; de Sherbinin, A. Analyzing historical land use changes using a Historical Land Use Reconstruction Model: A case study in Zhenlai County, northeastern China. Sci. Rep. 2017, 7, 41275. [Google Scholar] [CrossRef] [PubMed]
  49. Jie, D.M.; Wang, S.Z.; Guo, J.X.; Lv, J.F.; Li, J. Pollen combination and paleo-environment of Momoge Lake since 1500 years before. J. Appl. Ecol. 2004, 15, 575–578. [Google Scholar]
  50. Jackson, S.T.; Overpeck, J.T.; Webb-III, T.; Keattch, S.E.; Anderson, K.H. Mapped plant-macrofossil and pollen records of late Quaternary vegetation change in eastern North America. Quat. Sci. Rev. 1997, 16, 1–70. [Google Scholar] [CrossRef]
  51. Fritts, H.C.; Swetnam, T.W. Dendroecology: A tool for evaluating variations in past and present forest environments. Adv. Ecol. Res. 1989, 19, 111–189. [Google Scholar]
  52. Dahlström, A. Grazing dynamics at different spatial and temporal scales: Examples from the Swedish historical record A.D.1620–1850. Veg. Hist. Archaeobot. 2008, 17, 563–572. [Google Scholar] [CrossRef]
  53. Sugita, S. Pollen representation of vegetation in Quaternary sediments: Theory and method in patchy vegetation. J. Ecol. 1994, 82, 881–897. [Google Scholar] [CrossRef]
Figure 1. Location of the study area, Zhenlai County.
Sustainability 10 03940 g001
Figure 2. Advantages and constraints of reconstruction using historical documents.
Sustainability 10 03940 g002
Figure 3. Flow path of settlement data capture from the Zhenlai Gazetteer.
Sustainability 10 03940 g003
Figure 4. Farming radius calculated by (a) equalization-based method and (b) cultivation–settlement ratio-based method.
Sustainability 10 03940 g004
Figure 5. Cumulative curve of the number of villages.
Sustainability 10 03940 g005
Figure 6. Spatial distribution of settlements during 1875–1985.
Sustainability 10 03940 g006
Figure 7. Sketch map of movement of settlement gravity during 1875–1985.
Sustainability 10 03940 g007
Figure 8. Buffer area map with a 1092-m cultivation radius.
Sustainability 10 03940 g008
Figure 9. Distribution of arable land and settlements from topographic maps from the 1930s.
Sustainability 10 03940 g009
Figure 10. Overlapping arable land between buffer area and topographic map.
Sustainability 10 03940 g010
Figure 11. Cultivation and settlement ratio-based buffer area map.
Sustainability 10 03940 g011
Figure 12. Overlapping areas of buffer region and topographic maps.
Sustainability 10 03940 g012
Figure 13. Arable land reconstruction in 1932 based on settlement distribution and farming radius.
Sustainability 10 03940 g013
Figure 14. Overlap analysis map of buffer area and arable land area in the topographic maps.
Sustainability 10 03940 g014
Table 1. Attribute table generated from the Zhenlai Gazetteer.
Village NameYear of FoundingType of AgricultureEthnic GroupNumber of Households in the 1980sPopulation in the 1980sAdministrative Subordination
Baxizhao1875NomadismMongol74374Baxizhao village
Dongmoshihai1912Cultivation and grazingMongol105521Ximingga village
Erlongsuokou1898CultivationMongol112589Changfa village
Shuangyushu1909CultivationMongol51277Teli village
Houwulantu1899CultivationHan 142795Lixin village
……………………………………
Table 2. Distribution of settlements at different elevations.
Elevation (m)1875–19061907–19121913–19311932–19451946–1985
NP (%)NP (%)NP (%)NP (%)NP (%)
105.8–13021.01 10.63 00.00 00.00 510.64
130–1359648.48 7949.69 1922.89 1029.41 48.51
135–1409045.45 6641.51 5869.88 1750.00 2553.19
140–145105.05 138.18 67.23 617.65 919.15
145–18000.00 00.00 00.00 12.94 48.51
180–240.200.00 00.00 00.00 00.00 00.00
N, number; P, percentage.
Table 3. Distribution of settlements in different soil types.
Soil Type1875–19061907–19121913–19311932–19451946–1985
N P (%) NP (%)NP (%)NP (%)NP (%)
Alluvial soil73.54106.2900.0038.82817.02
Dark chestnut soil21.0100.0000.0000.001123.40
Marsh soil00.0000.0000.0000.0000.00
Peat soil00.0000.0000.0000.0000.00
Alkaline soil3919.703421.381821.69514.71510.64
Meadow soil5728.795031.451416.87720.591021.28
Aeolian sandy soil189.0995.6611.2000.0012.13
Chernozem7537.885635.225060.241955.881225.53
Total198100.00159100.0083100.0034100.0047100.00
N, number; P, percentage.
Table 4. Farming radius (R) in the administrative districts of Zhenlai County.
TownsCultivated Area (ha) 1Total Area of Administrative Region (ha)K (%) 2Settlement Area (ha) 1G2R (m) 2
Tantu16,79332,3320.519106158.701014.98
Ganshigen967031,9580.30392105.591009.12
Daobao696019,4780.35718537.60787.79
Zhenlai19,34439,4960.49086222.451121.80
Hatuqi Mongol Ethnic Township420315,3290.27434122.03698.86
Momoge Mongol Ethnic Township10,48548,4080.21714373.331241.96
Jianping18,85376,8840.245129146.481529.55
Dongping829940,5090.20512964.211136.10
Heiyupao19,70758,5500.337147134.111365.86
Wukeshu990648,5470.20417855.711243.76
Datun835545,1070.18525732.541198.90
Yanjiang731935,8540.2049081.691068.88
Zhennan Sheep Breeding Farm281832,3320.5193386.341014.98
1 Cultivated area and settlement area are calculated from the topographic maps from the 1930s. 2 K is the ratio of cultivated land according to the area of administrative region; G is the ratio of cultivated land and rural settlement; R is the farming radius.
Table 5. Comparison of buffer distance and farmland area based on equalization and cultivation–settlement ratio calculations.
MethodActual Farmland Area (ha)Buffer Radius (m)Buffer Area (ha)Farmland Area within Buffer Area (ha)Ratio between Farmland Area in Buffer Area and Actual Farmland Area (%)
Equalization-based143,744.761092143,74972,301.1250.30%
Cultivation–settlement ratio-based R = G J K π 157,19977,380.3753.83%

