Article

Cracking, Bond, and Durability Performance of Internally Cured Cementitious Grouts for Prefabricated Bridge Element Connections

by
Igor De la Varga
1,*,
Robert P. Spragg
1,
José F. Muñoz
1,
Michelle A. Helsel
2 and
Benjamin A. Graybeal
3
1
SES Group & Associates, 6300 Georgetown Pike, McLean, VA 22101, USA
2
The Washington Center STIPDG from University of Illinois at Urbana-Champaign, Champaign, IL 61820, USA
3
U.S. Federal Highway Administration, 6300 Georgetown Pike, McLean, VA 22101, USA
*
Author to whom correspondence should be addressed.
Sustainability 2018, 10(11), 3881; https://doi.org/10.3390/su10113881
Submission received: 27 September 2018 / Revised: 22 October 2018 / Accepted: 23 October 2018 / Published: 25 October 2018
(This article belongs to the Special Issue Sustainable Cementitious Materials for the Construction Industry)

Abstract

:
The use of cementitious grouts in prefabricated bridge element (PBE) connections is a common practice in the USA. Given the important role that these connections play within the infrastructure, the grout materials used must provide good flowability, mechanical and durability properties, low shrinkage, and good bond to the precast concrete element. However, this type of grout material has shown serviceability issues in the form of volume instabilities (primarily shrinkage). The inclusion of internal curing (IC) in cementitious grouts with the goal of reducing shrinkage has been successfully demonstrated in a previous study. The research presented in this paper extends upon that prior study and assesses the IC effect on properties relevant to PBE grout connections. The paper uses novel experimental techniques such as the dual ring test, formation factor concepts, and microstructural analysis to evaluate improvements in cracking, bond, and durability performance. The results show that, while the IC grouts did not alter the bond performance, they improved their cracking and durability properties. The inclusion of IC in cementitious grouts is presented here as a strategy to increase the durability and thus sustainability of bridge structures.

1. Introduction

The interest in using prefabricated bridge elements (PBEs) in accelerated bridge construction (ABC) projects has increased in recent years in the U.S. [1,2]. These elements are typically of high quality since they are often produced off-site under controlled temperature and humidity conditions prior to bridge construction. The elements are then transported to the jobsite for assembly using cast on-site grout-like materials, with the most common made from cementitious materials (i.e., cementitious grout). The grout materials connecting PBEs must readily flow into narrow openings between reinforcing steel (Figure 1a), while being strong and durable since the connections can be the weakest points of the infrastructure [3]. However, previous studies have reported serviceability and constructability concerns in the form of material volume instabilities (primarily shrinkage) [4,5]. PBE connection materials are typically designed to expand to counteract shrinkage; hence, they are referred to as ‘non-shrink’ grouts. However, after the initial expansion, they exhibit autogenous shrinkage, attributed to chemical shrinkage in cementitious materials. This results in a low net volume change where the absolute values of expansion and shrinkage must be added to return the total amount of volume change. Excessive shrinkage may not only cause premature material degradation in the form of cracking (Figure 1b), but also loss of bond to the precast element and the consequent ingress of deleterious agents (e.g., chlorides) through the grout-concrete interface. In other words, without the proper material performance characteristics, premature structural failures may occur at the PBE connections; thereby reducing infrastructure service life.
A conventional and effective means to overcome shrinkage concerns in cementitious materials is using internal curing (IC). Internal curing is a technology that consists of curing the material from the inside rather than applying conventional (external) curing, thus providing a longer and more efficient curing effect (Figure 2) [6]. A considerable number of research studies show the benefits of IC in concrete both in laboratory and field conditions [7,8,9,10,11,12,13,14]. The IC mechanism consists of the inclusion of highly porous agents (e.g., light-weight aggregates, wood fibers, super-absorbent polymers) in the mixture design that releases curing water at the appropriate time, generally when a negative pressure occurs in the matrix (i.e., after set) [7]. In conventional concretes, fine light-weight aggregates (LWA) are used most often, which typically replace the same volume fraction of fine normal-weight aggregates.
A previous study presented the inclusion of IC in cementitious grouts to reduce or even mitigate shrinkage [15]. The study described challenges experienced when designing internally cured cementitious grouts compared to conventional concretes, and their general performance in terms of fresh, mechanical, and shrinkage properties compared to non-internally cured grouts. The study demonstrated that IC efficiently reduces shrinkage in this type of material, only minimally compromising the fresh workability properties of the grout. The study also proved that the inclusion of IC in cementitious grouts decreases the initial unit cost of the grout material since the solid fraction replaced by LWA is typically more expensive than the LWA.
Given the potential benefits that the inclusion of IC might provide in cementitious grouts used as PBE connections, the team decided to extend upon the prior study and perform additional tests to assess the IC effect on properties relevant to PBE grout connections, namely cracking propensity, interfacial bond, and durability. This paper uses novel experimental techniques such as the dual ring test [16,17], formation factor concepts [18,19], and microstructural analysis to evaluate improvements in performance. These techniques help investigate how IC may lead to more robust and longer-lasting PBE connections. The inclusion of IC in cementitious grouts is then presented here as a strategy to increase the durability and thus sustainability of bridge structures.

2. Materials

A commercially-available ‘non-shrink’ cementitious grout was used in the study. The grout was supplied in 23-kg bags containing the solid fraction (e.g., cementitious materials, additives, and fine aggregates) that was mixed with a certain amount of water following the manufacturer’s recommendations to obtain an average flow of 100% per ASTM C1437-15 [20]. The grout required a water-to-solids ratio (w/s) of 0.16 by mass. Due to the proprietary nature of the material, it is not possible to know the exact composition, and thus the water-to-cement (w/c) or water-to-binder (w/b) ratios. According to different grout manufacturers, a common cementitious content in grouts is about 30%. In fact, this was corroborated by the authors via petrographic analysis, where the inert and reactive materials were quantified by a technique that uses a polarized light microscope to differentiate between crystalline and amorphous materials. Therefore, a w/b of about 0.50 can be estimated in this material.
Fine LWA was used for providing IC in the cementitious grout. The IC agent consisted of rotatory kiln expanded shale with a specific (dry) gravity of 1.56, a 4-h and 72-h water absorption of 14.1% and 19.3% by dry mass, respectively, and desorption of 96% when exposed to a slurry of KNO3 with a controlled relative humidity of 94% at 23 °C, as per ASTM C1761-17 [21]. The median particle size of the LWA particles was 0.9 mm, as reported by the manufacturer.
For the execution of the bond tests, a concrete substrate was prepared using an ordinary portland cement, ASTM C150-16 Type I/II [22], with a Blaine fineness of 382 m2/kg, and a density of 3070 kg/m3. The fine aggregate (FA) used in the concrete was ordinary river sand with an apparent specific gravity of 2.59. The coarse aggregate (CA) consisted of dolomitic limestone with an apparent specific gravity of 2.85. The concrete mixture was developed to perform similarly to a prefabricated concrete element in terms of strength. Therefore, the concrete was designed with a water-to-cement ratio (w/c) of 0.35 by mass, cement:FA:CA ratio of 1:1.7:2.5 (by mass), a minimum slump of 76 mm (achieved by using a high-range water reducer), and a 28-day compressive strength of 55 MPa.

3. Experimental Methods

3.1. Grout Mixtures Preparation

The preparation of the “Control” grout (without IC) consisted of mixing the grout dry components with the proper amount of water in a medium-sized benchtop mixer according to ASTM C1107 [23]. For mixture proportioning with IC, the amount of IC water needed was determined according to the procedure described by Bentz et al. which is based on the chemical shrinkage occurring in the sample [24]. The chemical shrinkage of the cementitious grout was measured over a 28-day period using the ASTM C1608-17 standard test method [25], and resulted in an extrapolated infinite value of 0.035 g water/g dry grout. Note that this value is lower than that of conventional concrete because the value is normalized by the total amount of dry grout material. If the value was normalized by the amount of reactive material in the grout (about 30%), it would increase to about 0.12 g water/g reactive grout, which is more similar to conventional concretes with cementitious materials. The amount of LWA used to generate sufficient IC was calculated from the IC water needed, using the LWA absorption values [24]. In conventional IC concretes, LWA are commonly incorporated in a prewetted condition. However, the prepackaged grout components must remain in dry conditions until mixing, preventing the introduction of prewetted LWA to the package. The ideal situation involves adding the proper amount of dry LWA into the bag containing the dry constituents. In this paper, two situations were evaluated:
(1)
Prewetted conditions (as in conventional concrete applications), where the LWA were soaked in water for 72 h (thus using the 72-h absorption value for the LWA amount calculation), premixed with the grout dry components, and mixed in a medium-sized benchtop mixer according to ASTM C1107. The amount of soaking water equals the mixing and IC water. These specimens are labelled as “LWA (prewetted)” throughout the paper.
(2)
LWA were added in oven-dry conditions, where the amount of LWA in this case was calculated using the 4-h absorption value since it is assumed that the LWA particles would only absorb water during the grout fresh stage (that is, before set), which in this case is about 4 h. The oven-dry LWA was premixed with the grout dry components. Extra water based on the 4-h absorption was added to the mixing water and all ingredients were mixed in a medium-sized benchtop mixer according to ASTM C1107. These specimens are labelled as “LWA (OD)” throughout the paper.
Contrary to designing conventional concretes with IC, the IC agent is added “on top” of the ordinary mixture proportions of the grout, thus altering the volume fractions in the mixtures with IC vs. the Control grout prepared without IC. In the LWA (prewetted) mixture, the prewetted LWA particles occupied about 19% of the total volume; whereas the LWA particles occupied about 25% of the total volume in the LWA (OD) mixture. The difference in the volume fractions corresponds to the different LWA absorption capabilities at 4 h and 72 h. It is recognized that these changes in the mixture volume fractions with respect to the Control grout would be expected to influence some of the paste-dependent material properties such as mechanical, shrinkage, cracking, and durability. The reduction in the paste volume fraction of the grout material would also contribute to the production of a more sustainable material with less cementitious materials content. Table 1 shows the mixture proportions of the grouts prepared in the study.

3.2. General Performance: Fresh, Mechanical, and Shrinkage Properties

A set of material properties were measured in the cementitious grout with and without IC. Fresh grouts were evaluated for flow using a flow table as per ASTM C1437-15 [20], fresh density via mass measurements of a 400-mL volumetric cup according to ASTM C185-15 [26], and setting time using a Vicat needle as described in ASTM C191-18 [27]. Additionally, specimens were prepared to measure compressive and tensile strength, as well as elastic properties (i.e., Young’s modulus). These measurements were performed on cylinders with a 102-mm diameter and 203-mm height according to ASTM C39-18 [28], ASTM C496-17 [29], and ASTM C469-14 [30], respectively. The specimens were stored in sealed (bagged) conditions at 23 ± 1 °C prior to testing. The sealed curing condition is preferred in order to properly assess the IC effect since other variables affecting the curing process such as drying or soaking can be neglected.
Autogenous (sealed) and drying shrinkage deformations were measured according to ASTM C157-17 [31] using 25 mm by 25 mm by 286 mm prismatic specimens. While all specimens were stored in an environmental chamber at 23 ± 0.2 °C and a relative humidity of 50 ± 3%, specimens for autogenous shrinkage assessment were sealed with two layers of aluminum tape after removal from the molds at 24 h. Length change and mass measurements were conducted weekly for the first month and once every month thereafter. Since length change measurements cannot be performed before demolding the specimens at 24 h, autogenous deformations were measured during the first 24 h using the method described in ASTM C1698-09 [32], also known as the “corrugated tube test”. The measured 24-h autogenous deformation was added to the autogenous and drying deformation results obtained from the ASTM C157-17 method.

3.3. Cracking Assessment

Cracking propensity was assessed using a dual ring test (DRT) [16]. An AASHTO specification describing this test has recently been developed [17]. The DRT consists of two Invar steel concentric rings that allow for the measurements of both shrinkage and expansion with approximately a 72% degree of restraint. The DRT operates by casting a 38-mm thick annulus of grout between the two restraining rings. The temperature of the test was controlled by placing copper tubing coil that is connected to a water/ethyl-glycol system on both the top and bottom of the rings and sample. Due to the low coefficient of thermal expansion of the Invar rings, the DRT has the ability to retain a stable degree of restraint over varying temperatures. The rings, sample, and temperature control coil were sealed in a heavily insulated chamber. The temperature of the water/ethyl-glycol mixture was controlled through an external water bath. The rings were instrumented with four equally spaced Invar strain gages that measure the strain developed in the inner and outer restraining rings. Thermocouples were also used to measure the rings and sample temperature. A data acquisition system was set up so that the strain and temperature of the rings were recorded every 30 s. Figure 3 shows the complete setup. The recorded strains were used to calculate the residual stress accumulation in the sample [16,17]. The induced stresses from temperature changes can be used to show the stress reserve capacity and determine how near the specimen is to cracking. In this study, isothermal conditions at 23 ± 0.1 °C were maintained for 7 days, at which time the temperature was reduced at a rate of 2 °C/h down to −21 °C to induce cracking in the material.

3.4. Tensile Bond Strength and Microstructural Analysis

Tensile bond strength tests were performed according to the ASTM C1583-13 test method [33], also known as the “pull-off” test. The test specimen consisted of a 305 mm by 305 mm by 102 mm concrete slab cured for 7 days at 23 ± 0.2 °C and a relative humidity of 80 ± 3%. Prior to the grout overlay pour, the top surface of the concrete slab was sandblasted to provide a degree of surface roughness comparable to that of an International Concrete Repair Institute (ICRI) CSP-5 surface profile chip [34]. A 51-mm thick grout overlay was cast over the sandblasted surface of the concrete slab so that an interface between the two materials was created. The concrete-grout slab was then cured for an additional 7 days prior to executing the pull-off bond tests. In this test, a 51-mm diameter steel disc was glued on the top surface of the grout overlay. The test specimen is formed by partially drilling a core perpendicular to the surface, and penetrating down into the concrete material, approximately 25 mm below the concrete-grout interface. A tensile load was applied to the steel disc at a constant rate of 35 kPa/s ± 15 kPa/s until failure occurred. The failure load and the failure mode were recorded and the nominal tensile stress could thus be calculated. Four pull-off tests were conducted for each type of overlay.
Following the pull-off tests, intact 50-mm diameter concrete-grout cores were extracted from the slab specimens to analyze the concrete-grout interface. These cores were used to prepare 45 mm by 20 mm specimens for microstructural analysis (MSA) following the procedure described by De la Varga et al. [35]. The MSA was conducted using backscattering image analysis conducted on a FEI Quanta 650 (Certain commercial equipment and software are identified to describe the subject adequately. Such identification does not imply recommendation or endorsement by FHWA or SES Group & Associates, nor does it imply that the equipment identified is necessarily the best available for the purpose.) scanning electron microscope (SEM) equipped with a concentric backscatter detector. The microscope operated under high vacuum at 15 KV and with a 10-mm working distance. Large backscatter electron (BSE) mapping areas at a magnification of 1500× were collected using Aztec 2.4 EDS microanalysis software. Four of these BSE maps were required to cover the entire surface of the interface (62.5 mm2).
The distribution of porosity, fine sand particles, and unhydrated cement particles along the grout side of the interface were analyzed using consecutive 10-μm-wide bands, starting from the location of the concrete substrate. This process covered a 100-μm region in the grout side that is recognized to properly represent the concrete-grout interfacial transition zone (ITZ) [35,36,37,38]. The same approach was successfully applied to characterize other interfacial transition zones in cement-based materials [36]. The quantitative analysis of the distribution of the above-mentioned phases of interest along the interface was performed using ImageJ 1.49j software. Specific details of this quantitative image analysis method are described by the authors elsewhere [35,39]. The lowest detectable pore size (1.3 μm) was dictated by the pixel size at the 1500× magnification which was 0.6 μm by 0.6 μm [40]. Herein, pores ranging from 1.3 to 40 μm were considered capillary pores, and those bigger than 40 μm were considered as voids. This limit of 40 μm was selected based on the range of pore sizes observed in these types of interfaces [35].

3.5. Durability

Durability evaluation focused on two main transport mechanisms: fluid absorption and ionic diffusion. Fluid absorption was conducted using a water absorption test, similar to that described in ASTM C1585-13 [41]. After casting and sealed curing for a period of 28 days, six 100 mm diameter discs with a height of 50 mm were cut from standard cylinders for each mixture. Three discs were oven dried and vacuum saturated at an absolute pressure of 6 torr to determine the moisture content at saturation, M C s a t . Three additional specimens were conditioned immediately after cutting at 23 ± 0.2 °C and 50 ± 3% relative humidity for a period of 2 weeks. These three specimens were wrapped with aluminum tape around the circumference and the top surface was covered with plastic and taped to prevent excessive drying. Each specimen was measured to determine the initial mass, m 0 . The exposed face was placed into a small amount of water, and mass measurements, m, were conducted at a series of time intervals, m . After 8 days of testing, the specimens were oven dried to determine an oven dry mass, m o d . At the time of each mass measurement, the degree of saturation S was determined using Equation (1). The degree of saturation can be plotted against the square root of time, with bi-linear behavior predicted [42]. The slopes of the two linear portions are termed primary and secondary rate of absorption.
S = ( m m 0 ) / m o d M C s a t ,
The portion of testing corresponding to diffusion evaluation used a procedure termed the Cylinder Absorption Test (CAT) which uses electrical resistivity measurements to determine the formation factor of the mixtures. The formation factor is a material property that can be used to quantify the pore network, can be related to the diffusion coefficient [18,19,43,44,45] and other transport mechanisms [46,47,48], and can be used to estimate the life-cycle of concrete elements [49,50]. Three 102 mm diameter by 204 mm height cylinders from each mixture were made. At an age of 1 day, the specimens were demolded and submerged in an artificial pore solution consisting of super-saturated Ca(OH)2 and 0.54 M NaOH, which has a resistivity of 0.1 Ω·m ( ρ s = 0.1 Ω·m). The specimens were stored and cured in this solution. At the specified testing age, the specimens were removed from the solution, surface dried with a damp towel, and the uniaxial resistivity, ρ , was measured according to Section 10 of AASHTO TP119-15 [51]. The formation factor (F) was determined at each age according to Equation (2):
F = ρ ρ o ,
where ρ o is the pore solution resistivity. The major assumption with the CAT procedure is that the pore solution resistivity is the same as the resistivity of the storage solution, i.e., ρ o = ρ s = 0.1 Ω·m. This assumption seems reasonable, as the pore solution is likely similar to this solution based on the average of a wide-range of North American cementitious materials [52], and the volume of storage solution is nearly 10 times larger than the amount of pore solution in the sample.

4. Results and Discussion

4.1. General Performance: Fresh, Mechanical, and Shrinkage Properties

Although the main goal of this paper is to assess the bond, cracking, and durability properties of grouts with and without IC, some of the fresh, mechanical, and shrinkage properties were also included in the study, given their relevance to end users, and at the same time they can be useful to explain the cracking response of these materials. Table 2 summarizes the fresh and mechanical properties of the Control and internally cured grouts. As observed in other studies [15], fresh flow is reduced by 25% when including the LWA particles in the grout material, regardless of their moisture conditions (prewetted vs. OD). This reduction is explained by the change in total paste volume along with a modification of the initial grout particles gradation when adding the coarser LWA particles, with a reported median size of 0.9 mm. Given the desire for good flow properties of cementitious grouts, rheological studies are currently being performed to better understand the main effect that the inclusion of LWA particles has on the yield stress and plastic viscosity. Understanding the rheology of these materials could better address flow concerns in the field, if any. Additionally, while fresh density is reduced by about 10% due to both the presence of lower density particles in the mixture and the additional IC water added to the mixtures, setting times are practically unaltered, with only a slight retardation that might be due to the additional IC water added to the mixtures. In any case, these small changes in setting should not compromise any activity in the field regarding workability time.
Table 2 also shows that the compressive strength of both LWA mixtures is about 30% lower than that of the Control at all ages. This reduction is attributed to the reduction in paste volume as well as the presence of highly porous aggregates, among other reasons [53,54]. It is expected though that the strength increases at later ages due to the additional hydration provided by IC, as observed in other studies [7,10]. In any case, and despite the strength reduction in the internally cured grouts, the compressive strength results obtained remain above the limits stated in the ASTM C1107-17 standard [23] for cementitious grouts acceptance. The tensile strength and modulus of elasticity results become relevant when interpreting the cracking behavior of these mixtures (see section on cracking below). It is observed that both tensile strength and modulus of elasticity are consistently lower than the Control mixture by about 25% at all ages, again attributed to the reduction in paste volume, which is reduced by 19% and 24% in the LWA (prewetted) and LWA (OD) mixtures, respectively.
Figure 4 shows the autogenous and drying deformations measured over the period of three months. The curves were ‘zeroed’ at the 1-day deformations measured in the corrugated tubes test (that is, considering the initial expansions typically observed in this type of grout material). The Control grout exhibited 3-month total autogenous shrinkage values of about 500 µε, compared to about 150–200 µε of shrinkage observed in both LWA grouts. As a reminder, when evaluating the risk of shrinkage cracking, the net difference between the maximum and minimum deformations achieved during the test should be considered [55]. The reduction in autogenous shrinkage when adding IC was significant, and is mainly attributed to a combination of two effects: (1) reduction of the self-desiccation that accompanies chemical shrinkage [7,56], and (2) reduction of the paste volume fraction.
The measured total deformations (including drying) were about 1000 µε larger than the autogenous shrinkage results in each of the grouts, due to the additional shrinkage effect in drying conditions. The addition of IC partially reduced drying shrinkage with respect to the Control. The Control grout exhibited 3-month total drying shrinkage values of about 1400 µε, compared to about 900–1000 µε for both LWA mixtures. This reduction, while not considerable, might be sufficient to improve the cracking response of these materials. Drying shrinkage is mainly driven by the water content in the material: more water, more drying [57,58]. This is the case for cementitious grouts, where the w/s ranges from 0.15 to 0.20, thus having an effective water-to-cementitious materials mass ratio (w/cm) that would range from 0.50 to 0.60. This makes questionable the practice of labelling this type of materials as “non-shrink”.
Nevertheless, in both autogenous and drying cases, the important effect that IC has on the measured shrinkage was observed during the first days, when the material is still developing its mechanical properties to sustain any shrinkage cracking (i.e., tensile strength). The reduction was about 100% and 30% over the first 14 days for the autogenous and drying deformations, respectively, when compared to the Control.

4.2. Cracking Assessment

In unrestrained conditions, PBE grout connections undergo volume changes freely without inducing significant stress in the material. However, the material is commonly connected to other stationary elements (e.g., reinforcement bars, precast concrete elements) that do not experience the same volume change, thus limiting its volume changes. The DRT used in this study was designed to subject the material to a 72% degree of restraint, commonly experienced in reinforced concrete bridge decks whose free movement is restraint by reinforcement and elements of the structural system (e.g., piers, caps). This particular degree of restraint in the DRT is similar to that of the commonly used single ring test described in ASTM C1581 [59]. High degrees of restraint should induce cracking in certain conditions, causing both strength and durability issues. Figure 5 shows the residual stress generated in the material when tested with the DRT for 7 days under sealed isothermal conditions of 23 ± 0.01 °C. The stresses were calculated from the strains measured on both inner and outer rings, and using the equations described in the AASHTO standard and other documents [16,17]. The residual stresses were zeroed at the materials time of set.
As observed, the Control grout did not develop any substantial internal stress during the first 5 days, and slightly increased to a tensile stress of about 0.5 MPa before the temperature in the DRT was intentionally reduced to induce cracking in the material. In contrast, both LWA (prewetted) and LWA (OD) mixtures developed compressive stresses of almost 2 MPa and 1 MPa during the first 7 days of testing, respectively. This is mainly due to the expansive effect of IC in autogenous (sealed) conditions, as shown in the shrinkage results in Figure 4. Once the temperature was decreased at a rate of 2 °C/h, the Control grout cracked when the material reached a temperature of about −3 °C and a tensile stress of 4.8 MPa. Cracking was indicated by a sudden drop in the stress reading. Both LWA mixtures did not crack even after reaching a temperature of −21 °C and tensile stresses of about 4.8 MPa. By calculating the absolute stress difference at the beginning and end of the temperature drop, the stress reserve capacity of the materials was estimated (that is, how near the materials are from cracking). While the Control grout depicted a total stress reserve capacity of about 4.4 MPa, the LWA (prewetted) and LWA (OD) grouts exhibited a minimum stress reserve capacity of 6.5 MPa and 4.9 MPa, respectively.
The improvements observed in the cracking behavior of the internally cured grouts can be explained by a combination of two factors. First, the LWA mixtures contain less paste which makes them less ‘shrinking’ materials. Second, the LWA mixtures exhibited a 25% reduction in the modulus of elasticity compared to the Control grout (Table 2). A less stiff material tends to relax internal stresses more efficiently [60], thus reducing cracking propensity. It is worth mentioning that the maximum tensile stress achieved by each of the grouts when dropping the temperature does not correspond to the tensile strength measured and reported in Table 2. The type of stress developed in the DRT is radial, rather than the linear stress normally observed in split tensile testing.
Therefore, the stress reserve capacity viewpoint demonstrates a beneficial effect of including IC in grouts. However, it is conjectured that the benefits might be larger at temperature and humidity conditions different from those tested. As already mentioned, these grouts are designed to have a high w/cm (about 0.50 to 0.60), which makes them less prone to autogenous shrinkage cracking [61]. This reasoning may explain the fine performance of the Control grout in the DRT, showing slight stress development during the isothermal stage. However, if these materials were tested using the DRT in more realistic drying humidity conditions (e.g., 50% relative humidity), a larger stress development in the materials would be expected due to the high w/cm, and IC could then be even more beneficial. Additionally, the thermal gradient typically observed in field-cast cementitious materials due to the exothermic hydration reaction would be larger in the Control grout because of its higher paste volume compared to the internally cured grouts, which could be translated into more internal stresses being developed. Both of these cases are currently being investigated.

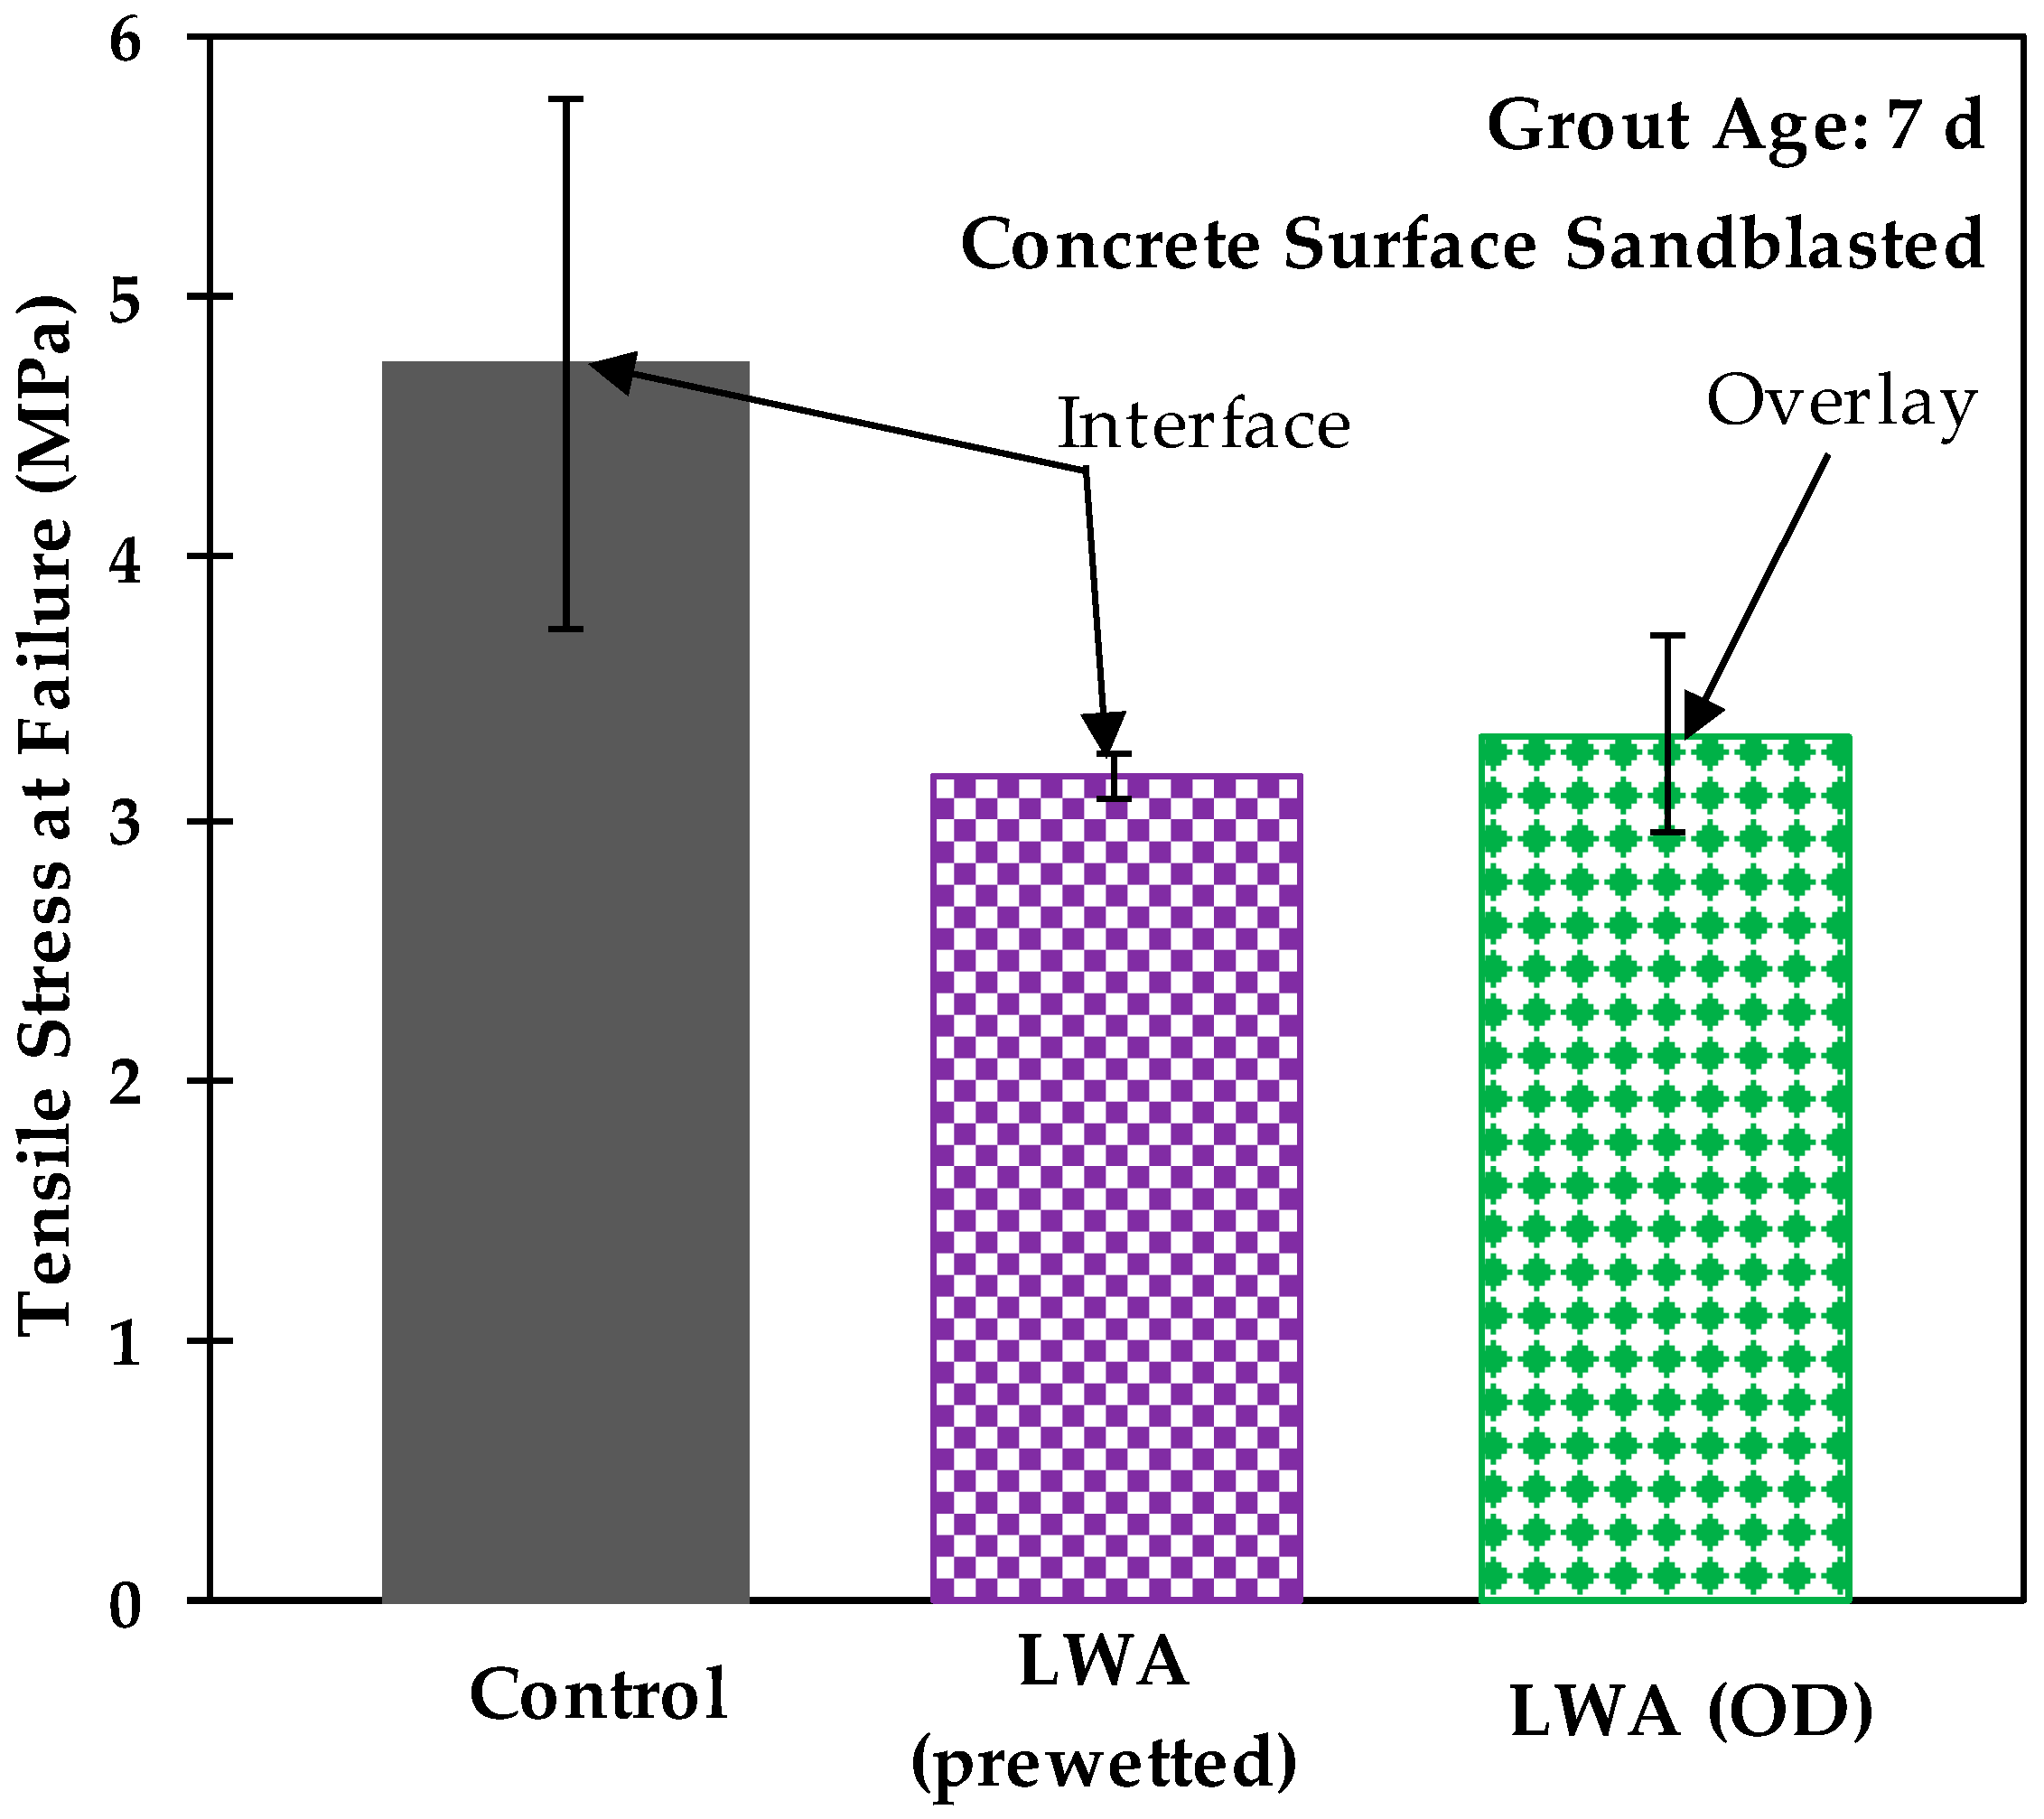
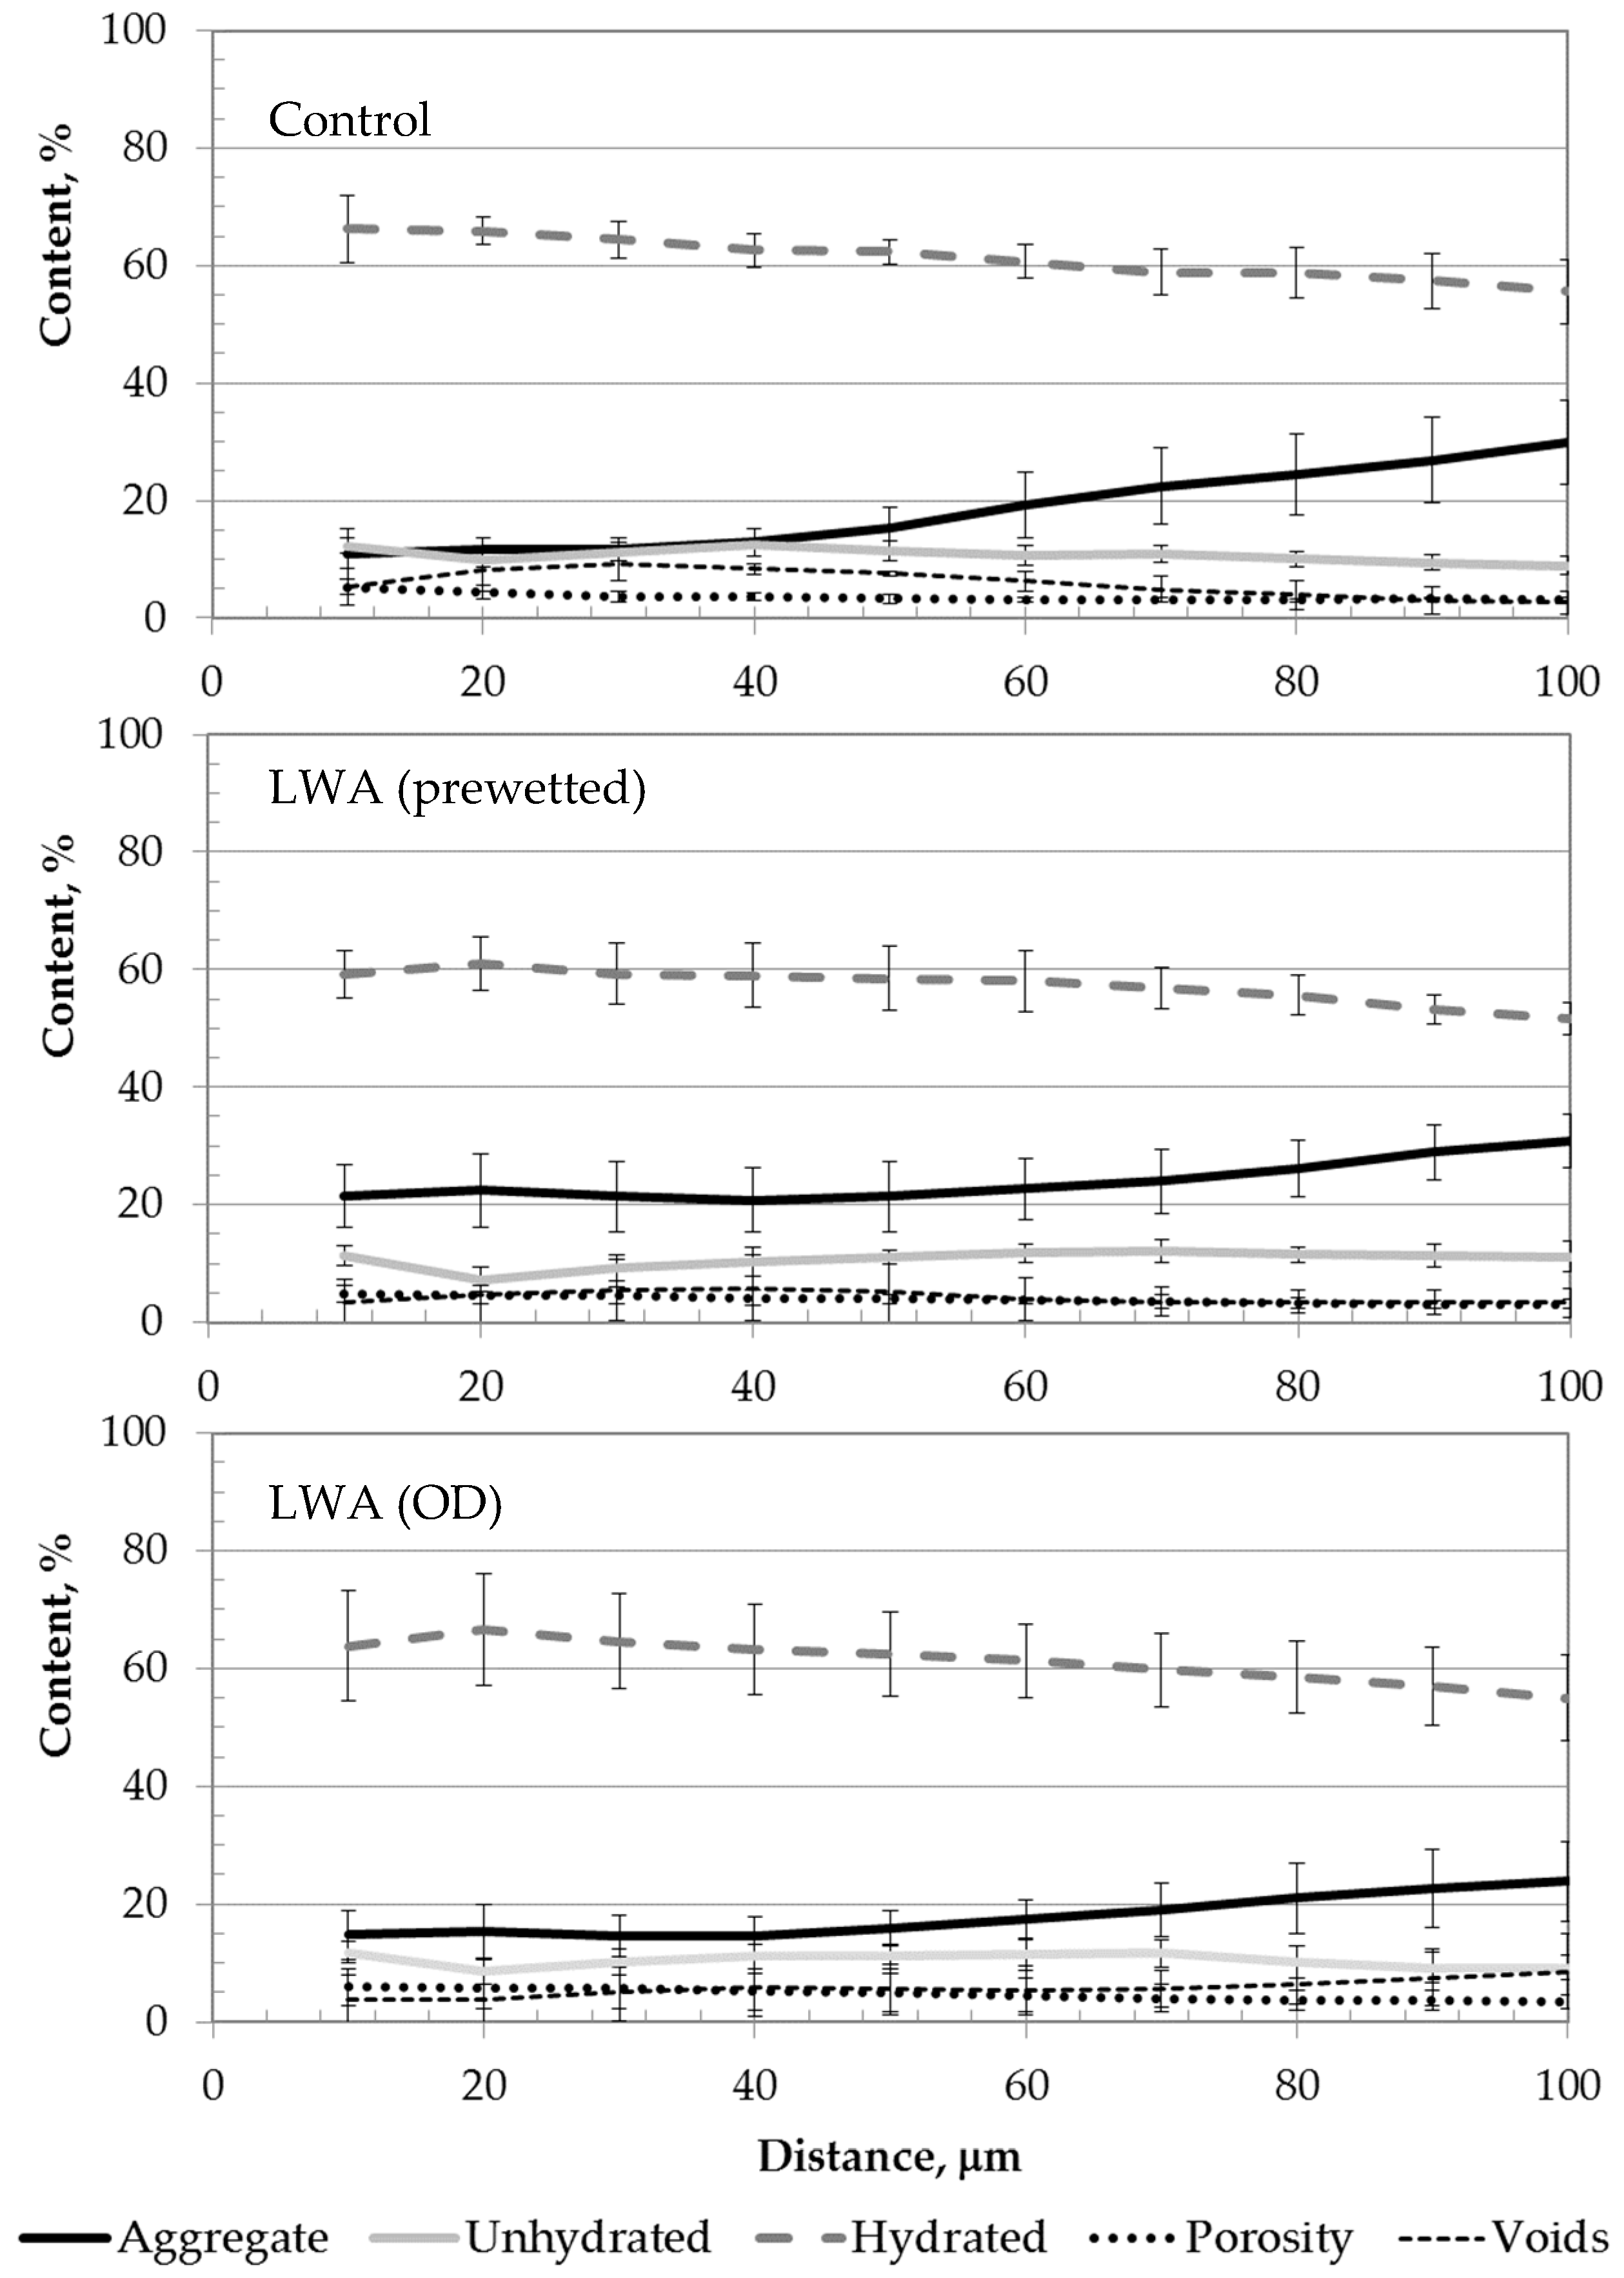
4.3. Tensile Bond Strength and Microstructural Analysis
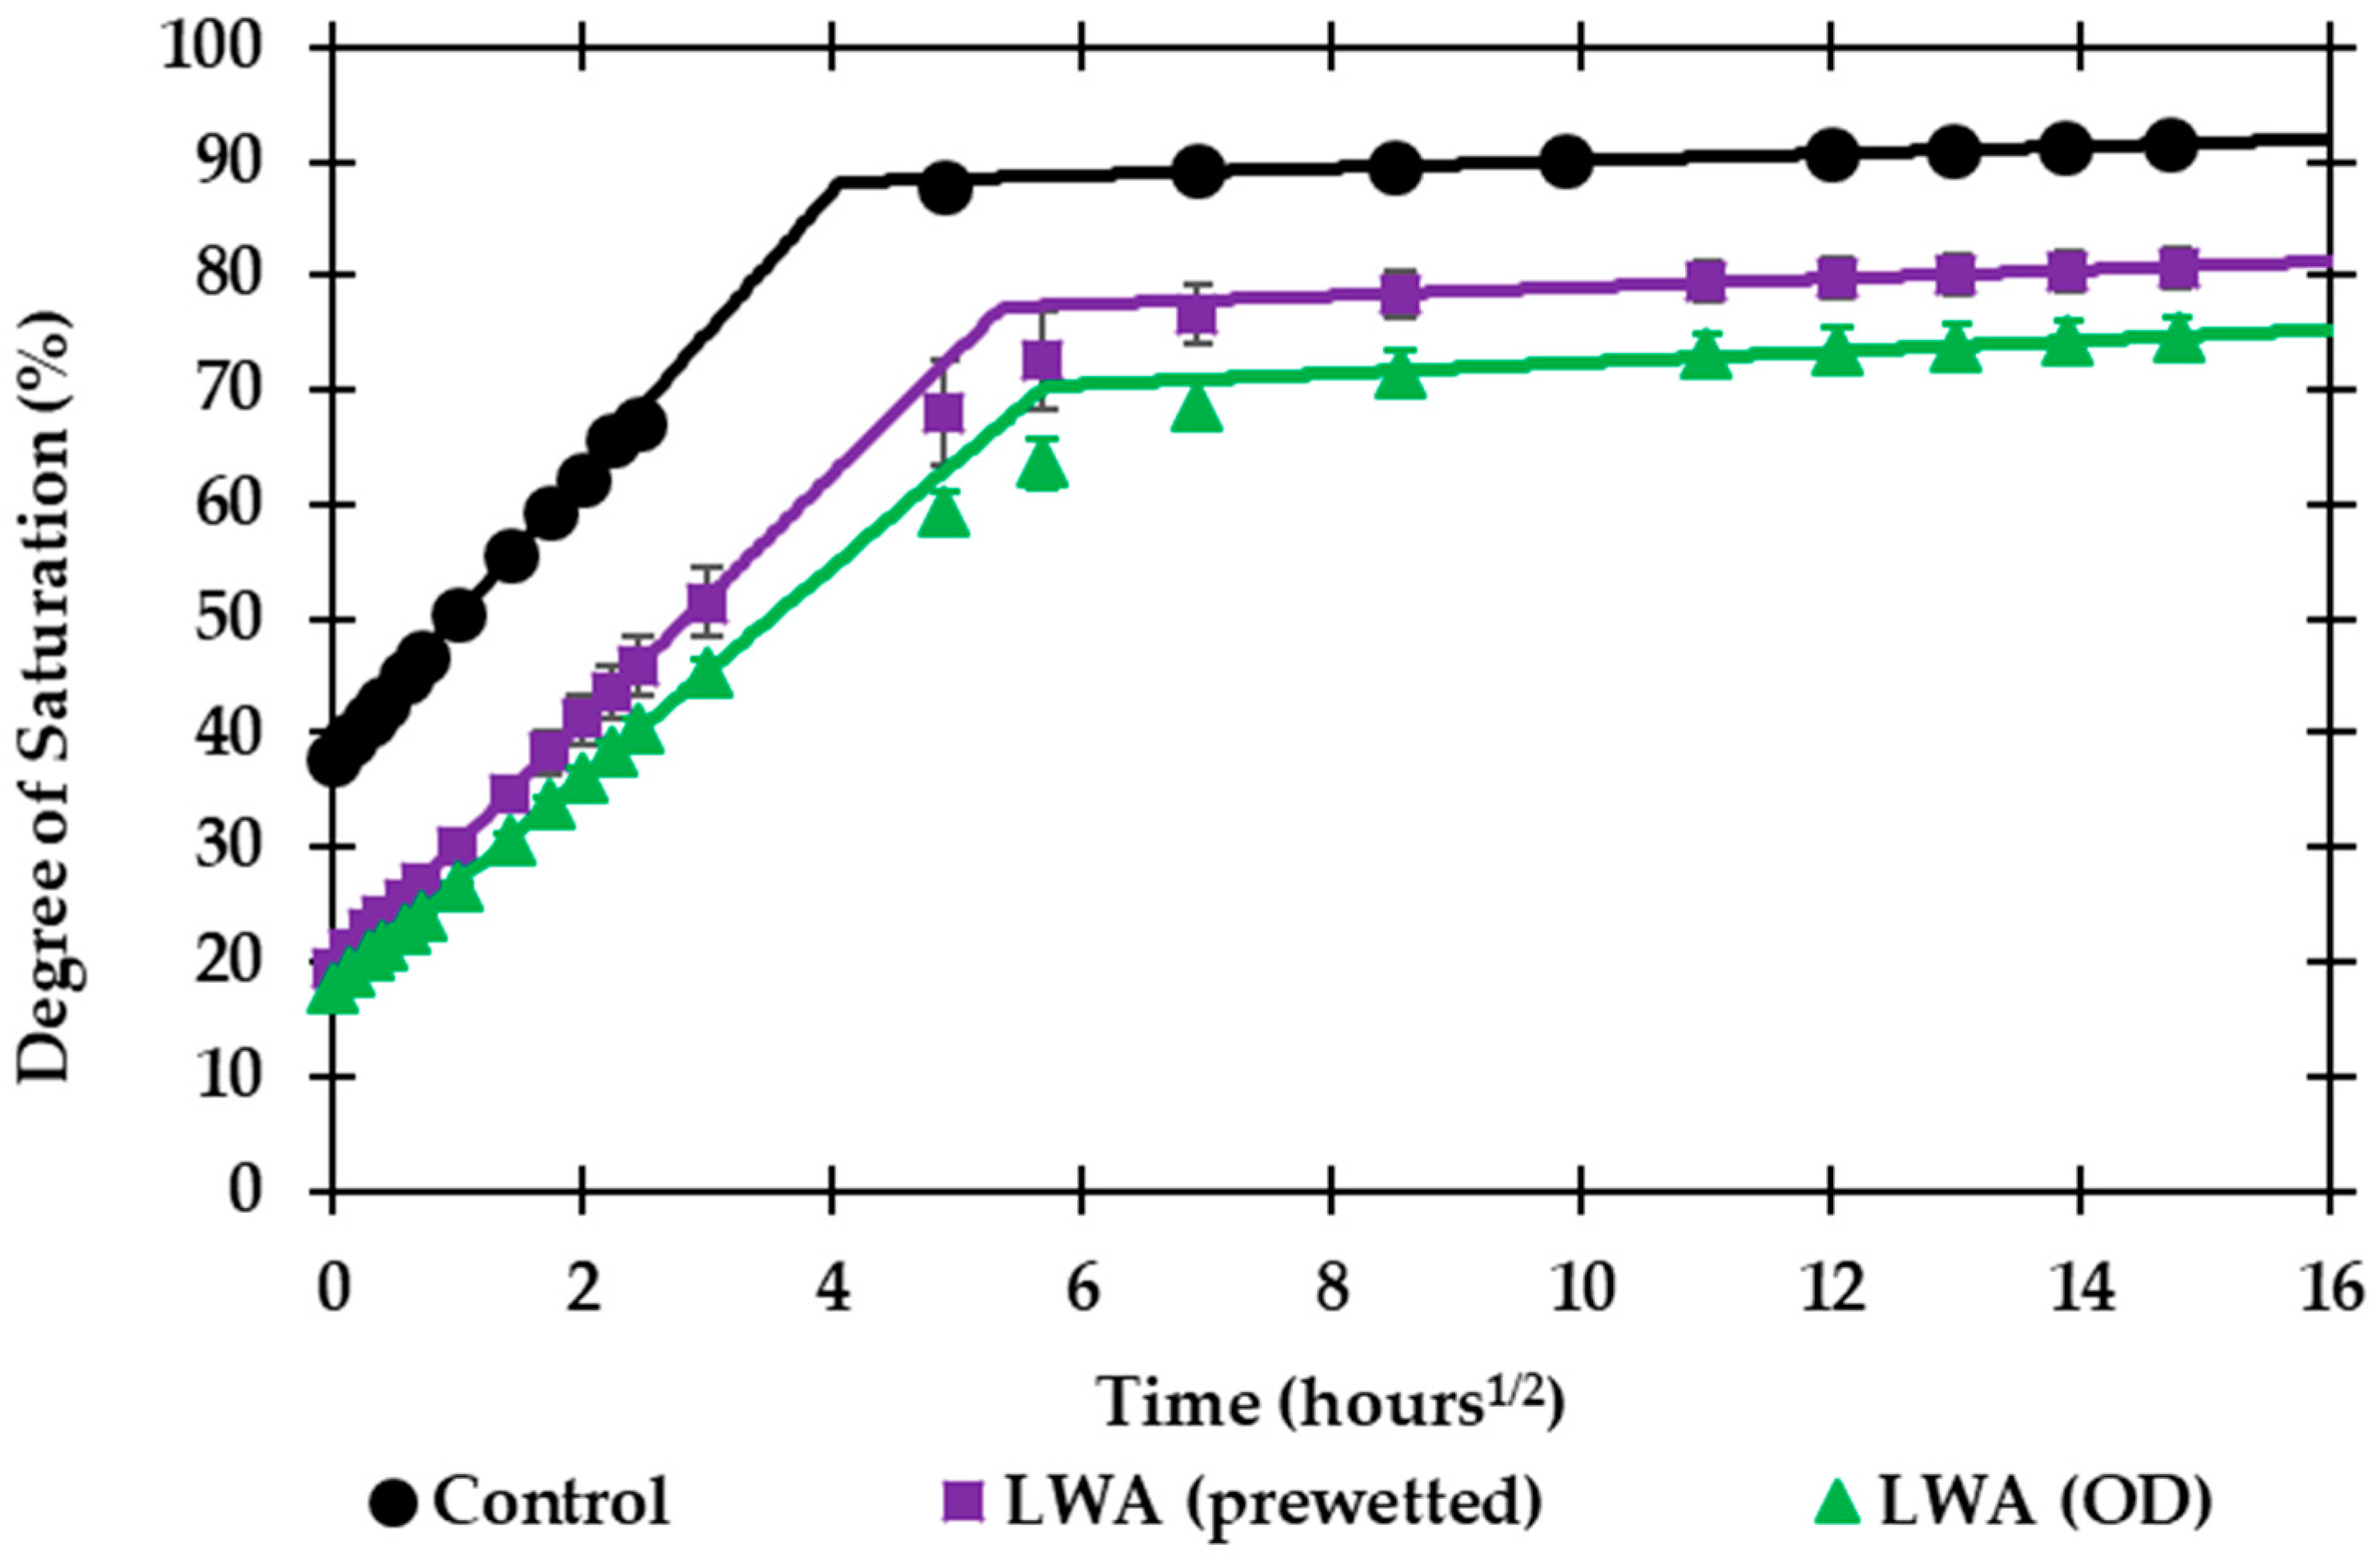
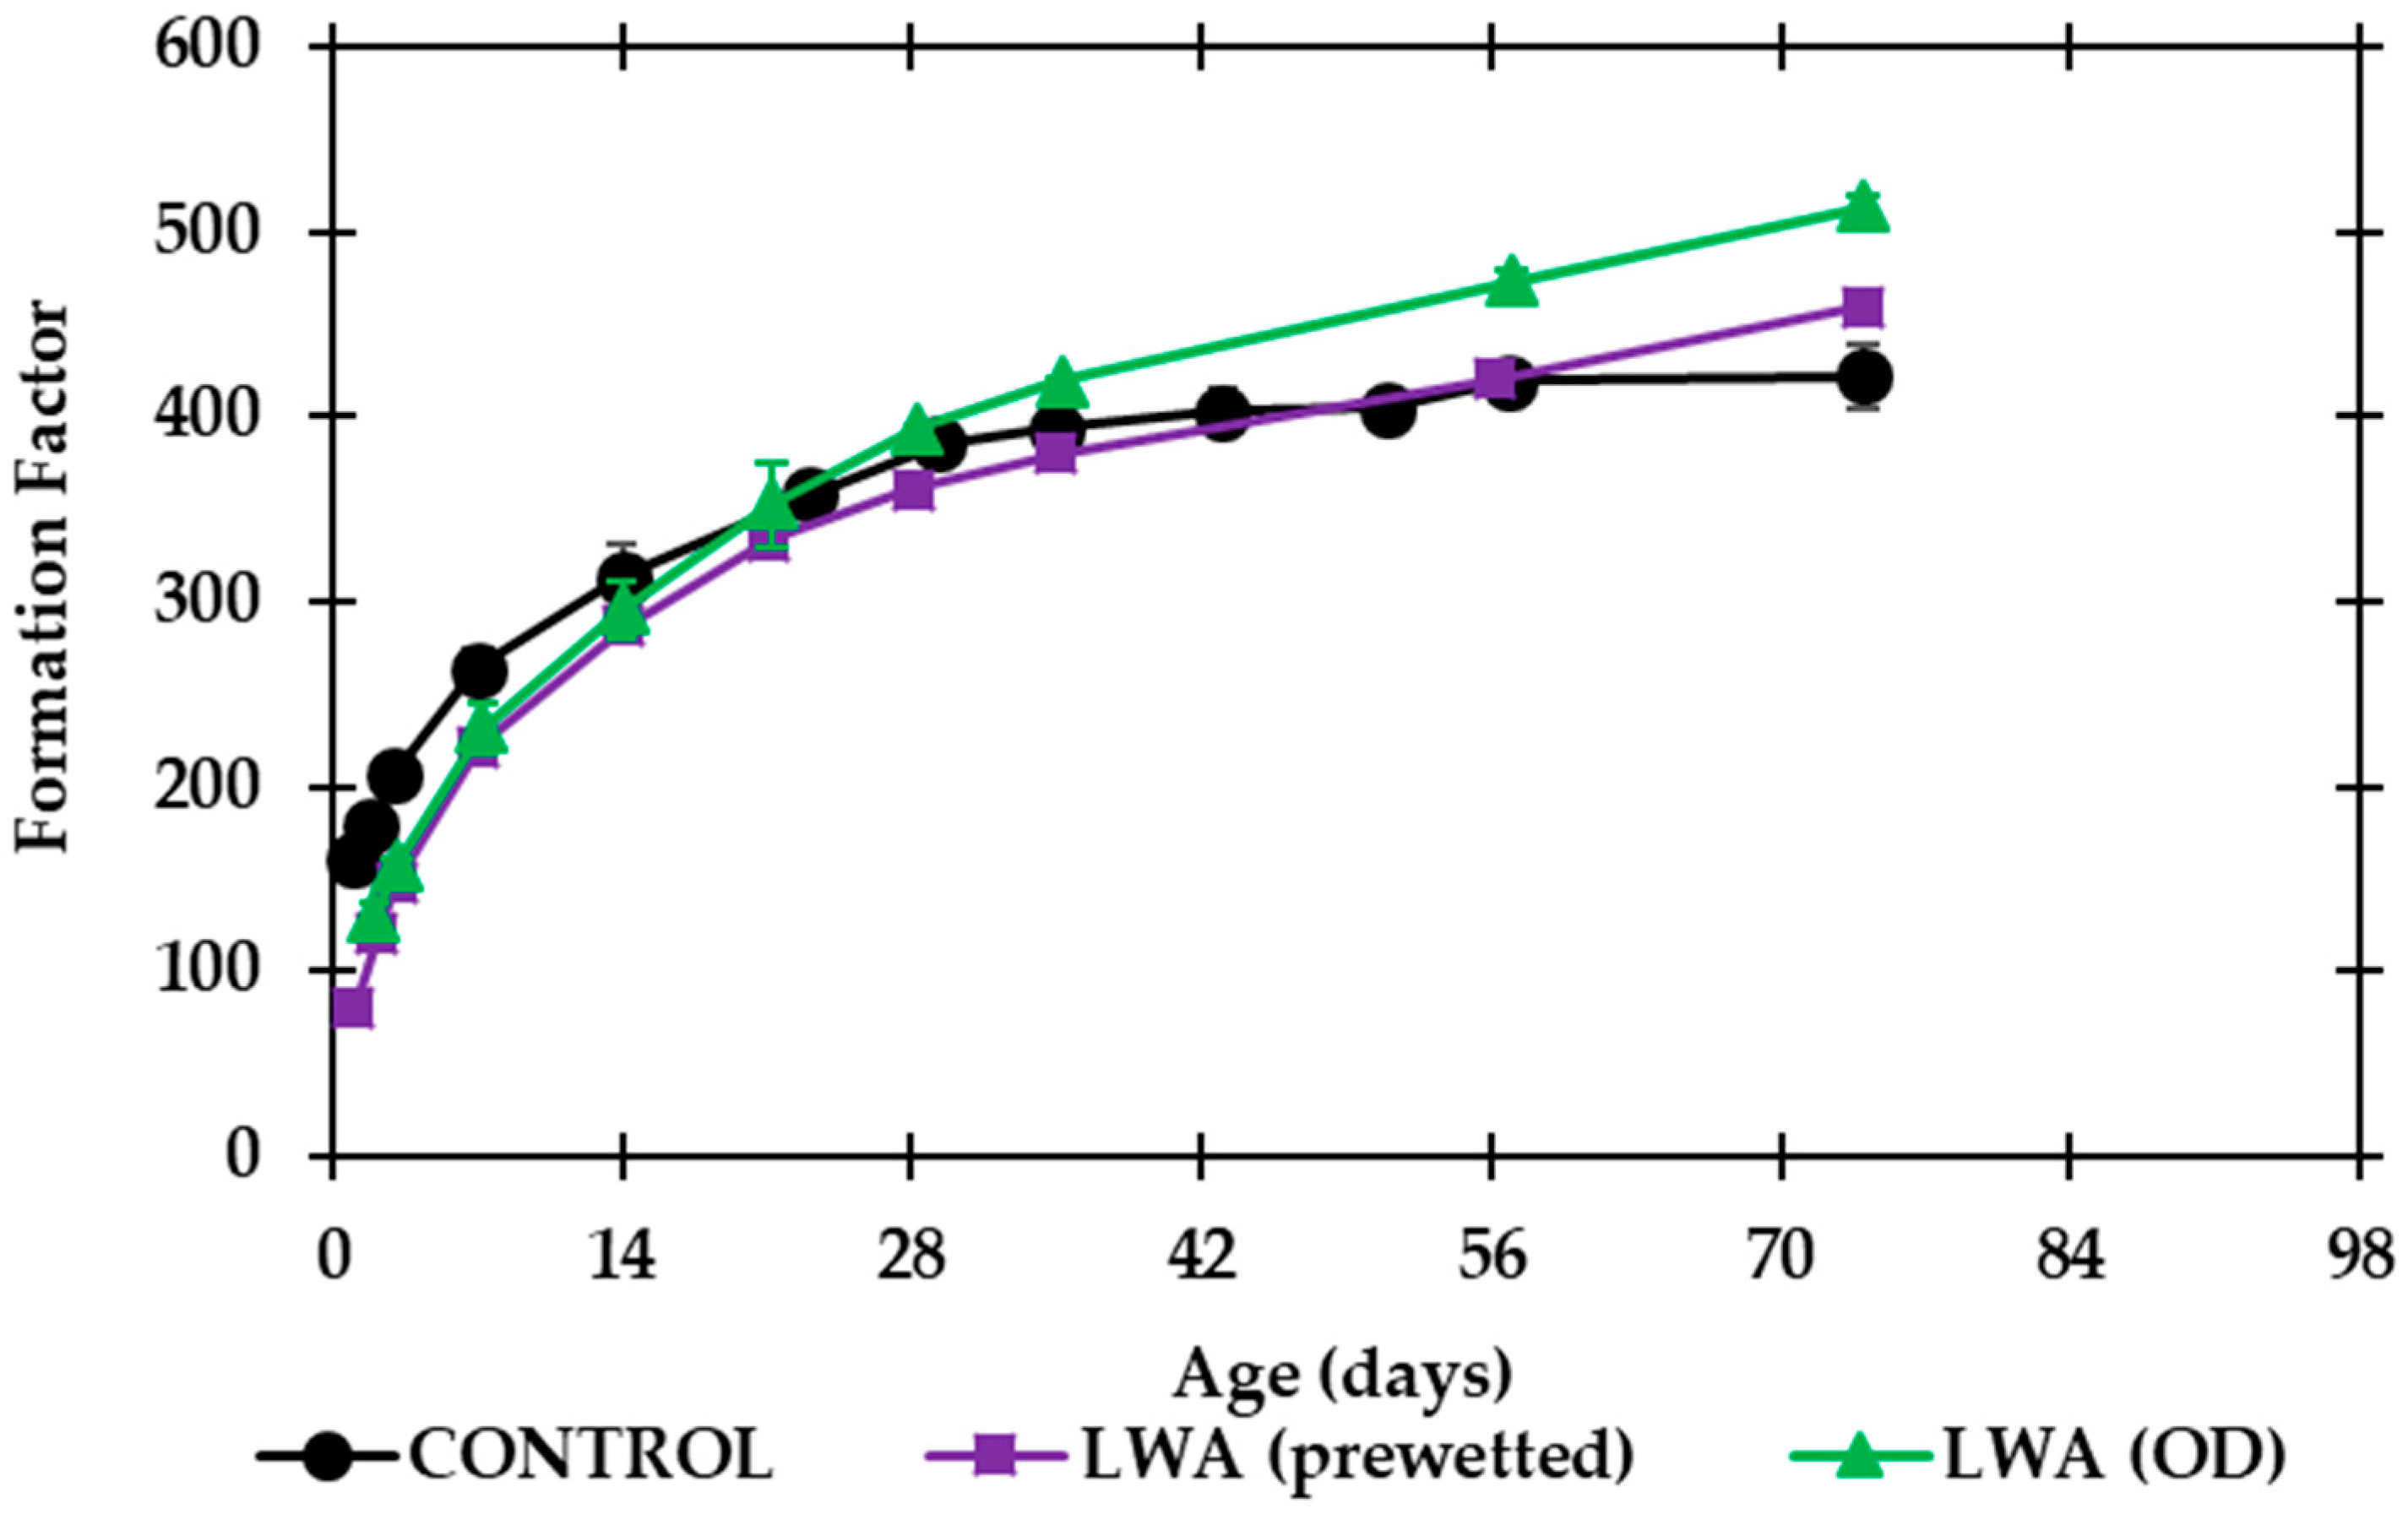
Figure 6 shows the tensile stresses at failure as determined from the pull-off bond tests. The Y-axis represents the tensile stress at failure. The Control and LWA (prewetted) specimens failed at the interface, while the LWA (OD) specimens predominantly failed within the overlay. This means that the true tensile bond strength could be assessed for the two formers, whereas a low boundary was estimated for the latter. As observed in Figure 6, the bond strength value of the Control was significantly higher than that of the LWA (prewetted), but not significantly different from the LWA (OD) (again, considering that the stress measured in this case was a low boundary of the true tensile bond strength). More tests should be performed at later ages to see if the IC effect on enhanced hydration and thus bond strength development can be detected.
Several parameters are recognized to influence the bond strength between two cementitious grouts [62,63,64], including the consolidation properties of the overlay material. The results in Table 2 show that the inclusion of LWA particles reduces the flow properties of the grout. This could be translated into lower bond strengths, as observed in Figure 6. However, it is also expected that IC may promote the formation of additional hydration products [7,10], thus increasing the number of contact points at the interface and improving not only the mechanical bond strength, but also the bond durability (ongoing research work is currently being performed on this topic). As such, the MSA conducted in this study intended to quantify the distribution of the different phases commonly observed in an interface (i.e., porosity, hydrated/unhydrated products, fillers). The comparison of the phase distribution along the 100-μm wide band of grout at the interface between the Control, LWA (prewetted) and LWA (OD) specimens is illustrated in Figure 7. The graph shows no significant difference in the trends of any of the phases among the three specimens. In all three cases, the microstructure closest to the interface (first 20 μm) depicted a high content of hydrated particles (~60%) and a low content of porosity and voids (below 5% in both cases). As already mentioned, perhaps more tests should be performed at later ages to see if the IC effect on enhanced hydration and thus bond strength development can be detected.
In addition to assessing the phases distribution along the ITZ (first 100 μm within the grout material from the interface), the BSE maps collected during the MSA were used to assess the percentage of ITZ length occupied by voids (pores >40 μm). Voids are one of the different features capable of disrupting the contact between the grout hydration products and the concrete substrate on a microscale level [65]. This direct contact on the micro-scale influences the bond strength of the interface. Thus, the percentage of interface length occupied by air voids was calculated by dividing the total length of the void surface in direct contact with the interface by the total length of the interface. Results from this analysis are shown in Table 3. The percentage of the ITZ length occupied by voids was lower in those specimens containing LWA. The high standard deviation associated with the LWA specimen measurements was caused by the increased number of areas in the interface with negligible content of voids.
The porosity values and percentages of the ITZ length occupied voids, both below 5% and 8%, respectively, were indicative of sound interfaces in all the evaluated specimens [65,66]. As observed in previous studies [15], as well as in Figure 6, the bond strength at the interface was not improved when adding LWAs. Theoretically, the promotion of a higher degree of hydration attained when adding IC was counterbalanced by the 25% grout flow reduction. The latter caused a reduction of the grout consolidation at the interface, which is one of the most important variables affecting bond strength [62,63,64]. Therefore, it is hypothesized that improving the consolidation properties of LWA-modified grouts with a certain level of mechanical vibration could result in significant benefits to the bond strength and further densification of the microstructure at the interface.

4.4. Durability

The first parameter investigated to assess durability was the rate of water absorption in terms of the degree of saturation. The degree of saturation (S) indicates the fraction of porosity that is fluid filled, with 0% being an oven-dry state (no porosity is fluid filled) and 100% being complete saturation (all the porosity is fluid filled). Data usually consists of two regions of bi-linear behavior, when shown against the square root of time [67]. The bi-linear fit consists of an initial region and a secondary region, with the slopes of the respective regions termed initial sorptivity and secondary sorptivity. The intersection of the initial and secondary regions is termed the nick point degree of saturation ( S n i c k ) and is related to the pore size distribution and paste content. While typically applied to air-entrained materials, the behavior of capillary absorption leading to water uptake is a general characteristic of porous materials [68]. It is generally regarded that when exposed to water after a precipitation event, a cement-based material will reach the S n i c k quickly. For these reasons, it is not typically included in the estimations discussed below.
The rate of fluid ingress relates to freeze/thaw damage because as water transitions to ice, a volumetric expansion occurs that leads to stresses within the material. Literature has shown a strong correlation between degrees of saturation exceeding 85% and freeze thaw damage, measured both in the traditional resonant frequency tests [69] and using both active and passive acoustic emission [70,71,72]. As such, an increase in the amount of time to reach the critical degree of saturation would lead to an improvement in terms of freeze thaw performance. More detailed and recent studies have observed damage in cement-based materials when S meets or exceeds approximately 87% and the material undergoes a freeze/thaw cycle [69,70,73]. This is termed a critical degree of saturation, S c r i t . Weiss et al. [73] have proposed a sorption-based model to estimate a time to reach the critical degree of saturation, shown here in Equation (3).
t c r i t = ( S c r i t S n i c k S ˙ 2 ) 2 ,
where t c r i t is the time to reach the critical degree of saturation in units of time, ( S c r i t ) which is assumed as 87%, S n i c k is previously discussed, and S ˙ 2 is the secondary sorptivity. The equation assumes continuous contact with water, which represents an aggressive worst-case scenario but is utilized here for comparison purposes with recognition of the lack of sufficient data to estimate an effect of drying and non-continuous contact. Furthermore, it should be noted in this study, t c r i t is not being presented for an estimation of service life of a bridge deck element due to the fact that it does not account for effects due to drying, temperature, pore solution composition, etc. Rather, it is being used to compare the behavior of the materials in this study and is simply a measure of the time to reach a critical degree of saturation of 87%.
Results shown in Figure 8 display the characteristic bi-linear behavior. A reduction in S n i c k is observed for both IC mixtures. The Control grout has a S n i c k average of 88%. These materials are not air-entrained and have a relatively high w/cm, both of which explain the high S n i c k . While the IC mixtures are not air-entrained, the reduction in S n i c k can be attributed to both the larger pore sizes in the LWA (which can act similarly to air entrainment [74]) and a reduction in paste content. For the IC materials, a region around S n i c k is observed that does not fit the bi-linear behavior. This behavior could be attributed to the increase in the number of intermediated sized pores, possibly in the LWA. These three data points for each IC mixture were excluded from the calculations of the bi-linear parameters, e.g., S ˙ 2 .
The parameters describing the sorptivity-based model shown in Equation 3 are presented in Table 4 for each of the mixtures. A value of time to reach the critical degree of saturation for the Control mixture was not calculated, as the average S n i c k was 88%, higher than S c r i t . Of the IC mixtures, the LWA (OD) had a larger t c r i t , even though the value of S ˙ 2 was slightly higher (although not statistically significantly different). The main reason for the increase in t c r i t is attributed to the reduction in S n i c k . The reduction in S n i c k from the Control mixture to LWA (prewetted) and finally to LWA (OD) mixtures can be attributed to the reduction in the grout volume fraction, which decreases from 1.0 to 0.81 and 0.76, respectively. Additionally, the large, empty pores in the LWA in the OD condition could absorb water and paste from the grout mixture which could lead to an improvement in the transition zone between the LWA and the grout. This further refinement in the porosity could lead to additional reduction in S n i c k , but this would need to be confirmed by future research.
The assumption in the calculation of t c r i t assumes a negligible time to reach the nick point degree of saturation (typically on the order of 16 to 30 h in this study), and a continuous contact with water, which represents a worst-case scenario as it neglects a few processes that might extend a t c r i t value in a typical field application of a bridge deck connection. As mentioned, it is presented here as a tool with meaningful units to compare the behavior of the different mixtures. A slight improvement from a negligible t c r i t in the Control grout to 50 days in the LWA (OD) grout is observed, and a slight improvement in freeze-thaw performance would be expected. However, they still do not reach a level seen by typical higher performance concrete materials, which have shown to be orders of magnitudes higher [75]. However, the values of t c r i t are consistent with results for cement-based materials with high w/cm and negligible air contents [75]. The authors attribute the low t c r i t to the high w/cm of the grout. Despite the slight improvement, usage of these materials in an aggressive freeze-thaw environment should be done with caution, and even with internal curing, users cannot expect the same level of performance in this particular grout that they would expect to see in a higher-performance concrete material. Furthermore, not all cementitious grouts are created equal, and some have shown acceptable performance in a moist-freeze thaw environment [76].
Other research studies have demonstrated an improvement in freeze/thaw performance for concrete materials made with high-absorptive fine aggregate compared to control concretes with no air-entraining admixture [74,77,78], and an improvement in water absorption behavior, similar to that seen in this study, has been observed in non-air-entrained mortars with internal curing using LWA [79].
The impact of drying on t c r i t is an important, but difficult, consideration that is not considered with the sorption-based model used in this study. Especially for high w/cm materials, that typically lose moisture quickly and easily [80], it might represent an important contribution to keep the materials below S c r i t . Based upon the environmental conditions, ambient temperature and relative humidity, and drying behavior, it is possible that the materials lose moisture between precipitation events that offset the absorption that occurred. This could lead to situations in which S c r i t is never achieved or is only achieved after significant amounts of time. This is a future area of research that could greatly benefit the understanding of high w/cm materials and lead to better correlation with field performance. However, for completeness, in applications in the presence of deicing salts, the drying behavior is significantly altered, which leads to cementitious materials that do not lose moisture in drying environments [81]. So, the lack of drying on estimations of t c r i t do not represent such an impossible situation. Furthermore, the assumption of 87% as a value for the S c r i t could be investigated, which has been shown to vary slightly, and can be dependent on the distribution of the pore network [75]. For a more connected pore network, it is possible for this value to approach 91%, which is the theoretical maximum based upon the expansion of water [69].
The cylinder absorption test was performed on the three mixtures, and the formation factor (F) was determined by dividing the measured resistivity by the resistivity of the storage solution, as described in Section 3.4. Figure 9 illustrates F development for the three different mixtures. While initially slightly higher, at an age of 74 day, the prewetted and OD mixtures have F values that are an average of 9% and 20% higher than the Control grout mixture. This difference is statistically significant at a level of 95%, based on a t-Test on the difference between the respective mixture and the Control.
The increase in F observed in the IC mixtures can likely be attributed to a reduction in the paste content, as paste is typically thought of as the permeable portion of the material, and an increase in the degree of hydration of the cementitious materials. Furthermore, Castro et al. [82] showed that LWA can become fluid filled, and due to their large porosity, act like a conductive inclusion, while the concept of a formation factor is derived based upon a single conductive phase, i.e., the pore solution. The interpretation of this is that concrete with LWA can measure a lower resistivity, and thus a lower F, than the value that is truly indicative of the behavior of the material. That is to say, the values presented here for the IC mixture represent a lower bound of the F that describes the behavior of the material if the conductive inclusion could be removed.
The Nernst-Einstein relationship shows that F is proportional to an estimated time to corrosion initiation, as an increase in F corresponds to a reduction in the volume of permeable pores and a decrease in the connectedness of that pore network [18]. The observed increase in the Formation Factor with internal curing would be expected to increase the time to corrosion initiation. Both the increase in the formation factor and the reduced cracking propensity of IC mixtures would lead to a system with a reduction in overall chloride ingress, creating a more sustainable and long-lasting infrastructure element.

5. Concluding Remarks

This study aimed at evaluating the effect that the inclusion of internal curing has on the material performance of cementitious grouts commonly used as PBE connections in ABC projects. The study presented results in characteristics relevant to PBE connections namely fresh, mechanical, shrinkage, cracking, bond, and durability properties. Based on the results obtained, the following conclusions can be drawn:
-
The inclusion of IC with LWA in both prewetted and oven-dried conditions reduced the fresh flow and density of the grout material by about 25% and 10%, respectively. Setting times were slightly retarded. These changes in fresh properties should be considered when using internally cured grouts in the field.
-
Both LWA (prewetted) and LWA (OD) mixtures depicted a reduction in the mechanical properties when compared to the Control grout. The reduction was about 30% in compressive strength, and 25% in both tensile strength and modulus of elasticity. Nevertheless, the compressive strength values obtained for the internally cured grouts were above the minimum strength required by specifications for grouts, such as ASTM C1107 [23].
-
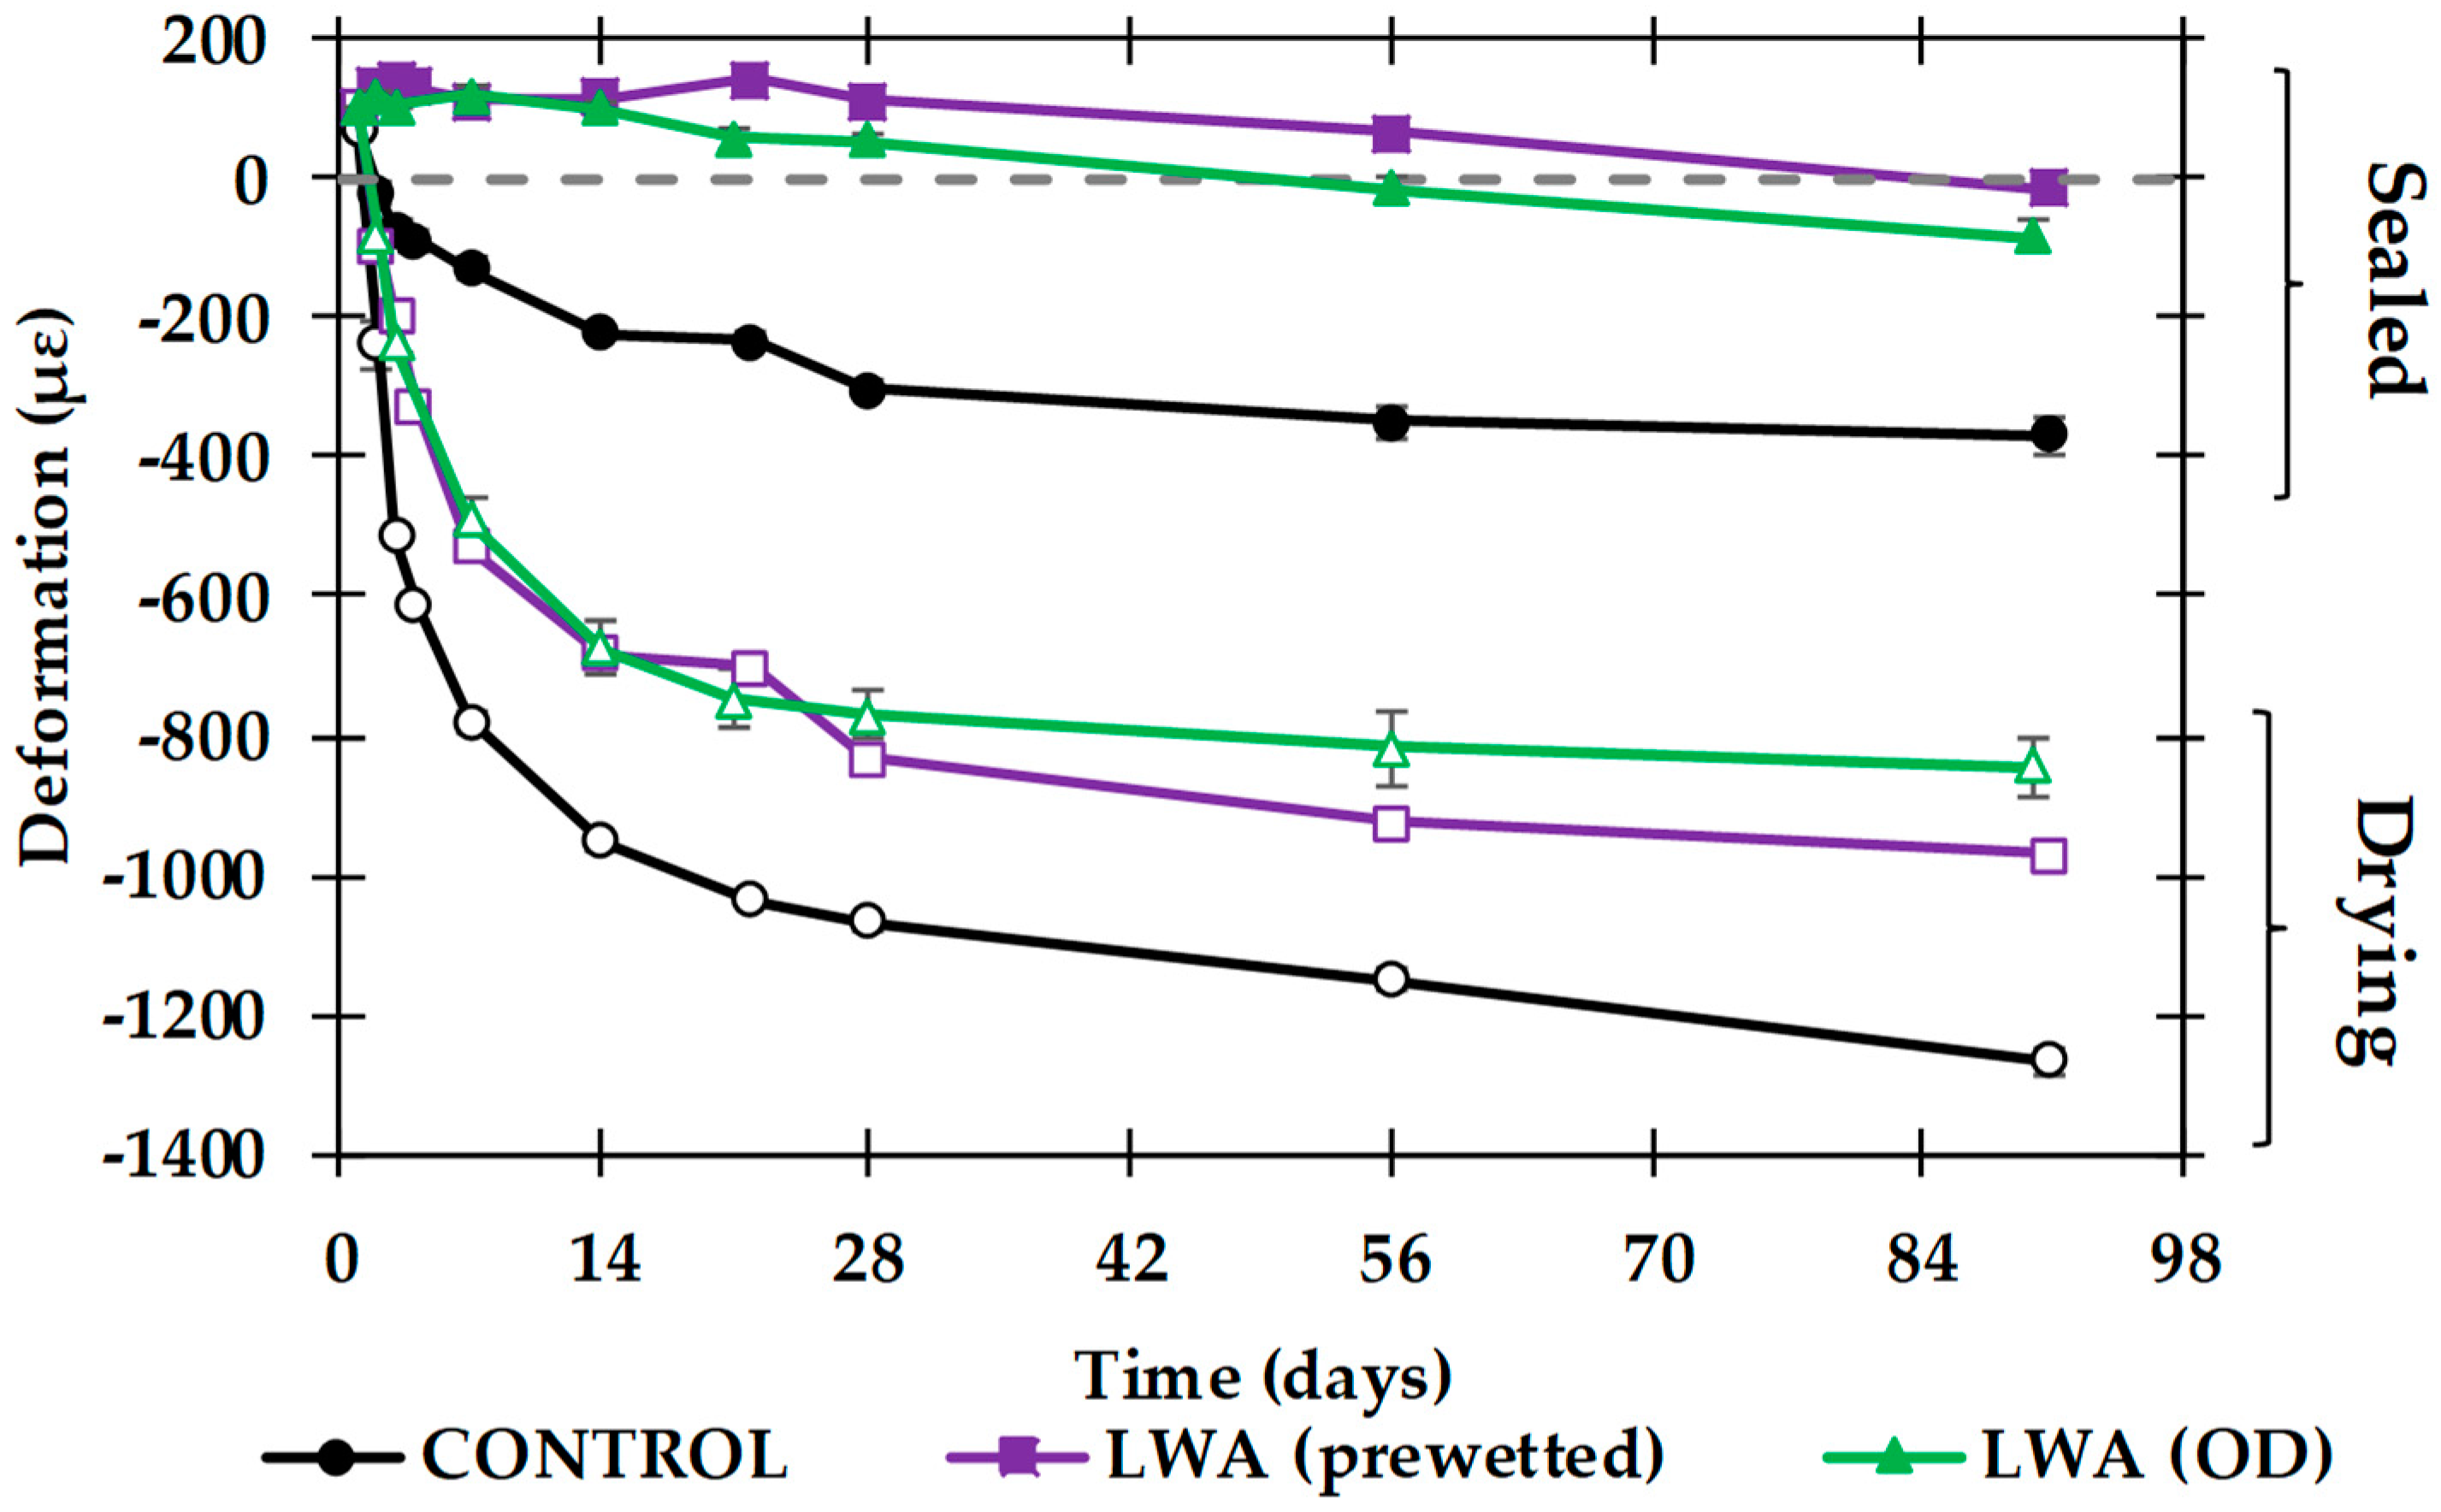
A considerable reduction in both autogenous and drying shrinkage deformations was observed when including IC in cementitious grouts, which should lead to less shrinkage cracking in general. This reduction was more evident at earlier ages (i.e., first 14 days), when the material is still developing its mechanical properties needed to sustain any shrinkage cracking.
-
The cracking behavior of internally cured grouts in a restraint condition improved with respect to the Control grout. Both LWA (prewetted) and LWA (OD) mixtures depicted higher tensile stress reserve capacities when evaluated in a DRT. The tensile stress reserve capacity measured in the DRT is an indication of how near the material is to cracking. In other words, it measures the propensity of a material to crack.
-
The tensile bond strength to an existing concrete substrate with a sandblasted surface was partially reduced when including IC in the grout. MSA confirmed that this might be mainly attributed to the fresh flow reduction. However, it is expected that the potential increase of hydration products along the interface at later ages would likely lead to a higher resistance to penetration of moisture or deicing salts, and thus to a more durable bond. Research is currently ongoing.
-
Durability was evaluated using water absorption and formation factor. While IC grouts demonstrated similar rates of absorption, i.e., sorptivities, the reduction in the nick point degree of saturation resulted in a significant increase in the time to reach a critical degree of saturation. This could be attributed to the reduction in grout content and additional hydration of the cementitious materials leading to an improvement in the microstructure. The formation factor is a microstructural material property that describes the pore network and can be related to the diffusion coefficient. The IC grouts demonstrated an increase in formation factor. An increase in the formation factor would lead to an expected increase in the time to corrosion initiation. Ongoing work is investigating the improvement in time to corrosion initiation.
Non-shrink cementitious grouts are often prepackaged and can be extended using small aggregates for volumetrically large pours. IC can be thought of as an extension of the grouts using LWA rather than normal weight aggregate. In this paper, it has been shown that incorporating the LWA particles in an oven-dried condition gives a similar performance to prewetted LWA particles. The use of dry LWA as inclusion in the prepackaged mixture might serve to make IC even easier with grout materials regarding field implementation. It was also proved elsewhere that incorporating IC in cementitious grouts offers cost benefits [15].
It is concluded that the inclusion of IC in cementitious grouts negatively affects to some degree the flow and mechanical properties of the material. While flow loss can generally be compensated with external vibration, the partial reduction in the mechanical properties is not considered to be critical since the internally cured grouts still meet the ASTM strength requirements. The crucial effect achieved with the inclusion of IC is on the durability spectrum, where shrinkage cracking and transport properties are considerably improved. This should have a direct effect on the sustainability factors of elements using these materials. Additionally, the reduction in the paste volume fraction of the grout material with IC would also agree with the production of a more sustainable material with less cementitious materials content.

Author Contributions

The authors confirm contribution to the paper as follows: Conceptualization, I.D.l.V. and R.P.S.; Data curation, I.D.l.V., R.P.S., J.F.M. and M.A.H.; Formal analysis, I.D.l.V., R.P.S., J.F.M. and M.A.H.; Funding acquisition, B.A.G.; Investigation, I.D.l.V., R.P.S., J.F.M. and M.A.H.; Methodology, I.D.l.V., R.P.S., J.F.M. and M.A.H.; Project administration, I.D.l.V., M.A.H. and B.A.G.; Resources, I.D.l.V., R.P.S., J.F.M. and M.A.H.; Software, I.D.l.V., R.P.S., J.F.M. and M.A.H.; Supervision, I.D.l.V. and B.A.G.; Validation, I.D.l.V., R.P.S., J.F.M., M.A.H. and B.A.G.; Visualization, I.D.l.V., R.P.S., J.F.M. and M.A.H.; Writing—original draft, I.D.l.V., R.P.S., J.F.M. and M.A.H.; Writing—review & editing, I.D.l.V., R.P.S., J.F.M., M.A.H. and B.A.G.

Funding

This research received no external funding.

Acknowledgments

The authors would like to thank Caleb Nickel for his help with sample preparation, conducting experiments, and creation of the dual ring insulation chamber.

Conflicts of Interest

The authors declare no conflict of interest.

References

  1. Culmo, M.P. Accelerated Bridge Construction—Experience in Design, Fabrication and Erection of Prefabricated Bridge Elements and Systems (No. FHWA-HIF-12-013); Federal Highway Administration—U.S. Department of Transportation: McLean, VA, USA, 2011.
  2. Culmo, M.P. Connection Details for Prefabricated Bridge Elements and Systems (No. FHWA-IF-09-010); Federal Highway Administration—U.S. Department of Transportation: McLean, VA, USA, 2009.
  3. Spragg, R.P.; De la Varga, I.; Nickel, C.A.; Graybeal, B.A.; Poursaee, A. Chloride Ingress and Corrosion in UHPC Closure Pours. Present at Spring 2018 ACI Convention, Salt Lake City, UT, USA, 25–29 March 2018. [Google Scholar]
  4. De la Varga, I.; Haber, Z.B.; Graybeal, B.A. Enhancing Shrinkage properties and bond performance of prefabricated bridge deck connection grouts: Material and component testing. J. Mater. Civ. Eng. 2018, 30. [Google Scholar] [CrossRef]
  5. De la Varga, I.; Graybeal, B.A. Dimensional stability of grout-type materials used as connections between prefabricated concrete elements. J. Mater. Civ. Eng. 2015, 27. [Google Scholar] [CrossRef]
  6. Castro, J.; De la Varga, I.; Golias, M.; Weiss, J. Extending Internal Curing Concepts to Mixtures Containing High Volumes of Fly Ash. In 2010 Concrete Bridge Conference: Achieving Safe, Smart & Sustainable Bridges; National Academy of Sciences: Phoenix, AZ, USA, 2010. [Google Scholar]
  7. Bentz, D.P.; Weiss, W.J. Internal Curing: A 2010 State-of-the-Art Review (No. NISTIR 7765); National Institute of Standards and Technology—U.S. Department of Commerce: Gaithersburg, MD, USA, 2011.
  8. RILEM Technical Committee 196-ICC. Internal Curing of Concrete. State of the Art Report (Report 41); Kovler, K., Jensen, O.M., Eds.; RILEM Publications S.A.R.L.: Bagneux, France, 2007; ISBN 978-2-35158-009-7. [Google Scholar]
  9. Bentz, D.P.; Jones, S.Z.; Peltz, M.A.; Stutzman, P.E. Influence of Internal Curing on Properties and Performance of Cement-Based Repair Materials (No. NISTIR 8076); National Institute of Standards and Technology—U.S. Department of Commerce: Gaithersburg, MD, USA, 2015.
  10. De La Varga, I.; Castro, J.; Bentz, D.; Weiss, J. Application of internal curing for mixtures containing high volumes of fly ash. Cem. Concr. Compos. 2012, 34. [Google Scholar] [CrossRef]
  11. Tia, M.; Subgranon, T.; Kim, K.; Medina Rodriguez, A.; Algazlan, A. Internally Cured Concrete for Pavement and Bridge Deck Applications; Florida DOT: Tallahassee, FL, USA, 2015. [Google Scholar]
  12. Rao, C.; Darter, M. Evaluation of Internally Cured Concrete for Paving Applications; Applied Research Associates, Inc.: Champaign, IL, USA, 2013. [Google Scholar]
  13. Weiss, W.J.; Montanari, L. Guide Specification for Internally Curing Concrete (InTrans Project No. 13-482); Iowa Department of Transportation: Ames, IA, USA, 2017.
  14. Montanari, L.; Amirkhanian, A.N.; Suraneni, P.; Weiss, J. Design Methodology for Partial Volumes of Internal Curing Water Based on the Reduction of Autogenous Shrinkage. J. Mater. Civ. Eng. 2018, 30, 04018137. [Google Scholar] [CrossRef]
  15. De La Varga, I.; Spragg, R.P.; Munoz, J.F.; Nickel, C.A.; Graybeal, B.A. Application of Internal Curing in Cementitious Grouts for Prefabricated Bridge Concrete Elements Connections. Adv. Civ. Eng. Mater. 2018. [Google Scholar] [CrossRef]
  16. Schlitter, J.L.; Senter, A.H.; Bentz, D.P.; Nantung, T.; Weiss, W.J. A Dual Concentric Ring Test for Evaluating Residual Stress Development due to Restrained Volume Change. J. ASTM Int. 2010, 7, 1–13. [Google Scholar] [CrossRef]
  17. AASHTO T 363-17. Standard Method of Test for Evaluating Stress Development and Cracking Potential due to Restrained Volume Change Using a Dual Ring Test Evaluating Stress Development and Cracking Potential due to Restrained Volume Change Using a Dual Ring Test; American Association of State Highway and Transportation Officials: Washington, DC, USA, 2017; ISBN 9935596001. [Google Scholar]
  18. Snyder, K.A. The relationship between the formation factor and the diffusion coefficient of porous materials saturated with concentrated electrolytes: Theoretical and experimental considerations. Concr. Sci. Eng. 2001, 3, 216–224. [Google Scholar]
  19. Spragg, R.; Villani, C.; Weiss, J. Electrical Properties of Cementitious Systems: Formation Factor Determination and the Influence of Conditioning Procedures. Adv. Civ. Eng. Mater. 2016, 5. [Google Scholar] [CrossRef]
  20. ASTM C1437. Standard Test Method for Flow of Hydraulic Cement Mortar; ASTM International: West Conshohocken, PA, USA, 2015. [Google Scholar]
  21. ASTM C1761. Standard Specification for Lightweight Aggregate for Internal Curing of Concrete; ASTM International: West Conshohocken, PA, USA, 2017. [Google Scholar]
  22. ASTM C150. Standard Specification for Portland Cement; ASTM International: West Conshohocken, PA, USA, 2017. [Google Scholar]
  23. ASTM C1107. Standard Specification for Packaged Dry, Hydraulic-Cement Grout (Nonshrink); ASTM International: West Conshohocken, PA, USA, 2008. [Google Scholar]
  24. Bentz, D.P.; Lura, P.; Roberts, J.W. Mixture proportioning for internal curing. Concr. Int. 2005, 27, 35–40. [Google Scholar]
  25. ASTM C1608. Standard Test Method for Chemical Shrinkage of Hydraulic Cement Paste; ASTM International: West Conshohocken, PA, USA, 2017. [Google Scholar]
  26. ASTM C185. Standard Test Method for Air Content of Hydraulic Cement Mortar; ASTM International: West Conshohocken, PA, USA, 2015. [Google Scholar]
  27. ASTM C191. Standard Test Methods for Time of Setting of Hydraulic Cement by Vicat Needle; ASTM International: West Conshohocken, PA, USA, 2013. [Google Scholar]
  28. ASTM C39. Standard Test Method for Compressive Strength of Cylindrical Concrete Specimens; ASTM International: West Conshohocken, PA, USA, 2016. [Google Scholar]
  29. ASTM C496. Standard Test Method for Splitting Tensile Strength of Cylindrical Concrete Specimens ASTM C-496; ASTM International: West Conshohocken, PA, USA, 2011. [Google Scholar]
  30. ASTM C469. Standard Test Method for Static Modulus of Elasticity and Poisson’s Ratio of Concrete in Compression; ASTM International: West Conshohocken, PA, USA, 2014. [Google Scholar]
  31. ASTM C157. Standard Test Method for Length Change of Hardened Hydraulic-Cement Mortar and Concrete; ASTM International: West Conshohocken, PA, USA, 2017. [Google Scholar]
  32. ASTM C1698. Standard Test Method for Autogenous Strain of Cement Paste and Mortar; ASTM International: West Conshohocken, PA, USA, 2014. [Google Scholar]
  33. ASTM C1583. Standard Test Method for Tensile Strength of Concrete Surfaces and the Bond Strength or Tensile Strength of Concrete Repair and Overlay Materials by Direct Tension (Pull-off Method); ASTM International: West Conshohocken, PA, USA, 2013. [Google Scholar]
  34. ICRI Committee 310. Selecting and Specifying Concrete Surface Preparation for Sealers, Coatings, Polymer Overlays, and Concrete Repair (No. 310.2R-2013); International Concrete Repair Institute: Rosemont, IL, USA, 2013. [Google Scholar]
  35. De la Varga, I.; Munoz, J.F.; Bentz, D.P.; Stutzman, P.E.; Graybeal, B.A. Grout-concrete interface bond performance: Effect of interface moisture on the tensile bond strength and grout microstructure. Constr. Build. Mater. 2018, 170, 747–756. [Google Scholar] [CrossRef] [PubMed]
  36. Diamond, S.; Huang, J. The ITZ in concrete—A different view based on image analysis and SEM observations. Cem. Concr. Compos. 2001, 23, 179–188. [Google Scholar] [CrossRef]
  37. Elsharief, A.; Cohen, M.D.; Olek, J. Influence of aggregate size, water cement ratio and age on the microstructure of the interfacial transition zone. Cem. Concr. Res. 2003, 33, 1837–1849. [Google Scholar] [CrossRef]
  38. Beuhausen, H.; Hohlig, M.; Talotti, M. The influence of substrate moisture preparation on bond strength of concrete overlays and the microstructure of the OTZ. Cem. Concr. Res. 2017, 92, 84–91. [Google Scholar] [CrossRef]
  39. Beyene, M.A.; Munoz, J.F.; Meininger, R.C.; Di Bella, C. Effect of internal curing as mitigation to minimize alkali-silica reaction damage. ACI Struct. J. 2017, 114, 417–428. [Google Scholar] [CrossRef]
  40. Pawley, J.B. Fundamental Limits in Confocal Microscopy. In Handbook of Biological Confocal Microscopy; Pawley, J.B., Ed.; Springer: Boston, MA, USA, 2006; pp. 20–42. ISBN 987-0-387-25921-5. [Google Scholar]
  41. ASTM C1585. Standard Test Method for Measurement of Rate of Absorption of Water by Hydraulic-Cement Concretes; ASTM International: West Conshohocken, PA, USA, 2013. [Google Scholar]
  42. Fagerlund, G. The international cooperative test of the critical degree of saturation method of assessing the freeze/thaw resistance of concrete. Mater. Struct. 1977, 10, 231–253. [Google Scholar] [CrossRef]
  43. Garboczi, E.J. Permeability, Diffusivity, and Microstructural Parameters: A Critical Review. Cem. Concr. Res. 1990, 20, 591–601. [Google Scholar] [CrossRef]
  44. Garboczi, E.J.; Bentz, D.P. Computer simulation of the diffusivity of cement-based materials. J. Mater. Sci. 1992, 27, 2083–2092. [Google Scholar] [CrossRef]
  45. Feng, X.; Garboczi, E.; Bullard, J.W.; Bentz, D.P.; Snyder, K.; Stutzman, P.; Mason, T. Expanding a Tool for Predicting Chloride Diffusivity in Concrete so It Can Be Used by Manufacturers to Evaluate the Durability of Concrete Made with Blended Cements. Part I: Characterizing Blended Cement Materials (No. NISTIR 7135); National Institute of Standards and Technology—U.S. Department of Commerce: Gaithersburg, MD, USA, 2004.
  46. Christensen, B.J.; Coverdale, T.; Olson, R.A.; Ford, S.J.; Garboczi, E.J.; Jennings, H.M.; Mason, T.O. Impedance Spectroscopy of Hydrating Cement-Based Materials: Measurement, Interpretation, and Application. J. Am. Ceram. Soc. 1994, 77, 2789–2804. [Google Scholar] [CrossRef]
  47. Khanzadeh, M.; Qiao, C.; Isgor, O.B.; Reese, S.; Weiss, J. Relating the Formation Factor of Concrete to Water Absorption. ACI Mater. J. 2018. [Google Scholar] [CrossRef]
  48. Akhavan, A.; Rajabipour, F. Evaluating ion diffusivity of cracked cement paste using electrical impedance spectroscopy. Mater. Struct. 2012, 697–708. [Google Scholar] [CrossRef]
  49. Weiss, W.J.; Spragg, R.P.; Isgor, O.B.; Ley, M.T.; Dam, T. Van Toward performance specifications for concrete: Linking resistivity, RCPT and diffusion predictions using the formation factor for use in specifications. In FIB Symposium 2017; International Federation for Structural Concrete: Maastricht, The Netherlands, 2017. [Google Scholar]
  50. Spragg, R.; Qiao, C.; Barrett, T.J.; Weiss, J. Assessing a concrete’s resistance to chloride ion ingress using the formation factor. In Corrosion of Steel in Concrete Structures; Poursaee, A., Ed.; Woodhead Publishing: London, UK, 2016; pp. 211–238. ISBN 9781782424024. [Google Scholar]
  51. AASHTO TP119. Standard Method of Test for Electrical Resistivity of a Concrete Cylinder Tested in a Uniaxial Resistance Test; American Association of State Highway and Transportation Officials: Washington, DC, USA, 2015. [Google Scholar]
  52. Riding, K.A.; Thomas, M.D.A.; Hooton, R.D.; Obla, K.H.; Weiss, W.J. Performance-based specifications for concrete exposed to chlorides. Concr. Int. 2018, 40, 41–47. [Google Scholar]
  53. Price, W.H. Factors influencing concrete strength. ACI J. 1951, 47, 417–432. [Google Scholar] [CrossRef]
  54. Mehta, P.K. Concrete. Structure, Properties and Materials; Prentice-Hall: Englewood Cliffs, NJ, USA, 1986. [Google Scholar]
  55. Cusson, D. Effect of blended cements on effectiveness of internal curing in HPC. In Proceedings of the ACI SP-256-9, Internal Curing of High-Performance Concrete: Lab and Field Experiences, Fajardo, Puerto Rico, 15 October 2009; pp. 1–16. [Google Scholar]
  56. Castro, J.; De la Varga, I.; Weiss, J. Using isothermal calorimetry to assess the water absorbed by fine LWA during mixing. J. Mater. Civ. Eng. 2012, 24. [Google Scholar] [CrossRef]
  57. Szelag, M. Mechano-Physical Properties and Microstructure of Carbon Nanotube Reinforced Cement Paste after Thermal Load. Nanomaterials 2017, 7. [Google Scholar] [CrossRef] [PubMed]
  58. Ge, X.; Ge, Y.; Du, Y.; Cai, X. Effect of low air pressure on mechanical properties and shrinkage of concrete. Mag. Concr. Res. 2018, 70, 919–927. [Google Scholar] [CrossRef]
  59. ASTM C1581. Standard Test Method for Determining Age at Cracking and Induced Tensile Stress; ASTM International: West Conshohocken, PA, USA, 2013. [Google Scholar]
  60. Shah, S.; Weiss, W.; Yang, W. Shrinkage cracking—Can it be prevented? ACI Concr. Int. 1998, 20, 51–55. [Google Scholar]
  61. Bentz, D.P.; Peltz, M.A. Reducing thermal and autogenous shrinkage contributions to early-age cracking. ACI Mater. J. 2008, 105, 414–420. [Google Scholar] [CrossRef]
  62. Silfwerbrand, J.; Beuhausen, H. Bonded concrete overlays–bond strength issues. In Proceedings of the International Conference on Concrete Repair, Rehabilitation and Retrofitting, Cape Town, South Africa, 21–23 November 2005; pp. 19–21. [Google Scholar]
  63. Silfwerbrand, J. Bonded concrete overlays—Research needs. In Proceedings of the 2nd International Symposium on Advance in Concrete through Science and Engineering, Quebec City, QC, Canada, 11–13 September 2006; pp. 193–205. [Google Scholar]
  64. Wall, J.S.; Shrive, N.G. Factors Affecting Bond Between New and Old Concrete. ACI Mater. J. 1988, 85, 117–125. [Google Scholar] [CrossRef]
  65. Haber, Z.B.; Munoz, J.F.; Graybeal, B.A. Field Testing of an Ultra-High Performance Concrete Overlay (No. FHWA-HRT-17-096); Federal Highway Administration—U.S. Department of Transportation: McLean, VA, USA, 2017.
  66. Haber, Z.; De la Varga, I.; Graybeal, B.A. Performance of grouted Connections for prefabricated Bridge Elements. Part II: Component-Level Investigation on bond and Cracking. In Proceedings of the 2016 PCI Convention and National Bridge Conference, Nashville, TN, USA, 1–5 March 2016. [Google Scholar]
  67. Todak, H.; Lucero, C.; Weiss, W.J. Why is the Air There? Thinking about Freeze-Thaw in Terms of Saturation. Concr. Infocus 2015, 27–33. [Google Scholar]
  68. Hall, C.; Hoff, W.D. Water Transport in Brick, Stone, and Concrete, 2nd ed.; Spon Press: London, UK, 2012; ISBN 978-0-415-56467-0. [Google Scholar]
  69. Fagerlund, G. Critical degrees of saturation at freezing of porous and brittle materials. In Durability of Concrete; American Concrete Institute: Ottawa, ON, Canada, 1973; pp. 13–65. [Google Scholar]
  70. Li, W.; Pour-Ghaz, M.; Castro, J.; Weiss, J. Water Absorption and Critical Degree of Saturation Relating to Freeze-Thaw Damage in Concrete Pavement Joints. J. Mater. Civ. Eng. 2012, 24, 299–307. [Google Scholar] [CrossRef]
  71. Farnam, Y.; Todak, H.; Spragg, R.P.; Weiss, W.J. Electrical response of mortar with different degrees of saturation and deicing salt solutions during freezing and thawing. Cem. Concr. Compos. 2015, 59, 49–59. [Google Scholar] [CrossRef]
  72. Smyl, D.; Ghasemzadeh, F.; Pour-Ghaz, M. Modeling water absorption in concrete and mortar with distributed damage. Constr. Build. Mater. 2016, 125, 438–449. [Google Scholar] [CrossRef]
  73. Weiss, W.J.; Ley, T.; Isgor, O.B.; Van Dam, T. Toward Performance Specifications for Concrete Durability: Using the Formation Factor for Corrosion and Critical Saturation for Freeze-Thaw. In Proceedings of the 96th Annual Transportation Research Board, Washington, DC, USA, 8–12 January 2017; Transportation Research Board of the National Academies: Washington, DC, USA, 2017; pp. 2057–2065. [Google Scholar]
  74. Jones, W.A.; Weiss, W.J. Freezing and Thawing Behavior of Internally Cured Concrete. Adv. Civ. Eng. Mater. 2015, 4. [Google Scholar] [CrossRef]
  75. Todak, H. Durability Assessments of Concrete Using Electrical Properties and Acoustic Emissions. Ph.D. Thesis, Purdue University, West Lafayette, IN, USA, 2015. [Google Scholar]
  76. Swenty, M.K.; Graybeal, B.A. Material Chracterization of Field-Cast Connection Grouts (No. FHWA-HRT-13-041); Federal Highway Administration—U.S. Department of Transportation: McLean, VA, USA, 2013.
  77. Pospíchal, O.; Kucharczyková, B.; Misák, P.; Vymazal, T. Freeze-thaw resistance of concrete with porous aggregate. Procedia Eng. 2010, 2, 521–529. [Google Scholar] [CrossRef]
  78. Öz, H.Ö.; Yücel, H.E.; Güneş, M. Freeze-Thaw Resistance of Self Compacting Concrete Incorporating Basic Pumice. Int. J. Theor. Appl. Mech. 2016, 1, 285–291. [Google Scholar]
  79. Henkensiefken, R.; Castro, J.; Bentz, D.; Nantung, T.; Weiss, J. Water absorption in internally cured mortar made with water-filled lightweight aggregate. Cem. Concr. Res. 2009, 39, 883–892. [Google Scholar] [CrossRef] [Green Version]
  80. Bazant, Z.P.; Najjar, L.J. Drying of concrete as a nonlinear diffusion problem. Cem. Concr. Res. 1971, 1, 461–473. [Google Scholar] [CrossRef]
  81. Spragg, R.P.; Castro, J.; Li, W.; Pour-Ghaz, M.; Huang, P.-T.T.; Weiss, J. Wetting and drying of concrete using aqueous solutions containing deicing salts. Cem. Concr. Compos. 2011, 33, 535–542. [Google Scholar] [CrossRef]
  82. Castro, J.; Spragg, R.; Weiss, J. Water absorption and electrical cnductivity for internally cured mortars with a W/C between 0.30 and 0.45. J. Mater. Civ. Eng. 2012, 24, 223–231. [Google Scholar] [CrossRef]
Figure 1. (a) Connecting two precast bridge deck elements with a cementitious grout, and (b) commonly observed shrinkage cracking on top of the deck at the grout pocket.
Sustainability 10 03881 g001
Figure 2. Illustration of the IC concept [6].
Sustainability 10 03881 g002
Figure 3. DRT setup.
Sustainability 10 03881 g003
Figure 4. Long-term autogenous and drying deformations for the grouts with and without IC per ASTM C157. Error bars, mostly covered by symbols, indicate ± one standard deviation from the average of four specimens.
Sustainability 10 03881 g004
Figure 5. Residual stress development and stress reserve capacity (indicated by arrows) of the grouts with and without IC.
Sustainability 10 03881 g005
Figure 6. Pull-off tensile stress at failure for the grouts with and without IC. Error bars indicate ± one standard deviation from the average of four specimens.
Sustainability 10 03881 g006
Figure 7. Phase distribution at the grout-concrete interface. (These plots are based on averaged measurements of four representative areas. The CoV was below 15%).
Sustainability 10 03881 g007
Figure 8. Water absorption in terms of degree of saturation against the square root of time in hours. Data points represent experimental data and lines represent a bi-linear fit model. Error bars represent the standard deviation of three specimens.
Sustainability 10 03881 g008
Figure 9. Formation Factor development as a function of age, obtained from the Cylinder Absorption Test. Error bars represent the standard deviation of three specimens.
Sustainability 10 03881 g009
Table 1. Mixture proportions of the grouts with and without IC (based on solid amount provided in one bag).
ComponentGrout Mixture Proportions, kg
ControlLWA (Prewetted)LWA (OD)
Solid23.023.023.0
LWA-4.35.9
Total Water 13.74.54.5
1 Total water includes both mixing and IC water.
Table 2. Fresh and mechanical properties of grouts with and without IC (Numbers in parentheses represent ± one standard deviation from the average of three specimens).
MixFlow, %Fresh Density, g/ccTime of Set, hMechanical Properties
1 Day3 Days7 Days28 Days
Control1002.224.0fc, MPa21.25 (0.16)37.02 (1.07)45.03 (0.49)54.06 (0.89)
ft, MPa2.79 (0.14)4.06 (0.46)3.68 (0.36)3.66 (0.21)
E, GPa20.58 (0.30)24.18 (0.22)27.38 (0.28)30.21 (0.24)
LWA (prewetted)752.024.2fc, MPa14.63 (0.31)23.78 (1.11)31.05 (0.38)40.96 (0.77)
ft, MPa2.08 (0.12)2.65 (0.21)3.07 (0.18)3.51 (0.16)
E, GPa14.20 (0.19)20.08 (0.24)21.63 (0.10)24.09 (0.05)
LWA (OD)751.984.5fc, MPa16.61 (0.88)25.85 (1.07)29.34 (0.32)37.57 (0.36)
ft, MPa1.92 (0.33)2.67 (0.59)2.86 (0.35)3.58 (0.33)
E, GPa16.24 (0.12)17.82 (0.16)21.59 (0.04)20.95 (0.38)
Table 3. Percentage of the ITZ length occupied by voids.
ControlLWA (Prewetted)LWA (OD)
Void, %7.13.64.2
S.D.2.83.94.4
Table 4. Results from absorption test used to estimate resistance to freeze/thaw damage described by Equation 3, with S c r i t assumed as 87%. A value of t c r i t is not shown for the Control mixture, as S n i c k is higher than S c r i t . (Numbers in parentheses represent ± one standard deviation from the average of three specimens).
Mixture S n i c k [%] S ˙ 2 [%/h1/2] t c r i t [days]
Control88
(0.97)
0.31
(0.018)
-
LWA (prewetted)77
(1.88)
0.38
(0.040)
27.8
(0.28)
LWA (OD)70
(1.92)
0.48
(0.035)
50.2
(0.69)

