Article

The Role of Climate Factors in Shaping China’s Crop Mix: An Empirical Exploration

1
School of Agriculture and Biology, Institute of New Rural Development, Shanghai Jiao Tong University, Shanghai 200240, China
2
Department of Agricultural Economics, Texas A&M University, College Station, TX 77843, USA
3
Institute for Sustainable Food Systems, University of Florida, Gainesville, FL 32611, USA
4
China Institute for Urban Governance, Shanghai Jiao Tong University, Shanghai 200030, China
*
Author to whom correspondence should be addressed.
Sustainability 2018, 10(10), 3757; https://doi.org/10.3390/su10103757
Submission received: 4 August 2018 / Revised: 14 October 2018 / Accepted: 16 October 2018 / Published: 18 October 2018
(This article belongs to the Section Sustainable Agriculture)

Abstract

:
A prominent agricultural adaptation to climate change consists in shifting crop mixes toward the poles or upward in elevation. This paper examines the extent to which climate factors have shifted regional crop mixes in China and forecasts how future crop mixes might change under selected climate scenarios. Using a data set that provides planted area shares for each crop in each mainland Chinese province from 2001 to 2013, we employ a fractional multinomial logit (FMLOGIT) model to examine the influence of climate on regional crop mixes under historical as well as future climate conditions. Results show that temperature increases are projected to raise the incidence of wheat and tubers while reducing that for rice and maize, which is conventional food security crops. Moreover, cash crops such as vegetables and orchards and fiber-producing crops will increase, whereas oil-bearing crops and specialty crops will decrease. This paper is the first of its kind to examine climate impacts on the regional portfolio of crop mixes across Mainland China. The findings have important implications for foreseeing needed efforts to maintain food production in the face of future climate change and pointing out cases where adaptation efforts may be desirable.

1. Introduction

Climate is a major factor in choice of crop mix and land use [1,2,3]. For example, rice is typically grown in hot and wet areas while wheat appears in cooler and drier areas [4,5]. Moreover, grass and grazing land dominate under very dry conditions [6,7]. Therefore, it is reasonable to expect that, as the climate changes, crop and land use mixes will also shift, and such shifts in turn will affect agricultural income and regional food security [8]. Additionally, the geographical movements of crop mixes may require changes in locations of storage, processing, roads, bridges, and intermodal grain terminals, among other items [9]. Understanding how climate factors have shaped crop mixes in the past and in turn projecting anticipated changes as the climate evolves can help inform agricultural research, infrastructure development, and trade needs. More directly, this study can also help issue early warnings on (1) places where adaptation efforts are needed, (2) types of adaptations to pursue, (3) future prospects for regional food production, and (4) changes in rural income potential.
There are two ways in which climate change will affect farmers’ land allocation for crop production. The root driver is associated with changes in crop yields, and most studies on climate change and crops in China typically focus on this. For example, Chen et al. (2016) recently examined climate change impacts on corn and soybean yields in China [10]. At the county-level, they found climate change negatively impacted corn and soybean yields both today and into the future. They also found that the effects of climate change on corn and soybean yields follow an inverse U shape, increasing up to a key temperature threshold and then decreasing thereafter, with thresholds of an average growing season temperature at 29 °C for corn and at 28 °C for soybeans. Similar thresholds have been found elsewhere in the United States: 29 °C for corn, 30 °C for soybeans, and 32 °C for cotton [11]. Wang et al. (2017) investigated the impacts of climate on Hunan Province crop yields, decomposing the effects into three components: trends, annual fluctuations, and extreme events [12]. They found all of these imposed significant impacts on crop yields, with the effects of climatic extreme events being the most negative.
The second channel is via socio-economic effects associated with biophysical changes in crop yields induced by climate factors. Chen et al. (2016) [10] estimated that climate change causes an economic loss in China’s corn and soybeans sectors that amounted to $820 million cumulatively (in Year 2009 $US dollars) during the period of 2001–2009. Heady and Fan (2008) [13] examined factors contributing to the 2005–2008 global food crisis, finding that weather shocks have played an important role in reducing wheat production in Australia, the United States, Russia, and Ukraine. Climate factors do impose an influence on the economic dimension of the agricultural sector. In turn, expecting yield changes and consequently economic losses by the farmers potentially leads to alterations in cropland use decisions [6,14]. For example, diversifying crop portfolios was found to be among shock-mitigating strategies for individual farmers in Southeast Asia [15].
In China, the crop planting decisions have been materially liberalized since the mid-1990s [16]. Comparing then and the mid-2000s, the effects of market liberalization on crop mix were found to be declining, suggesting that the rates of farmers’ participation in the liberalized crop markets had been increasingly homogeneous across regions [16]. Using village-level survey data covering three major cereal crops (rice, wheat, and corn) and two major non-cereal crops (soybeans and cotton), Pan et al. (2010) further suggest that crops not supported by government floor prices (namely, cotton and soybeans) deserve more attention by exporters abroad such as those in the United States, because the liberalization of their markets brings about greater trade implications. In addition to changes in market institutions, land has been found to be an increasingly high-elasticity factor for crop production in recent years in China [17], which means that the know-how of using land wisely is of increasing value. Thereupon, paying attention to cropland allocation between crops should be of interest for better agricultural land use decision-making and policy research.
Crop mix and climate change studies have been more frequent in the United States. A number of studies have shown that climate change has induced crop mix and land use changes [1,3,7,9,18]. However, studies of climate impacts on China’s crop mixes are limited. Recently, Tian et al. (2015) [19] explored effects of climate change on expanded cropping intensity opportunities, finding that it allows more areas to accommodate double- or triple-cropping. Wang et al. (2010) [14] examined climate effects on farmers’ crop choices using farm household survey data examining the probability of farmers’ choices over nine major crops across China. The Wang et al. (2010) study was limited in that the broader picture of the spatial differences in cropland allocations was not explicitly modeled, but rather derived from surveyed individual household choices, and their examining locations where meteorological data were available presents a sampling bias issue. Therefore, investigating cropland allocations with a comprehensive geographic coverage and projecting changes based on consistency of spatial units of input–output data, is desirable because this contributes to a better and perhaps more accurate understanding of cropland use.
The above leads to our research questions regarding how China’s regional crop mixes are influenced by climate factors and how they will respond to climate change. To investigate the question, this study first addresses the relationship between climate factors and crop mix quantitatively by controlling socioeconomic conditions. This study then projects the future portfolios of crop mix under alternative climate scenarios.

2. Research Method

To explore the influence of climate on crop mix, this study uses an econometric approach over historical data following Mu et al. (2013) [7], Cho and McCarl (2017) [1], and Wang et al. (2010) [14]. A fractional multinomial logit (FMLOGIT) model [20] is estimated to test the effect of climate on the probability of alternative crop land uses. Here we use this method for analyzing the planted area shares of crops at province level. We also use a functional form that allows identification of a nonlinear effect of climate variables on the share of crop land use. As shown in Equation (1), the conditional mean function shows that the probability of land used for a crop relative to other alternative crops is conditional on Xjkt:
E ( y i j t | X j k t ) = e x p ( f ( X j k t β i k ) ) / c = 1 C e x p ( f ( X j k t β c k ) ) ,   i , t
where i and c identify crop, of which there are C alternatives, j identifies region, t identifies year, k the alternative independent variables, and f ( X j k t β i k ) is the function to be estimated with β i k being the parameters. By construction, this form requires the sum of crop area shares to equal 1 in region j, in year t. Moreover, the probabilities must fall in between 0 and 1.
i y i j t = 1 ,   j , t
  y i j t [ 0 , 1 ] ,   i , j , t .
In estimation, this is a nonlinear model using pooled panel data. To remove difficulties with nonlinearities, we apply the Chamberlain–Mundlak approach discussed by Wooldridge (2009) [21]. This approach assumes that some explanatory variables are correlated with unknown or otherwise omitted items. Therefore, we estimate a fractional multinomial logit model with correlated random effects, in which the fixed effects estimator is computed as a pooled estimator, being captured by adding the time-averaged covariates as additional explanatory variables [21]. In this study, we use regional means of growing season average temperature and annual total precipitation as the additional independent climate variables.

3. Data

The data set used for estimation includes planted areas for all major crops/crop categories, year-round monthly temperature and monthly precipitation, as well as gross output value of farming at the province level. The data cover the period from 2000 to 2013. The majority of the data were drawn from the China Statistical Yearbooks of years 2000 to 2014 [22]. The pesticide data were drawn from the China Rural Statistical Yearbooks for the years 2001–2014 [23].
Considering the mediation of water storage in soil and that the adequacy of annual total precipitation is essential for year-round crop production [24], the variable “annual total precipitation” was used for this study. The difference between rainfed and irrigated agriculture also deserves attention, because climate change can present a substantial influence on the availability of water resources for agricultural use [14,25]. In this study, we took irrigated ratios as an instrument to account for that difference. Inputs such as fertilizer and pesticide usage are included for analysis, as China’s farmers had been found to increasingly rely on synthetic chemical inputs [26]. As for economic factors, not surprisingly, crop prices influence the economic viability and competitiveness of agricultural production. For example, government procurement prices for grain crops had significantly influenced China’s agricultural production [17]. Unfortunately, due to data limitation, crop-specific prices are not available for the analysis. Though on the other hand, as pointed out by Zhang and Fan (2001) [26], markets of agricultural inputs and outputs are usually heavily regulated in centrally planned economies, so the assumption of profit maximization may not be desirable for modeling crop production. Nevertheless, we take gross output value of farming into consideration to account for economic influence.
The dependent variables are the full set of crop planted area shares in terms of planted area, including rice, maize, wheat, soybeans, tubers, oilseeds, cotton, vegetables, orchards (such as apple, orange, pear, grape, and banana), fibers, and specialty crops (such as sugar crops, tobacco, and tea). The independent variables are as follows: (1) average growing season temperature; (2) annual total precipitation; (3) percent of cropland that is irrigated; (4) per hectare amount of pesticide used; (5) per hectare amount of fertilizer used; (6) per hectare revenue from cropping that reflect the general crop productivity and profitability; (7) the planted area index, with which we expect to pick up the scaling effects brought about by either increased machinery use or changes in labor productivity; (8) time trend, included in the equation for capturing the composite effects of other time-dependent items such as crop yield technological progress; (9) time-averaged climate variables, included to control for heterogeneity of unobservable county time-constant characteristics.
The data were transformed for use in the estimation as follows. Temperature was assumed to only be relevant during the growing season, so regional monthly averages from March to October in degrees Celsius was used. Note that, for simplicity of analysis, we used the months outside of the growing season of winter corn and soybeans in tropical and subtropical areas [10] as the growing season for all crops in all regions modeled in this study. We also hypothesized that total area planted in a region might influence crop mix, as larger areas mean greater probability for diversifying crops [15], plus we observed a variation in total acreage planted (see Table 1). To control for this, we constructed an index for total area planted by year relative to planting in the year 2000, with the index for Year 2000 equaling 100. To construct an indicator of land value, we divided gross output value of total regional crop production in Year 2000 Chinese yuan (RMB) by the total planted area across all crops to obtain the average revenue per planted ha. The composite effects including technical change and inflation were removed by dividing the average revenue per planted ha by indices of the gross output value of the farming sector in China relative to the year 2000 (China Statistical Yearbook 2014). The irrigation index, namely, the ratio of irrigated area over total planted area in the region for all crops, was used as well, considering that irrigation helps ease climate change impacts, as investigated in Chen et al. (2016) [10] and Gong (2018) [17]. To control for potential endogeneity caused by current values of per ha revenue, pesticide and fertilizer use, irrigated acres, and planted area index, we used the values of these variables in the previous year in the estimation model.
Definitions and summary statistics for all variables can be found in Table 1. For crop mix shares, the proportions of cereals (rice, maize, and wheat) are the largest, with those crops accounting for just about 50% of all planted area. Vegetable mean area share is 13.55%, with a relatively large range, indicating substantial regional disparity in its presence. Soybeans and other oil-bearing crops show large spreads across provinces with the maximum shares above 43% and minimums of 0%. Cotton shares’ large variation suggests regional heterogeneity as well, corresponding to that cotton production is spatially concentrated. For example, Xinjiang in Western China has 43% of its planted area being used for cotton. Similarly, specialty crops such as sugar crops are concentrated in South China, tea in the Southeast, and tobacco in Southwest China. Orchards also show regional patterns, with a relatively large mean level at 8.03%.
Table 1 presents data that contain rich information due to spatial and temporal variations. A few observations on the independent variables are relevant. Annual precipitation’s large variation implies regional disparity in the amounts of rain received. The planted area index ranges from 0.67 to 1.68, suggesting some regions experienced considerable planted area contraction or expansion. Farming value (gross output value of agriculture) per planted ha varies considerably across regions, ranging from 4.5 to 28.3 thousand yuan (in Year 2000 RMB).

4. Results and Discussion

4.1. Regression Results

With a group of 11 crops, Table 2 presents the estimation results for the crop area share equations. As the table shows, maize area share exhibits an ambivalently downward slope with growing season temperature, as indicated by the significantly negative coefficient of the quadratic term of temperature. Wheat and atypical food security crops such as tubers and oilseed crops, however, exhibit nonlinear relationships with growing season temperature in U shapes, with inflection points at 24.2, 31.8, and 28.3 °C, respectively. Despite the statistically significant positive coefficients of temperature’s quadratic terms, these high levels of inflection points imply that marginal increases deviating from current temperature levels will very likely decrease the incidences of these crops. In other words, major food security crops such as maize and wheat are likely to experience area share declines should temperature rise.
For cash crops, orchards show nonlinear relationships with temperature, where the squared term is positive and the linear term negative. With the inflection point at 33.2 °C, orchards may tend to decrease for a given increase in temperature, especially in warm regions such as South China. Vegetables, on the other hand, show a negative linear coefficient, implying that their area shares will shrink for a marginal increase in temperature. Therefore, increases in temperature may result in area share decreases for cash crops as well. Nevertheless, the coefficient of mean temperature is significantly positive for orchards. This implies that rises in mean temperature may outweigh marginal temperature increases in inducing changes in crop mixes, despite the fact that the mean temperature variable was introduced to capture regional unobservables.
Regarding precipitation effects, the share of soybeans area shows nonlinear relationships with annual total precipitation, where the linear term is negative and the square term positive, forming an inflection point at 134.1 cm. Other oil-bearing crops, tubers, and cash crops including vegetables and orchards, exhibit similar nonlinear patterns with annual total precipitation too, with inflection points at 125.6, 133.4, 136.1, and 141.4 cm. With the inflection points being above the average level of about 86.5 cm, these U-shaped nonlinear relationships may imply that marginal increases in precipitation will rather decrease the incidence of oil-bearing crops, cash crops, and tubers.
In terms of non-climatic factors, the estimated results show that tubers and oilseed crops’ shares have increased with vegetables decreasing, implying a trend of diversification of food security crops. For lagged planted area index (Year 2000 = 100), the results indicate that rice area share increases as planted land area increases, whereas wheat is the most negatively influenced. This perhaps reflects population-induced rises in food demand and implies that the expansion of planted area has largely involved rice production. For the lagged irrigated area share, cotton shows an unambiguously positive relationship. This probably corresponds to the prevailing dry area conditions for most cotton plantation in West China, which will require irrigation.
For chemical inputs, fertilizer appears to have positive contributing effects on maize and wheat area shares in particular. The effects of pesticides are mostly negative. However, cotton and rice show positive correlations, suggesting their relatively large reception of pesticide usage.
Regarding the lagged per ha farming output value, major cereal crop, maize, and cash crops including vegetables and orchards show positive relationships, indicating that producing these crops involves comparatively high economic revenues. Such production typically incurs on higher valued land. On the other hand, wheat and soybeans show negative relationships, implying their generally inferior economic competitiveness compared with other crops.
This is because, in addition to changes in annual climate variables, shifts in mean climate conditions are also important and perhaps more pronounced influencing factors.

4.2. Marginal Effects

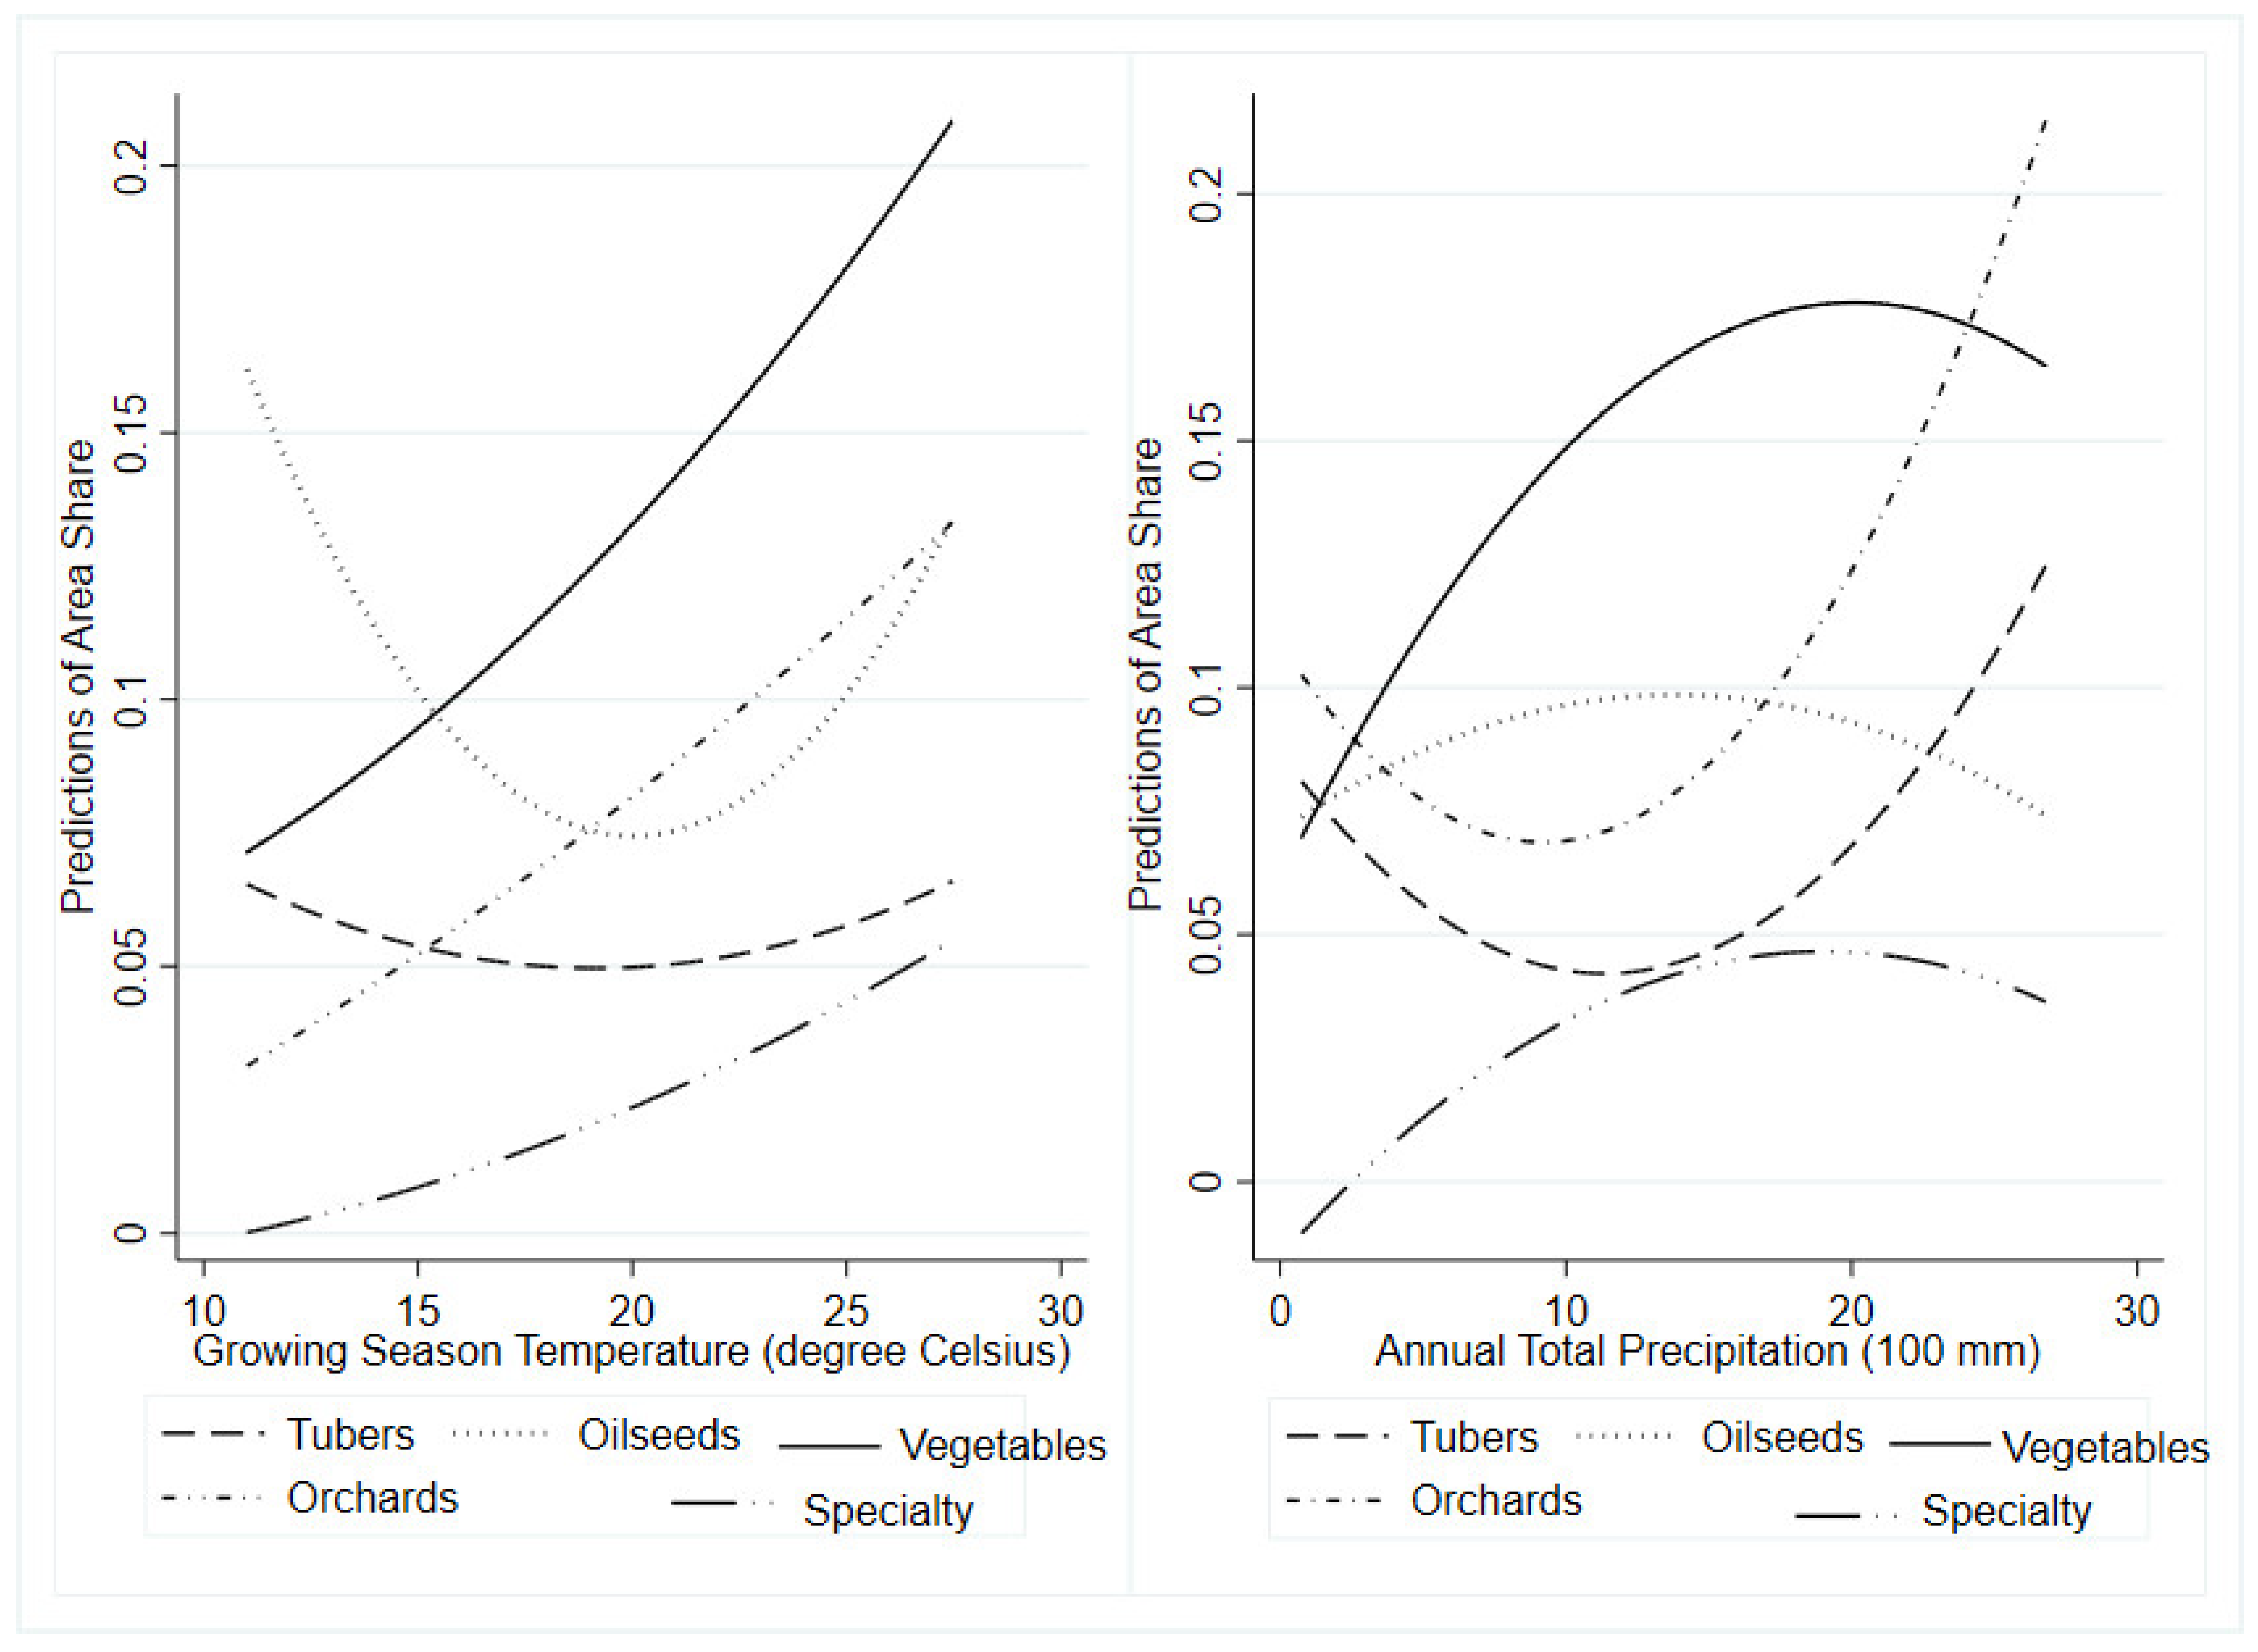
To examine the coefficient magnitude, the marginal effects of growing season temperature and annual total precipitation on planted area shares were derived for each crop modeled. Table 3 reports the marginal effects evaluated at the means of each explanatory variable. Figure 1 and Figure 2 demonstrate the effects of climate variables on crop area shares evaluated with non-climate variables being held at their means.
Figure 1 presents the marginal effects of growing season temperature and annual total precipitation on major crop area shares, including rice, wheat, maize, soybean, and cotton. As the temperature rises, the area share of rice increases, and this increase is accompanied by decreases in maize, wheat, and soybeans. Similarly effects of annual total precipitation are found for these five major crops.
Figure 2 show the marginal effects of growing season temperature and annual total precipitation on other crop area shares. As temperature goes up, tubers and oilseeds show a slight U shape. Cash crops such as vegetables and orchards are increasing, and specialty crops also show an upward slope. As for the marginal effects of annual total precipitation on crop area shares, tubers and orchards turn out to be positively affected crops as the total precipitation increases. On the other hand, annual total precipitation has slightly inverted U-shape effects on vegetables, oilseeds, and specialty crops.
Note that these changes may be more relevant to agricultural production in Central China, because of the generally mid-level climate and socioeconomic conditions this area has. Put another way, the marginal effects reported here may be considered as the effects valid for a virtual region, the measures of whose characteristics are the means of the independent variables modeled in this study. Therefore, one should note the limitations of these marginal effects, and they may hide the underlying differences between regions. However, these marginal effects offer a broad-brush glimpse into the effects of climate variables on crop mix.

4.3. Future Scenarios

The Paris Agreement under the United Nations Framework on Climate Change Convention (UNFCCC) reached in 2015 explicitly states two temperature goals: (1) to hold the increase in the global average temperature to well below 2 °C above pre-industrial levels by 2100 and (2) to pursue efforts to limit the temperature increase to 1.5 °C [27]. Research works prior to and post the Paris Agreement have often examined the temperature goals of 1.5, 2, and 3 °C [28,29,30]. Here we project the changes in area shares under three alternative scenarios in this study—+0.72, +1.22, and +2.22 °C—to represent global warming scenarios of +1.5 (SR1), +2.0 (SR2), and +3.0 °C (SR3), above the 20th century average. These numbers were used because historical temperatures have already increased by a total of 0.78 °C (0.72–0.85 °C, 90% confidence interval) between the period of 1850–1900 and the period of 2003–2012 [29].
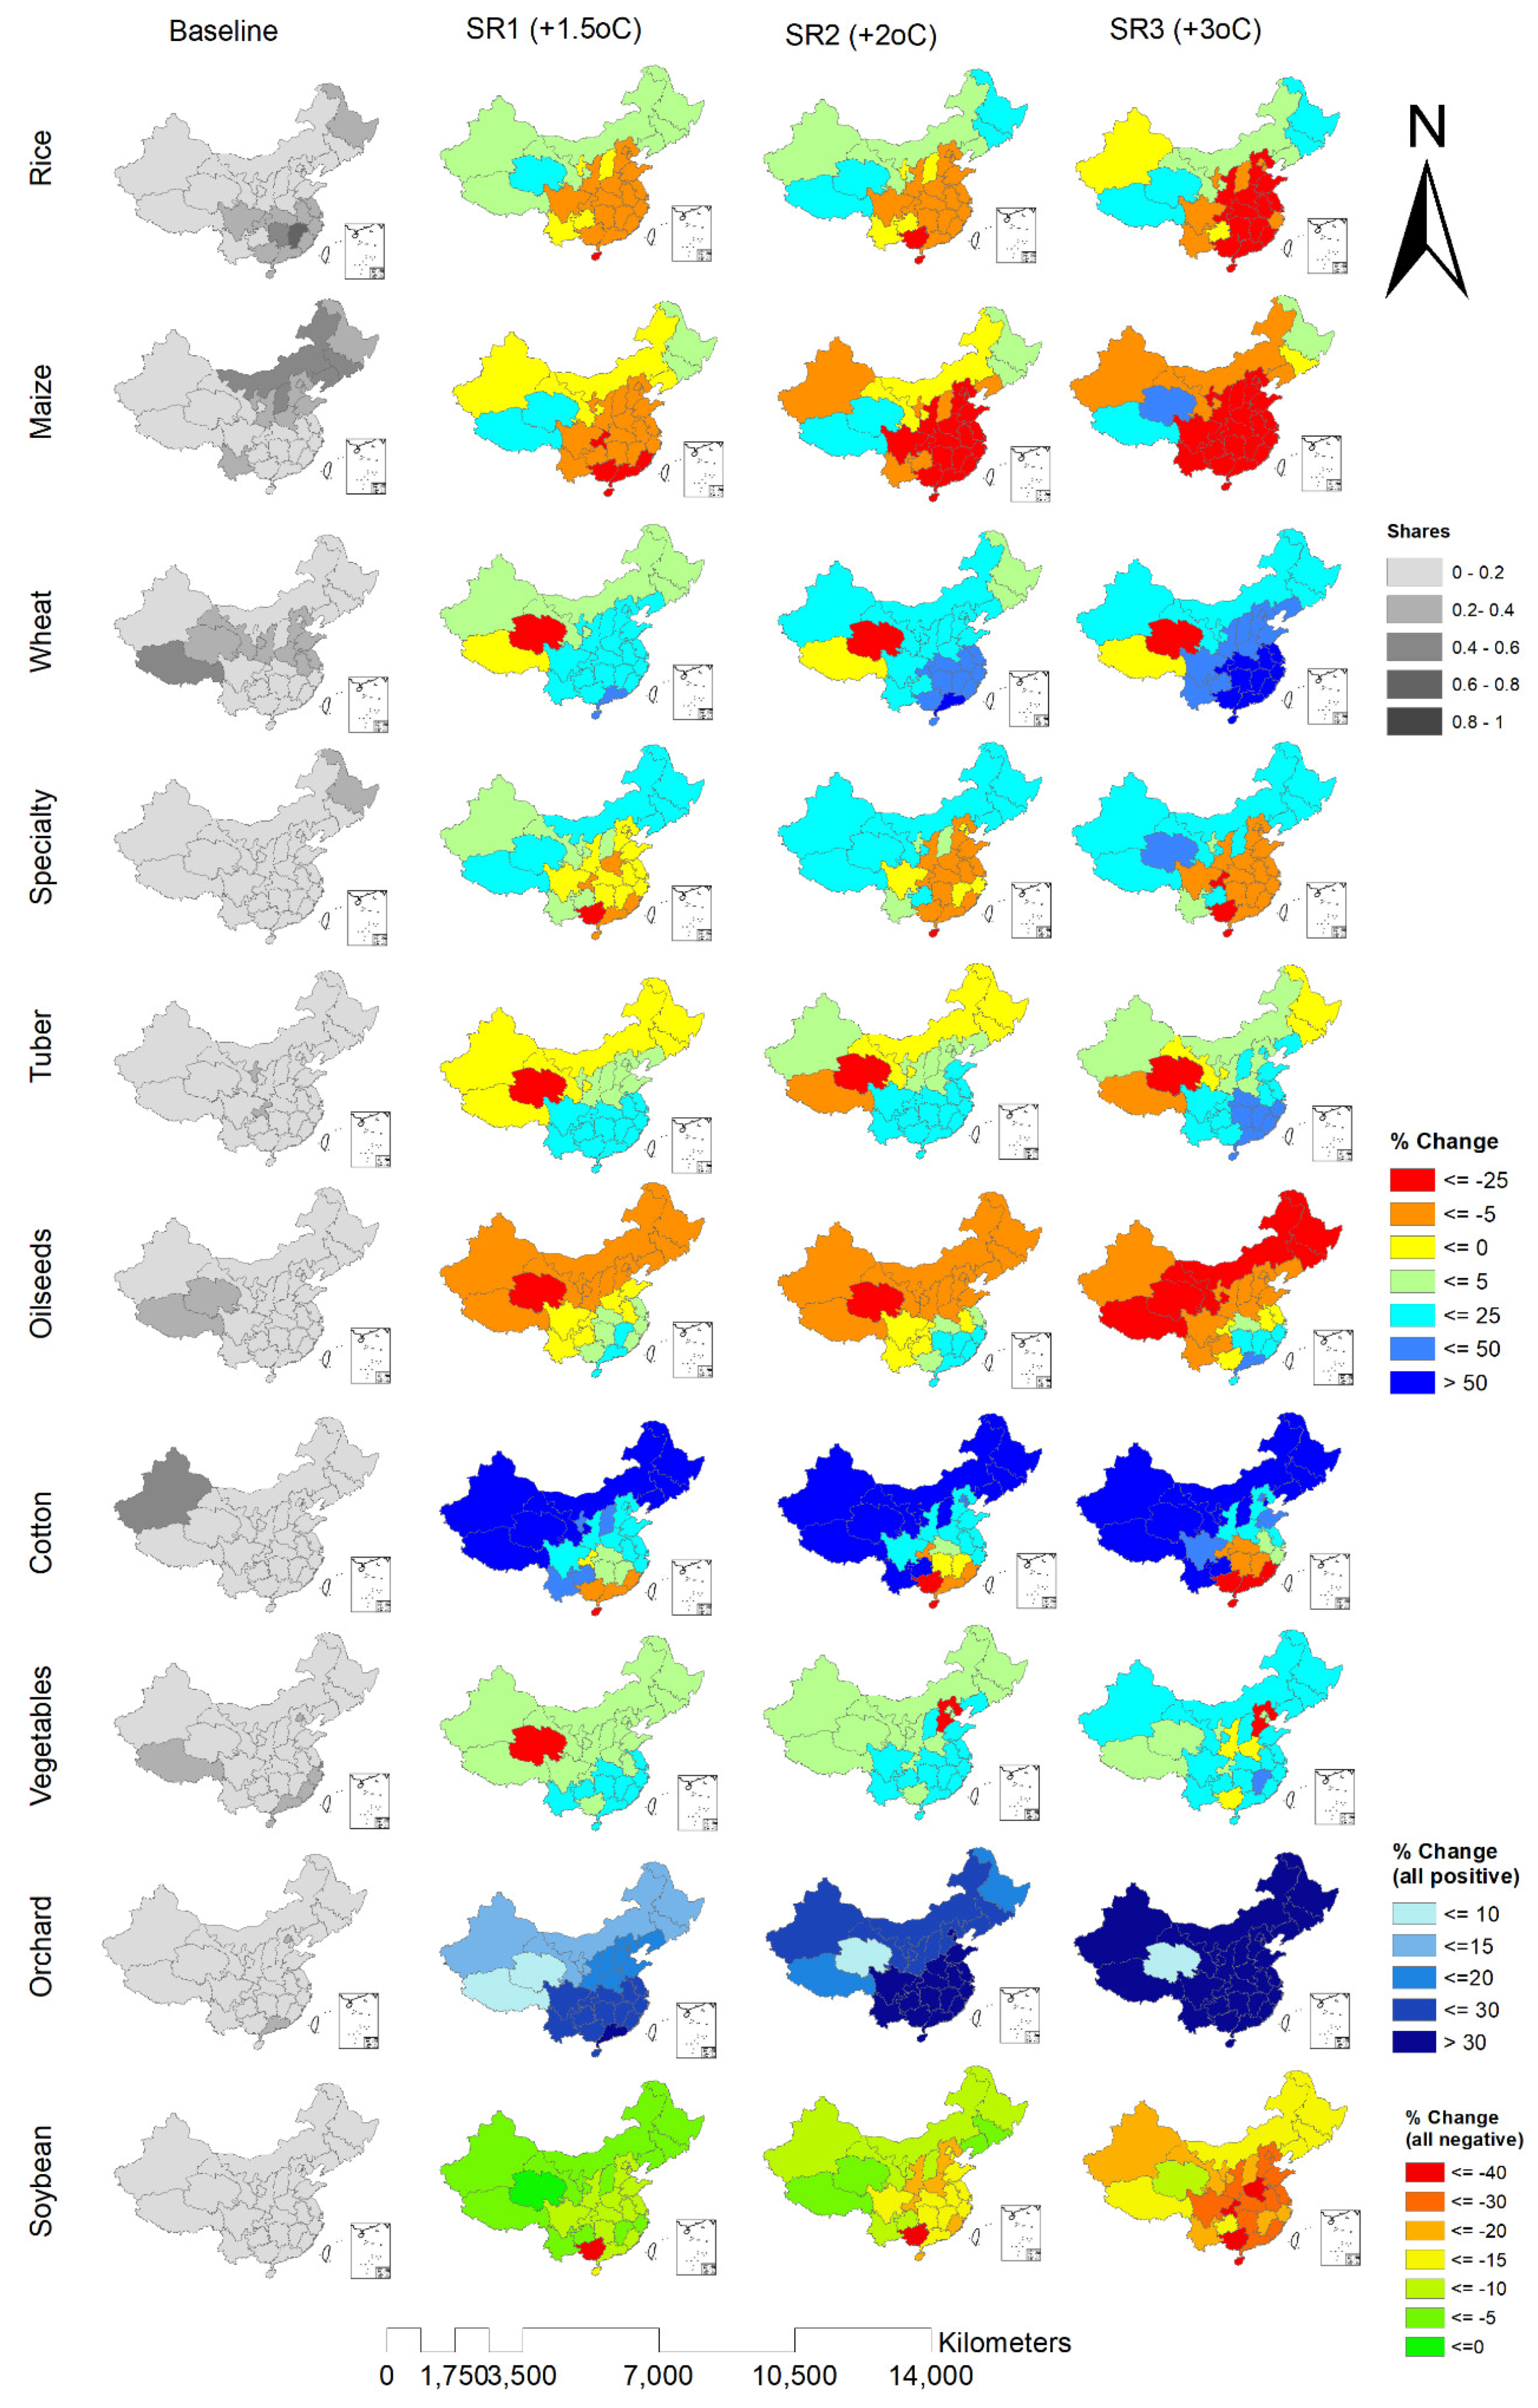
Figure 3 presents the changes in projected crop area shares under those three scenarios relative to the baseline with climate change at the historical mean covering 2003–2012. Overall, crops exhibiting the largest absolute changes are rice, maize, wheat, vegetables, and orchards, with the first two showing decreases and the last three showing increases. Magnitudes of the changes also increase as the degree of warming increases. For example, under the SR1 +1.5 °C scenario, the projected mean rice area share goes down by 1.51 percentage points, and this decrease rises to 5.11 percentage points under the SR3 +3.0 °C scenario. Orchards, on the other hand, increase, with the projected mean increasing by an average of 1.62 percentage points under the SR1 +1.5 °C scenario to 5.97 percentage points under the SR3 +3.0 °C scenario. One should note that these projections are different from the marginal effects discussed above, as the projections are region-specific while the marginal effects depict effects for a virtual region with mid-level conditions in all non-climate aspects considered in this study. Therefore, to gain an understanding of how temperature increases impact crop mix, the predicted projections are more relevant for informing the changes.
As shown in Figure 3, in general, vegetables and orchards are projected to experience expansions, especially in southern regions that are currently major rice-producing regions such as Guangdong, Jiangxi, and Zhejiang provinces. This indicates that vegetables and orchards are among the preferred plantation choices under warming scenarios, compared with rice. Among the major cereal crops, wheat shares will increase, implying its advantage in being selected under warming than rice and maize. Similarly, tubers, as non-cereal food crops, will see area share increases in most regions except a few such as Qinghai Province in Northwest China, suggesting that tubers are relatively more heat-tolerant.
The results on rice may be counterintuitive, because the marginal effects of growing season temperature on rice area share evaluated at the 2001–2013 means are positive and exhibit an upward slope, yet here the shares are projected to decrease under future warming scenarios. This is because vegetables and orchards can compete for land with rice. These changes are in accordance with Wang et al. (2010)’s [14] findings: while the temperature effects on choosing rice had been found positive, the simulation of crop choices under climate impacts yielded that the probability of choosing rice had decreased in most climate scenarios.
Overall, this study projects that warming will decrease the area shares of cereals including rice and maize, oil-bearing crops including soybeans and oilseed crops, and specialty crops. In the meantime, the area shares of food crops including wheat and tubers, fiber-producing crops including cotton and other fiber crops, and cash crops such as vegetables and orchards will increase. In addition, this future projection does not take into account changes in other factors such as irrigation capacity, fertilizer use efficiency, and water resources that are typically seen in integrated assessment modeling, which is different from the approach used in this paper.

5. Conclusions

Considering key food items, we find increases in temperature lead to increases in wheat and tubers, and decreases in rice and maize. For oil-bearing crops, soybean area shares should decrease under higher temperature scenarios, while oilseed crops may increase in some regions. In brief, temperature has varied effects on both staples and oil-bearing crops.
Turning to vegetables and orchards, increases in temperature were found to increase their area shares, and the marginal effects of precipitation on orchards are positive. Moreover, vegetables showed significantly positive relationships with the lagged farming revenues, suggesting its prevalence among the preferred planting choices in regions with more affluent farming sectors. Not surprisingly, vegetable production is comparatively more popular in developed regions in China, such as the Yangtze River Delta region in East China, as discussed in Ji et al. (2018) [31]. Orchards also appear to be more likely present in regions with higher farming revenues, such as Guangdong Province in South China.
For fiber crops, higher temperatures increase their area shares in general. Moreover, though cotton production largely occurs in drier regions such as Xinjiang Uygur Autonomous Region in West China, higher levels of irrigated coverage will benefit its area shares. So are other fiber crops with higher levels of irrigated coverage.
The results suggest that climate has influenced the past and will influence future crop mix. In particular, future projections show that increases in temperature raise the area shares of wheat, vegetables, and orchards while decreasing rice and maize. This study hence infers that, under future climate change when greater multi-cropping possibility arises [19], wheat and tuber crops are likely to expand should no intervention take place, whereas rice may not step in as an alternative. In other words, within food security crops, the climate impacts on area shares will vary by crop and possibly be in opposite directions.
At the individual level, informing farmers about the anticipated changes in crop mix for a given region can help raise farmers’ awareness of, and/or change their perceptions about, climate change impacts on agriculture. Moreover, understanding the directions and/or magnitudes of the changes in crop mix can help farmers make ex-ante risk management strategies related to land use accordingly [15]. As pointed out in Cho and McCarl (2017) [1], the estimates of climate impacts on crop mix can be used by farmers to make future plans on cropland allocations. Furthermore, farmers may also consider to adopt new crop varieties that can survive and/or thrive under new climates [14].
At the regional level, geographical patterns of crop production matter because they could be used to discern potential regional imbalances between supply and demand of agricultural products [31] and consequently food security at the regional level. Furthermore, exploring geographical patterns can help answer where production of certain crops should be expanded and where they should be reduced, for “optimizing” resources use and “meeting” food security goals simultaneously at the regional level [31].
Therefore, an understanding of climate impacts on crop mix can benefit both local and regional adaptation.

6. Future Research

Our research is subject to the following limitations. Firstly, water resources were not considered and may become a serious constraint for China’s agriculture [5,32]. Second, we made no attempt to separate the effects on irrigated and dryland cropping, where the former is less vulnerable to climate change. Third, CO2 fertilization effects were not taken into account, especially considering that recent research found that the CO2 fertilization effects may outweigh the negative effects of changes in climate [25]. Note that CO2 fertilization effects indicate that different CO2 levels will result in yield differences, because crops respond to CO2 through photosynthetic mechanisms and the strengths of CO2 physiological effects also vary by crop type [25,33]. Fourth, we did not consider soil quality. Fifth, we did not include time- and crop-varying economic returns. Sixth, when modeling future scenarios, how water resources, irrigation capacity, etc. will change in conjunction with climate change were not considered.
Future research could be carried out to address the limitations mentioned above, for more accurate and nuanced estimation and projections. The study could be also extended to generate insights into issues beyond agricultural production, such as rural transportation infrastructure, urbanization effects, trade positions, and farmer income support policies.
Rural transportation infrastructure and urban population can influence the restructuring process of crop production, as they indicate the conditions of market access and demand [31]. How current regional crop mixes have reflected the existing conditions of demand and market access and what the future crop mix changes will mean to those conditions are thus interesting for further examination. Regarding trade, understanding how crop mix will change shall help predict China’s trade positions on various kinds of crops, considering that a small change in crop production in China can possibly result in significant changes in world crop market [26]. Using crop mix information to project trade positions therefore bears research and policy interests too.
In addition, exploring the climate impacts on crop mix may benefit other scientific endeavors, as they may be used to inform integrated assessment modeling of the human-earth systems, nutrients cycle modeling, and projections of adaptation and/or mitigation activities on land and other natural resources [33].

Author Contributions

Y.W.Z., J.E.M., and M.M. conceived and designed the study; B.A.M. advised on the design of the study; Y.W.Z. drafted the paper; J.E.M. and B.A.M. made substantial and essential edits to the paper; M.M. conducted a literature review on food security and contributed to analyses of results; X.G. and Z.C. reviewed literature on agricultural land use in China; Y.Z. reviewed the contents related to crop science; Z.C. and Q.L. reviewed literature on agricultural economic competitiveness and regional distributions of crops for this paper.

Funding

This research was funded by the New Faculty Start-up Grant under the Fundamental Research Funds for the Central Universities (No. 16X100040010) and Agri-X Project (No. 2016004) at Shanghai Jiao Tong University, and the National Natural Science Foundation of China (No. 71673184). And the APC was funded by the New Faculty Start-up Grant under the Fundamental Research Funds for the Central Universities (No. 16X100040010) at Shanghai Jiao Tong University. The earlier work of this study received valuable feedbacks from the audience at the Agricultural & Applied Economic Association’s annual meeting, Boston, Massachusetts, USA, 31 July–2 August 2016.

Conflicts of Interest

The authors declare no conflict of interest.

References

  1. Cho, S.J.; McCarl, B.A. Climate change influences on crop mix shifts in the United States. Sci. Rep. 2017, 7, 40845. [Google Scholar] [CrossRef] [PubMed] [Green Version]
  2. Mu, J.E.; McCarl, B.A.; Sleeter, B.; Abatzoglou, J.T.; Zhang, H. Adaptation with climate uncertainty: An examination of agricultural land use in the United States. Land Use Policy 2018, 77, 392–401. [Google Scholar] [CrossRef]
  3. Mu, J.E.; Sleeter, B.M.; Abatzoglou, J.T.; Antle, J.M. Climate impacts on agricultural land use in the USA: The role of socio-economic scenarios. Clim. Chang. 2017, 144, 329–345. [Google Scholar] [CrossRef]
  4. Tong, C.; Hall, C.A.; Wang, H. Land use change in rice, wheat and maize production in China (1961–1998). Agric. Ecosyst. Environ. 2003, 95, 523–536. [Google Scholar] [CrossRef]
  5. Xiong, W.; Holman, I.; Lin, E.; Conway, D.; Jiang, J.; Xu, Y.; Li, Y. Climate change, water availability and future cereal production in China. Agric. Ecosyst. Environ. 2010, 135, 58–69. [Google Scholar] [CrossRef]
  6. Mendelsohn, R.; Nordhaus, W.D.; Shaw, D. The Impact of Global Warming on Agriculture: A Ricardian Analysis. Am. Econ. Rev. 1994, 84, 753–771. [Google Scholar]
  7. Mu, J.E.; McCarl, B.A.; Wein, A.M. Adaptation to climate change: Changes in farmland use and stocking rate in the U.S. Mitig. Adapt. Strateg. Glob. Chang. 2013, 18, 713–730. [Google Scholar] [CrossRef]
  8. Alexander, P.; Rounsevell, M.D.A.; Dislich, C.; Dodson, J.R.; Engström, K.; Moran, D. Drivers for global agricultural land use change: The nexus of diet, population, yield and bioenergy. Glob. Environ. Chang. 2015, 35, 138–147. [Google Scholar] [CrossRef] [Green Version]
  9. Attavanich, W.; McCarl, B.A.; Ahmedov, Z.; Fuller, S.W.; Vedenov, D.V. Effects of climate change on US grain transport. Nat. Clim. Chang. 2013, 3, 638–643. [Google Scholar] [CrossRef] [Green Version]
  10. Chen, S.; Chen, X.; Xu, J. Impacts of climate change on agriculture: Evidence from China. J. Environ. Econ. Manag. 2016, 76, 105–124. [Google Scholar] [CrossRef]
  11. Schlenker, W.; Roberts, M.J. Nonlinear temperature effects indicate severe damages to U.S. crop yields under climate change. Proc. Natl. Acad. Sci. USA 2009, 106, 15594–15598. [Google Scholar] [CrossRef] [PubMed] [Green Version]
  12. Wang, Z.; Shi, P.; Zhang, Z.; Meng, Y.; Luan, Y.; Wang, J. Separating out the influence of climatic trend, fluctuations, and extreme events on crop yield: A case study in Hunan Province, China. Clim. Dyn. 2017. [Google Scholar] [CrossRef]
  13. Headey, D.; Fan, S. Anatomy of a crisis: The causes and consequences of surging food prices. Agric. Econ. 2008, 39, 375–391. [Google Scholar] [CrossRef]
  14. Wang, J.; Mendelsohn, R.; Dinar, A.; Huang, J. How Chinese Farmers Change Crop Choice to Adapt to Climate Change. Clim. Chang. Econ. 2010, 1, 167–185. [Google Scholar] [CrossRef]
  15. Nguyen, T.T.; Nguyen, L.D.; Lippe, R.S.; Grote, U. Determinants of Farmers’ Land Use Decision-Making: Comparative Evidence from Thailand and Vietnam. World Dev. 2017, 89, 199–213. [Google Scholar] [CrossRef]
  16. Pan, S.; Malaga, J.; He, X. Market liberalization and crop planting decision: A case of China. China Agric. Econ. Rev. 2010, 2, 240–250. [Google Scholar] [CrossRef]
  17. Gong, B. Agricultural reforms and production in China: Changes in provincial production function and productivity in 1978–2015. J. Dev. Econ. 2018, 132, 18–31. [Google Scholar] [CrossRef]
  18. Reilly, J.; Tubiello, F.; McCarl, B.; Abler, D.; Darwin, R.; Fuglie, K.; Hollinger, S.; Izaurralde, C.; Jagtap, S.; Jones, J.; et al. Agriculture and Climate Change: New Results. Clim. Chang. 2003, 57, 43–67. [Google Scholar] [CrossRef]
  19. Tian, Z.; Liang, Z.; Sun, L.; Zhong, H.; Qiu, H.; Fischer, G.; Zhao, S. Agriculture under Climate Change in China: Mitigate the Risks by Grasping the Emerging Opportunities. Hum. Ecol. Risk Assess. Int. J. 2015, 21, 1259–1276. [Google Scholar] [CrossRef]
  20. Murteira, J.M.R.; Ramalho, J.J.S. Regression Analysis of Multivariate Fractional Data. Econ. Rev. 2016, 35, 515–552. [Google Scholar] [CrossRef]
  21. Correlated Random Effects Models with Unbalanced Panels. Available online: https://www.google.com/url?sa=t&rct=j&q=&esrc=s&source=web&cd=1&ved=2ahUKEwiqtI-jwIzeAhWEZt4KHbN-A1cQFjAAegQICBAC&url=http%3A%2F%2Fecon.msu.edu%2Ffaculty%2Fwooldridge%2Fdocs%2Fcre1_r4.pdf&usg=AOvVaw1fXfCahp7Fk-h-Jb1V1ot2 (accessed on 29 January 2018).
  22. National Bureau of Statistics of China. China Statistical Yearbook (Multiple Years); China Statistics Press: Beijing, China, 2000–2014. Available online: http://www.stats.gov.cn/enGliSH/Statisticaldata/AnnualData/ (accessed on 13 April 2016).
  23. National Bureau of Statistics of China. China Rural Statistical Yearbook (Multiple Years); China Statistics Press: Beijing, China, 2001–2014. Available online: http://tongji.cnki.net/kns55/navi/HomePage.aspx?id=N2017030076&name=YMCTJ&floor=1 (accessed on 13 April 2016).
  24. Zhang, D.; Yao, P.; Na, Z.; Cao, W.; Zhang, S.; Li, Y.; Gao, Y. Soil Water Balance and Water Use Efficiency of Dryland Wheat in Different Precipitation Years in Response to Green Manure Approach. Sci. Rep. 2016, 6. [Google Scholar] [CrossRef] [PubMed]
  25. Calzadilla, A.; Rehdanz, K.; Betts, R.; Falloon, P.; Wiltshire, A.; Tol, R.S.J. Climate change impacts on global agriculture. Clim. Chang. 2013, 120, 357–374. [Google Scholar] [CrossRef] [Green Version]
  26. Zhang, X.; Fan, S. Estimating Crop-Specific Production Technologies in Chinese Agriculture: A Generalized Maximum Entropy Approach. Am. J. Agric. Econ. 2001, 83, 378–388. [Google Scholar] [CrossRef]
  27. Schleussner, C.-F.; Lissner, T.K.; Fischer, E.M.; Wohland, J.; Perrette, M.; Golly, A.; Rogelj, J.; Childers, K.; Schewe, J.; Frieler, K.; et al. Differential climate impacts for policy-relevant limits to global warming: The case of 1.5 °C and 2 °C. Earth Syst. Dyn. 2016, 7, 327–351. [Google Scholar] [CrossRef] [Green Version]
  28. Knutti, R.; Rogelj, J.; Sedláček, J.; Fischer, E.M. A scientific critique of the two-degree climate change target. Nat. Geosci. 2016, 9, 13–18. [Google Scholar] [CrossRef] [Green Version]
  29. Rogelj, J.; Luderer, G.; Pietzcker, R.C.; Kriegler, E.; Schaeffer, M.; Krey, V.; Riahi, K. Energy system transformations for limiting end-of-century warming to below 1.5 °C. Nat. Clim. Chang. 2015, 5, 519–527. [Google Scholar] [CrossRef]
  30. Mendelsohn, R. The Impact of Climate Change on Agriculture in Asia. J. Integr. Agric. 2014, 13, 660–665. [Google Scholar] [CrossRef]
  31. Ji, L.; You, L.; See, L.; Fritz, S.; Li, C.; Zhang, S.; Li, G. Spatial and temporal changes of vegetable production in China. J. Land Use Sci. 2018, 1–14. [Google Scholar] [CrossRef]
  32. Tao, F.; Yokozawa, M.; Hayashi, Y.; Lin, E. Future climate change, the agricultural water cycle, and agricultural production in China. Agric. Ecosyst. Environ. 2003, 95, 203–215. [Google Scholar] [CrossRef]
  33. Rosenzweig, C.; Ruane, A.C.; Antle, J.; Elliott, J.; Ashfaq, M.; Chatta, A.A.; Ewert, F.; Folberth, C.; Hathie, I.; Havlik, P.; et al. Coordinating AgMIP data and models across global and regional scales for 1.5 °C and 2.0 °C assessments. Philos. Trans. R. Soc. Math. Phys. Eng. Sci. 2018, 376, 20160455. [Google Scholar] [CrossRef] [PubMed]
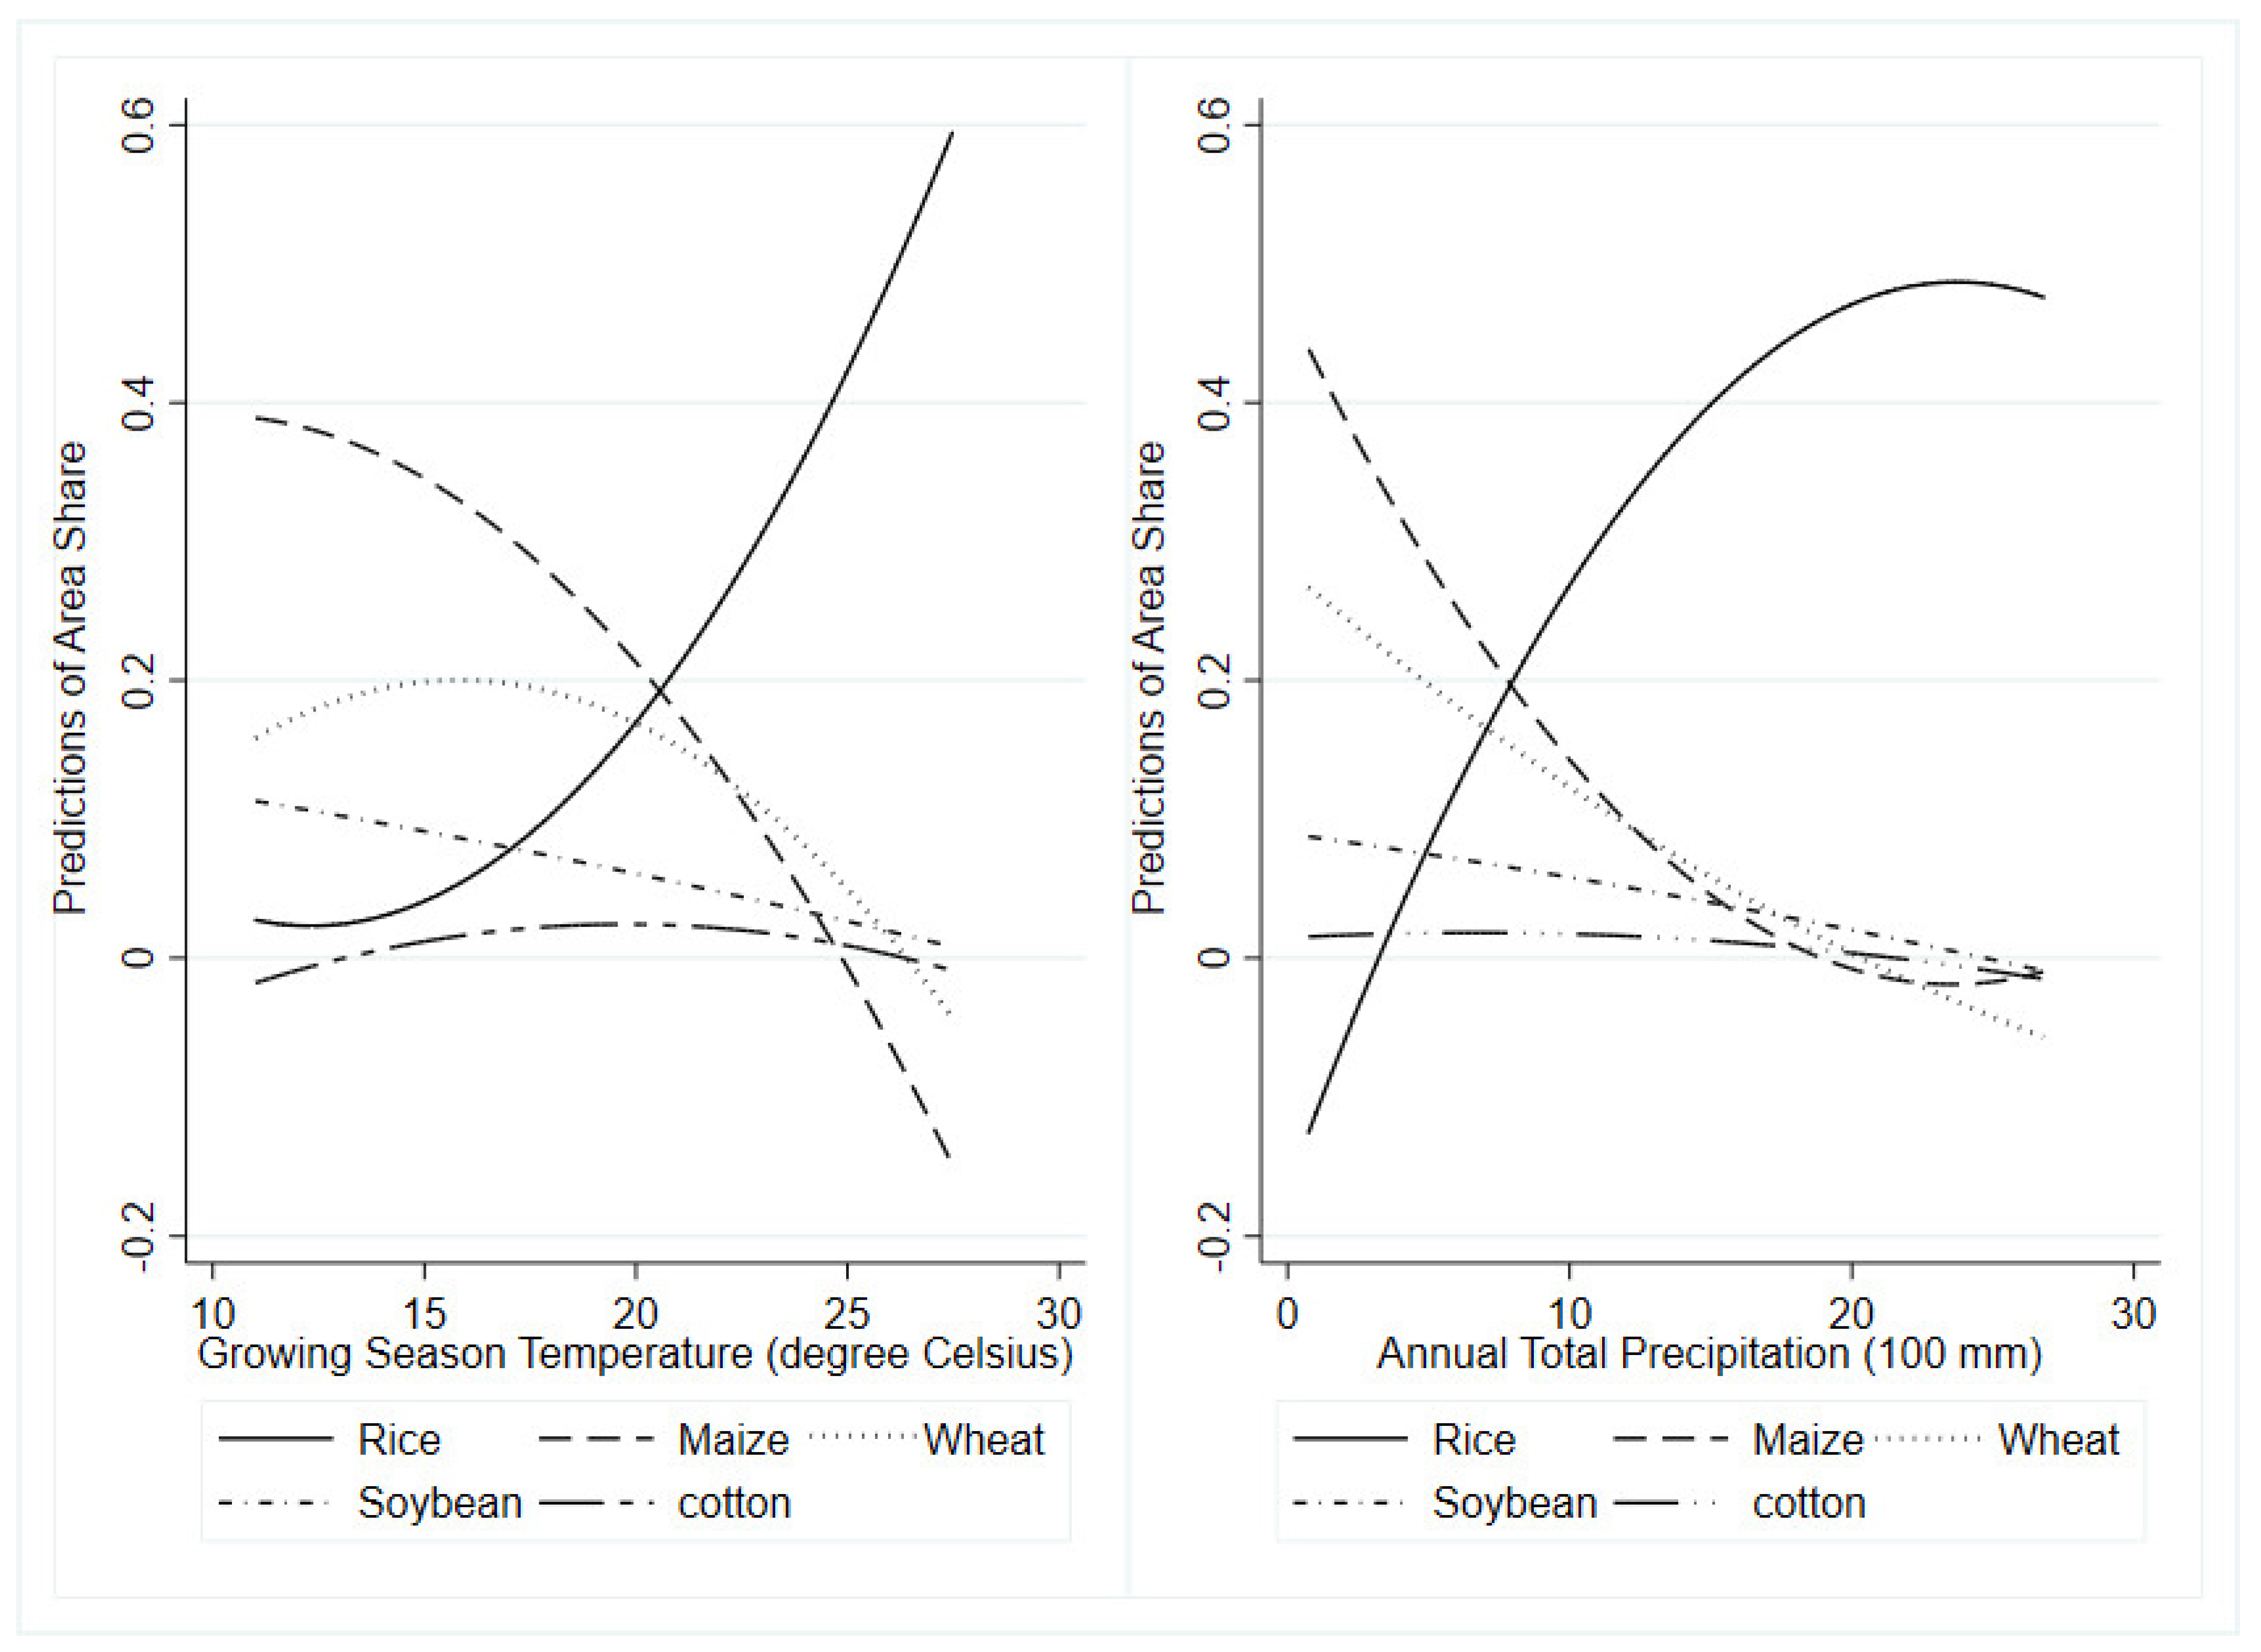
Figure 1. Marginal effects of growing season temperature and annual total precipitation on major crop area shares. Data: authors’ Calculations.
Sustainability 10 03757 g001
Figure 2. Marginal Effects of Growing Season Temperature and Annual Total Precipitation on Other Crop Area Shares. Data: Authors’ calculations.
Sustainability 10 03757 g002
Figure 3. Changes in crop area shares under future warming scenarios. Note: Orchard and soybean have their own legends on the right hand side. All other cases should follow the other two main legends. Data: authors’ calculations.
Sustainability 10 03757 g003
Table 1. Summary statistics for the data used (N = 403).
Explanatory VariablesVariable DescriptionsMeanStd. DevMinMax
GrsAvg Average daily temperature for growing season (March to October), in degrees Celsius19.6413.91611.01327.475
Precip Total annual precipitation, in millimeters865.400502.20074.9002678.900
PlantedScale.lag The ratio of planted area in Year t over planted area in Year 2000 0.9830.1210.6661.680
IrrigRate.lagLagged term of the ratio of irrigated area over planted area0.3970.1730.1491.000
Pesticide.lag Lagged term of pesticide usage in kilograms per ha of planted area10.1737.3981.57151.944
Fertilizer.lag Lagged term of fertilizer usage measured in kilograms of nutrients per ha of planted area307.94095.010110.720561.110
FarmRev.lag Lagged term of gross output value of farming per planted ha in 1K yuan (2000 RMB) per ha of planted area12.1785.4164.50228.313
Time TrendTime trend, with Year 2001 =1, Year 2002 =2, …, and Year 2013 = 137.0003.7461.00013.000
meanGrsAverage mean temperature across all years, in degrees Celsius19.6413.87711.33926.786
meanPrepAverage total precipitation across years, in millimeters865.400456.900192.4001900.300
Dependent Variables: Crop Share Proportions
TubersPlanted area shares for tuber crops0.06730.06210.00150.2264
RicePlanted area shares for rice0.17810.16500.00000.6305
WheatPlanted area shares for wheat0.14390.12550.00000.5275
MaizePlanted area shares for maize0.17320.15350.00000.6528
SoybeansPlanted area shares for soybeans0.06850.06840.00000.4270
OilsPlanted area shares for non-soybeans oilseed crops0.09310.07220.00380.3985
CottonPlanted area shares for cotton0.02950.06490.00000.4339
FibersPlanted area shares for non-cotton fiber crops0.00120.00210.00000.0137
SpecialPlanted area shares for specialty crops (sugar crops, tea, and tobacco)0.02940.04170.00000.1882
VegePlanted area shares for vegetables0.13550.07670.01550.4175
OrchardsPlanted area shares for orchards0.08030.06200.00290.2444
Note: Except that the data on pesticides comes from the China Rural Statistical Yearbooks (2001–2014), all data comes from China Statistical Yearbooks (2000–2014). The pesticide variable refers to the raw commodity masses of the pesticide mix (insecticide, herbicide, fungicide, etc.).
Table 2. Estimated coefficients of crop-mix land use shares.
VariablesRiceMaizeWheatSoybeansTubersOil SeedsCottonVegetablesOrchardsSpecialties
GrsAvg0.1580.484−0.722 **−0.134−0.680 **−0.765 ***1.418 ***−0.475 *−0.771 ***0.019
(0.265)(0.297)(0.319)(0.269)(0.277)(0.273)(0.387)(0.275)(0.263)(0.356)
GrsAvg2−0.008−0.023 ***0.015 **−0.0020.011 *0.013 **−0.041 ***0.0050.012 *−0.006
(0.006)(0.007)(0.007)(0.006)(0.006)(0.006)(0.010)(0.006)(0.006)(0.009)
Precip−0.071−0.0870.042−0.161 *−0.438 ***−0.183 **−0.076−0.275 ***−0.486 ***−0.100
(0.092)(0.103)(0.095)(0.093)(0.098)(0.090)(0.095)(0.090)(0.094)(0.109)
Prep20.0030.001−0.0050.006 **0.016 ***0.007 **0.0030.010 ***0.017 ***0.005
(0.003)(0.004)(0.003)(0.003)(0.003)(0.003)(0.003)(0.003)(0.003)(0.003)
IrrigRate.lag−2.633 ***−5.406 ***−1.478−3.531 ***−7.108 ***−1.645 *5.209 ***−2.393 **−3.606 ***−7.275 ***
(0.874)(0.888)(1.025)(0.902)(0.991)(0.971)(0.919)(1.007)(0.854)(0.878)
Time Trend0.046 **0.0350.052 *0.0370.101 ***0.069 ***0.074 ***0.0270.0330.073 **
(0.023)(0.026)(0.028)(0.023)(0.029)(0.026)(0.028)(0.026)(0.028)(0.031)
Pesticide.lag−0.064 ***−0.101 ***−0.058 **−0.050 **−0.092 ***−0.057 ***0.036−0.083 ***−0.092 ***−0.088 ***
(0.020)(0.022)(0.023)(0.020)(0.023)(0.021)(0.025)(0.021)(0.021)(0.021)
Fertilizer.lag0.068 ***0.127 ***0.105 ***0.069 ***0.050 ***0.088 ***0.126 ***0.081 ***0.069 ***0.075 ***
(0.016)(0.017)(0.016)(0.016)(0.017)(0.014)(0.014)(0.015)(0.017)(0.019)
FarmRev.lag0.160 ***0.196 ***0.093 ***0.089 ***0.139 ***0.057 *−0.058 *0.220 ***0.257 ***0.193 ***
(0.031)(0.032)(0.035)(0.034)(0.032)(0.029)(0.035)(0.031)(0.033)(0.036)
PlantedScale. lag−1.441 **−3.239 ***−4.530 ***−2.918 ***−5.799 ***−5.136 ***−0.096−4.020 ***−2.773 ***−1.697 *
(0.612)(0.599)(0.684)(0.666)(0.683)(0.642)(0.572)(0.583)(0.796)(1.015)
meanGrs−0.0590.0290.129−0.0660.1660.0280.352 **0.1660.404 **0.078
(0.169)(0.178)(0.190)(0.178)(0.180)(0.173)(0.146)(0.178)(0.181)(0.206)
meanPrep0.299 ***−0.040−0.228 ***0.0640.0700.111 *−0.224 ***0.105 *0.0110.203 ***
(0.057)(0.066)(0.065)(0.058)(0.063)(0.057)(0.063)(0.060)(0.065)(0.073)
Constant2.7044.783 *13.661 ***10.677 ***17.141 ***16.151 ***−19.686 ***9.947 ***9.144 ***2.791
(2.509)(2.887)(2.949)(2.675)(2.883)(2.783)(4.018)(2.777)(2.820)(3.394)
Note: Total observation is 403; standard errors are reported in parenthesis; * p < 0.1; ** p < 0.05; *** p < 0.01; definitions of variables are in Table 1.
Table 3. Marginal effects evaluated at means.
VariablesRiceMaizeWheatSoybeanTubersOilsCottonVegeOrchardsSpecialFibers
GrsAvg0.0184 **−0.0345 ***0.0160 *0.0023−0.00040.00140.0013−0.0015−0.00380.00060.0003
(0.0075)(0.0116)(0.0087)(0.0037)(0.0023)(0.0046)(0.0023)(0.0038)(0.0038)(0.0027)(0.0002)
Precip0.0098 ***0.00000.00270.0006−0.0039 ***0.00070.0008−0.0049 ***−0.0071 ***0.00110.0001
(0.0024)(0.0039)(0.0032)(0.0012)(0.0008)(0.0015)(0.0006)(0.0012)(0.0011)(0.0009)(0.0001)
IrrigRate.lag0.1137 ***−0.4935 ***0.2491 ***−0.0198−0.1682 ***0.1438 ***0.1777 ***0.1189 ***−0.0200−0.1053 ***0.0035 ***
(0.0349)(0.0477)(0.0398)(0.0160)(0.0157)(0.0156)(0.0190)(0.0271)(0.0195)(0.0213)(0.0011)
Time trend−0.0000−0.00260.0008−0.00060.0024 ***0.0021 ***0.0006−0.0026 ***−0.00080.0007−0.0000 **
(0.0012)(0.0019)(0.0016)(0.0006)(0.0005)(0.0007)(0.0004)(0.0008)(0.0006)(0.0004)(0.0000)
Pesticide.lag0.0018 *−0.0061 ***0.00220.0017 **−0.0008 *0.0015 **0.0023 ***−0.0013 **−0.0010 ***−0.00040.0001 ***
(0.0010)(0.0019)(0.0014)(0.0007)(0.0005)(0.0006)(0.0005)(0.0005)(0.0004)(0.0003)(0.0000)
Fertilizer.lag−0.0041 ***0.0084 ***0.0019 **−0.0016 ***−0.0018 ***−0.00030.0007 ***−0.0014 ***−0.0013 ***−0.0004 *−0.0001 ***
(0.0007)(0.0012)(0.0009)(0.0004)(0.0003)(0.0005)(0.0002)(0.0003)(0.0003)(0.0003)(0.0000)
FarmRev.lag0.00110.0098 ***−0.0084 ***−0.0047 ***−0.0006−0.0086 ***−0.0044 ***0.0090 ***0.0060 ***0.0010 *−0.0002 ***
(0.0017)(0.0025)(0.0020)(0.0009)(0.0006)(0.0009)(0.0006)(0.0008)(0.0008)(0.0005)(0.0000)
PlantedScale. lag0.3405 ***0.0188−0.1689 ***0.0295−0.1083 ***−0.1615 ***0.0676 ***−0.0958 ***0.03170.0426 **0.0036 ***
(0.0559)(0.0555)(0.0476)(0.0235)(0.0214)(0.0324)(0.0093)(0.0218)(0.0270)(0.0216)(0.0007)
meanGrs−0.0242 ***−0.01050.0076−0.0103 ***0.0040 *−0.00410.0058 **0.0125 ***0.0191 ***0.0001−0.0001
(0.0080)(0.0114)(0.0090)(0.0037)(0.0023)(0.0044)(0.0024)(0.0041)(0.0040)(0.0030)(0.0002)
meanPrep0.0458 ***−0.0198 ***−0.0384 ***0.00130.00100.0057 ***−0.0057 ***0.0080 ***−0.00200.0041 ***−0.0001
(0.0033)(0.0057)(0.0040)(0.0017)(0.0011)(0.0020)(0.0008)(0.0017)(0.0015)(0.0012)(0.0001)
Note: Total observation is 403; delta-method standard errors in parentheses; *** p < 0.01, ** p < 0.05, * p < 0.1; definitions of variables are in Table 1.