Article

Financial Credit Risk Evaluation Based on Core Enterprise Supply Chains

1
College of Economics and Management, Changzhou Institute of Technology, Changzhou 213022, China
2
Department of Finance, Fintech Center Big Data Research Center, Asia University, Taichung 41354, Taiwan
3
Department of Finance, Asia University, Taichung 41354, Taiwan
4
Econometric Institute, Erasmus School of Economics, Erasmus University Rotterdam, 3000 Rotterdam, The Netherlands
5
Department of Economic Analysis and ICAE, Complutense University of Madrid, 28040 Madrid, Spain
6
Institute of Advanced Sciences, Yokohama National University, Yokohama 240-8501, Japan
*
Author to whom correspondence should be addressed.
Sustainability 2018, 10(10), 3699; https://doi.org/10.3390/su10103699
Submission received: 6 September 2018 / Revised: 1 October 2018 / Accepted: 2 October 2018 / Published: 15 October 2018

Abstract

:
Supply chain finance has broken through traditional credit modes and advanced rapidly as a creative financial business discipline. Core enterprises have played a critical role in the credit enhancement of supply chain finance. Through the analysis of core enterprise credit risks in supply chain finance, by means of a ‘fuzzy analytical hierarchy process’ (FAHP), the paper constructs a supply chain financial credit risk evaluation system, making quantitative measurements and evaluation of core enterprise credit risk. This enables enterprises to take measures to control credit risk, thereby promoting the healthy development of supply chain finance. The examination of core enterprise supply chains suggests that a unified information file should be collected based on the core enterprise, including the operating conditions, asset status, industry status, credit record, effective information to the database, collecting related data upstream and downstream of the archives around the core enterprise, developing a data information system, electronic data information, and updating the database accurately using the latest information that might be available. Moreover, supply chain finance and modern information technology should be integrated to establish the sharing of information resources and realize the exchange of information flows, capital flows, and logistics between banks. This should reduce a variety of risks and improve the efficiency and effectiveness of supply chain finance.

1. Introduction

Small and medium-sized enterprises (SMEs) have generally played the most significant role in the development of the national and provincial economies in China. SMEs have made great strides that have accounted for over 98% of all enterprises, contributed more than 60% of growth in GDP and foreign trade for economic development nationwide, provided over 80% of job opportunities, and more than 50% of business revenues. Although SMEs have experienced an overall performance that would be characterized as excellent and have an irreplaceable role in promoting the national economy, their financial environment has been, and remains, susceptible and sensitive to changing financial conditions at all levels.
Overall, SMEs face greater financial constraints than do larger firms. There are measures that are intended to alleviate the financial constraints of SMEs, such as leasing and factoring that are helpful in facilitating access to finance in the absence of well-developed financial institutions. Numerous studies have argued that SMEs are financially more constrained than large firms.
SMEs are major players in the economy, such that the current financial market failure is an obstacle to their expansion and growth. For this reason, SMEs need administrative and financial support from governments at all levels. However, despite the growing interest in subsidizing SMEs, there are concerns about whether these measures are helpful and sufficient. According to statistics from the People’s Bank of China, SMEs have obtained bank loans that account for 16% of the loans of financial institutions, and bank supporting loans to SMEs lie in the range 30–40%. Moreover, virtually 80% of SMEs are experiencing capital circulation problems.
As SMEs have not received financial support relative to the contribution they have made to the economy, their financial problems have become a barrier that affects the sustainable development of SMEs. Given this background, the financial supply chain enters as an important participant to the financial system, with associated financial credit risks.
The remainder of the paper is as follows. Section 2 gives a literature review, including the definition of supply chain finance, credit risk evaluation of supply chain finance, and risk control for supply chain finance. The theory of supply chain financial core enterprise risks is discussed in Section 3, including credit, guarantee, and operational risk. Section 4 presents the fuzzy analytical hierarchy process (FAHP) framework, including the fuzzy judgment matrix and a check for its consistency, the weight vector, and composite weight vector. The empirical analysis is evaluated in Section 5, including a discussion of core enterprises, an evaluation system of the core enterprise credit risk, and model construction and solution. Some concluding remarks are presented in Section 6.

2. Literature Review

International research on supply chain finance started before similar developments in China, the mode of operation is more mature, and the achievements are relatively advanced. Regarding relationship between supply chain and financing, Berger et al. (2006) [1] advanced the conceptual framework for the development and financing of global small and medium-sized enterprises and established the idea of supply chain finance. Klapper (2005) [2] analyzed the principles underlying the inventory financing model, and the functions that small and medium-sized enterprises had adopted in the supply chain.
The development of China’s supply chain finance began around 2000. In 2005, the financing mode of “1 plus N” implemented by the Shenzhen Development Bank (since renamed the Ping An Bank) offered a $250 billion credit line, making 25% profit, with the non-performing loans accounting for 0.57% of all supply chain finance.
In recent years, supply chain finance has been developing rapidly. Statistics show that by the end of 2015, 60% of SMEs had chosen supply chain finance to alleviate the shortage of business liquidity. However, as an innovative financing method, supply chain finance also has certain risks, such as the financing of small and medium-sized enterprise core banks, whereby one party’s credit problems can lead to the failure of supply chain financing and the loss of other participants. While SMEs are undoubtedly the engine of economic growth, their speed of growth will be dampened by market imperfections and institutional weaknesses (for further details, see [3] Beck and Demirguc-Kunt (2006)).
In [4] Shi et al. (2014), the fuzzy analytical hierarchy process was applied for risk evaluation in model building of logistics financial business for banks. The information asymmetry between banks and enterprises and imperfect mechanism bring some risk to banks carrying out the logistics and financial business. Using logistics financial risk indicators, the risk evaluation index system of logistics finance from the pledge risk, financing enterprise credit risk, logistics enterprise risk, and regulatory risk, the risk evaluation model of logistics financial business for the bank is established by using fuzzy mathematics theory and an analytic hierarchy process.
Further to the above, [5] Shi et al. (2015) evaluated the credit risk of online supply chain finance based on third-party B2B e-commerce platform for China. The system applies the multi-level gray evaluation model based on the Theil index to make a comprehensive evaluation on the credit of the loan enterprise and tests the model’s feasibility through the analyses of a numerical example. The evaluation model overcomes the subjectivity of weight distribution to index and presents the degree of the indices on each hierarchy distinctly so as to enable banks to take risk control specifically in operation.
Through the analysis of core enterprise credit risks in supply chain finance, by means of a ‘fuzzy analytical hierarchy process’ (FAHP), the paper constructs a supply chain financial credit risk evaluation system. This paper extends the work of the two papers just mentioned by discussing the fuzzy judgment matrix, developing a fuzzy Judgment matrix consistency check, weight vector of index layer C , weight vector of index layer C to criterion layer B , and composite weight vectors. The paper also provides a detailed empirical example that highlights the novelty of the model construction and solution. These are the primary and novel purposes of the paper.

2.1. Definition of Supply Chain Finance

The definition of supply chain finance will cover significant contributions from 2005 until the present. According to the definition of supply chain finance (SCF) in [6] Hofmann (2005), it relies on two or more organizations in the supply chain to cooperate on financial resources to create extra values jointly, although these organizations remain independent. Pfohl and Gomm (2009) [7] argued that SCF could raise the value of participating firms in the supply chain, in addition to the value of leading firms in the supply chain.
Several years later, according to [8] Gupta and Dutta (2011), with increasingly fierce competition, it becomes more important to improve the efficiency of working capital by using cash that is trapped in the financial supply chain (FSC). Mathis and Cavinato (2010) [9] argued that banks should play a more active role in the FSC to integrate the resources in the chain. Silvestro and Lustrato (2014) [10] showed that banks are key players that can offer alternative supply chain solutions in the FSC.
More recently, in a related development, [11] Blackman et al. (2013) proposed a formal definition that a ‘financial supply chain’ is the network of organizations and banks that coordinate the flow of financial transactions through shared information systems to facilitate a product supply chain between trading partners.
SCF can be defined in many ways, depending on perspective and orientation. The analysis of the different definitions and conceptual contributions highlights two major perspectives on SCF, which can be identified as ‘financial-oriented’ from which a further ‘buyer-driven perspective’ can be identified) and ‘supply chain-oriented’. The financial perspective interprets SCF as a set of (innovative) financial solutions (for further details, see [12] Caniato et al., 2016).
SCF has increasingly become a hot topic in supply chain management and a growing product category of financial institutions (FIs). In China, SCF is experiencing a rapid development stage, and numerous FIs have begun to focus on developing and designing new SCF services and products to solve the financing issues facing SMEs. SCF is a channel for financing, which manages, plans, and controls all cash flows across supply chain members to improve the turnover efficiency of working capital. In SCF, SMEs obtain loans with looser constraints from banks through expanded credit lines. Core enterprises (CEs) alleviate the pressure of funding, and financial intermediaries dramatically increase their incomes.
More specifically, SCF significantly decreases the credit risk of SMEs for FIs. Nevertheless, SCF cannot completely eliminate credit risk, which continues to be one of the major threats to FIs. Moreover, SCF has been promoted for almost 10 years and has experienced slow development in China because there is not as yet an appropriate SME credit risk evaluation index system, or an outstanding prediction model, which hinders SCF (for further details, see [13] Zhu et al., 2016)).
SCF is concerned with the capital flows within a supply chain, an area that has often been neglected in the past. Nevertheless, SCF does have an impact on a firm’s capability for adopting sustainable supply chain management (SCM) practices (for further details, see [14] Liu et al. (2015)).

2.2. Credit Risk Evaluation of Supply Chain Finance

In China, SMEs are the main applicants of SCF, so that banks suffer from credit risk in SCF when the SMEs cannot honor agreements and contracts. It is generally agreed that structuring the SME credit risk evaluation index system is the greatest and most critical challenge to bank management of SCF, and that it is fundamental to credit loan decision making. A good credit risk evaluation index system can guarantee profitability and stability of a FI, whereas a poor system can potentially lead to significant losses (for further details, see [13] Zhu et al., 2016).
In previous studies, experts and scholars paid greater attention to the credit risk of SMEs, while neglecting the credit risk of core enterprises, which is one of the main financial entities of the supply chain. In fact, the core enterprises’ credit risk is the key to influence the effective implementation of supply chain finance.
Feldmann and Müller (2003) [15] emphasized the role of asymmetric information held by supply chain partners who are opportunistically behaved. Silvestro and Lustrato (2014) [10] argued that the factors that could affect the risk of SCF include supply chain co-ordination, cooperation, and information sharing.
In a much earlier contribution, [16] Berger and Udell (1998) found that small firms have limited access to external financing, and were more tightly constrained in their operations, both in developing and developed countries. Galindo and Schiantarelli (2003) [17] drew the same conclusion for countries in Latin America.
Schiffer and Weder (2001) [18] found that small firms consistently face greater growth obstacles than do large firms, which implies that size is one of the most reliable factors for financing obstacles confronting firms, except for age and ownership of firms (for further details, see [19] Beck et al., 2006).
Song and Zipkin (2009) [20] analyzed the methods for determining the quality of goods in the pawn financing process. Moreover, an investigation by [21] Wuttke et al. (2013) indicated that it is better for the supply chain enterprises of SMEs to adopt a “pre–shipment” financing model in preference to a “post-shipment” funding model. Furthermore, both corporations and banks have shown great interest in using SCF techniques to ease their tensions in the supply chain, and also in making large corporations shorten the payment periods for their key suppliers (for further details, see [22] Randall et al, 2009)).
Very recently, [13] Zhu et al. (2016) proposed an SME credit risk evaluation index system specifically designed for SCF. This system is used to evaluate the credit risks from different points of view, which not only consist of financial and non-financial conditions of SMEs, but also contain the financial and non-financial conditions of CEs, the operational status of the entire supply chain, and the transactional relationship between SMEs and CEs (for further details, see [13] Zhu et al., 2016)).
Therefore, measuring and evaluating the credit level of core enterprises, and controlling the credit risk of core enterprises, are the keys to using supply chain finance in an efficient manner.

2.3. Risk Control for Supply Chain Finance

As mentioned above, there has been substantial and informative research on supply chain finance for SMEs. Nevertheless, there remain some limitations. There has been little research on collaborative supply chain finance for SMEs, and the research has not necessarily been systematic.
In 1931, the British Financial Industry Council established the Macmillan Committee—officially known as the [23] Committee on Finance and Industry (1931)—and presented the Macmillan Report after investigating the British financial industry, and industry and commerce. The report noted that, in the UK financial system, there is a gap between SMEs and financial institutions (for further details, see [24] Stamp (1931)). To date, no research has considered a systematic analysis for the overall optimization of supply chain finance for SMEs in attempting to solve the “Macmillan gap”.
Lee and Rhee (2011) [25] demonstrated that, through the coordination and establishment of commercial credit among SMEs, the results of risk control for supply chain finance of SMEs are better than those of financial risk control by financial institutions for the individual companies.
The apparent ability of some supply chains to recover from inevitable risk events more effectively than do others has recently triggered a debate about supply chain resilience (SCRES). While SCRM focuses on the identification and management of risks for the supply chain in order to reduce its vulnerability, SCRES aims at developing the adaptive capability to prepare for unexpected and contingent events, to respond to disruptions, and subsequently recover from them (for further details, see [26] Jüttner and Maklan, 2011)).

3. Theory of Supply Chain Financial Core Enterprise Risks

In supply chain finance, core enterprises are the exchange center of capital flows, information flows, and logistics, and play an important role in the supply chain financing. The risks can vary, including three major risks—namely credit, guarantee, and operational risks—which are discussed below.

3.1. Credit Risk

Core enterprises play an important role in supply chain finance, and play key roles in connecting the supply chain capital flows, information flows and logistics. Banks are based on the core enterprise’s strength and credit guarantee and select the upstream and downstream enterprises to perform credit activities. Therefore, the core enterprise conditions and development prospects determine the smooth operation of the supply chain. The credit status of core business problems will inevitably spread to the supply chain with the upstream and downstream enterprises, thereby affecting the overall supply chain finance security and operational efficiency, leading to supply chain financing failure.
Core enterprise credit risk manifests itself in two respects. The core enterprise can undertake the entire supply chain finance guarantee function when they are experiencing poor management themselves. Moreover, the core enterprise may be confronted with a credit crisis due to bonding credit which exceeds its credit capacity, resulting in financing failure. As the core enterprise development prospects are not encouraging, their power is diminished.
A core enterprise may conceal their real transaction records with different parties in the supply chain, which leads to false financing. This can affect their actual performance, so that they will not be able to satisfy the conditions of the agreement with the bank, in which case the SMEs financing will eventually fail.

3.2. Guarantee Risk

For the core enterprise, the so-called guarantee risk arises in financing when SMEs break a contract. When SMEs cannot continue payments of bank loans, the core enterprise, as a guarantor of SMEs, has to bear the associated bank losses. In supply chain finance, guarantees by the core enterprise of the credit situation of SMEs leads to a greater strength of SMEs, and the possibility of reducing the risk of banks in lending money to SMEs through promoting enterprise production and business development. If the core enterprise intends to give credit to SMEs, the core enterprise should be careful in selecting SMEs in the supply chain that are financially strong so as to reduce guarantee risk.

3.3. Operational Risk

In the process of supply chain financing, many of the required steps need to be confirmed manually, so operational risk needs to be accommodated. The operation of the three main financing risk are also different. For example, the operational risk of accounts receivable financing mode focuses primarily on the management of accounts receivable.
The existence of sales discounts will lead to errors when the accounts receivable are checked. Moreover, given the fact that receivables financing is a repeatedly regular procedure, the payments and actual deviations occur when the core enterprises are confirming such payments. In addition, the accounts receivable settlements involve enterprises and many settlement accounts. As the procedures for repayment can be complicated, especially when the methods for the accounts receivable transfer payments change, operational errors are more prone to occur, thereby leading to greater operational risk.
Overall, the greatest influence on the supply chain of the three different types of risks mentioned above is financial credit risk. As the main participant in the supply chain, the core enterprise credit level has a significant influence on the success in financing. In order to reduce the financial risks of the supply chain, the effective control of core enterprise credit risk is fundamental.

4. Fuzzy Analytical Hierarchy Process (FAHP) Framework

Saaty (1990) [27] introduced a multi-factors decision making approach, in which factors are arranged in a hierarchical structure. In order to apply the FAHP method, it is necessary to construct a hierarchy that expresses the relative values of a set of attributes. Decision makers evaluate the relative importance of the attributes in each level based on the FAHP scale which, in turn, is used to direct them to express their preferences between each pairwise comparison. Then the decision makers are required to determine whether the element is of equal importance, somewhat more important, much more important, very much more important, or absolutely important, relative to another element.
These important intensities are, respectively, converted to numeral values in the FAHP scale as 1, 3, 5, 7, 9 and 2, 4, 6, 8, as the intermediate values (see Table 1). By using this scale, the qualitative judgments of evaluators are converted into quantitative values, which enable construction of a pairwise comparison matrix. The pairwise comparison matrix is made for all elements to be considered in the construct hierarchy. The results from these comparisons are used to calculate a list of admittedly arbitrary though reasonable weights, and importance of the factors (eigenvectors) based on the rapid application development (RAD) method. Arbitrary means that mathematical optimization for determining the weights was not used as it would have required a mathematical model to have been imposed on the structure of the model.

4.1. Fuzzy Judgment Matrix

Fuzzy judgment matrix can be used to compare the importance of different indicators. The level of importance of two elements are assumed to be incorporated into an index labelled as T, and the hierarchical elements, a 1 , …, a n represent the existing fuzzy relation, all of which constitute a fuzzy matrix, as given below:
T a 1 a 2   a n | a 1 a 2 a n r 11 r 12 r 1 n r 21 r n 1 r 22 r n 2 r 2 n r n n
In the fuzzy T index matrix, r i j denotes a judgment value which represents the extent to which a i is much more important than a j , when the two elements a i and a j are compared.
Pairwise comparisons among the main factors, sub-factors, and alternatives are produced based on the typical nine-point scale combined with fuzzy numbers. The next step is to calculate the admittedly arbitrary priority weights of factors, sub-factors, and alternatives by adopting the FAHP approach.
The idea of calculating the priority weights of attributes is based on the pairwise comparisons given in the questionnaire (for further details, see Appendix A). In doing so, a set of comparison questions are proposed in order to ask the experts their opinions. The higher the evaluation is, the greater the importance of a factor will be.
Corresponding to three levels of the hierarchical model, the experts first evaluate the four main factors in the second level with respect to the overall goal. In the third level, pairwise comparisons of alternatives are made with respect to the overall goal.
In order to obtain the quantitative value of the compared importance between each two indicators, fuzzy numerical values from 1 to 9 are employed, as shown in Table 1. With such comparisons between each two factors, the fuzzy judgment matrix can be constructed.

4.2. Fuzzy Judgment Matrix Consistency Check

A consistency check is the first condition for calculating the weights. Only if the consistency meets the requirements can the model be solved. A relatively simple judgment method is based on the following formula.
CI ( A , W ) = 1 n 2 i = 1 n j = 1 n | a i j ω i j |
The acceptable condition for the consistency judgment is CI ( A , W ) α , where the implication of α is the attitude of the decision maker. The higher is the consistency of the fuzzy judgment matrix required by the decision maker, the smaller will be the value of α . The value of α is most suitable when it is set to 0.01.

4.3. Weight Vector of Criterion Layer B

The determination of the weight vector is the key to the fuzzy judgment matrix which can be obtained after sorting out the results of the questionnaire given by the experts. The formula given in Equation (3) is used to solve the weight vector for each criterion layer. The weight given to each expert is multiplied by the weight vector, and the weight vector of the elements at the B layer, such that ω B = ( ω 1 , , ω n ) , can be obtained as
ω i = j = 1 n a i j + 1 n 2 n   for   any   i = 1 , 2 , , n .

4.4. Weight Vector of Index Layer C to Criterion Layer B

Each decision-making expert takes the B layer elements as the criterion, and gives the fuzzy judgment matrix, which is obtained by the C layer elements, compares two fuzzy judgment matrix, by using the same method, and thereby obtains the weight vector of each element of the C layer.

4.5. Composite Weight Vector

After calculating the priority weight vectors of the B and C layers, the following formula in Equation (4)
ω j = i = 1 n w i w j
This equation is used to compute the composite weight vector and the priority weight vector of the different indexes to obtain the credit risk. The key risk factors can then be identified. In the formula, ω j is the index values of no. j element and w i w i is the weight vector. No. i criterion layer, w i j is the weight vector of the no. i criterion layer of the no. j index value.

5. Empirical Analysis

5.1. Introduction to Core Enterprises

The Wuhan Iron and Steel Group is affiliated to the state-owned SASAC important backbone enterprises, has a good credit rating, and substantial financial strength. It is among the core enterprises in the supply chain finance. The Wuhan Iron and Steel Group is in the production stage of the three stages of product supply, production, and sales.
The upstream enterprises act primarily as steel materials suppliers, which are responsible for the mining of steel. The Wuhan Iron and Steel Group has applied to various banks for financial loans by means of the receivables documents in the financing process.
Downstream enterprises are mainly steel dealers, which are responsible for the sales of steel. During the financing process, they select the financing mode of prepayment to purchase and apply for loans based on sales contracts.
The China Industrial Bank (CIB) has been cooperating with the Wuhan Iron and Steel Group in the supply chain finance since 2002. Until December 2015, the China Industrial Bank had 53 credit lines among the upstream and downstream dealers of the Wuhan Iron and Steel Group, with a credit amount that exceeded RMB 1.536 billion. The non-performing loan ratio of the upstream and downstream enterprises is very low, almost close to zero, which is a successful case of the implementation of supply chain finance.

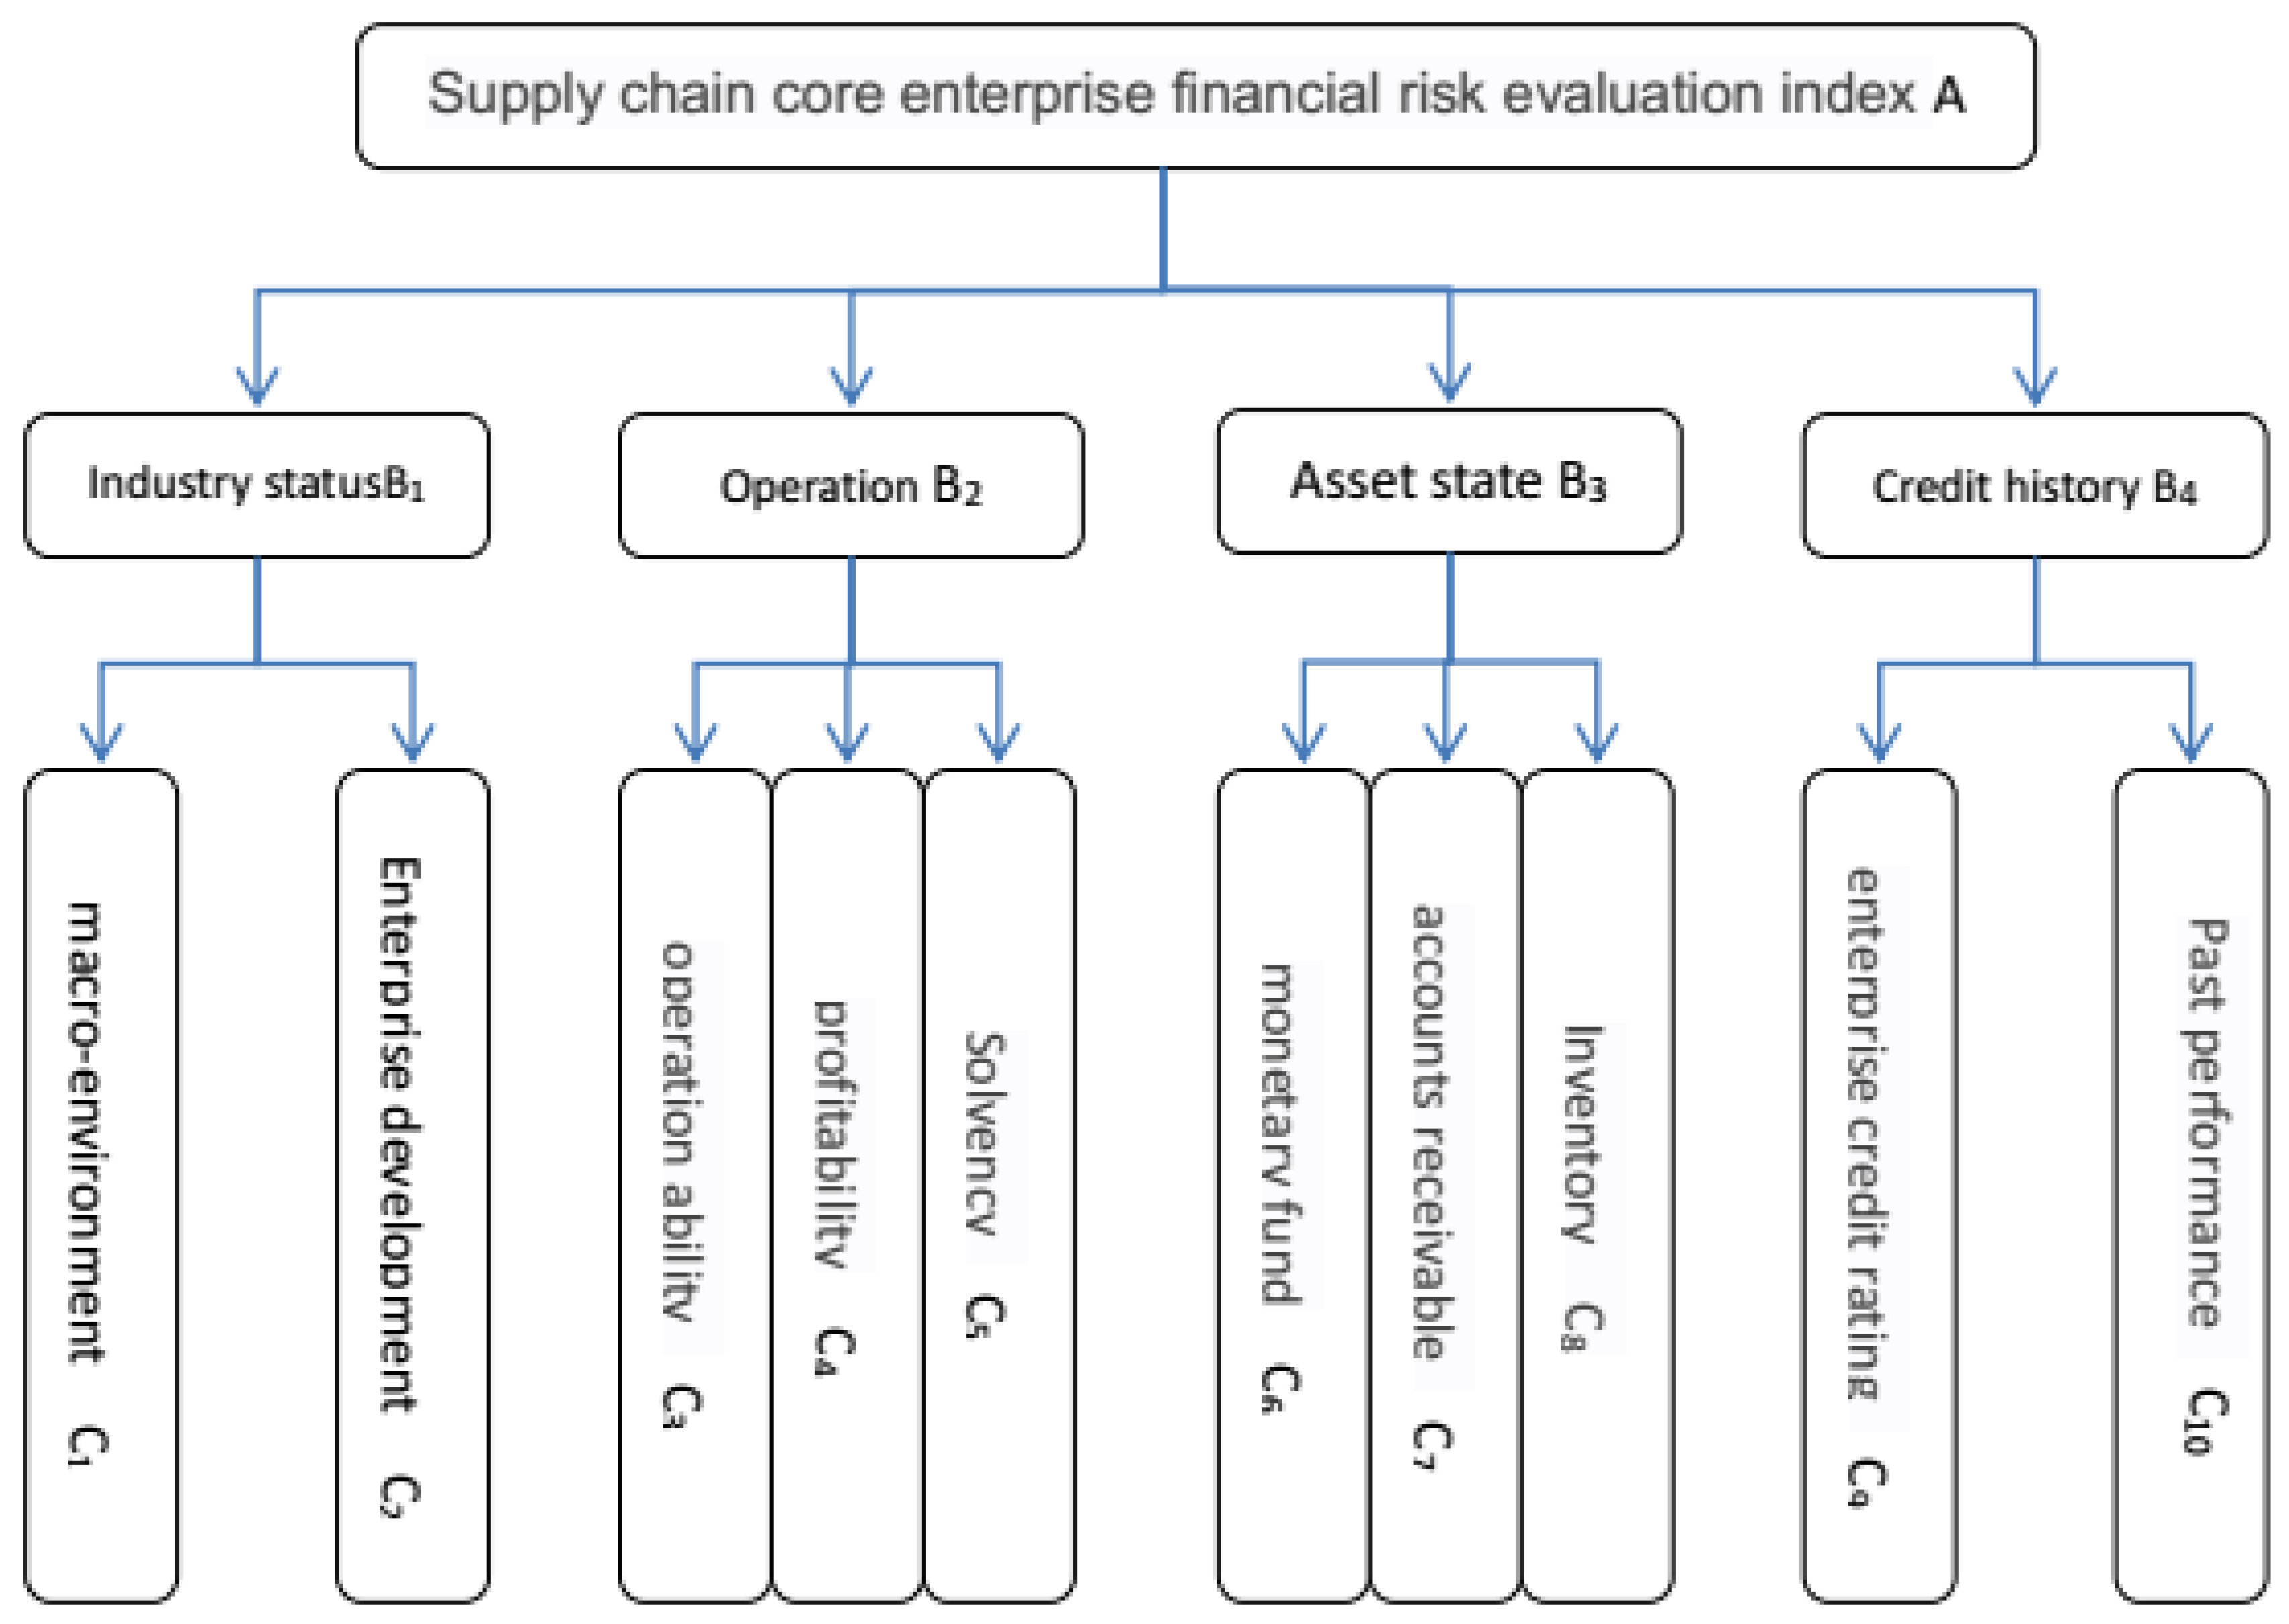
5.2. Evaluation System of the Core Enterprise Credit Risk

The core enterprise risk control is the most important factor in the supply chain risk. For this reason, the construction of the core enterprise credit risk system is very important. This paper constructs a layer analysis using four approaches toward risk, namely the core enterprise industry position, management perspective, asset status, and credit record.

5.2.1. Core Enterprise Industry Status ( B 1 )

The achievement of inter-enterprise transactions not only relies on the quality of goods, but also the industry status as the focus of attention. In general, the core enterprise industry status has a significant effect on their business conditions. This paper selects the macroscopic environment and the development situation of the enterprises as the secondary index of industry status evaluation.

5.2.2. Core Enterprise Operations ( B 2 )

Banks are more concerned about the operation of the core enterprise with guarantees. The reason is that the core enterprise needs to assume the guarantee obligation in case of default by the SMEs. If the core enterprises do not have high solvency, the banks will not be in a position to offer loans to the SMEs as they need to consider their own financial interests. The operating performance of the core enterprises is mainly reflected in the three indicators of profitability, operating capacity, and solvency. This paper selects these three indexes as the secondary indicators in the evaluation system.

5.2.3. Asset Status of the Core Enterprises ( B 3 )

The main premise of bank loans is that the core enterprise provides security for SMEs, such that, when SMEs breach their contracts, the core enterprises will accept their responsibility for the guarantees, thereby compensating the banks and reducing bank losses. Therefore, the asset status of the core enterprise is also an important focus of bank inspections. In this way, the ability of the core enterprise to cash financial assets is stronger than that of the monetary funds, receivable accounts, and inventories. This paper will take the three items as the secondary index of the current asset status evaluation.

5.2.4. Core Enterprise Credit History ( B 4 )

The key to the successful financing of SMEs is the core enterprise credit guarantees to be bundled together with SMEs to form the overall credit. However, if the credit situation of the core enterprise is poor, even if the SMEs and the core enterprise credit guarantees are bundled together, the bank will not make the loans accessible. This paper selects the credit rating and the previous performance, namely the credit history, as the secondary index.
The hierarchy of the evaluation system of core enterprise credit risk can constructed, as shown in Figure 1. It is divided into three levels, and arranged in descending order. The first level presents the overall goal, which is the risk evaluation of supply chain financial core enterprises (A) and is situated at the top of the hierarchy. In the second level, four major factors are inserted into the model, namely industry status ( B 1 ), operation condition ( B 2 ), asset state ( B 3 ), and credit record ( B 4 ). Each factor includes several sub-factors in the third level of the hierarchy.
The industry status factor is explained by two sub-factors, namely macro-environment ( C 1 ) and enterprise development ( C 2 ). The operation condition includes operation ability ( C 3 ), profitability ( C 4 ) and solvency ( C 5 ). The asset state consists of monetary fund ( C 6 ), accounts receivable ( C 7 ), and inventory ( C 8 ). The credit history includes enterprise credit rating ( C 9 ) and past performance ( C 10 ).

5.3. Model Construction and Solution

By using the risk evaluation system that was described above, including 4 risk categories and 10 risk factors, the risk identification model was constructed using a fuzzy analytic hierarchy process (FAHP), and the model was thereby solved. In this paper, the core enterprise employees are divided into four categories, namely managerial staff, senior engineers, middle-level employees, and general employees. The questionnaire is scored according to four types of employees (see below), with the fuzzy matrices given as B 1 , B 2 , B 3 , and B 4 .
The four types of employees are given as follows:
Managerial staff: They perform management functions, and direct or coordinate others to complete specific tasks in the organization. Their educational background is relatively good. They are familiar with the work flow of management and have a clearer business operation. Therefore, their assignment weights are 0.3. In this paper, a total of 50 managers were selected by the sampling method. After removing the highest and lowest scores, an average value was obtained.
Senior engineers: They are technical experts or technicians in the engineering field, play an irreplaceable role in the enterprise, and have strong working ability. In the enterprise work, they have a relatively professional technical background and authority, so their assignment weight is 0.3. In this paper, a total of 20 senior engineers were selected by the sampling method. After removing the highest and lowest scores, an average value was obtained.
Middle-level employees: They are managers at one or more intermediate levels between senior managers and grass-roots managers. Their main responsibilities are to implement major decisions made by senior managers, and to supervise and coordinate the work of grass-roots managers. Therefore, their work plays a connecting role. They are not as high as the headquarters management, and may only focus on part of the enterprise, so the assignment weight is 0.2. In this paper, a total of 50 middle-level employees were selected by the sampling method. After removing the highest and lowest scores, an average value was obtained.
General employees: Specifically engaged in various post work, and are at the forefront of staff, but their focus is their own post work. The overall perspective of the problem or risk is relatively small, so the assignment weight is 0.2. In this paper, a total of 50 employees were selected by the sampling method. After removing the highest and lowest scores, an average value was obtained.
These four categories of employees are given different weights, specifically managerial staff 0.3, senior engineers 0.3, middle-level staff 0.2, and general employees 0.2. Various types of employees on the B-layer elements are compared pairwise, and thereby obtain the fuzzy judgment matrix
B 1 = [ 0.5 0.7 0.6 0.4 0.3 0.5 0.4 0.4 0.4 0.6 0.5 0.3 0.6 0.6 0.7 0.5 ]
B 2 = [ 0.5 0.8 0.7 0.6 0.2 0.5 0.5 0.4 0.3 0.5 0.5 0.3 0.4 0.6 0.7 0.5 ]
B 3 = [ 0.5 0.7 0.8 0.6 0.3 0.5 0.6 0.4 0.2 0.4 0.5 0.3 0.4 0.6 0.7 0.5 ]
B 4 = [ 0.5 0.8 0.9 0.5 0.2 0.5 0.7 0.2 0.1 0.3 0.5 0.3 0.5 0.8 0.7 0.5 ]
The fuzzy judgment matrix is used to determine the fuzzy consistency of the four matrices, namely B 1 , B 2 , B 3 , B 4 , and the weight order vectors, that is, ω B 1 , ω B 2 , ω B 3 , ω B 4 , can be solved. By taking B 1 as an example, the solution is given as
ω B 11 = 1 4 ( 0.5 + 0.3 + 0.4 + 0.6 + 1 4 2 ) = 0.2 ω B 12 = 1 4 ( 0.7 + 0.5 + 0.6 + 0.6 + 1 4 2 ) = 0.35 ω B 13 = 1 4 ( 0.6 + 0.4 + 0.5 + 0.7 + 1 4 2 ) = 0.3 ω B 14 = 1 4 ( 0.4 + 0.4 + 0.3 + 0.5 + 1 4 2 ) = 0.15
Therefore:
ω B 1 = ( 0.2   0.35   0.3   0.15 )
Similarly:
ω B 2 = ( 0.1   0.35   0.35   0.2 ) ω B 3 = ( 0.1   0.3   0.4   0.2 ) ω B 4 = ( 0.075   0.35   0.45   0.125 )
Given the above, the weight of the four categories of employees can be added, and the B-level weight vector can be obtained as:
ω B 1 = 0.3 × 0.2 + 0.3 × 0.1 + 0.2 × 0.1 + 0.2 × 0.075 = 0.125 ω B 2 = 0.3 × 0.35 + 0.3 × 0.35 + 0.2 × 0.4 + 0.2 × 0.35 = 0.34 ω B 3 = 0.3 × 0.3 + 0.3 × 0.35 + 0.2 × 0.4 + 0.2 × 0.45 = 0.365 ω B 4 = 0.3 × 0.15 + 0.3 × 0.2 + 0.2 × 0.2 + 0.2 × 0.125 = 0.17
As a result, the weight vector of the criterion layer to the target layer is ( 0.125 ,   0.34 ,   0.36 ,   0.17 ) . Given the construction, the total weight vector of the criterion layer to the target layer can be determined, as follows: the core enterprise asset weight is 0.365, and is ranked first; the operating weight is 0.33, which is ranked second; the credit record weight is 0.17, thereby being ranked third; the industry position weight is 0.125, and is ranked fourth.
The ranking constructed above shows that commercial banks are primarily concerned with the asset status of the core enterprise, followed by the core enterprise operation, then the credit record of the core enterprise, and finally the core enterprise industry status.
Under the premise of calculating the weight of the criterion layer, the weight value of each risk factor in the index layer can also be obtained. According to the questionnaire survey results of the 4 kinds of employees, the 10 risk factors in the index layer are compared with each other, the fuzzy judgment matrix is constructed, and the single ranking weight vector is obtained according to the judgment matrix.
In this paper, the weight vector of the criterion layer B to each element in the C layer is taken as an example. The fuzzy judgment matrix, C 1 k ( k = 1 ,   2 ,   3 ,   4 ) , is constructed, as given in Appendix B.
The same method is used to obtain the weight vector, namely,
ω C 11 = 1 10 ( 0.5 + 0.6 + 0.7 + 0.5 + 0.3 + 0.7 + 0.5 + 0.8 + 0.6 + 0.5 + 1 10 2 ) = 0.17 ω C 12 = 1 10 ( 0.4 + 0.5 + 0.4 + 0.6 + 0.4 + 0.7 + 0.7 + 0.3 + 0.5 + 0.6 + 1 10 2 ) = 0.11 ω C 13 = 1 10 ( 0.   3 + 0.6 + 0.5 + 0.4 + 0.7 + 0.5 + 0.4 + 0.2 + 0.5 + 0.4 + 1 10 2 ) = 0.05 ω C 14 = 1 10 ( 0.5 + 0.4 + 0.6 + 0.5 + 0.3 + 0.2 + 0.8 + 0.6 + 0.7 + 0.5 + 1 10 2 ) = 0.11 ω C 15 = 1 10 ( 0.7 + 0.6 + 0.3 + 0.7 + 0.5 + 0.5 + 0.8 + 0.1 + 0.5 + 0.7 + 1 10 2 ) = 0.14 ω C 16 = 1 10 ( 0.3 + 0.3 + 0.5 + 0.8 + 0.5 + 0.5 + 0.4 + 0.7 + 0.2 + 0.5 + 1 10 2 ) = 0.07 ω C 17 = 1 10 ( 0.5 + 0.3 + 0.6 + 0.2 + 0.2 + 0.6 + 0.5 + 0.7 + 0.8 + 0.6 + 1 10 2 ) = 0.1 ω C 18 = 1 10 ( 0.2 + 0.7 + 0.8 + 0.4 + 0.9 + 0.8 + 0.3 + 0.5 + 0.3 + 0.5 + 1 10 2 ) = 0.14 ω C 19 = 1 10 ( 0.4 + 0.5 + 0.5 + 0.3 + 0.3 + 0.3 + 0.2 + 0.7 + 0.5 + 0.5 + 1 10 2 ) = 0.02 ω C 10 = 1 10 ( 0.5 + 0.4 + 0.6 + 0.5 + 0.3 + 0.5 + 0.4 + 0.5 + 0.5 + 0.5 + 1 10 2 ) = 0.07
Therefore:
ω C 1 = ( 0.17   0.11   0.05   0.11   0.14   0.07   0.1   0.14   0.02   0.07 )
Similarly:
ω C 2 = ( 0.1   0.11   0.15   0.15   0.09   0.12   0.06   0.1   0.09   0.03 ) ω C 3 = ( 0.08   0.06   0.13   0.11   0.16   0.12   0.14   0.07   0.06   0.07 ) ω C 4 = ( 0.08   0.07   0.15   0.06   0.14   0.17   0.12   0.09   0.04   0.08 )
Based on the weight vector of the four kinds of employee fuzzy judgment matrix, the weight coefficients of four kinds of employees are added to obtain the group weight vector as
ω C 1 = 0.3 × 0.17 + 0.3 × 0.1 + 0.2 × 0.08 + 0.2 × 0.08 = 0.113 ω C 2 = 0.3 × 0.11 + 0.3 × 0.11 + 0.2 × 0.06 + 0.2 × 0.07 = 0.092 ω C 3 = 0.3 × 0.05 + 0.3 × 0.15 + 0.2 × 0.13 + 0.2 × 0.15 = 0.116 ω C 4 = 0.3 × 0.11 + 0.3 × 0.15 + 0.2 × 0.11 + 0.2 × 0.06 = 0.112 ω C 5 = 0.3 × 0.14 + 0.3 × 0.09 + 0.2 × 0.16 + 0.2 × 0.14 = 0.129 ω C 6 = 0.3 × 0.07 + 0.3 × 0.12 + 0.2 × 0.12 + 0.2 × 0.17 = 0.115 ω C 7 = 0.3 × 0.1 + 0.3 × 0.06 + 0.2 × 0.14 + 0.2 × 0.12 = 0.1 ω C 8 = 0.3 × 0.14 + 0.3 × 0.1 + 0.2 × 0.07 + 0.2 × 0.09 = 0.104 ω C 9 = 0.3 × 0.02 + 0.3 × 0.09 + 0.2 × 0.06 + 0.2 × 0.04 = 0.044 ω C 10 = 0.3 × 0.07 + 0.3 × 0.03 + 0.2 × 0.07 + 0.2 × 0.08 = 0.075
Therefore, the weight vector of the criterion layer B1 to the index layer is given as
ω C 1 = ( 0.113   0.092   0.116   0.112   0.129   0.115   0.1   0.104   0.044   0.075 )
Similarly, the weight vectors of the criterion layers B2, B3, B4 to the index layer C can be summarized, as given below.
The weight vector of the criterion layer B2 to the index layer is given as
ω C 2 = ( 0.078   0.072   0.127   0.12   0.095   0.135   0.102   0.094   0.072   0.105 )
The weight vector of criterion layer B3 to the index layer is given as
ω C 3 = ( 0.79   0.072   0.125   0.141   0.116   0.112   0.097   0.08   0.079   0.099 )
The weight vector of criterion layer B4 to the index layer is given as
ω C 4 = ( 0.085   0.089   0.129   0.125   0.107   0.111   0.092   0.116   0.079   0.067 )
The weight vector ω C of the target layer can be obtained by calculating the criterion layer weight vector for the target layer and the index layer. Taking C 1 as the index, the weight vector of the operating capacity is calculated as
  0.125 × 0.133 + 0.34 × 0.078 + 0.365 × 0.079 + 0.17 × 0.085 = 0.08393  
Similarly, we can derive the weight vector of 10 risk factors in the index layer as
ω C = ( 0.0839   0.0774   0.1252   0.1275   0.109   0.120   0.0982   0.0939   0.0723   0.0926 )
According to the degree of importance, 10 risk factors were ranked, as follows profitability (0.1275), operating capacity (0.1252), monetary fund (0.120), solvency (0.109), accounts receivable (0.0982), inventory (0.0939), past performance (0.0926), macro-enterprise environment (0.0839), enterprise development (0.0774), and enterprise credit rating (0.0723).
Based on the importance ranking, the index C layer of the ranking of the indicators and the importance of evaluating the standard level is basically the same. The indicators of business performance and asset status are at the forefront of the core corporate credit risk and are the two factors affecting core enterprise credit risk the most. Therefore, by means of a fuzzy analytic hierarchy process, a quantitative risk assessment can be performed. This approach can be very helpful in conducting key analysis observations for financial institutions to provide supply chain financing for purposes of determining the key financial indicators.

6. Concluding Remarks

The primary purpose of the paper was to analyze core enterprise credit risks in supply chain finance, by means of a ‘fuzzy analytical hierarchy process’ (FAHP), and to construct a supply chain financial credit risk evaluation system. This paper extended earlier work discussing the fuzzy judgment matrix, developing a fuzzy Judgment matrix consistency check, weight vector of index layer C , weight vector of index layer C to criterion layer B , and composite weight vectors. The paper also provides a detailed empirical example that highlights the novelty of the model construction and solution.
Supply chain finance is ‘good medicine’ to solve the financing problem of small and medium-sized enterprises, which can effectively alleviate the capital constraints of SMEs and achieve benefits for many participants in the supply chain. Therefore, core enterprises should improve their economic strength by adjusting their business strategies and innovation to enhance enterprise competitiveness, improving their asset quality and credit records to enhance their industry status and core competitiveness.
Core enterprises should also carefully select SMEs in the supply chain; choosing those with good credit status, higher industry position, and strong profitability, to ensure the overall security and stability of the supply chain, reduce credit risks, and enhance the overall competitiveness.
There are several suggestions regarding balancing the development of supply chain finance, building and dynamic improvements of the supply chain financial risk evaluation and control system, and establishing electronic databases by commercial banks. At present, supply chain finance is mainly used in automobile, steel, and other industries, which have large industry limitations.
As important participants in the supply chain, core enterprises strengthen the strategic cooperative relationship of the supply chain members, so that supply chain financing can be extended to other industries to solve the financing constraints of SMEs. The core enterprises can also use their own advantages to expand supply chain financing to other industries to maximize the profits among different industry groups. In this way, core enterprises can play an important role in supply chain finance.
Supply chain finance is involved in the exchange of capital flows, information flows, and logistics. The major participants include banks, core enterprises and SMEs. In order to maintain the interests of all parties, it is necessary to construct and perfect the risk evaluation and control system. This requires establishing a scientific concept of risk management and risk assessment based on real transactions. The main business objects involved in supply chain financing should be strictly controlled to control a variety of risks, dynamic adjustments of the arbitrary but reasonable weights, and improving the supply chain financial risk assessment system.
A unified information file should be collected based on the core enterprise, including the operating conditions, asset status, industry status, credit record, effective information to the database, collecting related data upstream and downstream of the archives around the core enterprise, developing a data information system, electronic data information, and updating the database accurately using the latest information that might be available.
Finally, through the establishment of a database on the supply chain finance, supply chain finance and modern information technology are integrated to establish the sharing of information resources, and realize the exchange of information flows, capital flows, and logistics between banks. The core enterprises and small and medium-sized enterprises will thereby function more smoothly, which not only improves the efficiency of the supply chain operation, but should also reduce a variety of risks, and improve the efficiency and effectiveness of supply chain finance.

Author Contributions

Data curation, W.M.; Formal analysis, W.M., W.-K.W. and M.M.; Methodology, M.M.; Project administration, W.-K.W.; Software, W.M.; Validation, W.-K.W. and M.M.; Writing—original draft, W.M.; Revisions M.M.; Writing—review & editing, W.-K.W. and M.M.

Funding

This research received no external funding.

Acknowledgments

The authors are grateful for the very helpful comments and suggestions of three reviewers. For financial support, the third author wishes to acknowledge the Australian Research Council and Ministry of Science and Technology (MOST), Taiwan.

Conflicts of Interest

The authors declare no conflict of interest.

Appendix A. Questionnaire

The research in this paper is based on the data of the questionnaire and the case enterprise, which are objective. The data of the questionnaire have certain subjective components.
The questionnaires were based on random sampling and they did not have any economic interest in the study. In terms of economic characteristics, the sample is divided into four levels, namely management personnel, senior engineers, middle-level employees, and general employees. They have a certain degree of representation which guarantees the objectivity and reliability of the research.
The latter is aligned with the mean, so this contingency does not affect the results of the study as the focus of the study is the mean.
The questionnaire is conducted using sampling methods, and there is no conflict of interest as the employees did not have any economic interest in this study.
The paper uses a simple averaging method to take values, which should not have a significant impact on the results of the study. The data obtained from the entire questionnaire are processed in advance during the writing process. Given space limitations, the data aggregation and processing are not presented in detail.
Business friends:
First of all, thank you for completing this questionnaire. We are conducting an academic study to study the financial credit risk of supply chain. We guarantee that all survey data are for academic research only, and will not involve the trade secrets of the unit. The information obtained will not be used for any commercial purpose. We hope you will take the time to provide us with the following information. The investigation is not registered, and answers are neither right nor wrong. If there is a problem that does not fully express your opinion, please choose the answer that is closest to your opinion. Thank you for your help!
Basic Information
  • Your gender is (    ).
    A. Male B. Female
  • Your age is (    ).
    A. 20–30 years old B. 31–40 years old  C. 41–50 years old   D. 51–60 years old
  • Your working life in this unit is (    ).
    A. 5 years or less B. 5–10 years C. 10–20 years D. 20 years or more
  • Your position in this unit is (    ).
    A. General employees B. Middle-level employees C. Senior engineers D. Managers
  • Your department in the unit is (    ).
    A. Purchasing department  B. Production department   C. Sales department
    D. Finance department  E. Personnel Department F. Logistics Department G. Others
  • The industry of the unit is (    ).
    A. Steel industry    B. Textile industry
    C. Home appliance manufacturing  D. Medical machinery industry
  • Your academic qualifications (    ).
    A. High School   B. Undergraduate   C. Master/Dr.   D. Specialist
Credit Risk Survey
The following is a description of the financial risk indicators for the supply chain.
Please make your choices for each of the influencing factors according to your company’s situation and your personal experience.
The larger is the number, the higher is the risk. For example, the choice of 1, which indicates that the risk level is very low: the choice of 2, indicating a low degree of risk; the choice of 3, indicating a moderate degree of risk; the choice of 4, indicating a high degree of risk: the choice of 5, indicating a high degree of risk. Please mark ‘√’ on the corresponding number.
1. Criteria Layer Risk
Risk factorRisk level
12345
Industry status                         
Operation                         
Asset state                         
Credit history                         
2. Risks of Each Indicator Layer Under the Criteria Layer
Risk factorRisk level
12345
Macro environment                         
Enterprise development                         
Operation ability                         
Profitability                         
Solvency                         
Monetary fund                         
Accounts receivable                         
Inventory                         
Enterprise credit rating                         
Past performance                         

Appendix B. Calculation of the Fuzzy Judgment Matrices

C 11 = [ 0.5 0.4 0.3 0.5 0.7 0.3 0.5 0.2 0.4 0.5 0.6 0.5 0.6 0.4 0.6 0.3 0.3 0.7 0.5 0.4 0.7 0.4 0.5 0.6 0.3 0.5 0.6 0.8 0.5 0.6 0.5 0.6 0.4 0.5 0.7 0.8 0.2 0.4 0.3 0.5 0.3 0.4 0.7 0.3 0.5 0.5 0.2 0.9 0.5 0.3 0.7 0.7 0.5 0.2 0.5 0.5 0.6 0.8 0.3 0.5 0.5 0.7 0.4 0.8 0.8 0.4 0.5 0.3 0.2 0.4 0.8 0.3 0.2 0.6 0.1 0.2 0.7 0.5 0.7 0.5 0.6 0.5 0.5 0.7 0.5 0.7 0.8 0.3 0.5 0.5 0.5 0.6 0.4 0.5 0.7 0.5 0.6 0.5 0.5 0.5 ]
C 12 = [ 0.5 0.4 0.7 0.6 0.5 0.3 0.4 0.5 0.7 0.4 0.6 0.5 0.9 0.5 0.2 0.5 0.3 0.4 0.5 0.5 0.3 0.1 0.5 0.5 0.4 0.7 0.6 0.4 0.5 0.5 0.4 0.5 0.5 0.5 0.5 0.6 0.5 0.3 0.3 0.4 0.5 0.8 0.6 0.5 0.5 0.4 0.5 0.4 0.6 0.3 0.7 0.5 0.3 0.4 0.6 0.5 0.2 0.5 0.6 0.5 0.6 0.7 0.4 0.5 0.5 0.8 0.5 0.4 0.6 0.4 0.5 0.6 0.6 0.7 0.6 0.5 0.6 0.5 0.1 0.3 0.3 0.5 0.5 0.7 0.4 0.4 0.4 0.9 0.5 0.5 0.6 0.5 0.5 0.6 0.7 0.5 0.6 0.7 0.5 0.5 ]
C 13 = [ 0.5 0.3 0.4 0.5 0.5 0.7 0.6 0.4 0.8 0.5 0.7 0.5 0.6 0.9 0.4 0.7 0.5 0.3 0.3 0.4 0.6 0.4 0.5 0.2 0.5 0.3 0.6 0.6 0.5 0.3 0.5 0.1 0.8 0.5 0.6 0.8 0.7 0.5 0.4 0.5 0.5 0.6 0.5 0.4 0.5 0.6 0.7 0.2 0.2 0.4 0.3 0.3 0.7 0.2 0.4 0.5 0.3 0.5 0.6 0.5 0.4 0.5 0.4 0.3 0.3 0.7 0.5 0.6 0.5 0.6 0.6 0.7 0.4 0.5 0.8 0.5 0.4 0.5 0.3 0.4 0.5 0.7 0.5 0.6 0.8 0.4 0.5 0.7 0.5 0.7 0.2 0.6 0.7 0.5 0.6 0.5 0.4 0.6 0.3 0.5 ]
C 14 = [ 0.5 0.3 0.4 0.6 0.5 0.5 0.7 0.4 0.6 0.7 0.7 0.5 0.5 0.3 0.6 0.9 0.5 0.3 0.5 0.6 0.6 0.5 0.5 0.6 0.5 0.6 0.2 0.4 0.3 0.5 0.4 0.7 0.4 0.5 0.4 0.3 0.7 0.6 0.5 0.4 0.5 0.4 0.5 0.6 0.5 0.4 0.4 0.5 0.4 0.2 0.5 0.1 0.4 0.7 0.6 0.5 0.7 0.4 0.5 0.4 0.3 0.5 0.8 0.3 0.6 0.3 0.5 0.2 0.6 0.5 0.6 0.7 0.6 0.4 0.5 0.6 0.8 0.5 0.4 0.2 0.4 0.5 0.7 0.5 0.6 0.5 0.4 0.6 0.5 0.7 0.3 0.4 0.5 0.6 0.8 0.6 0.5 0.8 0.3 0.5 ]

References

  1. Berger, A.N.; Udell, G.F. A more complete conceptual framework for SME finance. J. Bank Financ. 2006, 30, 2945–2966. [Google Scholar] [CrossRef]
  2. Klapper, L. The role of factoring for financing small and medium enterprises. J. Bank Financ. 2006, 30, 3111–3130. [Google Scholar] [CrossRef]
  3. Beck, T.; Demirguc-Kunt, A. Small and medium-size enterprises: Access to finance as a growth constraint. J. Bank Financ. 2006, 30, 2931–2943. [Google Scholar] [CrossRef]
  4. Shi, Y.L.; Guan, Z.G.; Xie, X. Risk evaluation model building of logistics financial business for the bank and empirical research. J. Syst. Manag. Sci. 2014, 4, 53–61. [Google Scholar]
  5. Shi, J.Z.; Guo, J.E.; Wang, S.B.; Wang, Z.H. Credit risk evaluation of online supply chain finance based on third-party B2B e-commerce platform: An exploratory research. International Journal of u- and e-Service. Sci. Technol. 2015, 8, 93–104. [Google Scholar]
  6. Hofmann, E. Supply chain finance: Some conceptual insights. Logistic Management. In Logistik Management—Innovative Logistikkonzepte; Lasch, R., Janker, C.G., Eds.; Deutscher Universitätsverlag: Wiesbaden, Germany, 2005. [Google Scholar]
  7. Pfoh, H.; Gomm, M. Supply chain finance: Optimizing financial flows in supply chains. Logist. Res. 2009, 1, 149–161. [Google Scholar] [CrossRef]
  8. Gupta, S.; Dutta, K. Modeling of financial supply chain. Eur. J. Oper. Res. 2011, 211, 47–56. [Google Scholar] [CrossRef]
  9. Mathis, F.J.; Cavinato, J. Financing the global supply chain: Growing need for management action. Thunderbird Int. Bus. Rev. 2010, 52, 467–474. [Google Scholar] [CrossRef]
  10. Silvestro, R.; Lustrato, P. Integrating financial and physical supply chains: The role of banks in enabling supply chain integration. Int. J. Oper. Prod. Manag. 2014, 34, 298–324. [Google Scholar] [CrossRef]
  11. Blackman, I.D.; Holland, C.P.; Westcott, T. Motorola’s global financial supply chain strategy. Supply Chain Manag. 2013, 18, 132–147. [Google Scholar] [CrossRef]
  12. Caniato, F.; Gelsomino, L.M.; Perego, A.; Ronchi, S. Does finance solve the supply chain financing problem? Supply Chain Manag. 2016, 21, 534–549. [Google Scholar] [CrossRef]
  13. Zhu, Y.; Xie, C.; Sun, B.; Wang, G.J.; Yan, X.G. Predicting China’s SME credit risk in supply chain financing by logistic regression, artificial neural network and hybrid models. Sustainability 2016, 8, 433. [Google Scholar] [CrossRef]
  14. Liu, X.; Zhou, L.; Wu, Y.C.J. Supply chain finance in China: Business innovation and theory development. Sustainability 2015, 7, 14689–14709. [Google Scholar] [CrossRef]
  15. Feldmann, M.; Müller, S. An incentive scheme for true information providing in Supply Chains. Omega 2003, 31, 63–73. [Google Scholar] [CrossRef]
  16. Berger, A.N.; Udell, G.F. The economics of small business finance: The roles of private equity and debt markets in the financial growth cycle. J. Bank Financ. 1998, 22, 613–673. [Google Scholar] [CrossRef]
  17. Ganlindo, A.; Schiantarelli, F. (Eds.) Credit Constraints and Investment in Latin America; Inter-American Development Bank: Washington, DC, USA, 2003. [Google Scholar]
  18. Schiffer, M.; Weder, B. Firm Size and the Business Environment: Worldwide Survey Results; Discussion Paper No. 43; International Finance Corporation: Washington, DC, USA, 2001. [Google Scholar]
  19. Beck, T.; Demirguc-Kunt, A.; Laeven, L.; Maksimovic, V. The determinants of financing obstacles. J. Int. Money Financ. 2006, 25, 932–952. [Google Scholar] [CrossRef] [Green Version]
  20. Song, J.S.; Zipkin, P. Inventories with multiple supply sources and networks of queues with overflow bypasses. Manag. Sci. 2009, 55, 362–372. [Google Scholar] [CrossRef]
  21. Wuttke, D.A.; Blome, C.; Henke, M. Focusing the financial flow of supply chains: An empirical investigation of financial supply chain management. Inter. J. Prod. Econ. 2013, 145, 773–789. [Google Scholar] [CrossRef]
  22. Randall, W.S.; Farris, M.T. Supply chain financing: Using cash-to-cash variables to strengthen the supply chain. International Journal of Phys. Distrib. Logist. Manag. 2009, 39, 669–689. [Google Scholar] [CrossRef]
  23. Committee on Finance and Industry (1931), Report of Committee on Finance and Industry. Cmd 3897; p. 322. Available online: http://discovery.nationalarchives.gov.uk/details/r/C1851842 (accessed on 20 September 2018).
  24. Stamp, J.C. The report of the Macmillan Committee. Econ. J. 1931, 41, 424–435. [Google Scholar] [CrossRef]
  25. Lee, C.H.; Rhee, B.D. Trade credit for supply chain coordination. Eur. J. Oper. Res. 2011, 214, 136–146. [Google Scholar] [CrossRef]
  26. Jüttner, U.; Maklan, S. Supply chain resilience in the global financial crisis: An empirical study. Supply Chain Manag. 2011, 16, 246–259. [Google Scholar]
  27. Saaty, T.L. How to make a decision: The Analytic Hierarchy Process. Eur. J. Oper. Res. 1990, 48, 9–26. [Google Scholar] [CrossRef]
Figure 1. Core enterprise credit risk evaluation system hierarchical graph.
Sustainability 10 03699 g001
Table 1. FAHP Scale.
Intensity of AHP ScaleLinguistic VariablePositive ValuePositively Reciprocal Value
1Same importance(1, 1, 1)(1, 1, 1)
3Weakly more important(2, 3, 4)(1/4, 1/3, 1/2)
5Fairly more important(4, 5, 6)(1/6, 1/5, 1/4)
7Strongly more important(6, 7, 8)(1/8, 1/7, 1/6)
9Absolutely more important(8, 9, 10)(1/10, 1/9, 1/8)
2, 4,6,8Intermediate values

