Article

Food Security for an Aging and Heavier Population

Industrial Ecology Programme, Department of Energy and Process Engineering, Norwegian University of Science and Technology (NTNU), 7491 Trondheim, Norway
*
Author to whom correspondence should be addressed.
Co-first authorship.
Sustainability 2018, 10(10), 3683; https://doi.org/10.3390/su10103683
Submission received: 28 August 2018 / Revised: 3 October 2018 / Accepted: 8 October 2018 / Published: 15 October 2018

Abstract

:
Changes in national and global food demand are commonly explained by population growth, dietary shifts, and food waste. Although nutrition sciences demonstrate that biophysical characteristics determine food requirements in individuals, and medical and demographic studies provide evidence for large shifts in height, weight, and age structure worldwide, the aggregated effects for food demand are poorly understood. Here, a type–cohort–time stock model is applied to analyze the combined effect of biophysical and demographic changes in the adult population of 186 countries between 1975–2014. The average global adult in 2014 was 14% heavier, 1.3% taller, 6.2% older, and had a 6.1% higher energy demand than the average adult in 1975. Across countries, individuals’ weight gains ranged between 6–33%, and energy needs increased between 0.9–16%. Noteworthy, some of the highest and lowest increases coexist within Africa and Asia, signaling the disparities between the countries of these regions. Globally, food energy increased by 129% during the studied period. Population growth contributed with 116%; weight and height gains accounted for 15%; meanwhile, the aging phenomenon counteracted the rise in energy needs by −2%. This net additional 13% demand corresponded to the needs of 286 million adults. Since the effect of biodemographic changes are cumulative, we can expect the observed inertia to extend into the future. This work shows that considering the evolving individual biophysical characteristics jointly with sociodemographic changes can contribute to more robust global resource and food security assessments. Commonly used static and homogenous caloric demand values per capita might lead to misrepresentations of actual needs. What previous analyses could have estimated as increased food availability, sufficiency, or surplus waste might actually be energy sequestered by the mass of the human lot. Based on the discovered trends, feeding nine billion people in 2050 will require significantly more total calories than feeding the same people today.

Graphical Abstract

1. Introduction

Human activity is regarded as the dominant cause of contemporary environmental change, driven by the resources required by populations [1,2,3,4,5]. The most comprehensive assessments on the human–environment relationship traditionally describe resource use as a function of the population’s size, affluence, and technology [4,6,7,8,9,10,11,12]. Yet, population remains an exogenous variable that is deprived of evolving biophysical traits. Evidence shows that humans changed drastically at the individual and societal levels over the past century. Notably, global life expectancy increased from 36 to 70 years during the 20th century [13]. Similarly, adult height increased as much as 20 cm for some nations in only four generations (100 birth cohorts) [14]. Global average body mass index (BMI) (see Supplementary Information for a glossary of terms) increased by 0.4 kg/m2 per decade [15], increasing from 21.7 kg/m2 in 1975, to 24.2 kg/m2 in 2014 for male adults [16]. Senescence has been delayed by a decade, leading to a more long-lived species [17]. At the same time, demographic transitions accelerated, driven by an aging population, and decreased fertility and mortality rates [18,19].
Although populations can be seen as stocks of individuals that require constant flows of energy and materials to be sustained, individuals and groups have different and evolving characteristics, which in turn also demand differentiated resources [5]. Beyond population size, what are the implications of heterogeneous and dynamic population characteristics for the sustainability goals? The combined effects of individual biophysical and demographic changes for resources, particularly food, remains poorly understood.
Food security is a global major concern [20]. Ending hunger and granting access and adequate nutrition for everyone is one of the sustainable development goals by 2030 [21]. Yet, research on food availability typically models food production, supply, and losses [22,23,24,25,26]. In other words, most of the assessments on food for human consumption and diets do not actually model “humans”, but rather “products”.
Indeed, most of the recent assessments on “diets” are based on supply data provided by the Food and Agriculture Organization (FAO) balance sheets and methodologies [12,27]. The common limitation is the scarcity of harmonized bottom–up physical dietary data next to the convenience of food balance sheets maintained by the FAO for most of the countries in the world [28].
“To compute per capita dietary energy consumption in calories, the FAO has traditionally relied on food balance sheets… this choice was due mainly to the lack of suitable surveys conducted regularly.”.
(p. 49, [20])
Moreover, average per capita “food consumption” is commonly calculated as the total food calories supplied in a given country, divided by its total population [12]. Although some authors acknowledge the discrepancy between supply side and actual requirements, they are bound to common practices and data availability:
“The (food consumption) values are assessed through a commodity balance model and include household level and retail wastes. They are, therefore, not equal to actual food intake but are commonly used and well suited for cross-country comparisons…”.
(p. 4, [12])
“Although these [dietary] data include wastes from processing, packaging, and transport, they do not include consumer waste and so do not correspond to the average consumed diet.”.
(p. 13415, [27])
Indeed, supply-side data include retail and household level losses, which can be as high as one-third of the total supply for developed nations [12]. Moreover, registered food supply might be used as livestock feed [29].
It is problematic to (1) base assessments of “food demand and dietary requirements” on supply-side data and to (2) simplify population as the “number of people” when estimating availability or sufficiency. The first implies assessing resource requirements based on preferences and business as usual practices, including wasteful lifestyles, instead of assessing actual needs [30]. The latter neglects how different people from different ages, sex, birth cohorts, and body types have different food requirements. Both omissions might introduce a biased perspective when assessing the physical food needs of a particular year [31]. However, treating population as a number with static and homogenous requirements might have major implications when studying historical changes [12], forecasting scenarios [32], strategizing for food resilience [31], or monitoring progress toward sustainable development goals [21,33].
Based on standard methods, official statistics indicate global progress toward raising food consumption per person in the last three and a half decades, increasing from an average of 2370 kcal/person/day, to 2770 kcal/person/day [32]. However, given body-type changes, does a 30-year-old American male in 2014 require the same calories as his counterpart in 1974? Regarding demographic changes, do one million people representing the American population of 1974 collectively require the same calories as a similar representative sample in 2014?
Clarifying such questions is particularly important for assessing food requirements, which are not solely dependent on economic and technological factors, but are fundamentally a function of the energetic metabolic requirements of humans [34] depending on sex, age, weight, and physical activity level. The influence of these factors has been studied in individuals [35,36,37] and to a lesser extent at demographic levels [29,38,39]. Furthermore, most of the studies that are concerned with global food security overlook the effect of changes in the metabolic requirements of humans [24,32,40,41,42], and mainly focus on the technological aspects of food losses and waste [25,26].
The food-energy requirements of a person depend upon their biophysical characteristics, including age, sex, and weight [34]. For example, the food-energy needs of a male are generally larger than those of a female of the same weight and age. Similarly, people of the same sex but of different age and/or weight have different food-energy needs. Furthermore, people born in different generations—even in the same country—might have significantly different body configurations at a given life stage.
There have been increases in height [14] and body mass [16] between cohorts in the last century, both leading to increases in weight. Younger generations tend to be taller and heavier than older ones. Moreover, a worldwide aging phenomenon has been observed [19,43,44], particularly in developed nations. Both conditions, along with population growth [18], have repercussions for food demand. While weight increments lead to higher energy requirements, these requirements decrease with aging.
Thus, the society-wide food-energy requirements can be described as a function of both demographic and biological processes. The joint and independent effects of these drivers on food demand have not been systematically explored.
Few studies evaluated the food energy issue from a metabolic perspective at the global scale. Walpole et al. [39] studied the adult population (for the remainder of this paper, ‘population’ is used to denote ‘adult population’, unless otherwise specified) of 190 countries for the year 2005. Their results focused on the impact of obesity and showed that the energy requirements attributable to these factors corresponded to the energy requirements of 135 million global average adults. They also conclude that increasing cases of overweight and obesity could have an effect that is equivalent to the energy requirements of an extra half a billion people by 2050.
More recently, Hiç et al. [29] studied the energy requirements for 169 countries from a longitudinal perspective (1950–2050), including infants, children, adolescents, adults, elders, and pregnant and lactating women. The authors found that the average population’s energy requirements increased in the past by 2.2% due to demographic structural changes, while using static average weight values. Although this study captures most of the demographic nuances of the human food requirements, it disregards the biophysical changes in height and BMI, which are proven to be the relevant factors for explaining changes in food demand. Thus, longitudinal food energy studies that account for these biophysical changes at the global scale are missing.
This article combines concepts from nutritional health sciences and demography, i.e., biodemography, with a dynamic stock modeling approach to deconstruct the role of population for food demand. It characterizes the implications of the biophysical heterogeneity of individuals and demographic transitions across nations and throughout time. The purpose is to clarify whether ignoring such aspects might—or not—lead to misrepresentations in food security assessments, forecasts, and scenarios.
This is the first study to deconstruct the role of human populations’ physical characteristics from a longitudinal perspective, beyond mere population numbers, as a driver of global food demand. This article presents the integrated effect of changes of the individual biophysical traits of height, weight, and BMI and demographics on the human mass and food energy requirements of the population of 186 countries from 1975 to 2014. The results presented here are based on yearly sex-and-age disaggregated data for each country. In total, the dataset spans 114 birth cohorts.

2. Materials and Methods

This paper models population as a dynamic stock constituted by individual elements of diverse types whose size and characteristics change over time—either across generation or along their life. In other words, populations are composed of individuals of different ages and sexes whose characteristics change along their life and across cohorts; for instance, height, weight, life expectancy, and metabolic rate.
The methodical approach presented here is founded on the theory of demographic metabolism that was introduced by Lutz [45] to explain how societal changes result from the changing compositions of the population and its characteristics (e.g., sex, age, life expectancy, educational level, etc.). Some of these characteristics might change over the life of a person (e.g., educational level, age, body size) or generations (e.g., life expectancy, anthropometric features). Up until now, the demographic metabolism approach, despite a high degree of granularity when studying populations and data availability, has not been widely applied to address human needs or deconstruct the role of population as a driver of resource use.
The mathematical foundations of this paper are based on a “type–cohort–time” (TCT) approach, which is typically used to model resource use in the dynamic stocks of the built environment [46,47,48]. Here, a TCT approach is applied to investigate the changes in food-energy demand due to changes in the demographic structure and the biophysical characteristics of the world’s population between 1975–2014.
Figure 1 presents a system and model definition for the study of the food energy demand “e” of the world’s adults. The populations “P” of 186 nations “k” are modeled as a stock that is constituted of individual humans of different sexes (types) “i” and cohorts “c”, whose biophysical characteristics and energy needs evolve over time “t”. Particularly, the population stock is differentiated by sex and birth cohort, and the body mass index and height are used to estimate the caloric demand of individuals according to their sex and age. The SI describes the classical demographic modeling approach that was adapted in this research.

2.1. Food Energy Demand Calculations

The calculations are based on the FAO guidelines [34] for total human energy expenditure to approximate the daily food energy “e” demand of a person (Equation (1)). First, the basal metabolic rate (BMR) is calculated as a function of weight “W”, sex, and age with the guide’s formulae on “Table 5.2” of the guidelines. Second, the average food energy need (theoretical energy expenditure) is estimated by multiplying the BMR by a factor of 1.76 to account for the physical activity level (PAL). This is the average value in the FAO’s guide (Table 5.1), which represents an “active or moderately active” lifestyle. A moderate activity level was assumed for all of the population, because specific PAL information is not available for most of the countries.
  e i , c , t = B M R i , c , t · PAL  
Walpole’s [39] considerations were followed to derive weight from BMI and height “H” (Equation (2)). BMI and height are taken from studies from the NCD-RFC (Noncommunicable Diseases Risk Factor Collaboration) [14,16]. The annual information on mean BMI, which is only available by sex, was assumed to be representative for adults of all ages. This allows the sex–cohort–time average weight calculations. In addition, the mean adult height, reported at the age of 21, was assumed to be achieved at the age of 18 for consistency with the BMI data, which reports from this age. Height data are available for the 1896–1996 cohorts; hence, adults from the 1875–1895 cohorts are considered to have the same height as their 1896 peers. The assumptions on height have a minor effect in the results and conclusions, as the population in the cohorts of concern represent a small share of the total population.
  W i , c , t = B M I i , c , t · H i , c 2  
Average (per capita) values of food energy and weight at the national and global levels are weighted averages by population size, sex, and age. The total food energy “E” requirements and the total mass “M” (of a nation) aggregated the weight and energy demand of the individuals of all of the ages and sexes (Equations (3) and (4)).
  M t , k = i c P i , c , t , k · W i , c , t , k  
  E t , k = i c P i , c , t , k · e i , c , t , k  

2.2. Data Sources

Population statistics were obtained from the United Nations [49], which are available for every year of analysis by age groups of five years. For the 1975–1989 period, the data are available for 17 age groups covering the ages 0 to 80+. For the 1990–2014 period, the data are available for 21 age groups for the ages 0 to 100+. For every year of analysis, the age group’s population was distributed equally among each individual age of the group. For the period 1975–1989 the 80+ population was apportioned among the ages 80 to 100+ by using the distribution of 1990. All of the input data that were used for the research are publically available as referenced within the paper, and made available for the reader as an Extended Data file.

3. Results

3.1. Global Trends

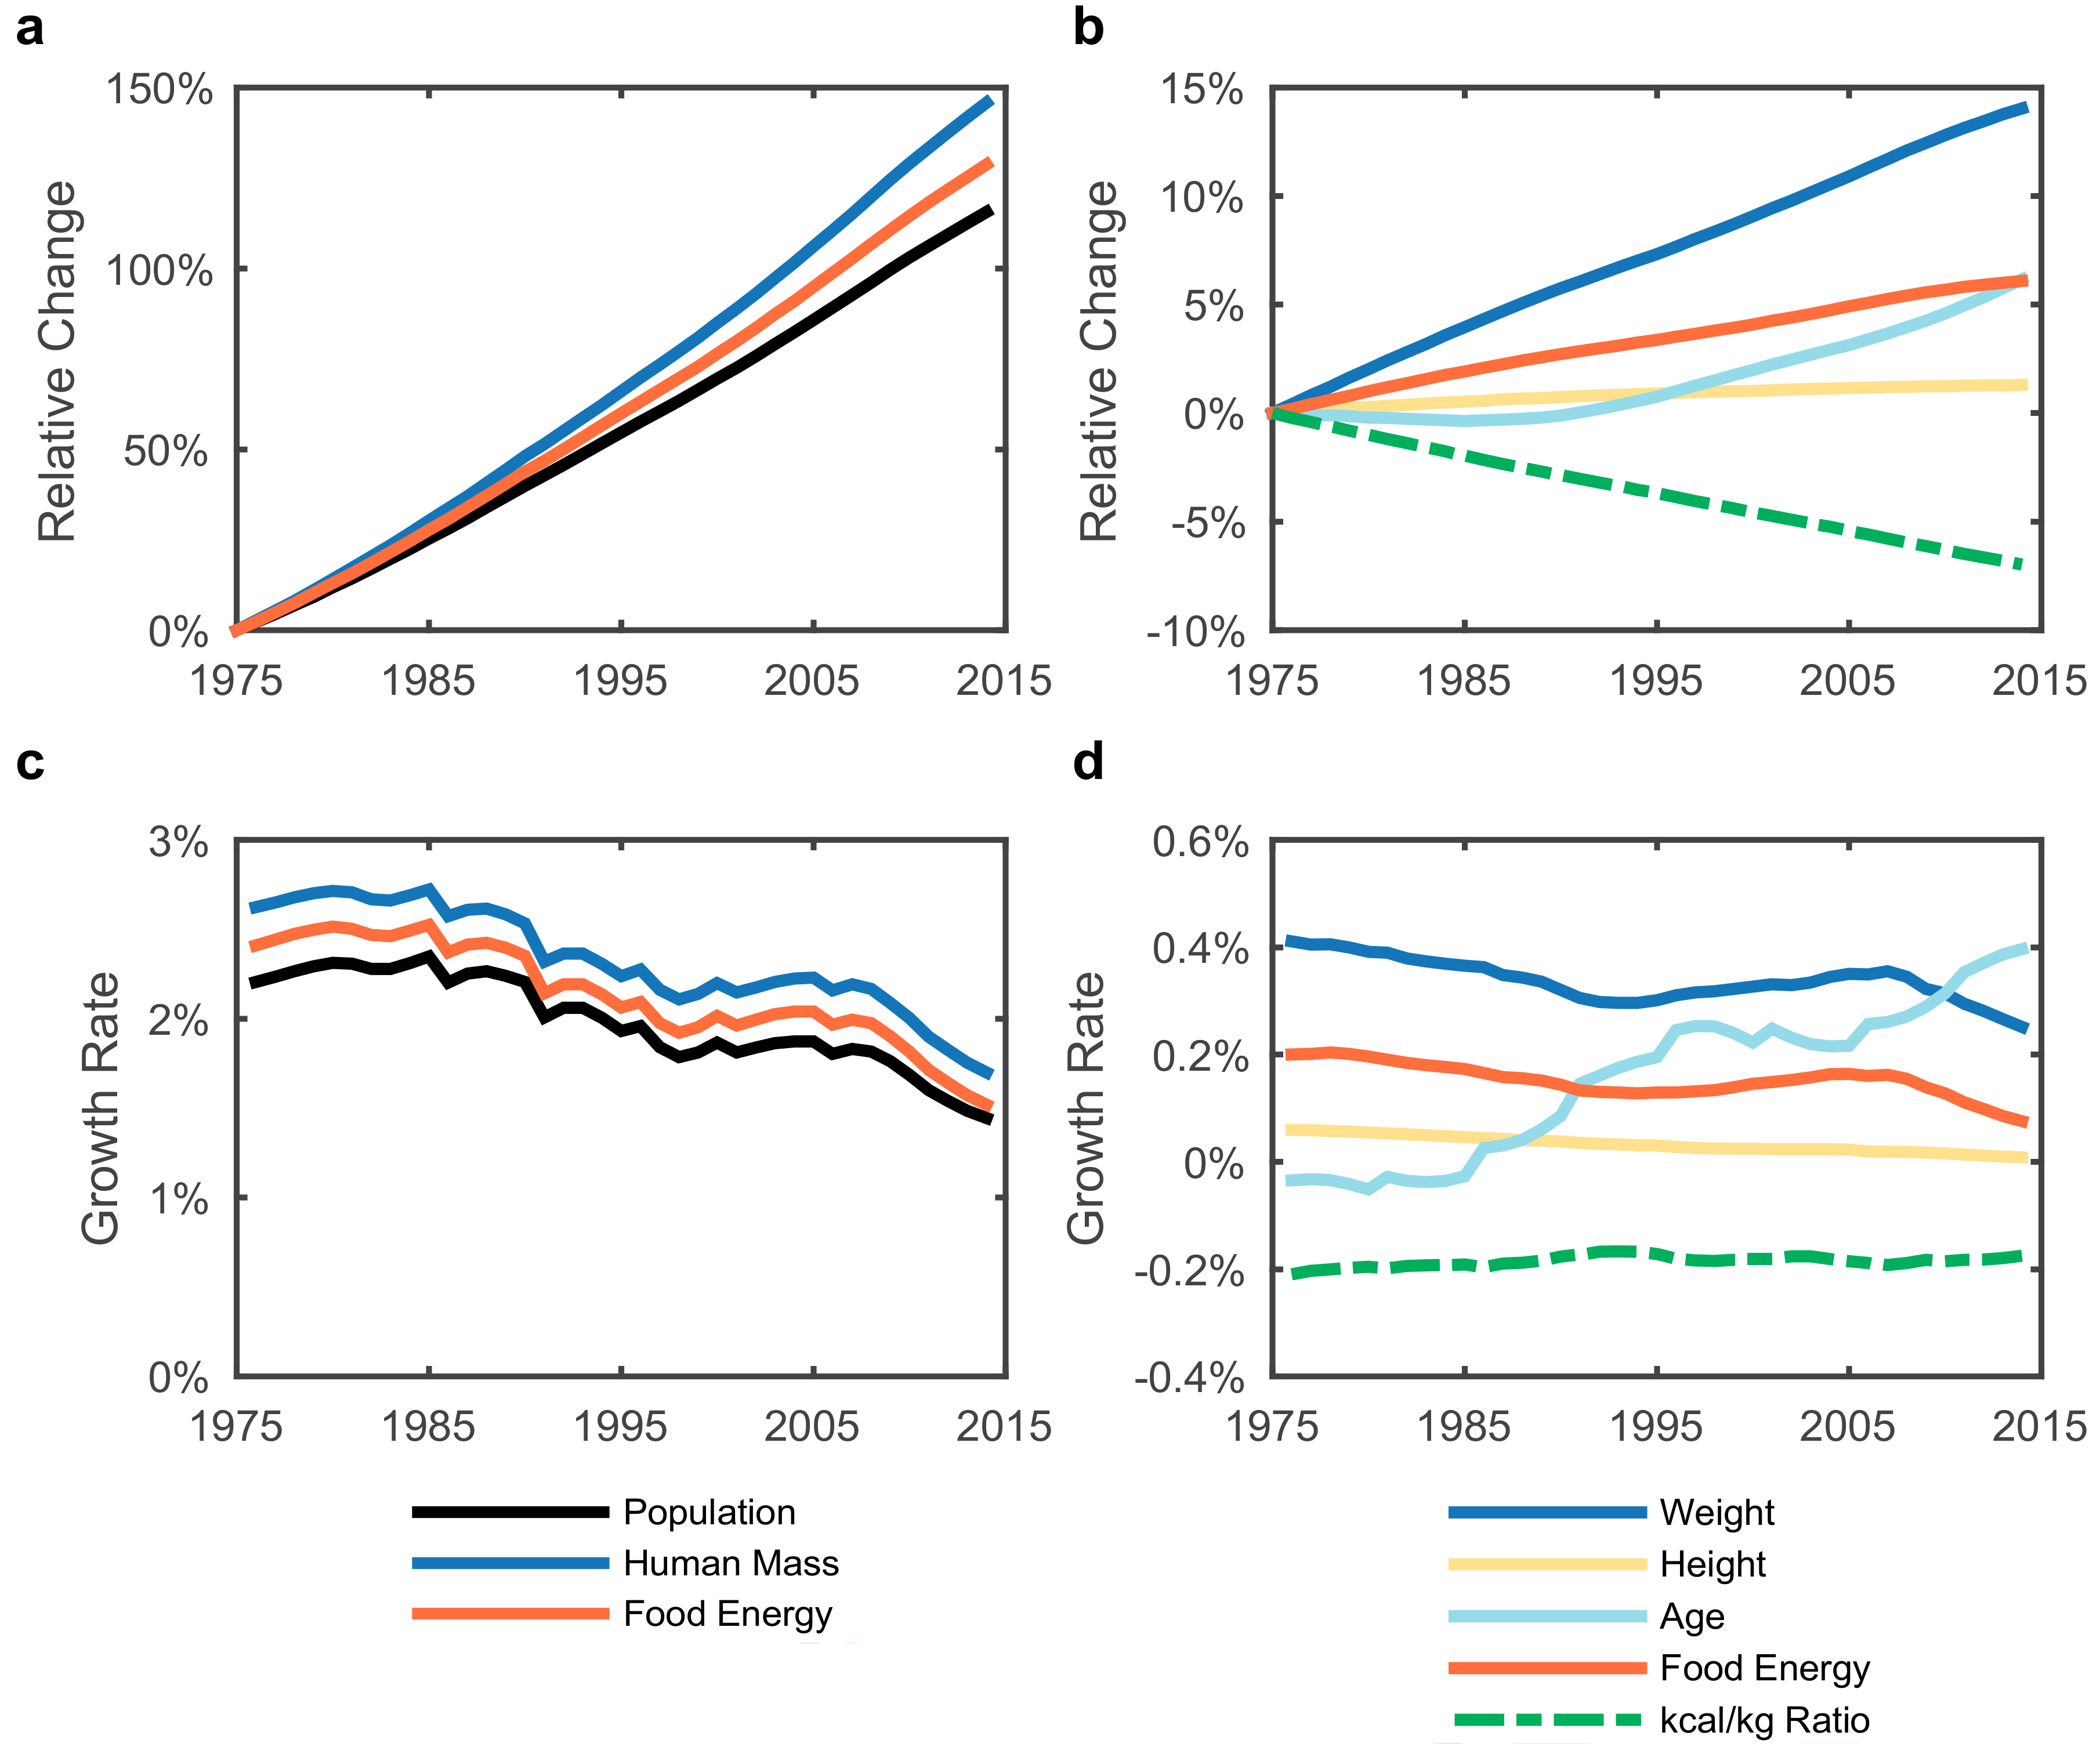
In the past four decades, the population increased by 116%, but was outpaced by increases of 146% in human mass and 129% in total theoretical food energy requirements (Figure 2a). The average global adult in 2014 is 14% heavier, 1.3% taller, 6.2% older, and has a 6.1% higher energy demand than the average adult in 1975 (Figure 2b and Figure 3). From a global perspective, the effect of this additional demand is equivalent to the food energy needs of 286 million adults today. This is equivalent to about 1.2 times the population of United States, or double that of Brazil. The total mass increase due to additional weight was 39.68 Mton, which is the equivalent of almost the adult mass of India or two times that of the United States.
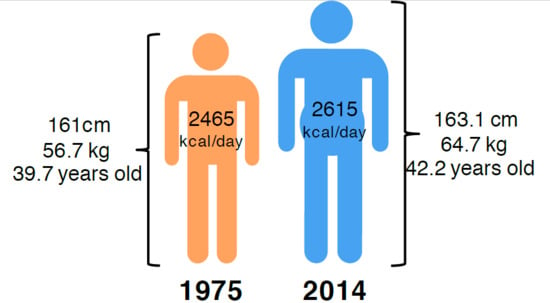
In 2014, the global population was 4.98 billion people, weighed 322 Mton, and demanded 13 Tkcal/day (Figure S1). Half of the population resided in only five countries: China, India, the United States, Indonesia, and Brazil. These countries, when combined with Russia, represented 50% of the global human mass and food energy requirements. The world average adult weighed 64.7 kg, was 163 cm tall, was 42 years old, and demanded 2615 kcal/day, assuming a moderately active lifestyle [34] (Figure 3).
Population, human mass, and food energy grew at different rates (Figure 2c). The non-linear relationship between weight and food energy changes (Figure S2b) explains the continuous decoupling between weight gains and energy increases (Figure 2b). The food energy demand per kilogram of body weight (i.e., the energy-to mass ratio) decreased by almost 7%, from 43.4 kcal/kg to 40.4 kcal/kg. This implies a trend of diminishing returns i.e., for every kilogram of body weight increase, there was a reduction of 70 to 91 calories needed per every additional kilogram.
The total mass and energy growth rates declined between 1986–1998 and 2006–2014, generally following the population trend (Figure 2c). In addition, these periods were characterized by decelerations in weight gain and accelerations in aging (Figure 2d), which increased the decoupling between weight and energy. Since energy requirements tend to decline in the latter stages of life [34], aging mitigated the global surge in food requirements (Figure 4 and Figure S2d).
The aging effect in the period 1975–2014 decreased food energy requirements by 1.9% (Figure 4), corresponding to the food needs of approximately 40 million adults, which is equivalent to the population of South Korea. Conversely, the rise in BMI increased the energy requirements by 14% in the same period (Figure 4). This is equivalent to the food needs of approximately 308 million adults, i.e., the combined population of Mexico and the United States.
In this study, the food energy requirements for the world average adult (2615 kcal/cap/day) are slightly higher than those of Walpole et al. [39] (2549 kcal/cap/day for 2005 adults) and Hiç et al. [29] (2370 kcal/cal/day for all the 2010 population). The difference between this study and that of Walpole et al. can be explained by the nine additional years that were included in this study, since our 2005 estimate of 2586 kcal/cap/day is similar to theirs (Dataset S1). The difference with Hiç et al. may be attributed to their inclusion of youths, which is a demographic with lower calorie requirements.
Hiç et al. [29] reported a 2.2% increase in average energy requirements between 1950–2010, while our estimates suggest a 6.1% increment between 1975–2014. Hiç et al. attributed the changes to demographic transitions toward older populations while recognizing the limitations of their approach in not including changes in weight. The results presented here depict the relevance of considering both weight and demographic structural changes when accounting for food energy, and demonstrate that changes in height and BMI have a larger impact than demographics (Figure 4).

3.2. National Trends

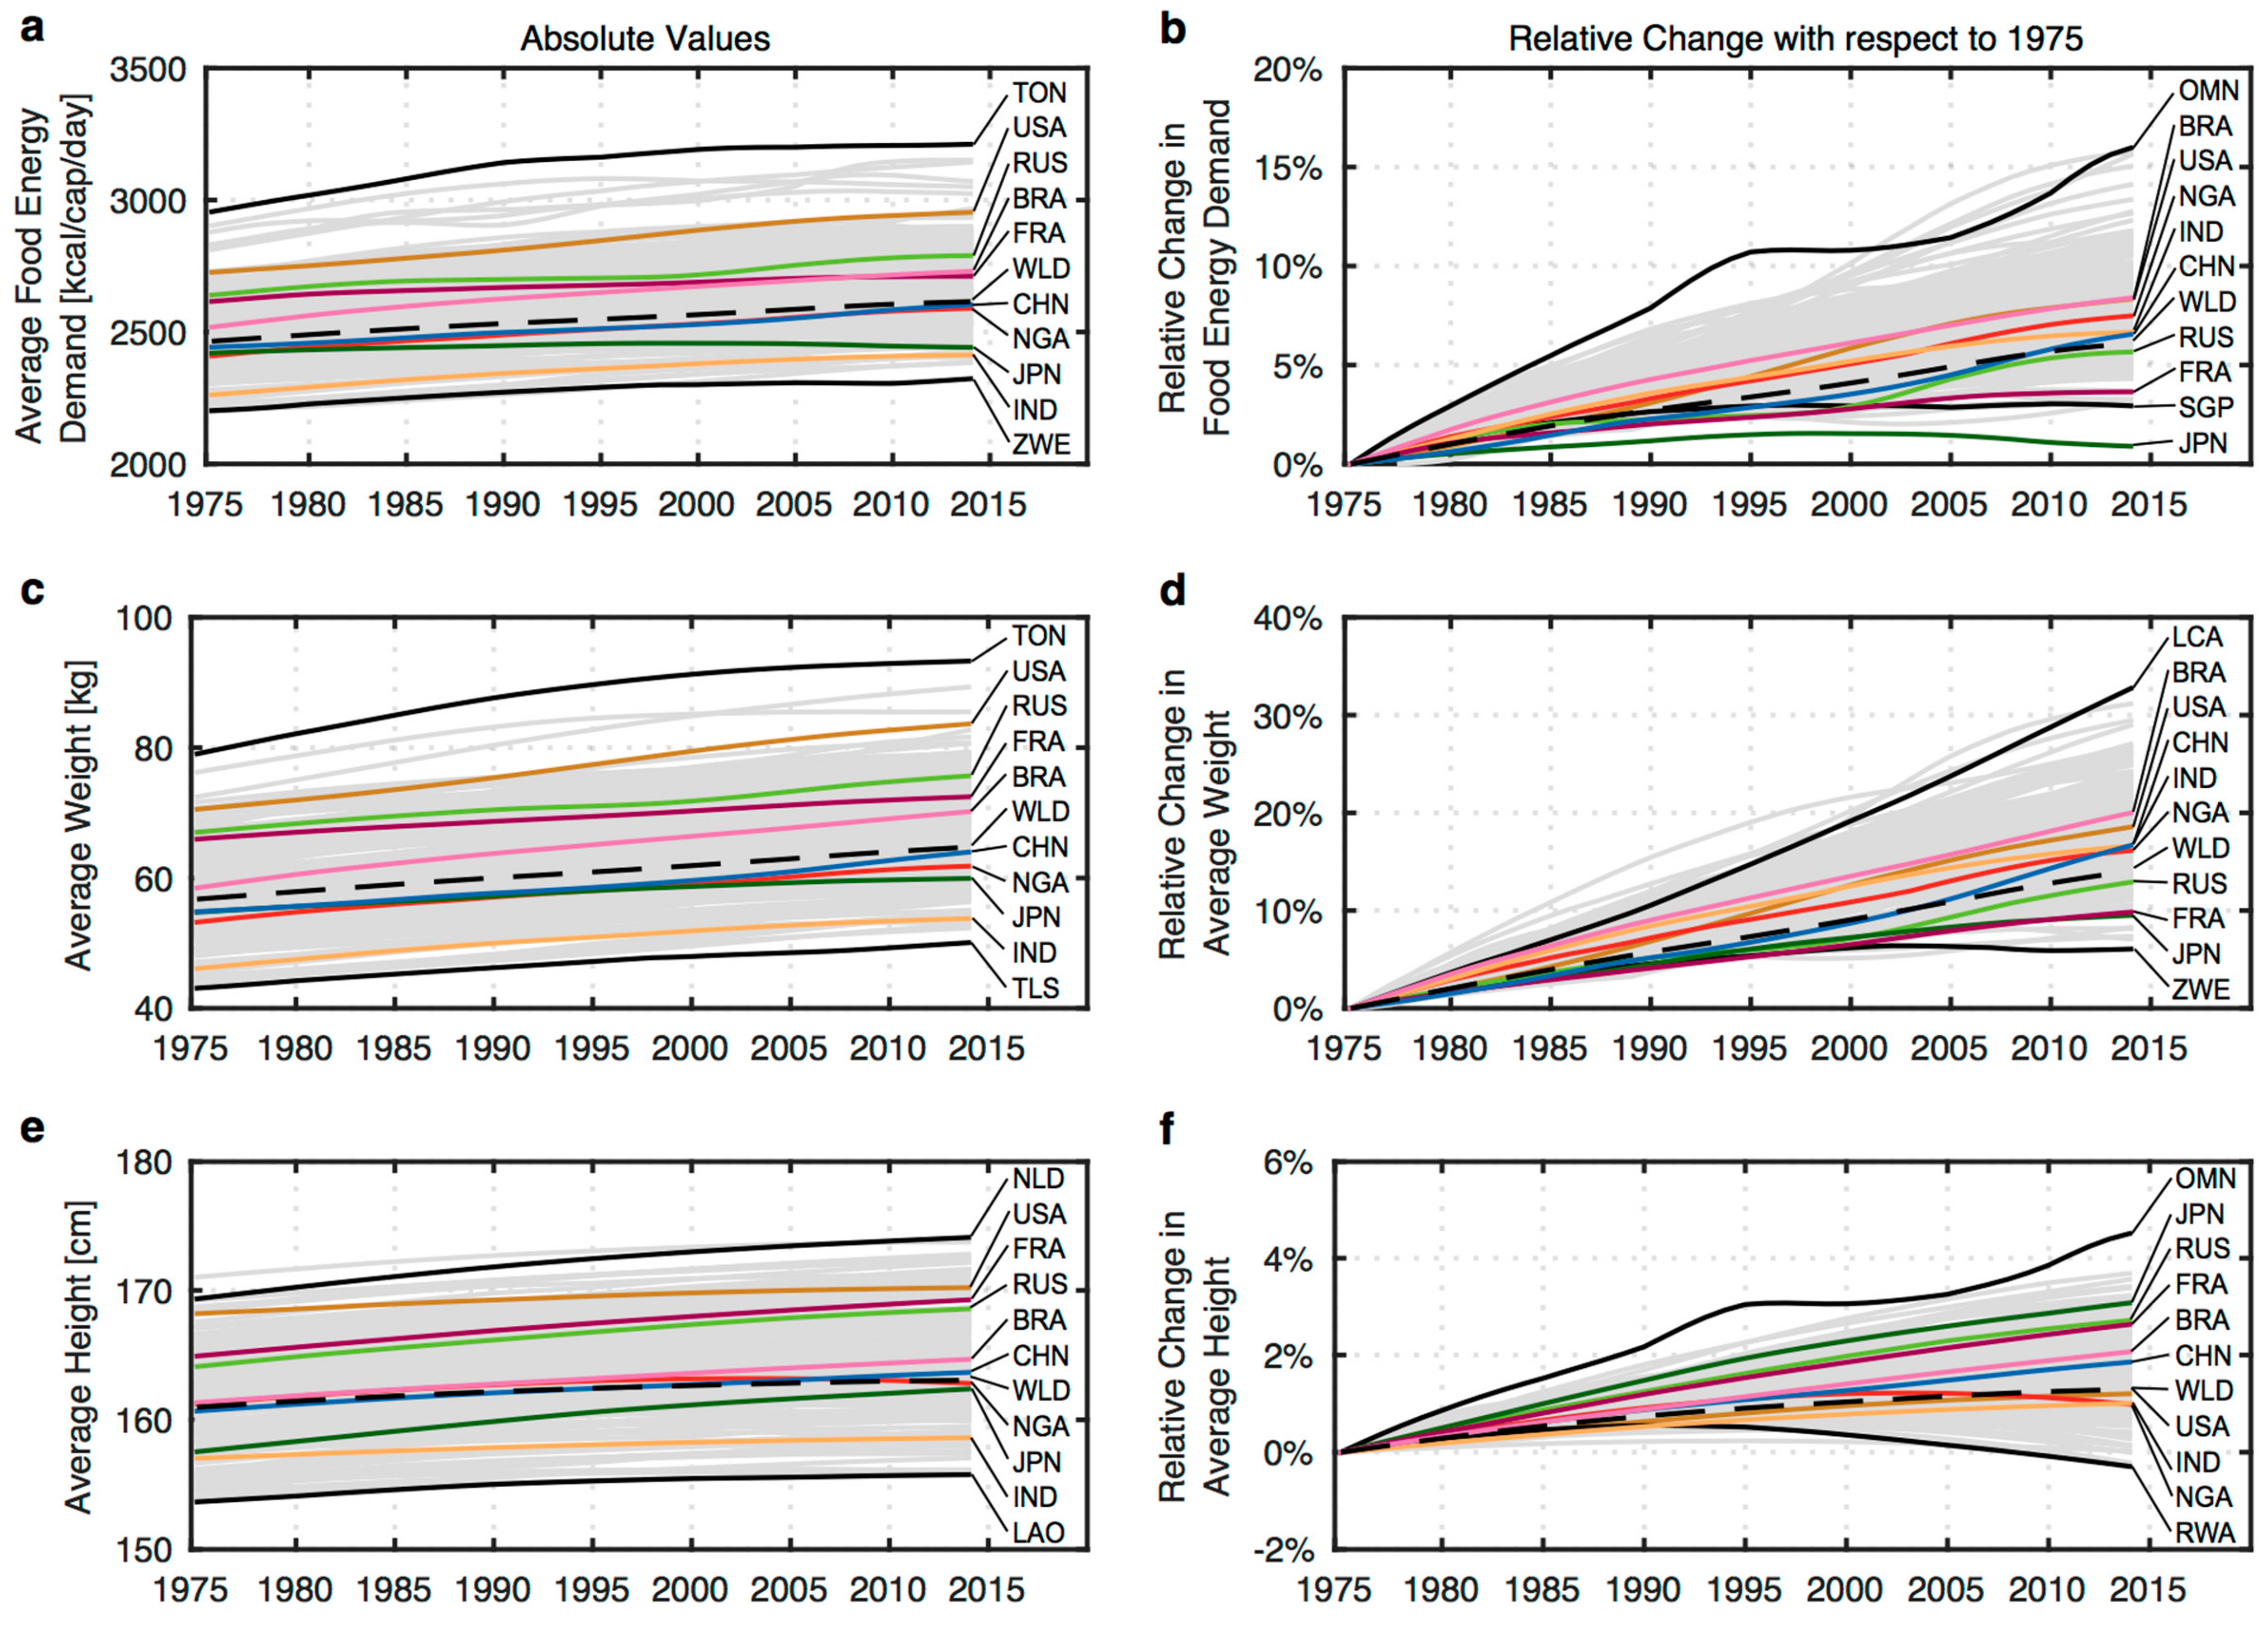
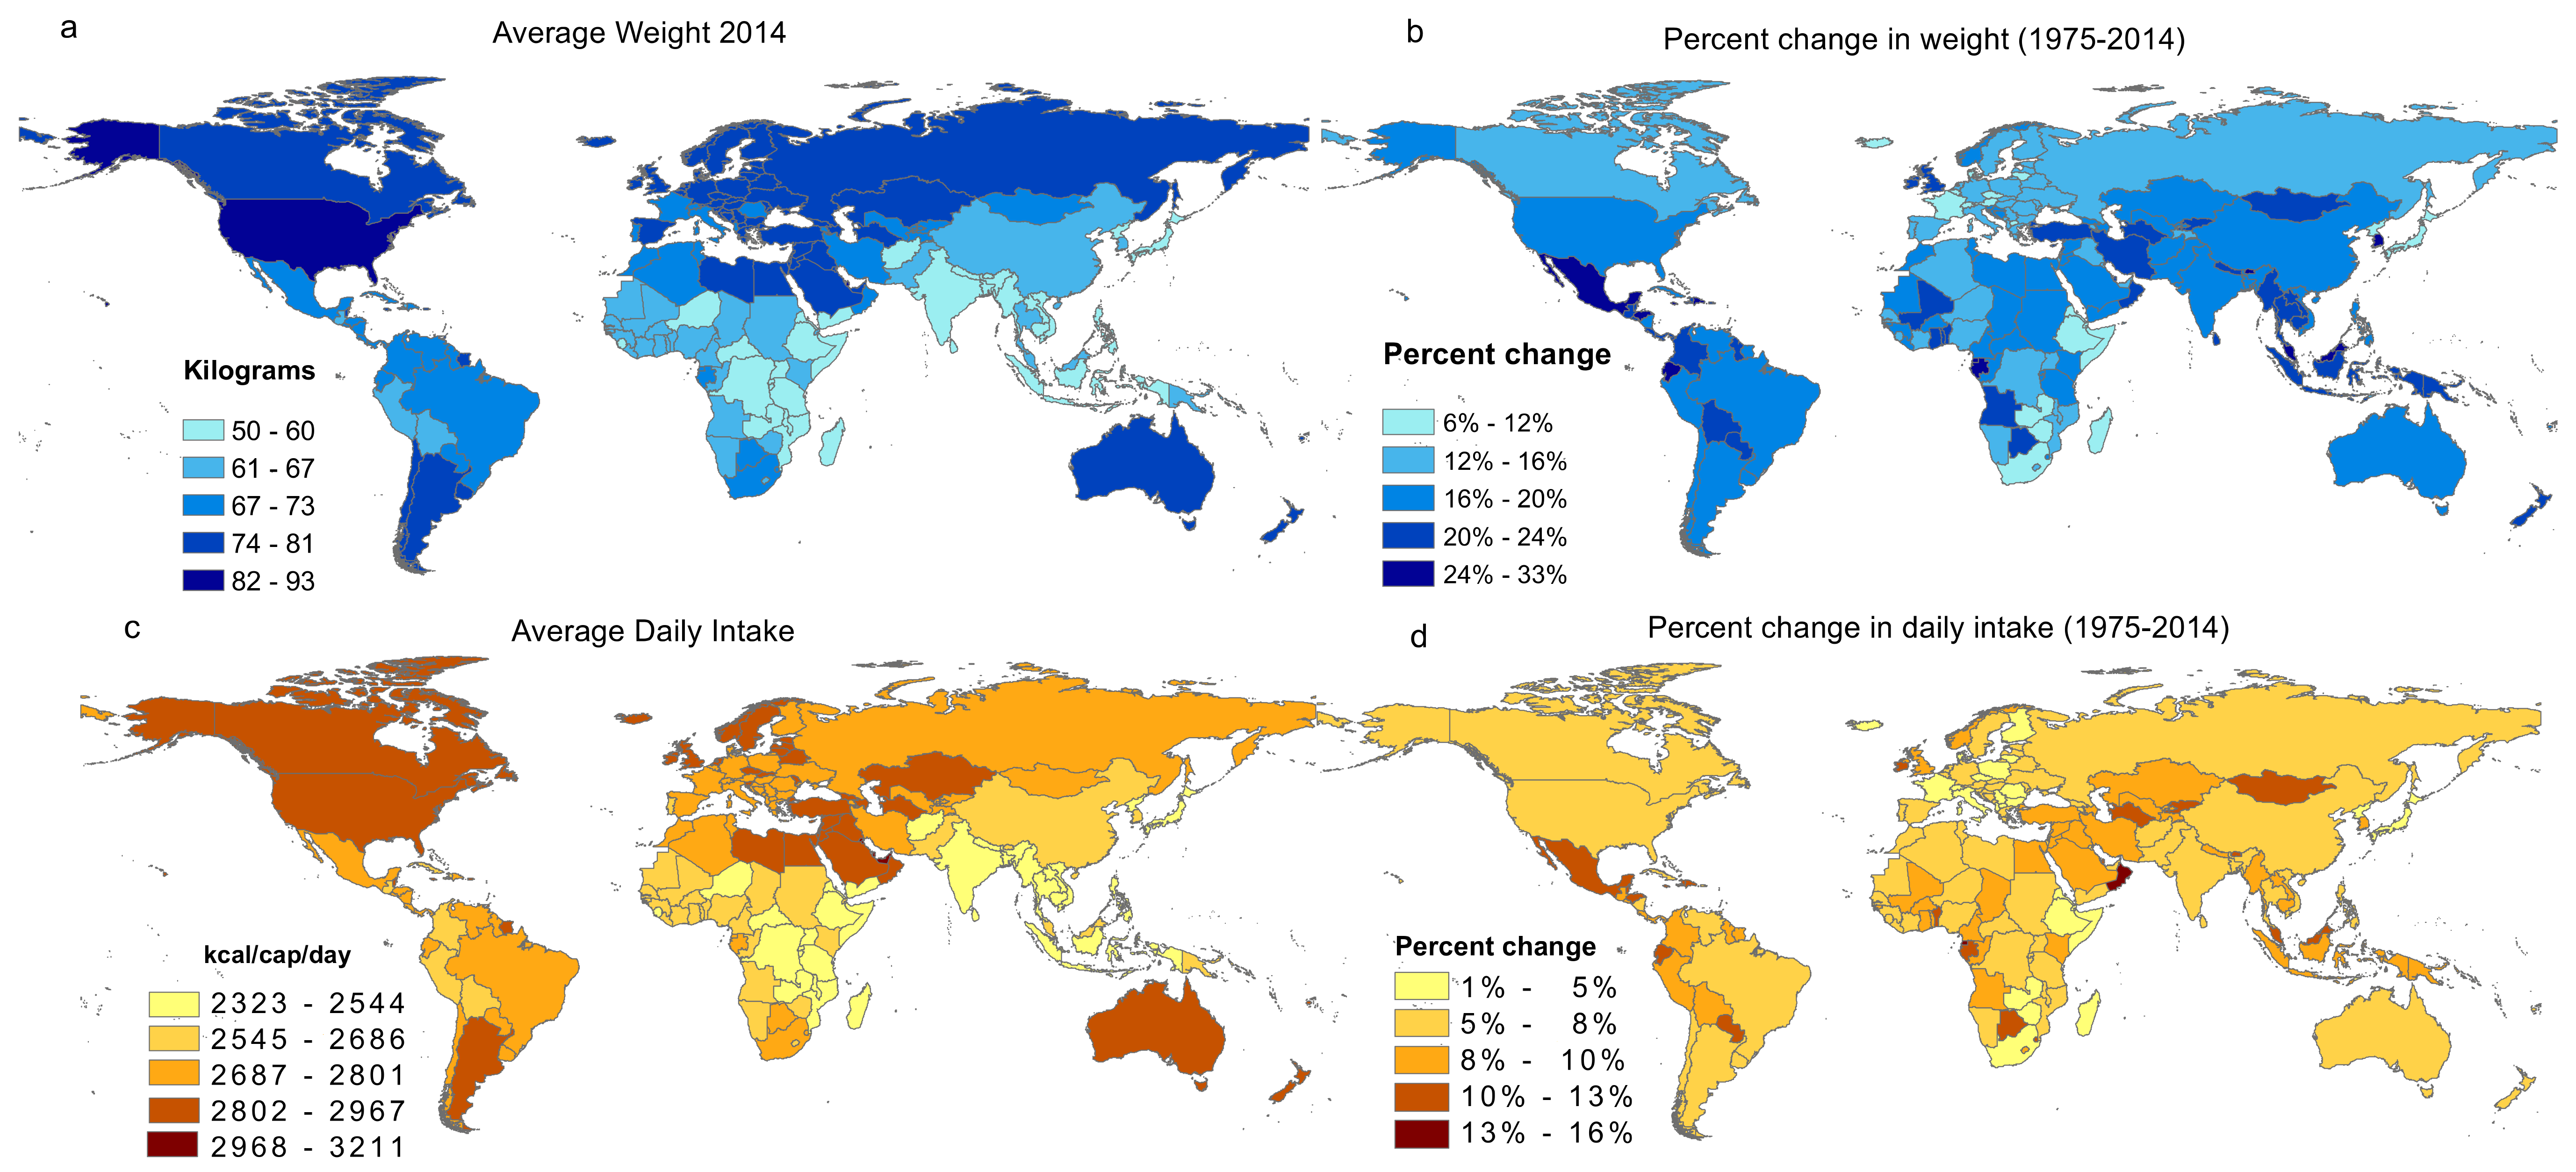
The average adult food energy needs and weight were in the range of 2200–2960 kcal/cap/day and 43–79 kg in 1975 (Figure 3a,c). These values increased to 2320–3210 kcal/cap/day and 50–93 kg in 2014 (Figure 5a,c). These gains ranged between 22–401 kcal/cap/day and 4–20 kg, with relative fluctuations of 0.9–16% for energy (Figure 3b and Figure 5d) and 6–33% for weight (Figure 3d and Figure 5b).
Notwithstanding this diversity, the disparity between the highest and the lowest energy requirements and the heaviest and the lightest adults has remained nearly constant since 1975. The adults with the highest energy demand require about 1.4 times more food energy than those with the lowest, and the heaviest weigh nearly twice as much as the lightest (1.86 times). Noteworthy, some of the highest and lowest increases coexist within Africa, Central Asia, and the Middle East, signaling the disparities between the countries of these regions.
Higher weight is usually correlated with higher energy demand; however, the countries with the most and least energy demanding adults do not strictly correspond to those with the heaviest and lightest countries (Table 1, and Dataset S1).
In 1975, the lightest (below 45 kg) and least demanding adults (below 2250 kcal/cap/day) were from the same countries (Table 1). However, in 2014, Ethiopia became one of the lightest (below 54 kg), yet was not among the least demanding (below 2300 kcal/cap/day). In contrast, Nepal remained among those with the lowest energy demand, despite a large weight increase (23.7%).
Adults in the Czech Republic, the United States, and Iceland were among the heaviest (above 70 kg), but did not have the highest energy demand (above 2800 kcal/cap/day) in 1975 (Table 1). Conversely, the United Arab Emirates and Qatar had some of the largest energy needs, but were not among the heaviest. Moreover, by 2014, Saint Lucia was the heaviest (above 81 kg), but not the most energy demanding. The countries with the highest energy-demanding population in 1975 remained so in 2014.
Also, the relative changes spanned a large range (Table 1). While Zimbabwe and Saint Lucia had the smallest and largest weight gains respectively, Japan and Oman had the smallest and largest energy increases, respectively (Figure 3b,d).
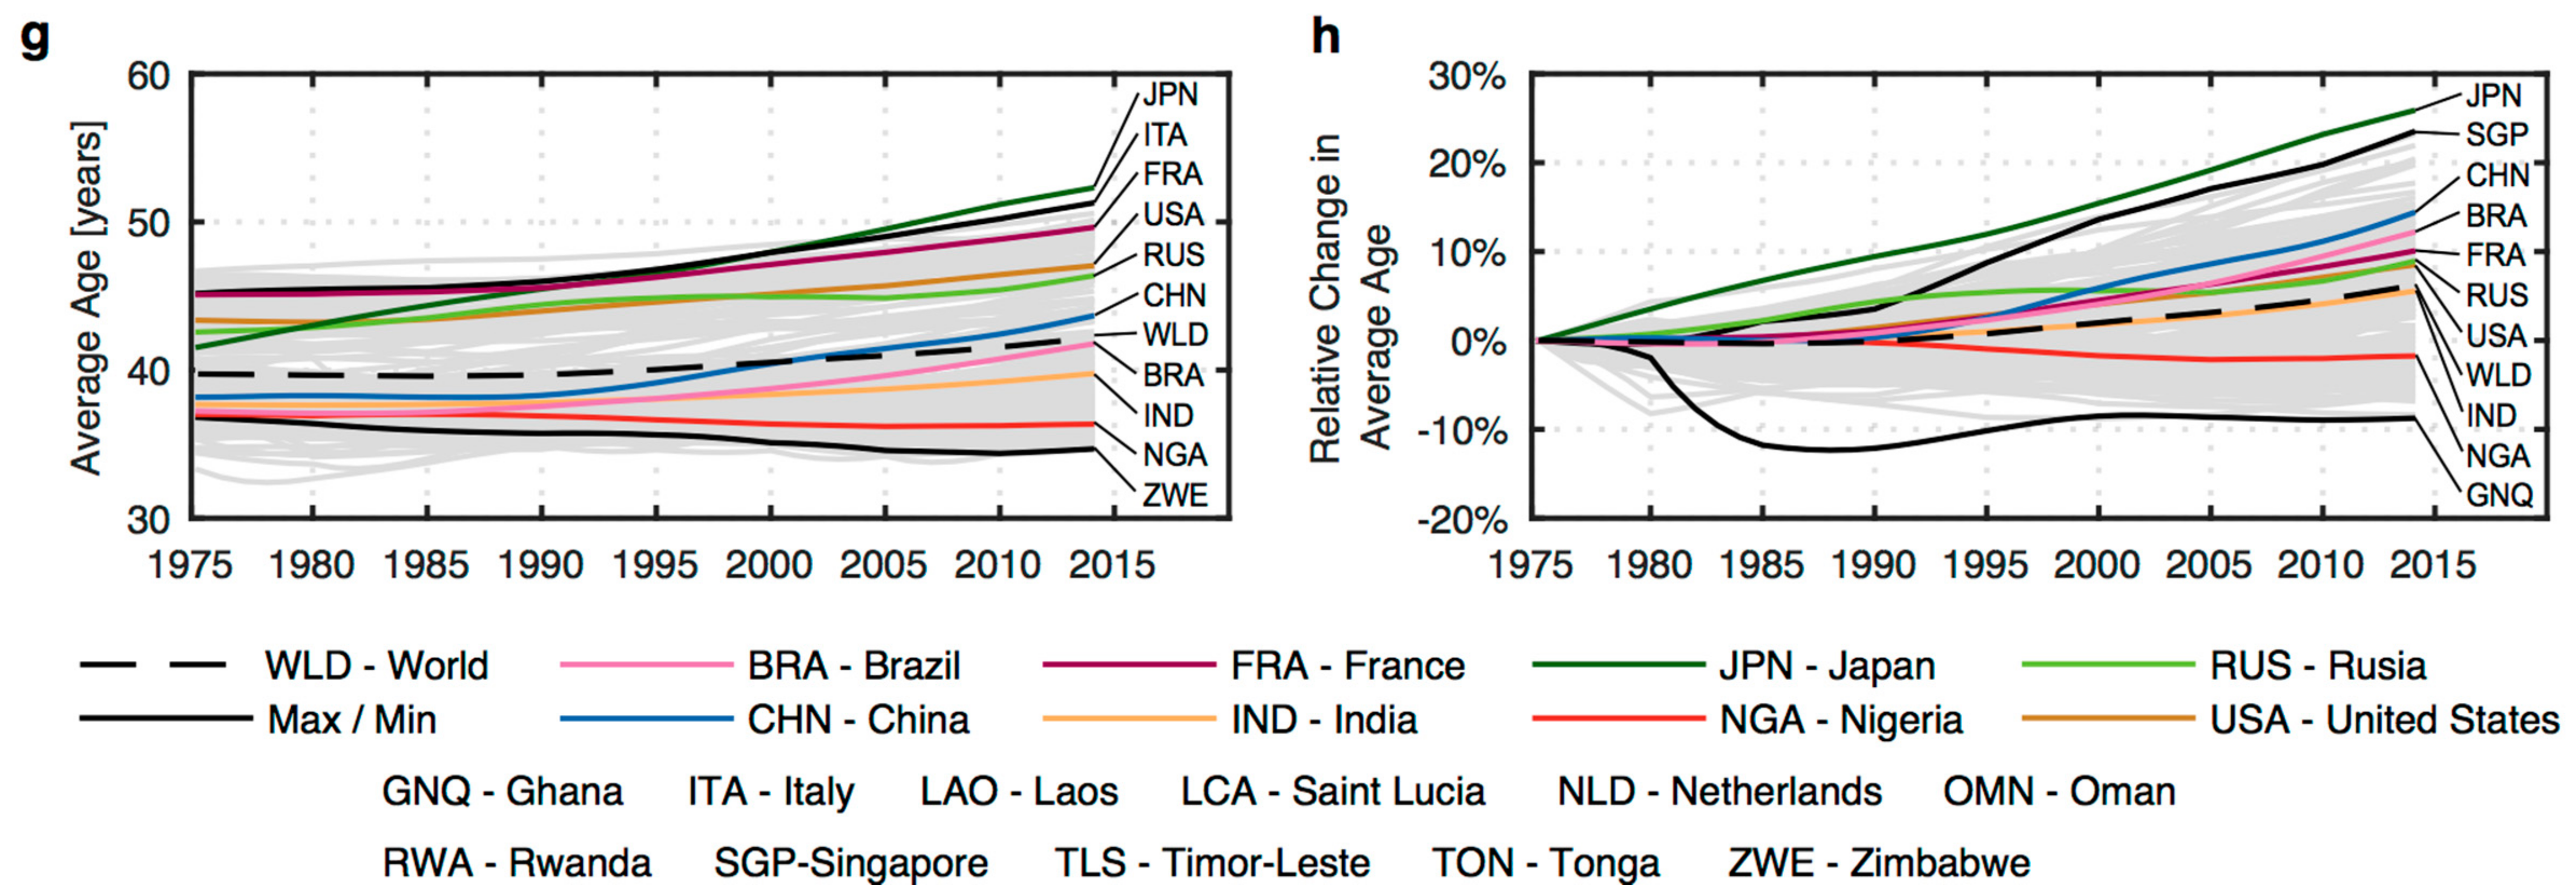
The differences between weight and food energy trends can be explained by the differentiated height and age trends (Figure 3e,g). For instance, the French have a lower energy demand than the Brazilians (Figure 3a), despite being heavier and taller (Figure 3c,e). This may be explained by the older population in France (Figure 3g). Likewise, the Japanese and Indians now have similar food energy needs after marked differences in 1975 (Figure 3a). Food requirements remained almost constant in Japan, despite weight and height gains (Figure 3c,e), which may be explained by its population becoming the oldest (Figure 3g,h). On the contrary, the Indians’ energy needs increased due to medium weight gains (Figure 3d) and moderate aging (Figure 3e,f). The discrepancy between weight and food energy is also explained by other environmental, lifestyle, and genetic factors [50,51].
Adults in all of the countries, except Madagascar and Rwanda, increased in average height (up to 4.5%) (Figure 3f), with height increases of up to 7.1 cm. However, some countries observed a decline in the average height after 1990 (Figure S3c). By 2014, 65 countries had declining average adult height, despite general increases in the mean height of individuals born in the last century [14]. Worldwide, height gains at the population level are slowing down, reinforced by the aging of the population. Generally, older adults, whose proportion in the population has been increasing, are shorter than their younger counterparts.
The changes in average population age exhibited the largest range (−8.8 to 25.8%) (Figure 3h), which translated to absolute age differences of −3.6 to 10.7 years. Yet, the aging of the population tends to accelerate in most countries [44] (Figure 3f,h and Figure S3).

4. Discussion

The results show higher energy requirements across nations (2320–3210 kcal/cap/day) than Hiç et al. [29] (1800–2800 kcal/cap/day) but are comparable to Walpole et al. [39] (2318–3017 kcal/cap/day). Despite these similarities, the ranking of the heaviest and lightest adults (Table 1), and thus food energy needs, differs slightly from the ranking made by Walpole et al. For instance, in the upper range, the average American (United States) and Emirati (United Arab Emirates) adult weighed 81.3 kg and 77.8 kg in 2005, respectively (Dataset S1). Walpole et al. reported 82 kg and 75.8 kg for the same countries. Similarly, the lower range results are 54.6 kg and 51.9 kg for Eritrea and Cambodia, while Walpole et al. reported 52.1 kg and 55.9 kg, respectively.
In terms of food energy requirements, 2920 kcal/cap/day were estimated for the United States, while Walpole et al. reported 2874 kcal/cap/day. This difference of 46 kcal/cap/day, although relatively small (approximately 1.5%), translates to a total of 10 Gkcal per day over the entire country. This energy demand is equivalent to the food energy requirements for Croatia or New Zealand, which each have approximately 3.4 million adults.
The differences between these results and Walpole et al. can be attributed to the dissimilar data sources and treatment. In this study, to derive weight, height data were available for all of the cohorts and sexes in all of the countries, but yearly BMI values were only reported as country averages by sex. On the other hand, Walpole et al. used BMI data grouped by age and sex. However, since some of the height data were missing, these data gaps were filled using linear regression methods of data from neighboring countries. Both methods can underestimate and overestimate the weight of different population segments as well as the country average. Thus, we highlight not only the need for, but also the importance of, having both historic age and sex disaggregated BMI information, as well as sex and cohort height statistics, to make better estimates on food requirements.
Kastner et al. identified “population numbers” as the major global driver of land requirements to satisfy food demand [12]. They concluded that with socioeconomic development, population growth rates decrease, and therefore per capita food availability increases [12]. This study shows that biophysical changes, especially weigh gains, are a significant driver for food demand in themselves. This means that a reduced population does not directly translate to increased food availability in linear terms, as previously assumed. Similarly, the resource implications of supplying adequate macronutrients and micronutrients might be underestimated if they rely on population numbers and supply data to estimate bottom–up nutritional needs [27,52]. Except for a few exceptional aging countries such as Japan, the same population size will likely require significantly more food energy in the upcoming decades, especially in the low-income and emerging economies (Figure 5).
Previous studies have either focused on food availability [12,29], biophysical changes [39], or demographic changes separately [17,44]. This study shows that combining these elements allows for “opening the black-box” of long-term drivers of food requirements. The paper contributes with a methodological framework for “bio-demographically informed resource assessments”, which utilize existing public data (see Materials and Methods). The framework can be readily applied to other domains of consumption where larger body types and aging are expected to play a role: transport, clothing, furniture, housing, elderly services, etc.

Limitations and Strengths

Although this study provides clear findings, result interpretation is subject to data and methodological limitations. The United Nations (UN) population data are subject to underestimations and overestimations, especially in lower-income countries [29]. Yet, this is the only global database available, and it is widely used by the research community. There are currently no standardized global data on group-specific PAL across countries. A recommendation for international health statistics is to gather data on PAL differentiated by demographic group. This would increase the reliability of assessments for resource use, but also for social well-being [31,33].
This study excludes physiological or environmental considerations that might affect food requirements. However, such aspects might have stronger implications in the era of climate adaptation. This study identified increasing food demands without discussing health implications [52]. The estimated increased food requirements may very well correspond to increased obesity [39]. Fulfilling the demand estimates calculated from the bottom–up, as shown in this paper, would arguably reinforce overeating and further weight gains [29]. Arguably, given that the trends in obesity vary widely across countries with similar development status [15], overeating does not seem to be solely influenced by the amount of food available, but by the predominant lifestyles in a given nation.
Lastly, this article focuses on the basic aspect of food security, which is food availability, sufficiency, and with implications on food adequacy. However, issues of food access, utilization, and stability are important for food security, but lie beyond this research scope [31].
We combine three modeling approaches of traditional FAO food availability assessment, biophysical changes from the medical sciences, and demographic structural changes, as modeled by demographers. A necessary step is to characterize and quantify the effects of variables that were not previously examined in the light of resource demands. The type–cohort–time approach opens a path for dynamic stock models to move from merely describing the general characteristics of the total stock or certain cohorts, toward a more comprehensive and disaggregated description of the characteristics of its individuals, while still keeping account of the totality of the stock. This allows for more accurate descriptions of the populations and resources, which is key to enabling targeted policies that depart from defining the prerequisites for a good life, and depict strategies on how to provide them efficiently.

5. Policy Implications

This article broadens the perspective of food availability assessments by deconstructing and characterizing the influence of specific population traits beyond mere population numbers [12,23]. Methodologically, it increases the robustness and resolution of current approaches for food demand and availability. Although population size is commonly assumed as one of the main drivers of increased resource use, this paper shows how populations’ biophysical characteristics exert their own inertia and evolve significantly over a short period of time.
More worryingly, top–down assessments of food sufficiency and malnutrition are commonly based on a comparison of average dietary energy requirements against food supply [31]. Monitoring progress would involve assessing differentiated energy requirements against the actual intake for each socioeconomic group [52]. Otherwise, the recent progress detected in rising food availability per person [32] might be actually undermined by the increased caloric demands.
For example, based on supply data, O’Neill et al. evaluated countries’ food sufficiency by comparing country-specific supplied calories against a desirable threshold of 2700 kcal per adult per day [33]. Such a threshold value would perhaps been suitable for 1975, where energy demand ranged between 2200–2960 kcal/cap/day, but it certainly falls on the lower side for 2014 standards, which is between 2320–3210 kcal/cap/day. Further, given that average supply-side waste ranges between 214–510 kcal/cap/day, such a threshold value implies that around 2300 kcal/cap/day are available for consumption. That is even lower than the lowest bottom–up demand calculated here for 2014 (Timor-Leste).
Clearly, actual food availability should be set at a national level, correcting for body type, BMI, activity level, sex, and age distributions. Cross-validation of results across multiple sources increases the robustness of food security and availability assessments. The challenge is the lack of harmonized surveys across countries [31]. Thus, calculating energy needs by using anthropometric and demographic data is a pragmatic option to validate estimates of energy needs. It is a relatively low-cost procedure due to the availability of harmonized and reliable data sources, as has been demonstrated in this paper. At the individual level, the approach of this paper could improve social sciences research that estimates resources associated with lifestyles through bottom–up participatory methods or self-reported surveys [53].
Biophysical heterogeneity and demographic dynamics become increasingly relevant when exploring future scenarios of food security [32]. Given that growth in body sizes and population aging are expected to accelerate toward the mid-century [39,44], these phenomena have to be explicitly considered to ensure progress toward the Sustainable Development Goal of Zero Hunger. More robust assessments of food security are especially important for low-income and emerging economies, where most of the worlds’ population live, and which currently experience the steepest sociodemographic transitions [18]. Future research could expand this work to model evolving cultural needs, such as diets or food preferences and characterize the bill of resources pulled by cultural lock-ins [54], and not only physical ones, as done here.
Addressing human needs in resource assessments calls for explicitly modeling the differentiated requirements of different population segments, and thus recognizing that society is an ensemble of diverse individuals from different generations who require different goods and services from the production systems along with their lives [54]. Furthermore, the increasing human mass, size, and aging phenomena have implications for resource use beyond food. Other energy and material connotations could be explored for buildings, transport, water, waste, sewage, furniture, clothing, and health care. Bigger humans tend to require larger living and sitting spaces and produce more waste [35], while an aging population requires different economic goods [5,19].
The implications of these findings also impact resource conservation strategies that argue for sufficient consumption by defining a desirable social threshold of food availability [30,33]. Ideally, international negotiations and national strategies toward reducing consumption would be based on bottom–up assessments of physical needs [54,55]. The risk of assessing supply while framing it as “demand” and modeling a static population might send imprecise messages to policies on food sovereignty and public health. In general, differentiating region-specific needs based on underlying physical drivers is a prerequisite toward feasible sufficiency thresholds [5,54]. Additionally, a more specific use of terminology i.e., not confounding the concepts of “food supply” and “food demand”, or “food consumption” (purchased or eaten by households?) and “food intake” (theoretical or actual?) [12,27,33] could add transparency to food assessments.
In sum, this study highlights the importance of population dynamics and the differentiation of cohorts and types (see Materials and Methods) across time to better understand the changing needs of a population, as well as the resources and infrastructure that are required to satisfy these needs [54]. Integrated metabolic and sociodemographic models can contribute to a more robust global resource outlook [20] that can distinguish waste along the food value chain and forecast the food needs of evolving populations [29]. Based on current physical and demographic trends, feeding nine billion people in 2050 will require more total calories than feeding the same people today. This is a sobering fact that places further urgency on reducing supply chain and consumer waste, shifting to less resource-intensive diets, and encouraging more frugal and healthy lifestyles.

6. Conclusions

Indeed, the interrelated dynamics between population, weight, height, and age have implications for food supply and demand, as well as food security in the coming decades. This paper confirms that during the 1975–2014 period, the rise in food demand was mainly driven by population increases, even when considering country-specific energy requirements (116%). However, food demand was also affected in a non-negligible manner (13%) by changes in human biophysical traits (Figure 4), and only moderately counteracted by the aging phenomena at a global level (−2%). Thus, what previous analyses could have estimated as food surplus or waste might actually be sequestered mass—or energy required—by the bigger bodies of the human lot [56]. It is noteworthy that nations with an aged population can expect more drastic reductions in food demands due to the aging phenomenon. We show that the effect of biodemographic changes are cumulative and thus exert an inertia into the future. Based on the discovered trends, feeding nine billion people in 2050 will require significantly more total calories than feeding the same people today.

Supplementary Materials

The following are available online at https://www.mdpi.com/2071-1050/10/10/3683/s1. Figure S1: Absolute values and relative changes in total adults’ population, mass and food energy demand, Figure S2: Linear correlation analysis between relative changes in body mass index, weight, height, and age and relative changes in food energy demand, Figure S3: Growth rates in food energy demand, average weight, average height, and average age of adults, Dataset S1: Tables with population, and average food energy requirements, weight, height and age at the global and national levels. (as Excel file).

Author Contributions

F.V. conceived the study, gathered and processed the input data, developed the computer script, analysed results and drafted the manuscript. G.V. analysed results and drafted the manuscript. F.V. and G.V. contributed equally to the literature review, analysis of results, generation of figures and tables, and writing of the manuscript. D.B.M. contributed to the design and supervision of the study, and edited the manuscript.

Funding

The authors were funded by NTNU.

Acknowledgments

We thank Valentina Prado for insights, discussions, and critical reading of the manuscript. We thank Christine Hung for proofreading the article.

Conflicts of Interest

The authors declare no conflict of interest. The funders had no role in the design of the study; in the collection, analyses, or interpretation of data; in the writing of the manuscript, or in the decision to publish the results.

References

  1. Meadows, D.H.; Goldsmith, E.; Meadow, P. The Limits to Growth; Universe Books: New York, NY, USA, 1972; Volume 381. [Google Scholar]
  2. Malthus, T.R. An Essay on the Principle of Population as It Affects the Future Improvement of Society, with Remarks on the Speculations of Mr. Goodwin, M. Condorcet and Other Writers, 1st ed.; J. Johnson: London, UK, 1798. [Google Scholar]
  3. Lewis, S.L.; Maslin, M.A. Defining the Anthropocene. Nature 2015, 519, 171–180. [Google Scholar] [CrossRef] [PubMed]
  4. Foley, J. Living by the lessons of the planet. Science 2017, 356. [Google Scholar] [CrossRef] [PubMed]
  5. Ivanova, D.; Vita, G.; Steen-Olsen, K.; Stadler, K.; Melo, P.C.P.C.; Wood, R.; Hertwich, E.G. Mapping the carbon footprint of EU regions. Environ. Res. Lett. 2017, 12, 054013. [Google Scholar] [CrossRef] [Green Version]
  6. Fischer-Kowalski, M.; Krausmann, F.; Pallua, I. A sociometabolic reading of the Anthropocene: Modes of subsistence, population size and human impact on Earth. Anthr. Rev. 2014, 20, 1–26. [Google Scholar] [CrossRef]
  7. Fischer-Kowalski, M.; Swilling, M.; von Weizsäcker, E.U.; Ren, Y.; Moriguchi, Y.; Crane, W.; Krausmann, F.; Eisenmenger, N.; Giljum, S.; Hennicke, P.; et al. UNEP (2011) Decoupling Natural Resource Use and Environmental Impacts from Economic Growth: A Report of the Working Group on Decoupling to the International Resource Panel; United Nations Environment Programme: Nairobi, Kenya, 2011. [Google Scholar]
  8. Chertow, M.R. The IPAT Equation and Its Variants. J. Ind. Ecol. 2000, 4, 13–29. [Google Scholar] [CrossRef]
  9. Dietz, T.; Rosa, E.A. Effects of population and affluence on CO2 emissions. Proc. Natl. Acad. Sci. USA 1997, 94, 175–179. [Google Scholar] [CrossRef] [PubMed]
  10. Blanco, G.; Gerlagh, R.; Suh, S.; Barrett, J.; de Coninck, H.C.; Diaz Morejon, C.F.; Mathur, R.; Nakicenovic, N.; Ofosu Ahenkora, A.; Pan, J.; et al. Drivers, Trends and Mitigation. In Climate Change 2014. Mitigation of Climate Change. Working Group III Contribution to the Fifth Assessment Report of the Intergovernmental Panel on Climate Change; Cambridge University Press: New York, NY, USA, 2014; pp. 351–412. [Google Scholar]
  11. Crist, E.; Mora, C.; Engelman, R. The interaction of human population, food production, and biodiversity protection. Science 2017, 356, 260–264. [Google Scholar] [CrossRef] [PubMed]
  12. Kastner, T.; Rivas, M.J.I.; Koch, W.; Nonhebel, S. Global changes in diets and the consequences for land requirements for food. Proc. Natl. Acad. Sci. USA 2012, 109, 6868–6872. [Google Scholar] [CrossRef] [PubMed] [Green Version]
  13. Zijdeman, R.; Ribeira da Silva, F. Life Expectancy at Birth (Total)—Clio-Infra Dataverse. Available online: https://www.clio-infra.eu/Indicators/LifeExpectancyatBirthTotal.html# (accessed on 24 September 2018).
  14. NCD Risk Factor Collaboration (NCD-RisC). A century of trends in adult human height. Elife 2016, 5, 1–29. [Google Scholar] [CrossRef]
  15. Finucane, M.M.; Stevens, G.A.; Cowan, M.J.; Danaei, G.; Lin, J.K.; Paciorek, C.J.; Singh, G.M.; Gutierrez, H.R.; Lu, Y.; Bahalim, A.N.; et al. National, regional, and global trends in body-mass index since 1980: Systematic analysis of health examination surveys and epidemiological studies with 960 country-years and 9·1 million participants. Lancet 2011, 377, 557–567. [Google Scholar] [CrossRef]
  16. NCD Risk Factor Collaboration. Trends in adult body-mass index in 200 countries from 1975 to 2014: A pooled analysis of 1698 population-based measurement studies with 192 million participants. Lancet 2016, 387, 1377–1396. [Google Scholar] [CrossRef]
  17. Vaupel, J.W. Biodemography of human ageing. Nature 2010, 464, 536–542. [Google Scholar] [CrossRef] [PubMed] [Green Version]
  18. Lutz, W.; Butz, W.P.; Samir, K.C. World Population and Human Capital in the Twenty-First Century; Oxford University Press: Oxford, UK, 2014; ISBN 0191008222. [Google Scholar]
  19. Lee, R.D.; Mason, A. Population Aging and the Generational Economy: A Global Perspective; Edward Elgar Publishing: Cheltenham, UK, 2011; ISBN 978-1-84844-898-8. [Google Scholar]
  20. FAO; IFAD; WFP. The State of Food Insecurity in the World: Meeting the 2015 International Hunger Targets: Taking Stock of Uneven Progress; Food and Agriculture Organiztaion of the United Nations: Rome, Italy, 2015; ISBN 978-92-5-108785-5. Available online: www.fao.org/3/a-i4646e.pdf (accessed on 3 October 2018).
  21. UN General Assembly. Transforming Our World: The 2030 Agenda for Sustainable Development; United Nations: New York, NY, USA, 2015; pp. 1–35. [Google Scholar]
  22. Tilman, D.; Balzer, C.; Hill, J.; Befort, B. Global food demand and the sustainable intensification of agriculture. Proc. Natl. Acad. Sci. USA 2011, 108, 20260–20264. [Google Scholar] [CrossRef] [PubMed] [Green Version]
  23. Gustavvson, J.; Cederberg, C.; Sonesson, U.; Van Otterdijk, R.; Meybeck, A. Global Food Losses and Food Waste—Extent, Causes and Prevention; FAO: Rome, Italy, 2011. [Google Scholar]
  24. Rayfuse, R.; Weisfelt, N. The Challenge of Food Security; Edward Elgar Publishing: Cheltenham, UK, 2012; Volume 327, ISBN 9780857939388. [Google Scholar]
  25. Shafiee-Jood, M.; Cai, X. Reducing Food Loss and Waste to Enhance Food Security and Environmental Sustainability. Environ. Sci. Technol. 2016, 50, 8432–8443. [Google Scholar] [CrossRef] [PubMed]
  26. Xue, L.; Liu, G.; Parfitt, J.; Liu, X.; Van Herpen, E.; Stenmarck, A.; O’Connor, C.; Östergren, K.; Cheng, S. Missing food, missing data? A critical review of global food losses and food waste data. Environ. Sci. Technol. 2017, 51, 6618–6633. [Google Scholar] [CrossRef] [PubMed]
  27. Behrens, P.; Kiefte-de Jong, J.C.; Bosker, T.; Rodrigues, J.F.D.; de Koning, A.; Tukker, A. Evaluating the environmental impacts of dietary recommendations. Proc. Natl. Acad. Sci. USA 2017, 114, 201711889. [Google Scholar] [CrossRef] [PubMed]
  28. Food and Agriculture Organization of the United Nations ESS Website ESS: Food Balance Sheets. Available online: http://www.fao.org/economic/ess/fbs/en/ (accessed on 2 October 2018).
  29. Hiç, C.; Pradhan, P.; Rybski, D.; Kropp, J.P. Food Surplus and Its Climate Burdens. Environ. Sci. Technol. 2016, 50, 4269–4277. [Google Scholar] [CrossRef] [PubMed]
  30. Rao, N.D.; Baer, P. “Decent Living” emissions: A conceptual framework. Sustainability 2012, 4, 656–681. [Google Scholar] [CrossRef] [Green Version]
  31. FAO; IFAD; UNICEF; WFP; WHO. The State of Food Security and Nutrition in the World; FAO: Rome, Italy, 2017; ISBN 978-92-5-109888-2. [Google Scholar]
  32. Alexandratos, N.; Bruinsma, J. World agriculture: Towards 2015/2030: An FAO perspective. Land Use Policy 2003, 20, 375. [Google Scholar] [CrossRef]
  33. O’Neill, D.W.; Fanning, A.L.; Lamb, W.F.; Steinberger, J.K. A good life for all within planetary boundaries. Nat. Sustain. 2018, 1, 88–95. [Google Scholar] [CrossRef]
  34. FAO. Human Energy Requirements: Report of a Joint FAO/WHO/UNU Expert Consultation; FAO: Rome, Italy, 2001; Volume 1. [Google Scholar]
  35. Heymsfield, S.B.; Bourgeois, B.; Thomas, D.M. Assessment of human energy exchange: Historical overview. Eur. J. Clin. Nutr. 2016, 1–7. [Google Scholar] [CrossRef] [PubMed]
  36. Müller, M.J.; Geisler, C. From the past to future: From energy expenditure to energy intake to energy expenditure. Eur. J. Clin. Nutr. 2016, 1–7. [Google Scholar] [CrossRef]
  37. Westerterp, K.R. Control of energy expenditure in humans. Eur. J. Clin. Nutr. 2016, 1–5. [Google Scholar] [CrossRef] [PubMed]
  38. Hall, K.D.; Guo, J.; Dore, M.; Chow, C.C. The progressive increase of food waste in America and its environmental impact. PLoS ONE 2009, 4, e7940. [Google Scholar] [CrossRef] [PubMed]
  39. Walpole, S.C.; Prieto-Merino, D.; Edwards, P.; Cleland, J.; Stevens, G.; Roberts, I. The weight of nations: An estimation of adult human biomass. BMC Public Health 2012, 12, 439. [Google Scholar] [CrossRef] [PubMed]
  40. West, P.C.; Gerber, J.S.; Engstrom, P.M.; Mueller, N.D.; Brauman, K.A.; Carlson, K.M.; Cassidy, E.S.; Johnston, M.; MacDonald, G.K.; Ray, D.K.; et al. Leverage points for improving global food security and the environment. Science 2014, 345, 325–328. [Google Scholar] [CrossRef] [PubMed] [Green Version]
  41. Porter, J.R.; Xie, L.; Challinor, A.J.; Cochrane, K.; Howden, S.M.; Iqbal, M.M.; Lobell, D.B.; Travasso, M.I. Food security and food production systems. In Climate Change 2014: Impacts, Adaptation, and Vulnerability. Part A: Global and Sectoral Aspects; Cambridge University Press: New York, NY, USA, 2014. [Google Scholar]
  42. Valin, H.; Sands, R.D.; van der Mensbrugghe, D.; Nelson, G.C.; Ahammad, H.; Blanc, E.; Bodirsky, B.; Fujimori, S.; Hasegawa, T.; Havlik, P.; et al. The future of food demand: Understanding differences in global economic models. Agric. Econ. 2014, 45, 51–67. [Google Scholar] [CrossRef]
  43. Lunenfeld, B. An Aging World—Emographics and challenges. Gynecol. Endocrinol. 2008, 24, 1–3. [Google Scholar] [CrossRef] [PubMed]
  44. Lutz, W.; Sanderson, W.C.; Scherbov, S. The coming acceleration of global population ageing. Nature 2008, 451, 716–719. [Google Scholar] [CrossRef] [PubMed]
  45. Lutz, W. Demographic Metabolism: A Predictive Theory of Socioeconomic Change. Popul. Dev. Rev. 2012, 38, 283–301. [Google Scholar] [CrossRef] [Green Version]
  46. Vásquez, F.; Løvik, A.N.; Sandberg, N.H.; Müller, D.B. Dynamic type-cohort-time approach for the analysis of energy reductions strategies in the building stock. Energy Build. 2016, 111, 37–55. [Google Scholar] [CrossRef]
  47. Müller, D.B. Stock dynamics for forecasting material flows—Case study for housing in The Netherlands. Ecol. Econ. 2006, 59, 142–156. [Google Scholar] [CrossRef]
  48. Olaya, Y.; Vásquez, F.; Müller, D.B. Dwelling stock dynamics for addressing housing deficit. Resour. Conserv. Recycl. 2017, 123, 187–199. [Google Scholar] [CrossRef]
  49. Department of Economic and Social Affairs, United Nations. Population Division World Population Prospects: The 2015 Revision, DVD Edition. Available online: http://esa.un.org/unpd/wpp/Download/Standard/Population/ (accessed on 7 April 2016).
  50. Deaton, A. Height, health, and development. Proc. Natl. Acad. Sci. USA 2007, 104, 13232–13237. [Google Scholar] [CrossRef] [PubMed] [Green Version]
  51. Dubois, L.; Ohm Kyvik, K.; Girard, M.; Tatone-Tokuda, F.; Pérusse, D.; Hjelmborg, J.; Skytthe, A.; Rasmussen, F.; Wright, M.J.; Lichtenstein, P.; et al. Genetic and environmental contributions to weight, height, and bmi from birth to 19 years of age: An international study of over 12,000 twin pairs. PLoS ONE 2012, 7, e30153. [Google Scholar] [CrossRef] [PubMed]
  52. Rao, N.D.; Min, J.; Defries, R.; Ghosh-jerath, S.; Valin, H.; Fanzo, J. Healthy, affordable and climate-friendly diets in India. Glob. Environ. Chang. 2018, 49, 154–165. [Google Scholar] [CrossRef]
  53. Ivanova, D.; Vita, G.; Wood, R.; Lausselet, C.; Dumitru, A.; Krause, K.; Macsinga, I.; Hertwich, E.G. Carbon mitigation in domains of high consumer lock-in. Glob. Environ. Chang. 2018, 52, 117–130. [Google Scholar] [CrossRef]
  54. Vita, G.; Hertwich, E.G.; Stadler, K.; Wood, R. Connecting global emissions to fundamental human needs and their satisfaction. Environ. Res. Lett. 2018. [Google Scholar] [CrossRef]
  55. Rao, N.D.; Min, J. Decent Living Standards: Material prerequisites for human wellbeing. Soc. Indic. Res. 2018, 138, 225–244. [Google Scholar] [CrossRef] [PubMed]
  56. Gould, J. Nutrition: A world of insecurity. Nature 2017, 544, S6–S7. [Google Scholar] [CrossRef] [PubMed]
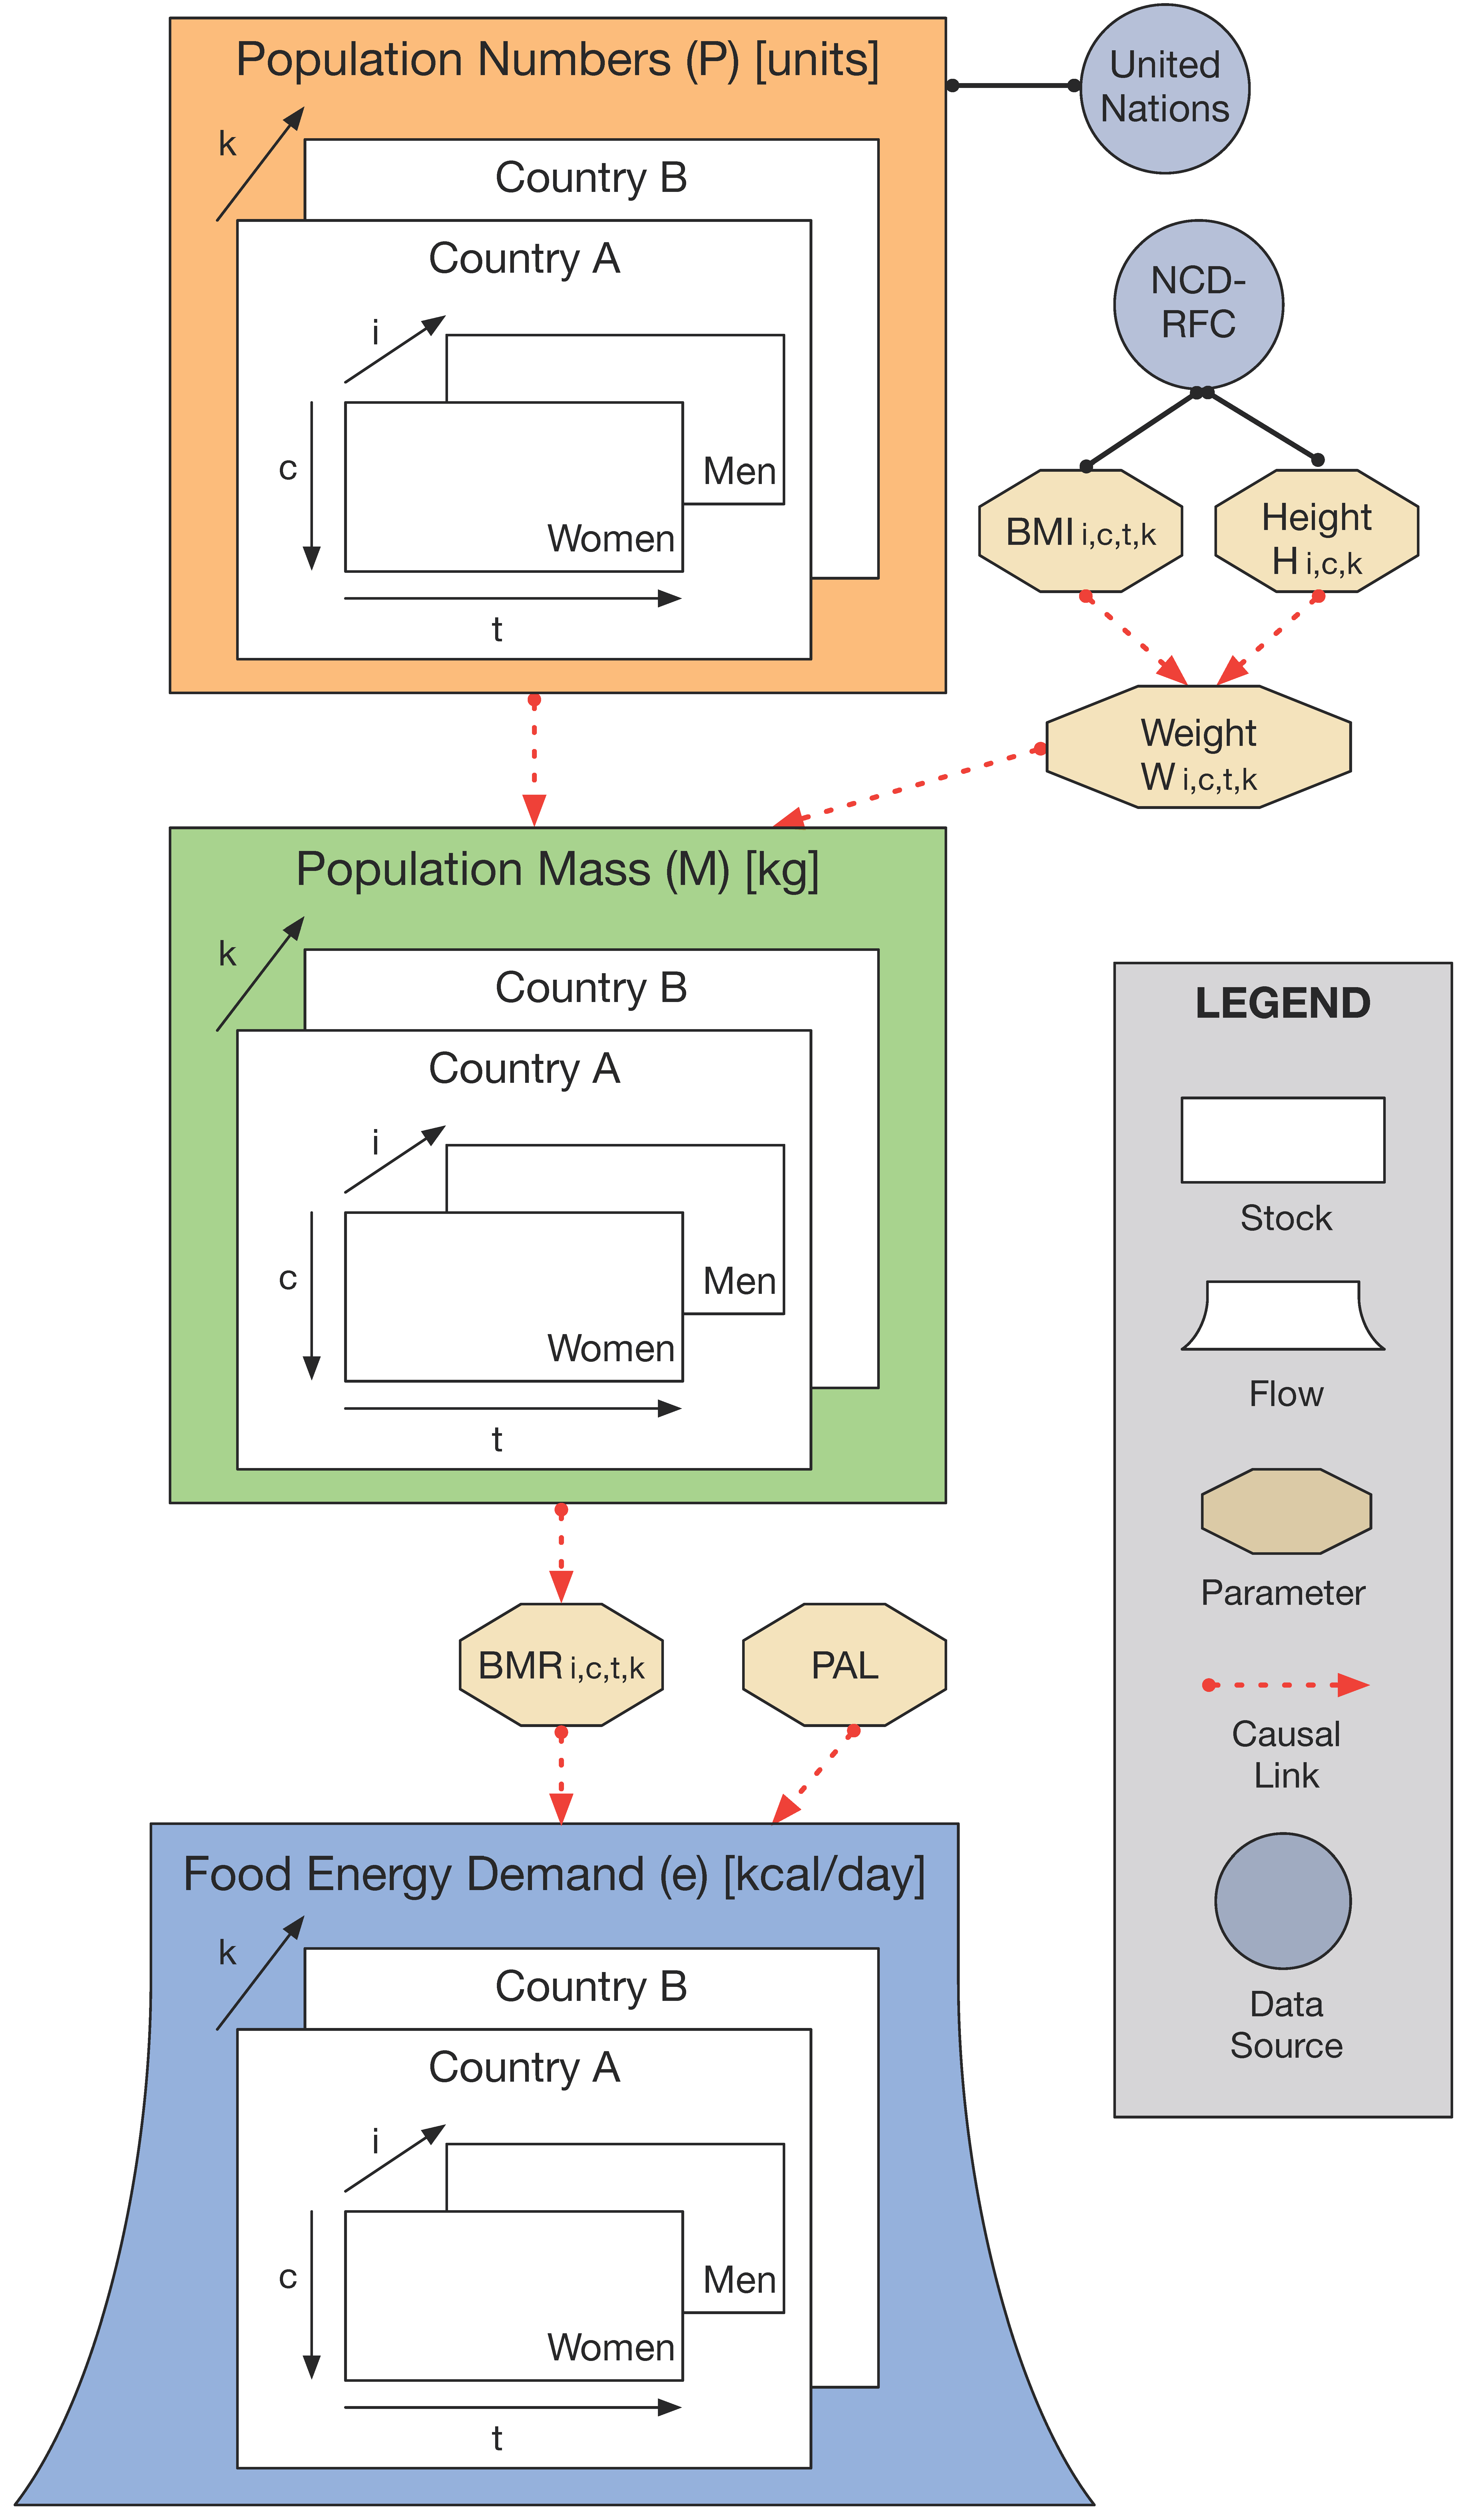
Figure 1. System and model definition for the study of the food energy demand of the population. “i” represent the sex, “c” the cohort, “t” the time, and “k” the country. NCD-RFC: Noncommunicable Diseases Risk Factor Collaboration (see references). BMI: Body Mass Index. BMR: Basal Metabolic Rate. PAL: Physical Activity Level.
Sustainability 10 03683 g001
Figure 2. Changes in global population aggregate (left) and average biophysical traits (right). Relative changes (a,b) and growth rates (c,d) in population, human mass, and food energy (a,c) and weight, height, age, food energy, and energy-to-mass ratio (b,d) with respect to 1975. While human mass refers here to the total population, the term weight is used to indicate the average mass per capita. Key: Population, human mass, and energy grow at different rates. Human mass grows steeper than population (Left).
Sustainability 10 03683 g002
Figure 3. Absolute values (left—(a,c,e,g)) and relative changes (right—(b,d,f,h)) in average food energy demand (a,b), weight (c,d), height (e,f), and age (g,h).
Sustainability 10 03683 g003aSustainability 10 03683 g003b
Figure 4. Decomposition analysis of factors contributing to changes in the total human mass and food energy in the period 1975–2014. Key: body mass index, reflecting weight gains, contributed to 14% of the increase in global energy.
Sustainability 10 03683 g004
Figure 5. Average weight and food energy needs in 2014 (a,c) and relative change with respect to 1975 (b,d) by country. (a) Average weight in kg in 2014, and (b) relative change with respect to 1975 values. (c) Average food energy demand in kcal/cap/day in 2014, and (d) relative change with respect to 1975 values.
Sustainability 10 03683 g005
Table 1. Highest and lowest average food energy demand and weight.
Average Food Energy Demand [kcal/Cap/Day]Rel. Change in Food Energy Average Weight [kg]Rel. Change in Weight
19752014▲1975–201419752014▲1975–2014
Highest 10
TON2955.8TON3211.4OMN16.0%TON79.1TON93.3LCA32.7%
PYF2903.5QAT3151.3GNQ15.7%PYF76.2WSM89.3GNQ31.1%
ARE2879.4WSM3143.6LCA15.6%WSM72.5PYF85.5CPV29.4%
QAT2831.3ARE3070.9CPV15.0%CZE71.6USA83.6MDV28.9%
KWT2830.9PYF3050.7GRD14.1%KWT70.7LCA82.7MYS27.0%
WSM2812.4KWT3024.4VCT13.4%USA70.6QAT81.6GRD26.8%
ISL2730.7LCA2966.8JAM12.7%ISL70.1KWT80.8KOR26.7%
CZE2726.8USA2953.4GAB12.6%LTU69.6NZL80.6JAM26.3%
USA2726.3PSE2949.1KGZ12.3%ARE68.9AUS79.3VCT26.2%
FSM2707.3JOR2941.0WSM11.8%EST68.8IRL79.2HND26.0%
Lowest 10
IND2262.2JPN2441.8CZE4.4%BDI46.8ERI54.9SGP10.6%
BDI2261.5LAO2430.0MKD4.3%MMR46.5NPL54.8SOM10.3%
MMR2259.3KHM2420.7MDG3.7%IND46.1LAO54.6CZE10.1%
IDN2243.8ETH2414.8FRA3.6%IDN45.5KHM54.4FRA9.8%
KHM2230.7NPL2414.1ZWE3.3%LAO44.9ETH53.9JPN9.5%
LAO2229.8IND2412.8HKG3.3%KHM44.8IND53.8PRK8.3%
NPL2223.1MDG2402.7DJI3.2%NPL44.3MDG53.1MDG8.1%
BGD2219.6VNM2384.4PRK3.2%VNM44.1VNM52.8DJI7.4%
TLS2202.0BGD2384.1SGP2.9%BGD43.8BGD52.3BHR7.1%
VNM2199.1TLS2322.7JPN0.9%TLS43.1TLS50.1ZWE6.1%
ARE: United Arab Emirates, AUS: Australia, BDI: Burundi, BGD: Bangladesh, CPV: Cape Verde, CZE: Czech Republic, DJI: Djibouti, ERI: Eritrea, EST: Estonia, ETH: Ethiopia, FRA: France, FSM: Federated States of Micronesia, GAB: Gabon, GNQ: Ghana, GRD: Grenada, HKG: Hong Kong, IDN: Indonesia, IND: India, ISL: Iceland, IRL: Ireland, JAM: Jamaica, JOR: Jordan, JPN: Japan, KGZ: Kyrgyzstan, KHM: Cambodia, KWT: Kuwait, LAO: Lao People’s Democratic Republic, LCA: Saint Lucia, LTU: Lithuania, MDG: Madagascar, MKD: The Former Yugoslav Republic of Macedonia, MMR: Myanmar, NPL: Nepal, NZL: New Zealand, OMN: Oman, PRK: Democratic People’s Republic of Korea, PSE: State of Palestine, PYF: French Polynesia, QAT: Qatar, SGP: Singapore, SOM: Somalia, TLS: Timor-Leste, TON: Tonga, USA: United States of America, VCT: Saint Vincent and the Grenadines, VNM: Vietnam, WSM: Samoa, ZWE: Zimbabwe.