1. Introduction
Community commerce is an important component of the living environment [
1], and is a major resource for community development [
2]. It not only satisfies the basic needs of residents, but also directly affects the living standard and quality of life of residents [
3]; it stimulates the interaction between residents [
4], helps shape community culture [
5], and enhances the sense of belonging in the community [
6]. Therefore, it is of vital importance to the happiness of community residents [
7].
Traditional open residential communities mostly place their commercial facilities inside of the communities, which originate from spontaneous behavior of residents [
8]. In that, many traditional communities do not provide commercial facilities when they are designed and built; these facilities emerge only when the residents have moved in [
9]. Hereafter, the practice of placing commercial facilities inside of a community is called the internal distribution of commercial facilities, of course, this mode is not necessarily incompatible with facilities being distributed outside of the communities, and in fact, the two patterns often go hand in hand with each other. However, in modern community practices, commercial facilities are usually planned and distributed on the outside or the periphery of the community. In particular, with the popularizing of gated communities since the 1980s, placing the commercial facilities outside of communities has become the mainstream, and internal distribution of commercial facilities is often prohibited in the same community. In China, for example, almost all new residential developments have located their commercial facilities externally on the ground floor facing the urban streets [
10]. Hereafter, the practice of only allowing placement of commercial facilities on the fringe but outside of a community is called the external fringe distribution of commercial facilities (hereinafter abbreviated as external distribution).
External distribution of community commercial facilities is conducive to creating a quiet environment [
11], and can serve the population both inside and outside of the community, which in turn can be an important source for profits in real estate development [
12]. Although placing commercial facilities outside of a residential community is a good way to promote urban development [
13], stronger voices can be heard for the internal distribution of commercial facilities in residential communities. Besides making residents’ lives more convenient [
14], spontaneously formed commercial facilities in communities create jobs for many residents [
15]. Many researchers believe that commercial facilities inside of a community “draw more attention to the street” and make the community safer [
16]. Consumption behaviors and traditional lifestyles which concentrate on the commercial streets inject vigor and vitality into the community, and have become a kind of emotional exchange for residents [
17].
It can be seen that the two modes, i.e., the internal and external distribution of commercial facilities, have their own advantages. So which mode should be advocated? The previous literature shows different opinions on this issue, which have mainly focused on the differences in community vitality, environmental quality, community security, etc.
However, with regard to residents who live in the communities, few studies can be found on whether the different modes of distribution of commercial facilities affect the consumption willingness of residents or result in different consumption behaviors, especially walking based consumption behaviors. Because residents’ consumption in their community is one of their most common activities in daily life and has a bearing on the quality of life [
18], plus in most communities, most residents do this by walking [
19,
20], it also affects the physical health of residents [
21], as well as residents’ social interaction and communication [
22], study on the distribution of commercial facilities in residential community from the perspective of residents’ walking-based consumption behaviors is of necessity and significance.
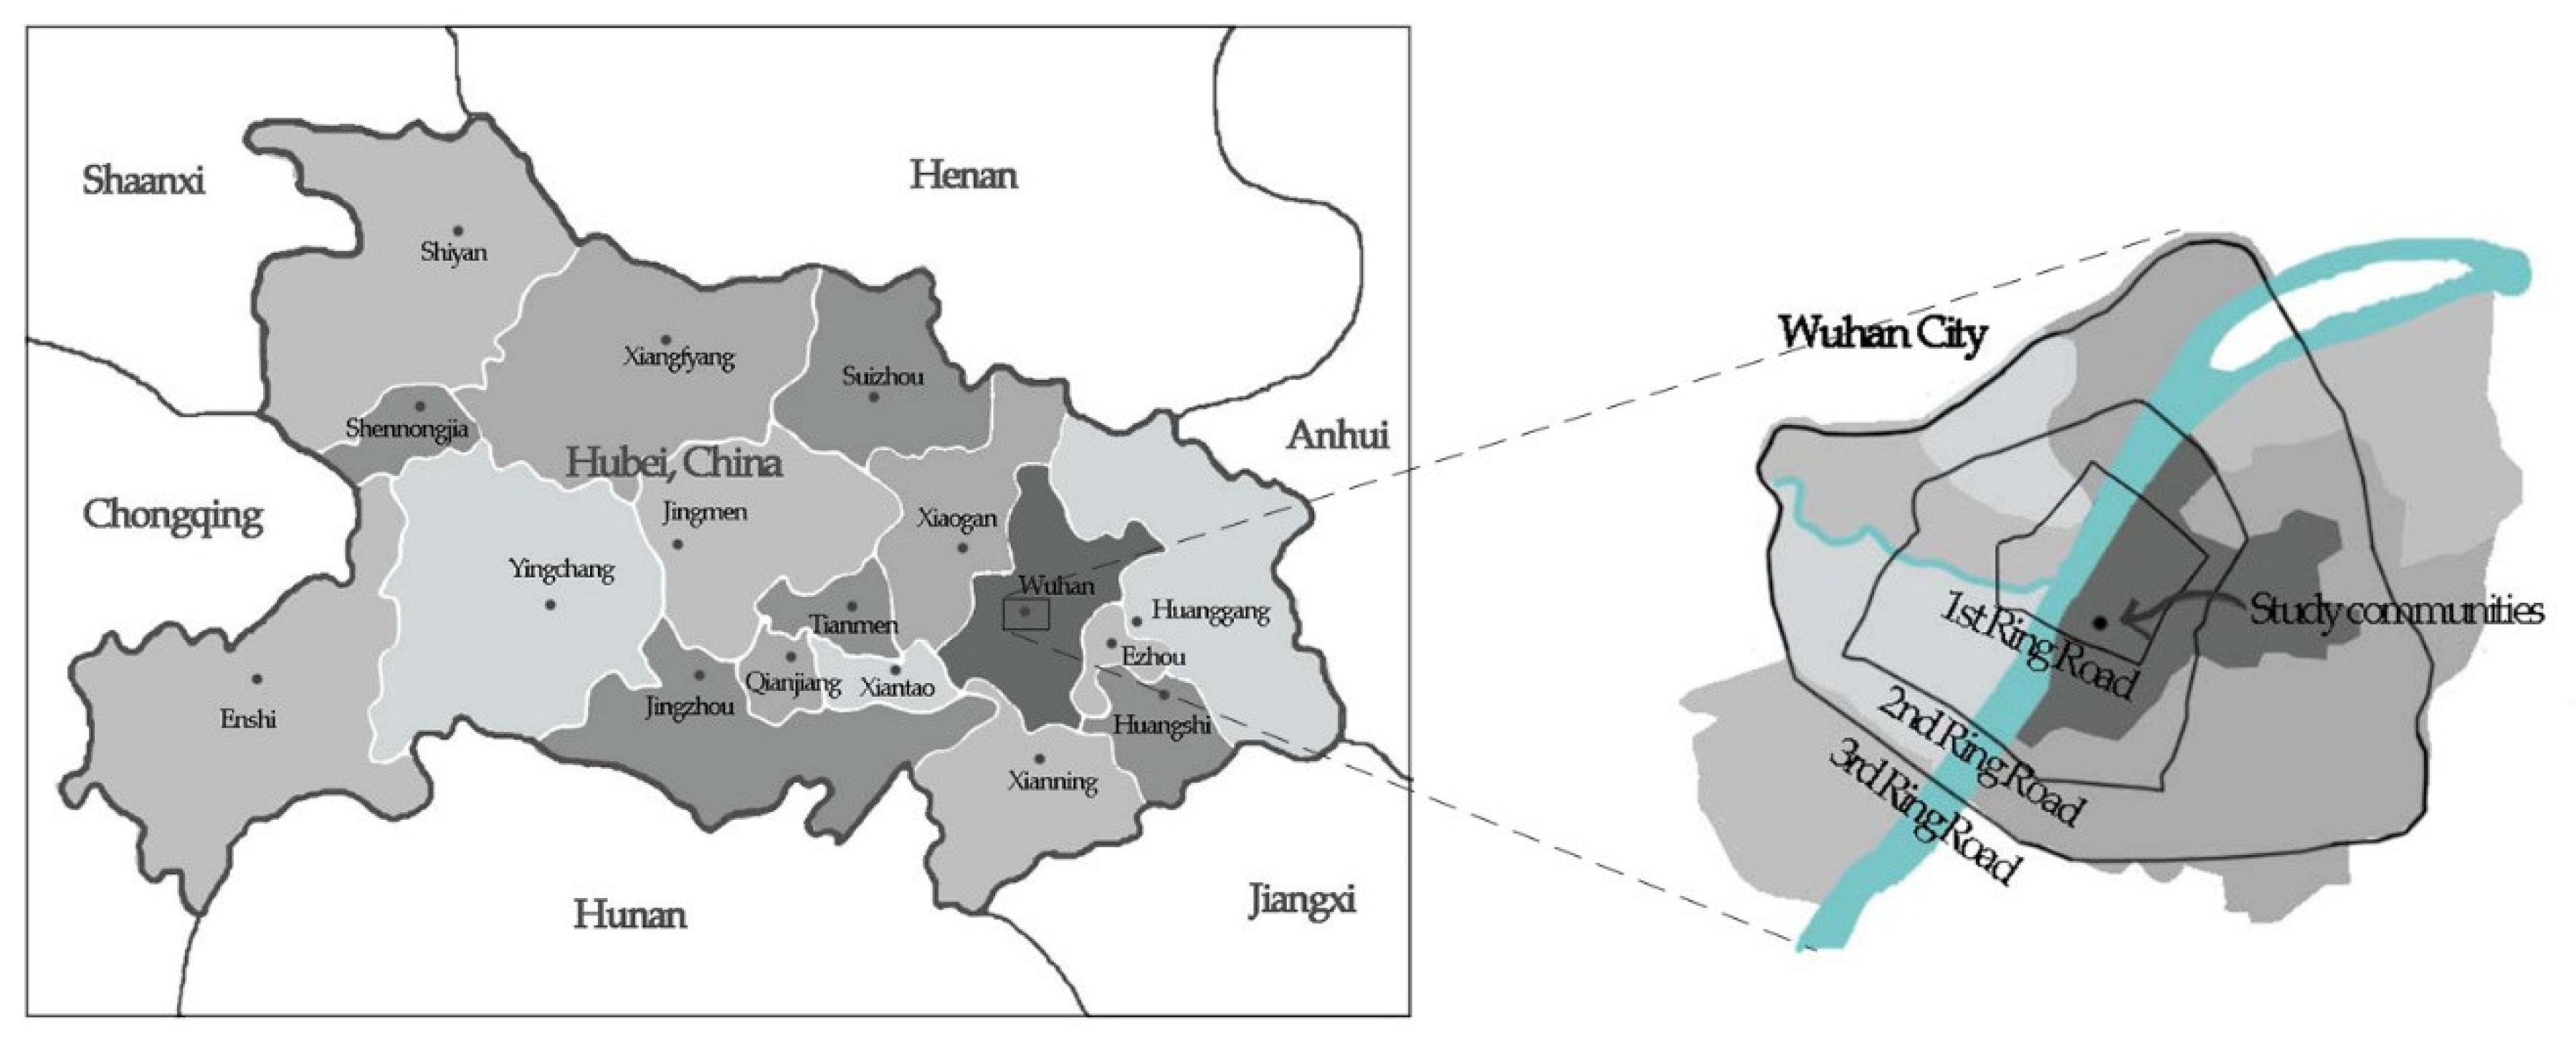
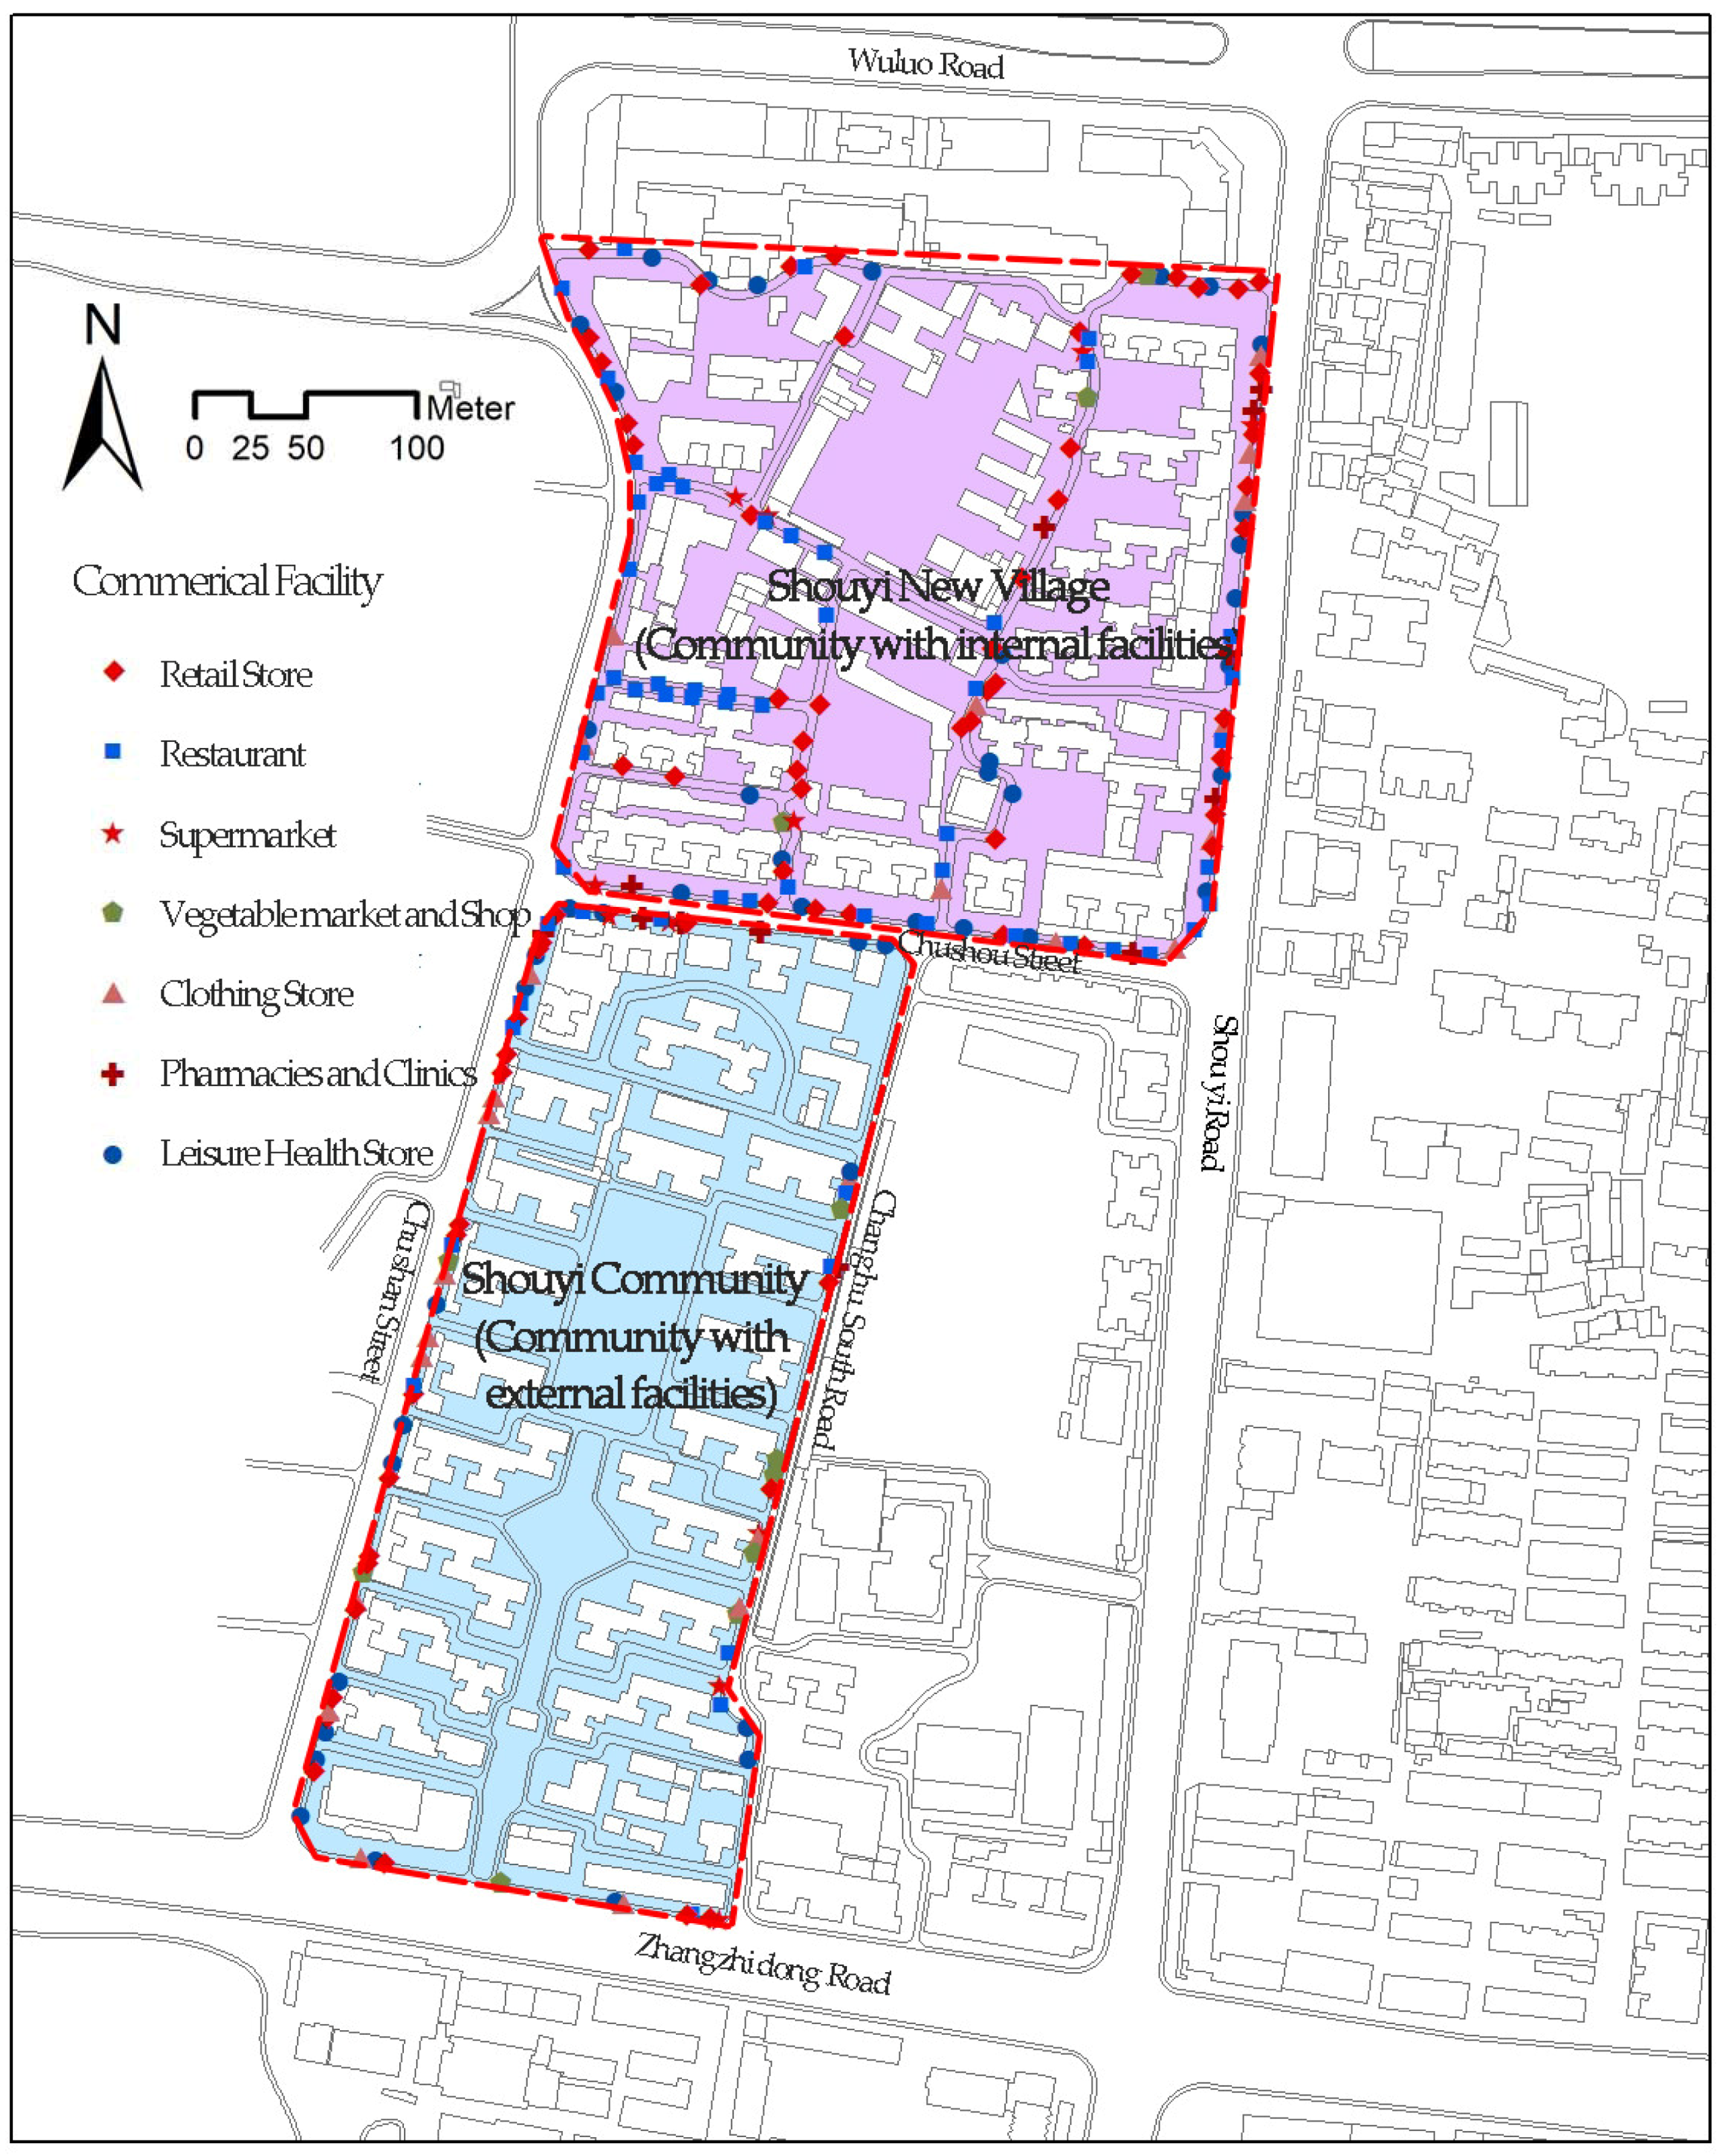
To this end, the present study uses two typical communities with internal and external distribution of commercial facilities as case studies. It collects data of residents’ walking-based consumption behavior from the two types of communities for quantitative analysis of the differences between them so as to discuss the factors and mechanisms leading to these differences. The study can provide a new theoretical perspective based on individuals’ walking-based consumption behaviors into the disputes over the internal and external distribution of commercial facilities in a community, and provide new data support for selecting the appropriate commercial facility distribution mode in community development.
The rest of the paper is structures as follows:
Section 2 reviews previous researches on residents’ consumption behavior in commercial facilities of communities, and on this basis, puts forward the research hypothesis.
Section 3 presents the research objects and methods.
Section 4 shows the results of various types of analysis, identifies the key factors in the distribution of commercial facilities in communities which affect the walking-based consumption travel of residents, and further deduces the mechanism through which distribution of commercial facilities influences the consumption behavior of residents.
Section 5 discusses and summarizes the main findings of the study.
2. Literature Review
Commercial facilities not only serve an important supporting role in community functioning, but also represent a type of business and a place which carries the public life of the community [
23]. Their planning and development began to gain increasing attention in the mid to late 1990s [
24].
In theoretical research, early ideas of community planning proposed to place commercial facilities on the external side or the perimeter of the community, for example, in the core principles “neighborhood unit”, Perry [
25] proposes to size the neighborhood to sufficiently support a school, and to restrict local shopping areas to the perimeter, preferably at road intersections adjacent to communities. In Duane and Pratt’s proposal of the “Traditional Neighborhood Development” (TND) [
26], businesses and offices are mainly located at the perimeter of the community rather than in the center. In more recent theoretical development, emphasis has shifted to mixed use of housing and business. For example, “New Urbanism” advocates mixed community functions to achieve the balance of living, shopping, work, education, and entertainment so as to create communities with local characteristics and culture [
27], this theory provides support for the internal distribution of commercial facilities in community.
In practice, in the United States, commercial or public service facilities in gated residential communities can rarely be found [
28]. Most communities are served by “one-stop” shopping centers. In China, most newly built communities are gated, and their commercial facilities are usually located on the ground floor podium spaces at the entrance of the community and along the street forming the outside of the residential community [
10]. In sum, external distribution of commercial facilities in communities has become popular.
Both in theory and in practice, debates on the internal distribution and external distribution of commercial facilities in communities have not stopped. Researchers who support the internal distribution argue that these community stores can provide most of the things needed in residents’ daily lives, and are located in close distance. Residents can access these commercial facilities sometimes without even having to cross the road [
14], and thus enjoy great convenience. Some researchers believe that internally distributed facilities not only facilitate the lives of residents, but also bring vitality into the communities, making the communities the most dynamic areas in cities [
29]. Many sociologists believe that such urban spaces can breed a diverse, inclusive and creative urban culture [
30].
Researchers who support the external distribution argue that this approach can ensure the quietness inside of the community [
11], while developers can also generate higher real estate income by attracting more people both inside and outside of the community with stores along the street [
31]. In addition, externally distributed facilities can readily integrate with those of the surrounding communities, promoting competition and complementation with each other and forming a local commercial network in the city [
32], and the friendly spaces and street life often found in such urban streets are conducive to the socializing of community residents [
13].
So the two patterns have their own respective advantages. Most previous studies are conducted from the perspectives of urban managers, developers, and property owners, focusing on factors at a macro level of the community as a whole; while few studies from the perspective of residents’ own demands at the micro level can be found, even less pay attention to the residents’ consumption behaviors in the community.
“Resident’s consumption behaviors in the community” usually refers to their daily or high-frequency shopping behaviors, ideally with minimal trouble (i.e., the pursuit of convenience) [
33], mainly for grocery shopping, excluding purchase of durable goods and online shopping, and in most communities, they are carried out by walking [
19,
20]. Resident’s consumption behaviors in community provide more travel activities and promote people’s physical and mental health [
21], and much evidence shows that reduced travel by foot is likely to lead to overweight or obese people [
34] and chronic diseases [
35]. At the same time, walking-based consumption activities in community are often accompanied by interactions between residents. Walking-based daily consumption travels can help enhance people’s sense of belonging to the community [
36], and have positive effects on community communication and interaction [
20].
As to the interaction between residents’ walking-based consumption behavior and community environment, some studies have been carried out. Fan et al. [
37] discuss the relation between residents’ use of spaces and features of urban spatial form in communities, concluding that in densely populated communities, more retail stores and better street connections lead to smaller spatial range of daily activities, and shorter travel distances for residents. Agrawal et al. [
38] observe through surveys of residents’ daily travels, and find out that, comparing with low-density neighborhoods, high-density neighborhoods can satisfy residents’ travel needs in shorter distance and increase residents’ travel times. Fathering et al. [
39] believe that providing local facilities in new residential developments will reduce the average travel distance by foot, increase travel frequency; and they compare the different impacts of facility distribution on travel frequency and travel time. Limanond T. et al. [
40] argue that residents in traditional neighborhoods live near neighborhood commercial streets and thus have greater accessibility and tend to have less car use. In general, there are only limited studies on this subject, which mainly focus on the impact of the number of facilities and the spatial form of communities on consumption behavior. Even so, the principle can be extracted from their findings, which is that the consumption behavior of residents’ in communities is the result of limited rational decision-making under the constraints of time and space [
41], and travel distance is an important factor which affects the frequency and willingness of consumption behaviors. Of course, there are also other influence factors, including the scale of commercial facilities and their diversity as well as the personal preference of residents, etc.
In summary, the review of previous literature shows a lack of study on the impact of the distribution of commercial facilities in a community on the daily walking-based consumption behavior of residents, for they have focused more on its influence on the overall vitality, environmental quality, security, etc. of a community. Although using existing principles, it can be inferred that this distribution has an impact on the daily walking-based consumption behavior of residents, since different patterns may lead to significant differences in travel distances for commercial activities, and this may in turn affect the walking-based consumption behaviors of community residents. But empirical comparative study still lacks as to whether this impact actually exists, and more critically, to what extent it affects specific consumption behavior.
Therefore, this case study aims to verify the hypothesis through empirical research: residents in communities with externally distributed commercial facilities usually have weaker consumption willingness, lower frequency of travel by foot, and a longer chain for a single travel; while residents in communities with internally distributed commercial facilities usually have stronger consumption willingness, higher frequency of travel by foot, and a shorter chain for a single travel; and these are mainly due to the different lengths of walking travel for consumptions in different patterns. And more importantly, the present study aims to analyze the degree of difference in the daily walking-based consumption behavior of residents under the two modes of distribution and the impact on the features of residents’ consumption behavior through quantitative research, including residents’ willingness of consumption, walking distance, frequency of consumption, time duration of consumption, length of travel chain, etc.
4. Results
4.1. Differences in the Features of Walking-Based Consumption Behavior in Communities with Different Distribution Patterns of Commercial Facilities
A statistical analysis of the features of residents’ walking-based consumption behavior in the two communities obtained from the questionnaire was conducted. The results are shown in
Table 3.
It can be seen that external distribution of commercial facilities has greatly increased the local consumption walking distance traveled by the community residents, the average of which is 2.1 times of the walking distance of community with internal commercial facilities. Moreover, residents in the community with internal commercial facilities are more willing to consume by foot than those in the community with external commercial facilities, as 90.19% of the former hold a positive attitude (i.e., strongly willing and willing to consume by foot), 2.3 times of that of the latter at 38.77%. In addition, residents in the community with internal commercial facilities have higher frequency of walking travels, which is 2.0 times the frequency of those in the community with external commercial facilities. At the same time, the community with internal commercial facilities has a shorter walking travel chain than that of the community with external commercial facilities, as to the number of facilities visited in a single walking travel, the former is 27.7% lesser. In terms of the average duration of stay at a facility, the two communities are not much different.
In order to measure the level of difference, one-way ANOVA of the above-mentioned features of consumption travel behaviors of the two case communities was conducted. The results are shown in
Table 3. It can be seen that except for the value of the average duration of stay at a facility which shows no significant differences (Sig. > 0.05), all the other four features show very significant differences (Sig. = 0.000) between the two communities, of which average number of walking travels per day has the most significant difference, followed by the consumption willingness by foot, average distance per walking travel and then average number of commercial facilities visited in a single walking travel. In order to further explain the above differences, and based on the research design, the following sections present further analysis on the relationship between travel distance and consumption willingness, travel frequency, and travel chain length.
4.2. Analysis of the Relationship between Travel Distance and Local Consumption Willingness by Foot
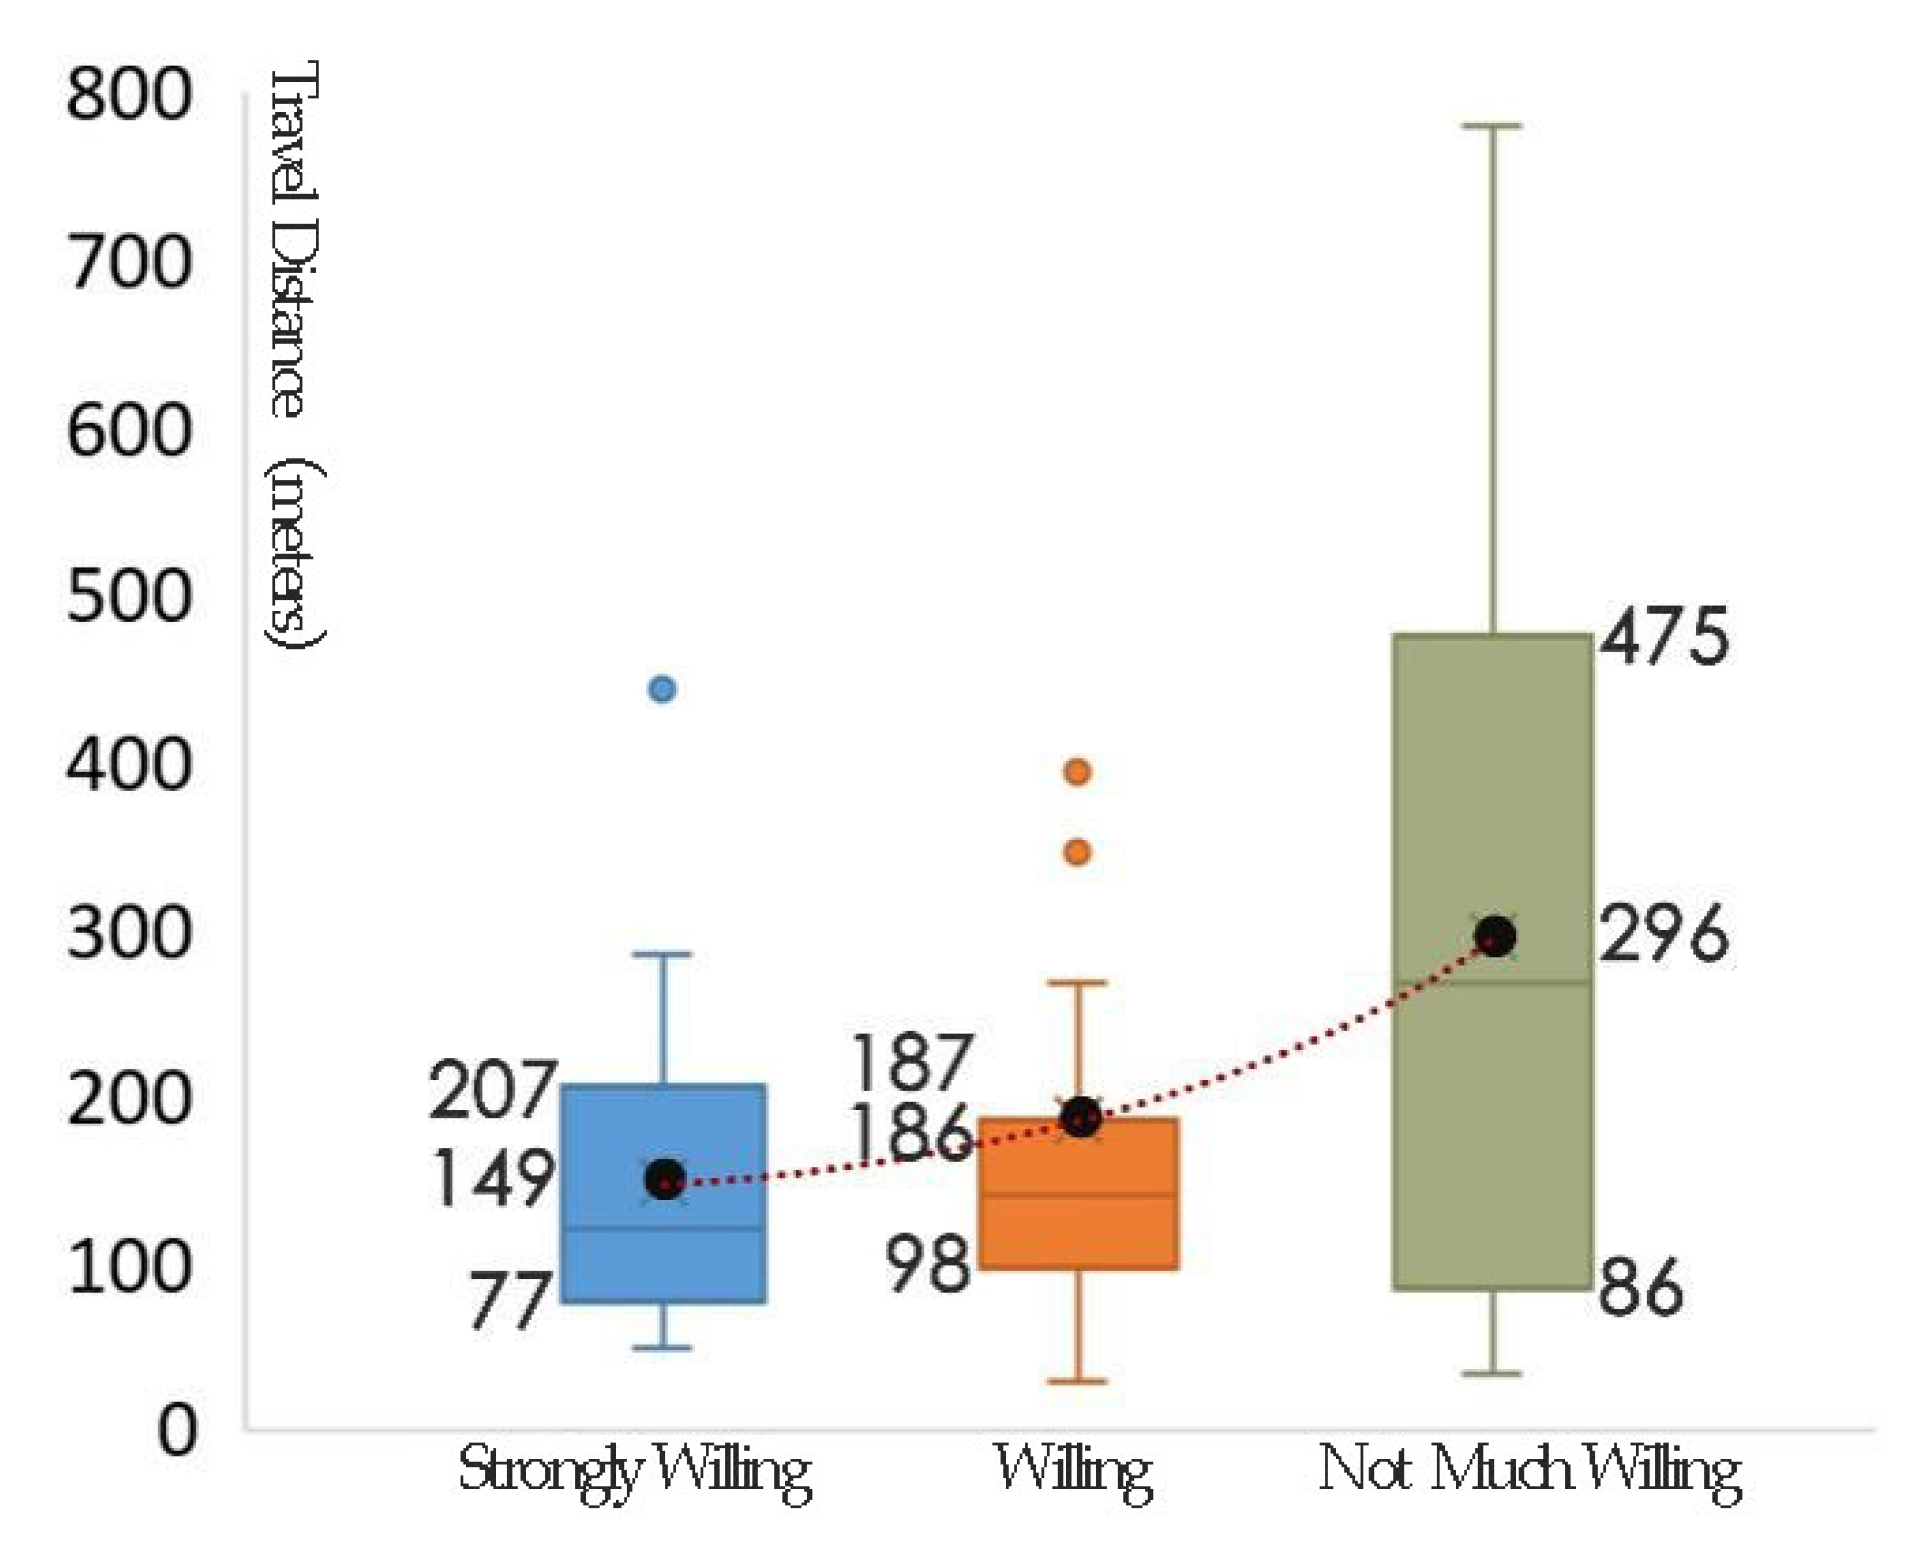
Based on the daily average walking travel distance of all samples, supported by the consumption willingness by foot data, a boxplot is presented in
Figure 3. Since there was only 1 sample that was unwilling to travel for consumption, it is considered untypical and thus was excluded in the analysis. The boxplot shows that for samples who are strongly willing to consume by foot, their average walking travel distance is between 77–207 m, with an average of 149 m; for those that are willing to consume by foot, the average travel distance is between 98–187 m, averaging 186 m, which shows a similar statistical characteristic to that of the strongly willing group. It can be inferred that in addition to travel distance, there are other factors affecting the consumption willingness in these two groups; for samples that are not much willing to consume, their average travel distance is between 86–475 m, averaging 296 m.
In order to further analyze the relationship between the two, a binary logistic regression model was constructed. In which, the consumption willingness by foot is taken as the binary dependent variable, samples that are strongly willing and willing to consume by foot are classified as active consumption willingness (taking a value of 1) which means active, positive attitude towards consumption in the community by foot, not much willing and unwilling to consume by foot are classified as inactive consumption willing class (taking a value of 0) which means passive, indifferent, reluctant attitude towards consumption in the community by foot, and the average walking travel distance is used as an independent variable. A model with a prediction accuracy of 80% and a significance level of 0.000 for the Omnibus Test of Model Coefficients is shown in
Table 4. It can be seen from the model that walking travel distance has a significant influence on the consumption willingness by foot. As travel distance by foot increases, the probability of generating an active consumption willingness decreases; and from the Odds Ratio of the model (Exp(B)), it can be seen that, when the walking travel distance increases by 1 m, the ratio of the probability of holding active consumption willingness to the probability of holding inactive consumption willingness will be reduced by 1%, indicating a sensitivity to distance changes.
In addition, according to the model, when the walking travel distance is 239 m, active and inactive attitude each has a probability of 50%, indicating that this distance is the critical point of active and inactive consumption willingness. This can well explain the difference of residents’ consumption willingness by foot in the two communities, in community with internal commercial facilities, the ratio of samples with a walking travel distance under 239 m is 92%, which is much higher than the 51% ratio in community with external commercial facilities. Therefore, the ratio of active attitude for travel by foot in community with internal commercial facilities is much higher than that in community with external commercial facilities, at 90.19% and 38.77% respectively.
Besides, the method of ordinal logistic regression was also used. In which, the consumption willingness by foot is taken as the ordinal dependent variable with three levels of “Not much willing”, “Willing” and “Strongly willing”. The result shows that the model is basically tenable, with a Sig. of 0.950 (>0.05) for the Test of Parallel Lines and a Sig. of 0.001(<0.05) for the Test of Model Fitting. The coefficient of the variable “Average walking travel distance” and the constant of the Threshold “Not much willing” pass the test of significance (Sig. = 0.004 and 0.000 respectively), but the constant of the Threshold “Willing” doesn’t pass the test of significance (Sig. = 0.086). This indicates that travel distance has a significant impact on the consumption willingness by foot, and can well explain the differences between “Not much willing” and “Willing” or “Strongly willing”, but cannot explain the difference between “Willing” and “Strongly willing”, which support the former conjecture that there exist other factors affecting the consumption willingness in these two groups.
4.3. Analysis of the Relationship between Travel Distance and Travel Frequency by Foot
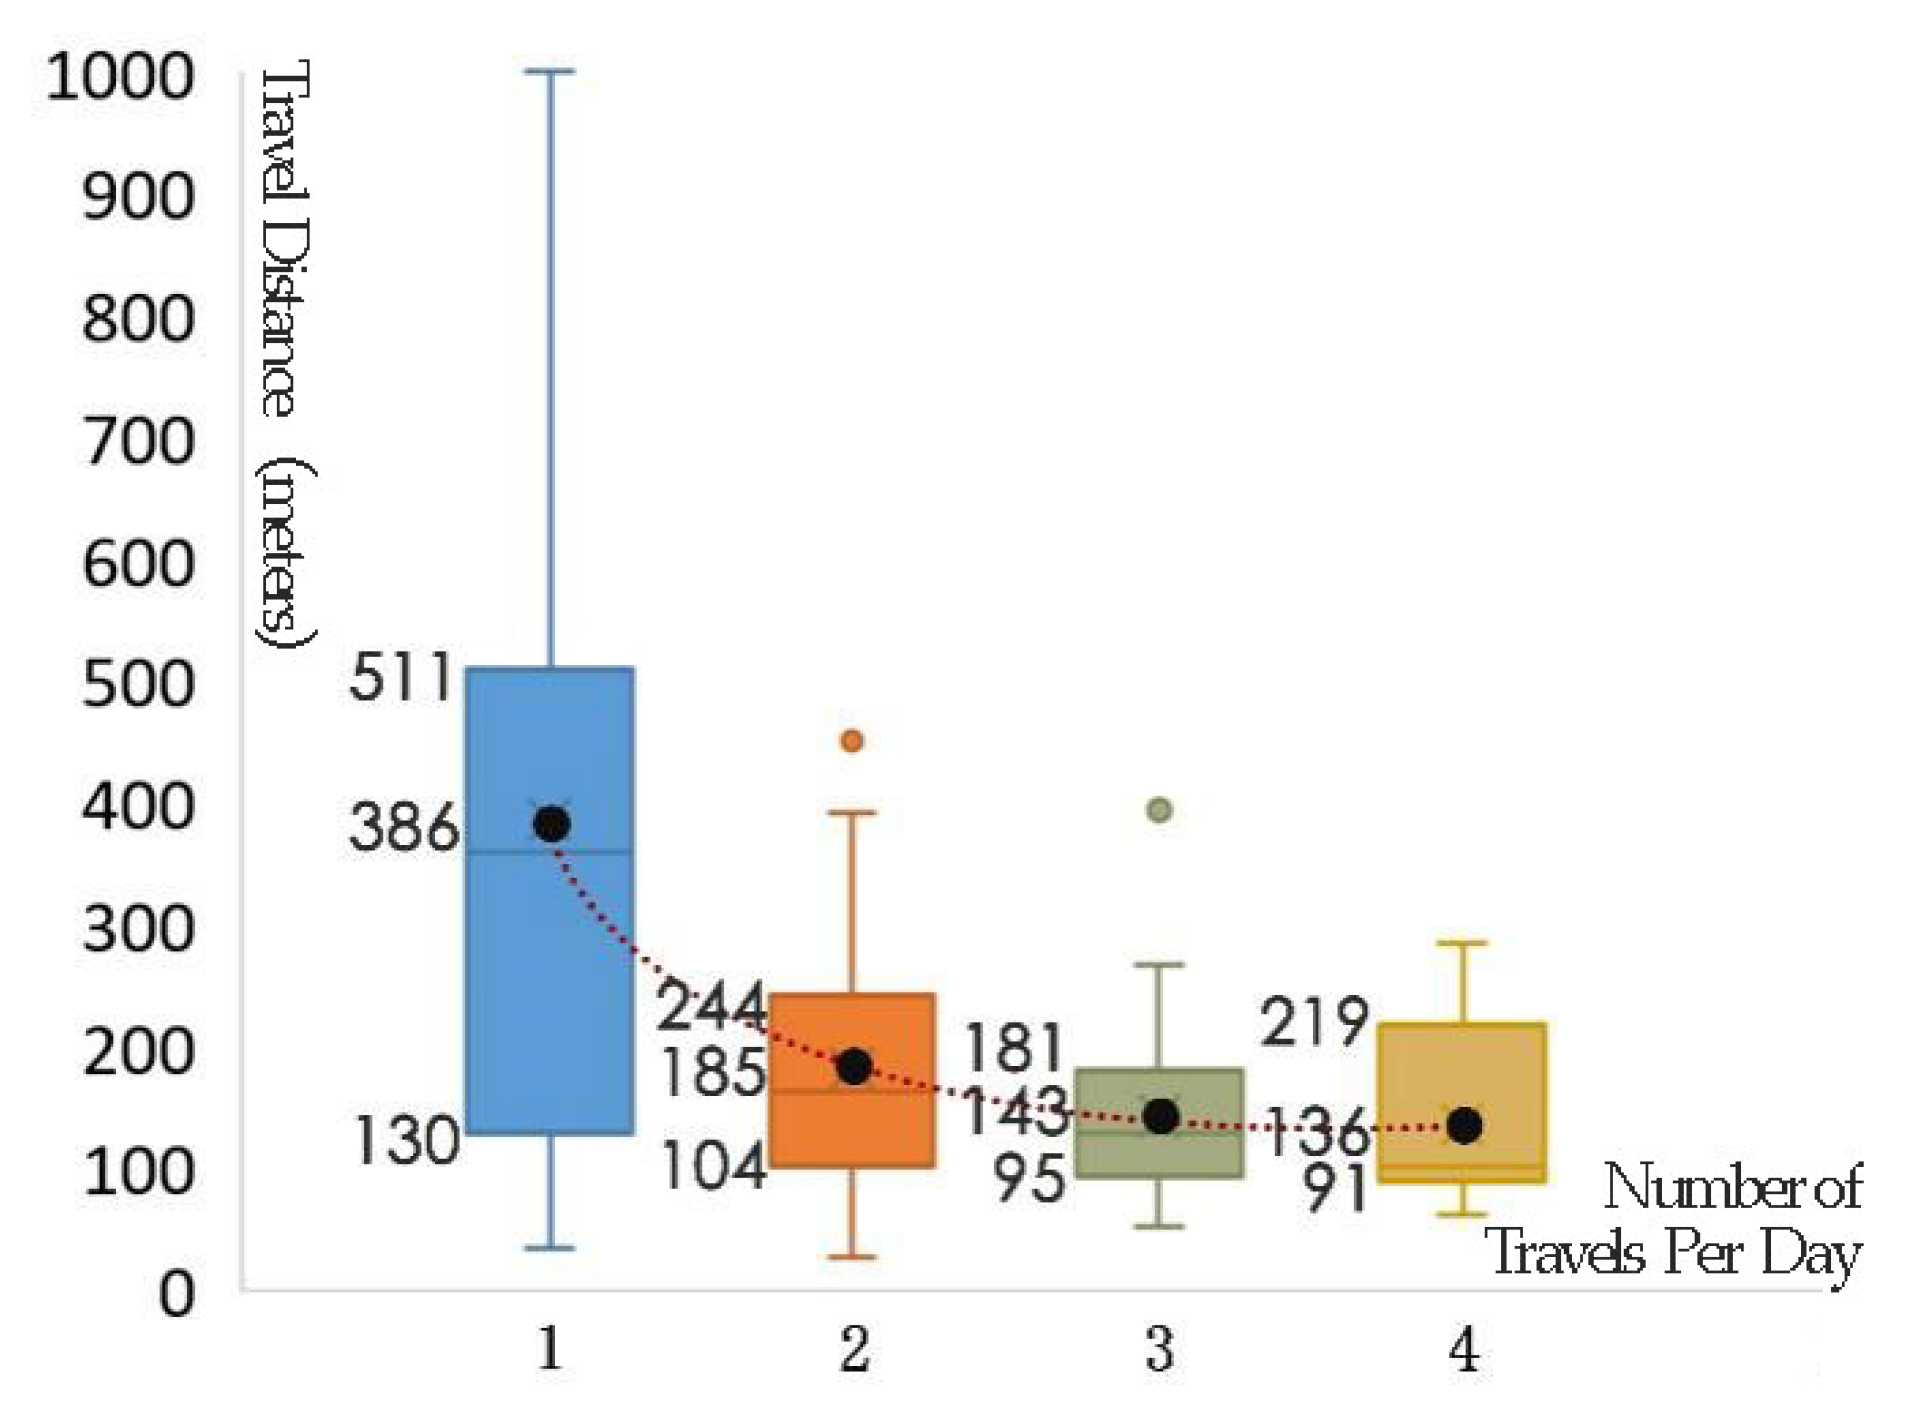
Based on the average walking travel distance of each sample, supported by the data of the average number of walking travels per day, a boxplot is presented in
Figure 4. It can be seen that, for samples with only 1 travel per day, the average travel distance is between 130–511 m, with an average of 386 m; as the number of travel increases, the travel distance gradually shortens; for samples with 4 times of travels per day, the average travel distance is between 91–219 m, with an average of 136 m, which is significantly lower than that of the samples with only 1 travel per day; no samples with over 5 or more travels per day, or 0 travels per day were collected in the survey. The correlation coefficient between travel distance and travel frequency is −0.49, i.e., a moderate negative correlation, indicating that the shorter the walking travel distance, the higher the frequency of walking travels per day.
Similarly, a binary logistic regression model is constructed here, and the walking travel frequency for consumption in community is taken as the binary dependent variable. In which, samples with 1–2 walking travels/day are deemed the low-frequency group (taking a value of 0), samples with 3–4 walking travels/day are deemed the high-frequency group (taking a value of 1), and the average walking travel distance is used as an independent variable. A model with a predicted accuracy of 65% and a significance level of 0.000 for the Omnibus Test of Model Coefficients is shown in
Table 4. It can be seen from the model that the walking travel distance has a significant influence on walking travel frequency. As walking travel distance increases, the probability of high-frequency walking travel decreases, and from the Exp(B) of the model, it can be seen that, when the walking travel distance increases by 1 m, the ratio of the probability of high-frequency walking travel to the probability of low-frequency walking travel will be reduced by 0.7%, indicating a sensitivity to distance changes.
In addition, according to the model, a walking travel distance of 165 m is the critical point between low-frequency walking travel (1–2 times/day) and high-frequency walking travel (3–4 times/day). This can well explain the difference of residents’ frequency of traveling by foot in the two communities, in the community with internal commercial facilities, the ratio of samples with a walking travel distance under 165 m is 71%, while that in the community with external commercial facilities is only 33%. As a result, the proportion of samples with 3–4 walking travels per day in the community with internal commercial facilities is much higher than that in the community with external commercial facilities, at 86.3% and 5% respectively.
4.4. Analysis of the Relationship between Travel Distance and Travel Chain Length by Foot
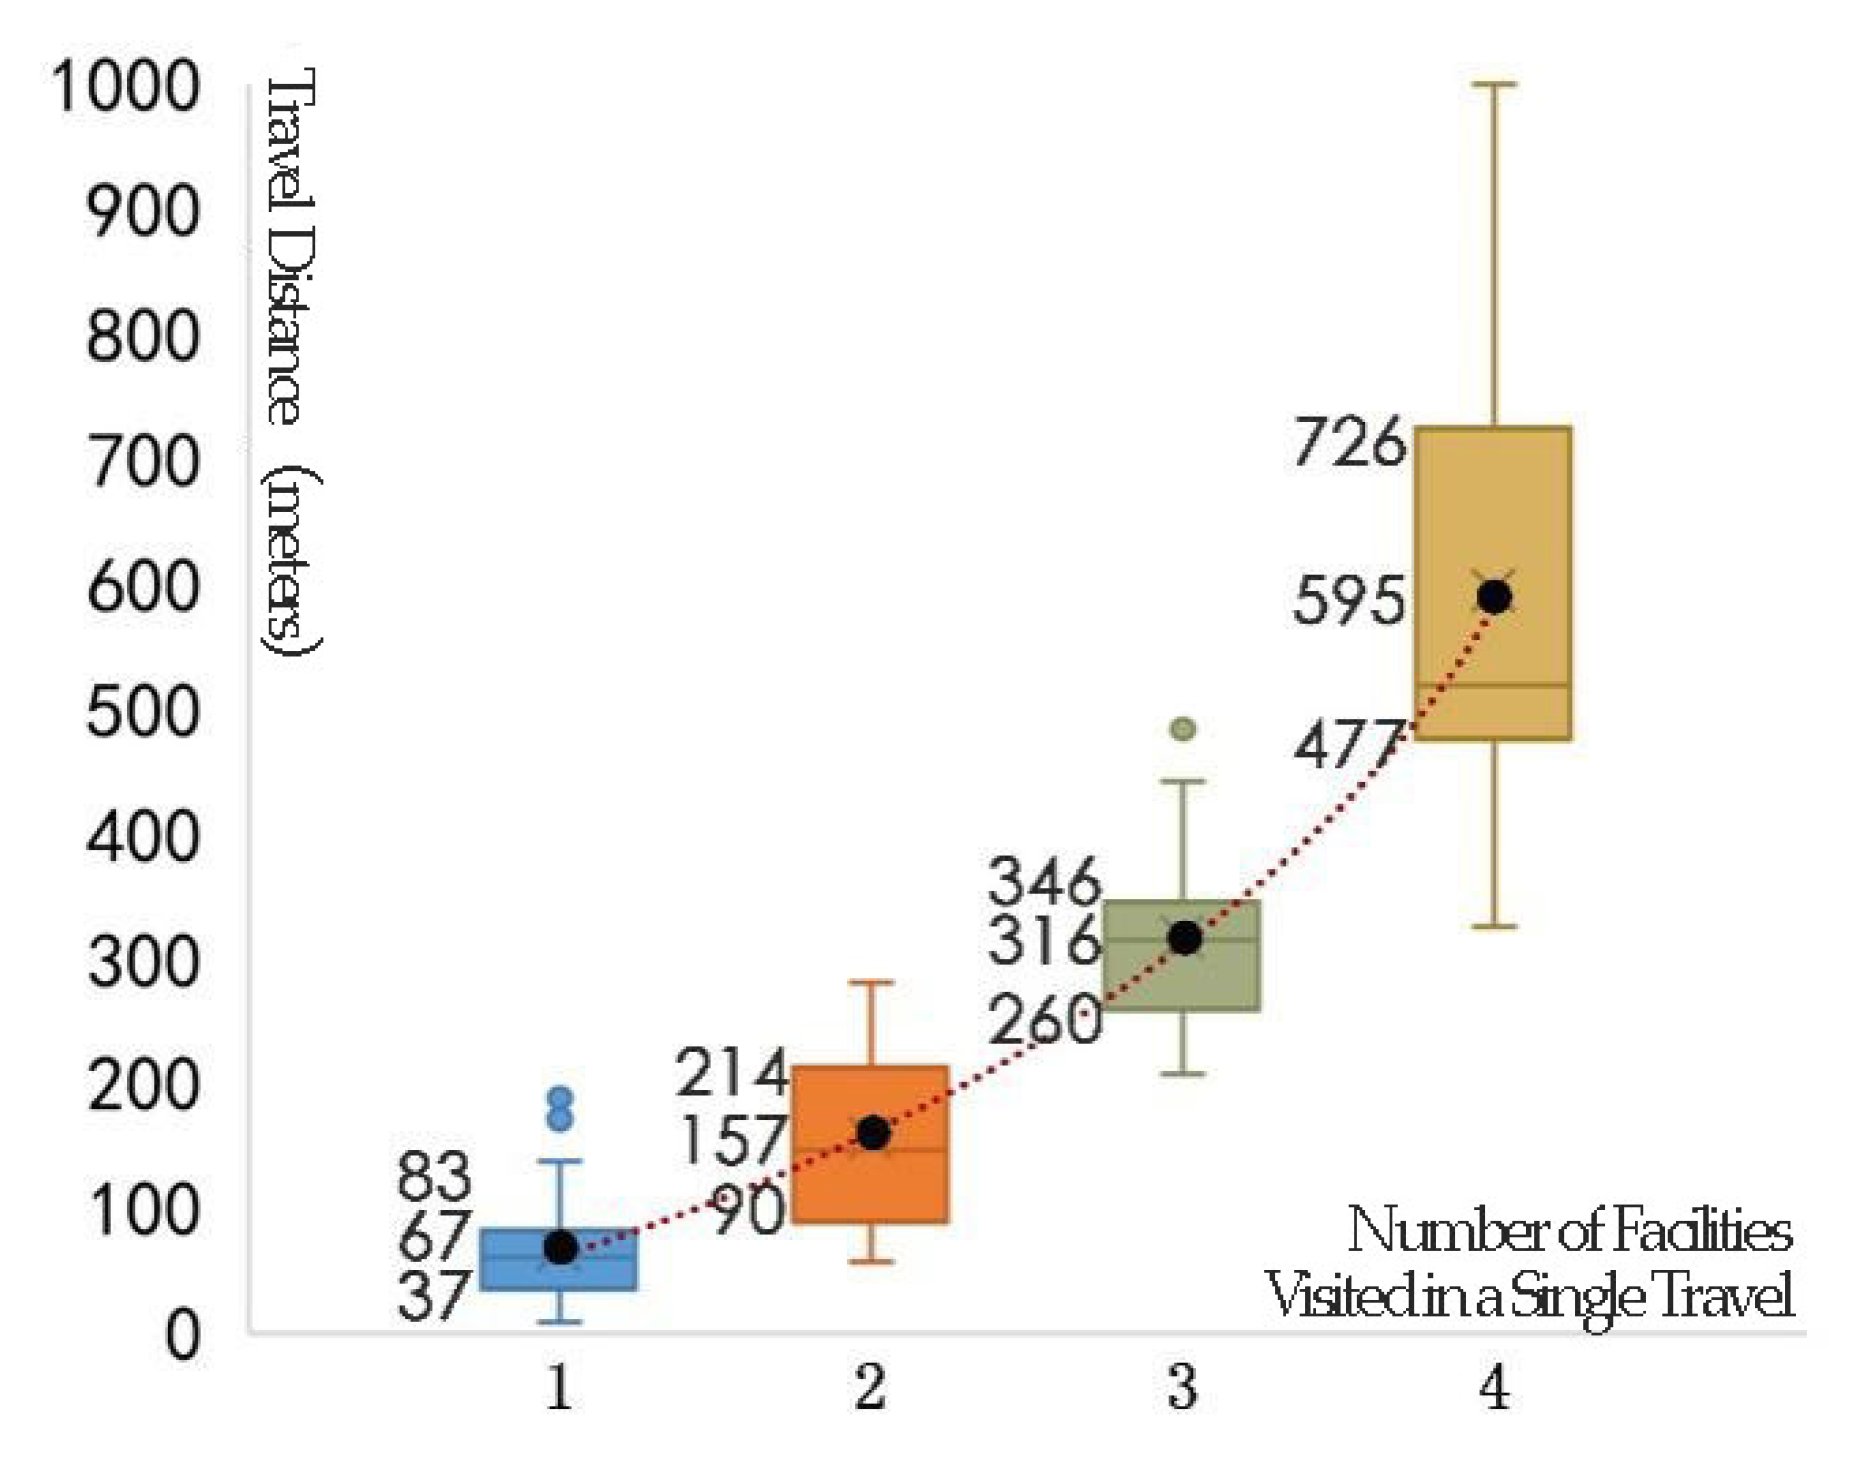
Based on the trajectory length of each walking travel, and supported by the data of the number of commercial facilities visited in a single walking travel, a boxplot is presented in
Figure 5. For travels with only one facility visited, the average travel distance is between 37–83 m, with an average of 67 m. For travels with four facilities visited, the average travel distance is between 477–726 m, averaging 595 m. The correlation coefficient between travel distance and number of commercial facilities in a single travel is 0.88, i.e., a highly positively correlation, indicating that the longer the travel distance, the more facilities visited per travel.
Similarly, a binary logistic regression model is constructed here, and the walking travel chain length for consumption in community is taken as the binary dependent variable. Samples with 1–2 commercial facilities visited during a single walking travel are classified as short travel chains, and those with 3–4 facilities visited are classified as long travel chains, and the average walking travel distance is used as an independent variable. A model with a prediction accuracy of 94% and a significant level of 0.000 for Omnibus Test of Model Coefficients is obtained as shown in
Table 4. It can be seen from the model that walking travel distance has a significant influence on the walking travel chain. As the walking travel distance increases, the probability of long travel chain increases, and from Exp(B) of the model, it can be seen that, when the walking travel distance increases by 1 m, the ratio of the probability of choosing a long travel chain to the probability of choosing a short travel chain will increase by 4.4%, indicating a sensitivity to distance changes.
In addition, according to the model, the walking travel distance of 260 m can be determined as the critical point of the short travel chain (with 1–2 facilities visited) and the long travel chain (with 3–4 facilities visited). This can well explain the difference of residents’ travel chain length by foot in the two communities, in the community with internal commercial facilities, only 13% of the residents travel longer than 260 m by foot, much lower than the 38% ratio in the community with external commercial facilities. Therefore, the proportion of residents who visit 3–4 commercial facilities in a single walking travel for consumption in the community with internal commercial facilities is far lower than that in the community with external commercial facilities, at 13% and 41% respectively.
5. Discussion and Conclusions
From the perspective of residents’ walking-based consumption behavior, and through empirical comparative research, this study investigates and analyzes the differences between the internal and external fringe distributions of commercial facilities in communities. Questionnaire surveys and quantitative analysis indicate that the two different patterns of distribution have a great impact on residents’ walking-based consumption behavior.
This present study finds that, compared with that of the community with internal commercial facilities, the average walking travel distance for local consumption in the community with external commercial facilities is significantly longer. In this case study, under conditions of similar community environment and population composition, the latter is 2.1 times longer than the former. The main reasons lie in the fact that consumption behaviors in the community with internal commercial facilities are mostly completed inside of the community (assuming an average travel distance of D); while consumption behaviors in the community with external commercial facilities involve first a travel to the outside of the community (close to the distance of D), and then a walk along the outside surrounding roads to the facilities, so the distance may double; and if it happens in a gated community, the distance of detour may further increase.
Furthermore, the case study shows that the differences of other characters of residents’ walking-based consumption behavior between the two kinds of communities are also large. The community with internal commercial facilities has 2.3 times the sample number holding active local consumption willingness by foot, 2 times the walking travel frequency, and 27.7% less the number of facilities visited in a single walking travel as does the community with external commercial facilities. However, the residents’ duration of stay at a facility are of no obvious difference for the two communities.
The literature review shows that the increase in walking travel distance for consumption in a community caused by different modes of the distribution of commercial facilities maybe the main factor that brings about the above differences in community consumption behaviors and habits. To verify this hypothesis and study the degree of impact from different modes of the distribution on consumption behavior, three binary logistic regression models were constructed regarding the relationships between walking travel distance and consumption willingness, travel frequency and travel chain length by foot, respectively. Examinations prove that these three models are valid with prediction accuracy at 80%, 65% and 94% respectively. The models indicate that the longer the walking travel distance, the lower the probability of generating an active consumption willingness by foot, and the lower the probability of a high-frequency walking travel, but the higher the probability of a long walking travel chain. The models also indicate that walking travel distance affects the walking-based community consumption behaviors dramatically, when the walking travel distance increases by 1 m, the ratio of the probability of holding active consumption willingness to the probability of holding inactive consumption willingness will be reduced by 1%, the ratio of the probability of high-frequency travel to the probability of low-frequency travel will be reduced by 0.7%, and the ratio of the probability of choosing a long travel chain to the probability of choosing a short travel chain will increase by 4.4%. In addition, the models show that the thresholds for the 50% probability of active consumption willingness, high-frequency travel and short travel chain distance are 239, 165 and 260 m respectively.
It is believed that the main reasons behind this result lies in that shorter walking travel distance reduces physical labor, time consumption and psychological burden, offers better experience of travel, and thus brings stronger consumption willingness by foot. For example, many residents in the community with internal commercial facilities claim that whenever there is a need for consumption, they will make the travel without having to consider the cost of travel, so the travel frequency is higher and the travel chain shorter; while many residents in community with external commercial facilities say that they will consider the walking travel cost when there is need for consumption. For consumption needs that are not so urgent, they might choose to abandon the travel or to combine it with other travels, so the travel frequency is lower and the travel chain longer.
According to the above conclusions, the hypothesis of this paper has been confirmed. And from the perspective of walking-based consumption behavior in community, this study advocates the internal distribution of commercial facilities in communities, as it bears positive significance for facilitating residents’ daily lives, improving the frequency of walking travel, promoting the physical and mental health, and enhancing community communication and vitality. At the same time, for communities with external distributions of commercial facilities, it is also possible to shorten travel distance and promote walking-based consumption behavior through various measures of optimization, such as the setting of more reasonable and more efficient walking routes, better location of the main entrance, and setting commercial facilities closely related to daily life near the main entrance, etc. These conclusions have practical significance for robust community development, effective community planning and construction. However, there are still weaknesses in the present study. On the one hand, the study does not address the impact on consumption behavior from some other factors, such as the quality of commercial facilities, the features of residents etc., although these variables are controlled to some extent, the deviation in the conclusion is inevitable. On the other hand, due to the limited number of research objects and samples, the threshold values that lead to changes in consumption willingness, frequency, and chain length presented in this study demand further research. In prospective studies, sample size will be enlarged, and communities will be further classified according to their types and scales, and the resident population will be further specified according to their age, gender etc. to get a more detailed result.
