Article

Investigating the Relationship between Construction Supply Chain Integration and Sustainable Use of Material: Evidence from China

1
Faculty of Civil and Environmental Engineering, Ruhr-Universität Bochum, Universitätsstraße 150, D-44780 Bochum, Germany
2
Faculty of Civil Engineering and Geosciences, Stevinweg 1, 2628 CN Delft, The Netherlands
3
School of Construction Management and Real Estate, Chongqing University, Chongqing 400045, China
*
Author to whom correspondence should be addressed.
Sustainability 2018, 10(10), 3581; https://doi.org/10.3390/su10103581
Submission received: 17 September 2018 / Revised: 30 September 2018 / Accepted: 2 October 2018 / Published: 8 October 2018
(This article belongs to the Special Issue Sustainable Development and Management of Mega Projects)

Abstract

:
Environmental burdens arise in the whole life cycle of construction. Waste and pollution are produced in the upstream and downstream of a construction project along the supply chains. The interdependency between on-site construction and off-site logistics also leads to an expansion effect of waste when a disturbance occurs. A related supply chain activated by construction activities should be taken into account to improve the sustainability in construction from a material and waste management perspective. However, it is unknown how the supply chain integration could contribute to the sustainable use of materials in construction. Therefore, an empirical investigation is conducted. A research model with eight latent-constructs is designed through a comprehensive literature review, and 70 completed survey questionnaires are received. Using PLS-SEM (partial least squares-structural equation modeling), sample data is analyzed and seven research hypotheses are examined. Results support the assumption that the construction supply chain integration had a positive correlation with the sustainable use of construction materials. Discussion and relevant suggestions are given for the future research.

1. Introduction

A significant increase in the public awareness of sustainability has been presented after the issue of Brundtland Report in 1987. Extensive construction and built assets maintenance have resulted in higher demand for natural resources, increased pollution of land, water, and air, as well as adverse effects on biodiversity [1,2]. The construction sector accounts for 35–40% of total carbon emissions, 30–40% of solid waste production, around 16% water usage, and more than 40% of raw materials consumption [1,3,4,5,6,7]. However, the awareness of sustainability in construction remains weak [8,9].
Environmental burdens arise at different life cycle phases of construction including the extraction of the raw materials, manufacturing of the construction materials, construction and maintenance of built assets, their demolition and waste management [6,10]. Depletion of resources and energy caused by construction materials extraction, production, and consumption is a big issue [2,6]. For example, it was observed that around 72.89% of total energy consumption of building in China’s construction sector come from the manufacturing of raw materials [11]. Another critical issue affects sustainable performance in construction is the construction and demolition (C&D) waste management. Reusing and recycling C&D waste for the manufacture of new construction materials has significant potential in saving resources and reducing corresponding negative environmental effects [7].
Most sustainability research in the field of construction regarding materials and waste adopts a project-based view. It emphasizes improving processes and policies during the project lifecycle and mainly concern project stakeholders’ attitude [8,9,12]. However, causes of construction waste and pollution are not limited to the construction field itself. Waste and pollution are also produced in the upstream and downstream of a construction project along the supply chain, including the multi-tier off-site production and corresponding vehicles [13]. Besides, the interdependency between on-site construction and off-site logistics is dominant, which leads to an expansion effect of waste when a disturbance along the supply chain occurs [14,15]. Therefore, a related supply chain activated by construction activities should be taken into account to improve the sustainability in construction from a material and waste management perspective.
A significant barrier to implement supply chain strategies for construction material and waste management has been argued as the nature of construction supply chain [16]. Compared with the manufacturing supply chain, the downstream of construction supply chain is unobvious and upstream material flows are often invisible, which may lead to excessive material production and wasteful resource allocation as construction projects progressing [17,18]. It is necessary to explore the integration of the construction supply chain, which aims to build a visible, economical, and continuous material flow across organizational boundaries [16]. However, the relationship between the degree of integration of the construction supply chain and the improvement of the sustainable use of construction materials remains to be under-explored.
The PLS-SEM (partial least squares-structural equation modeling) is undertaken to explore the relationship mentioned above. Structural equation modeling (SEM) has been widely applied in theoretical explorations and empirical validations in many disciplines since its ability was confirmed in the early 1980s [19,20]. As an alternative to the frequently applied covariance-based SEM (CB-SEM), PLS-SEM was regarded as a causal modeling approach focused on maximizing the explained variance of the dependent latent constructs rather than reporting a theoretical covariance matrix [21]. PLS-SEM can estimate complex relationships and emphasize prediction while simultaneously relaxing the demands on data and specification of relationships [22,23]. We selected this method because it is able to cope with the small sample size and suitable for explorative studies [21].
This paper first clarified the definition and classification of the construction supply chain integration and provided insights into the unique supply requirements of sustainability from a material perspective. Following the systematic review process defined by Seuring and Müller, Cerchione et al. [24,25], we conducted a review of the literature on the field of construction supply chain integration and sustainable use of construction material to provide a conceptual framework with corresponding constructs and developed the research hypotheses. The conceptual framework was used to further explore the relationship between the degree of supply chain integration and the sustainable use of construction material. Subsequently, the PLS-SEM method was adopted, including instrument development, data collection, and measurement validation. In the final section, a discussion of findings and future research orientations were presented.

2. Literature Review and Hypothesis Development

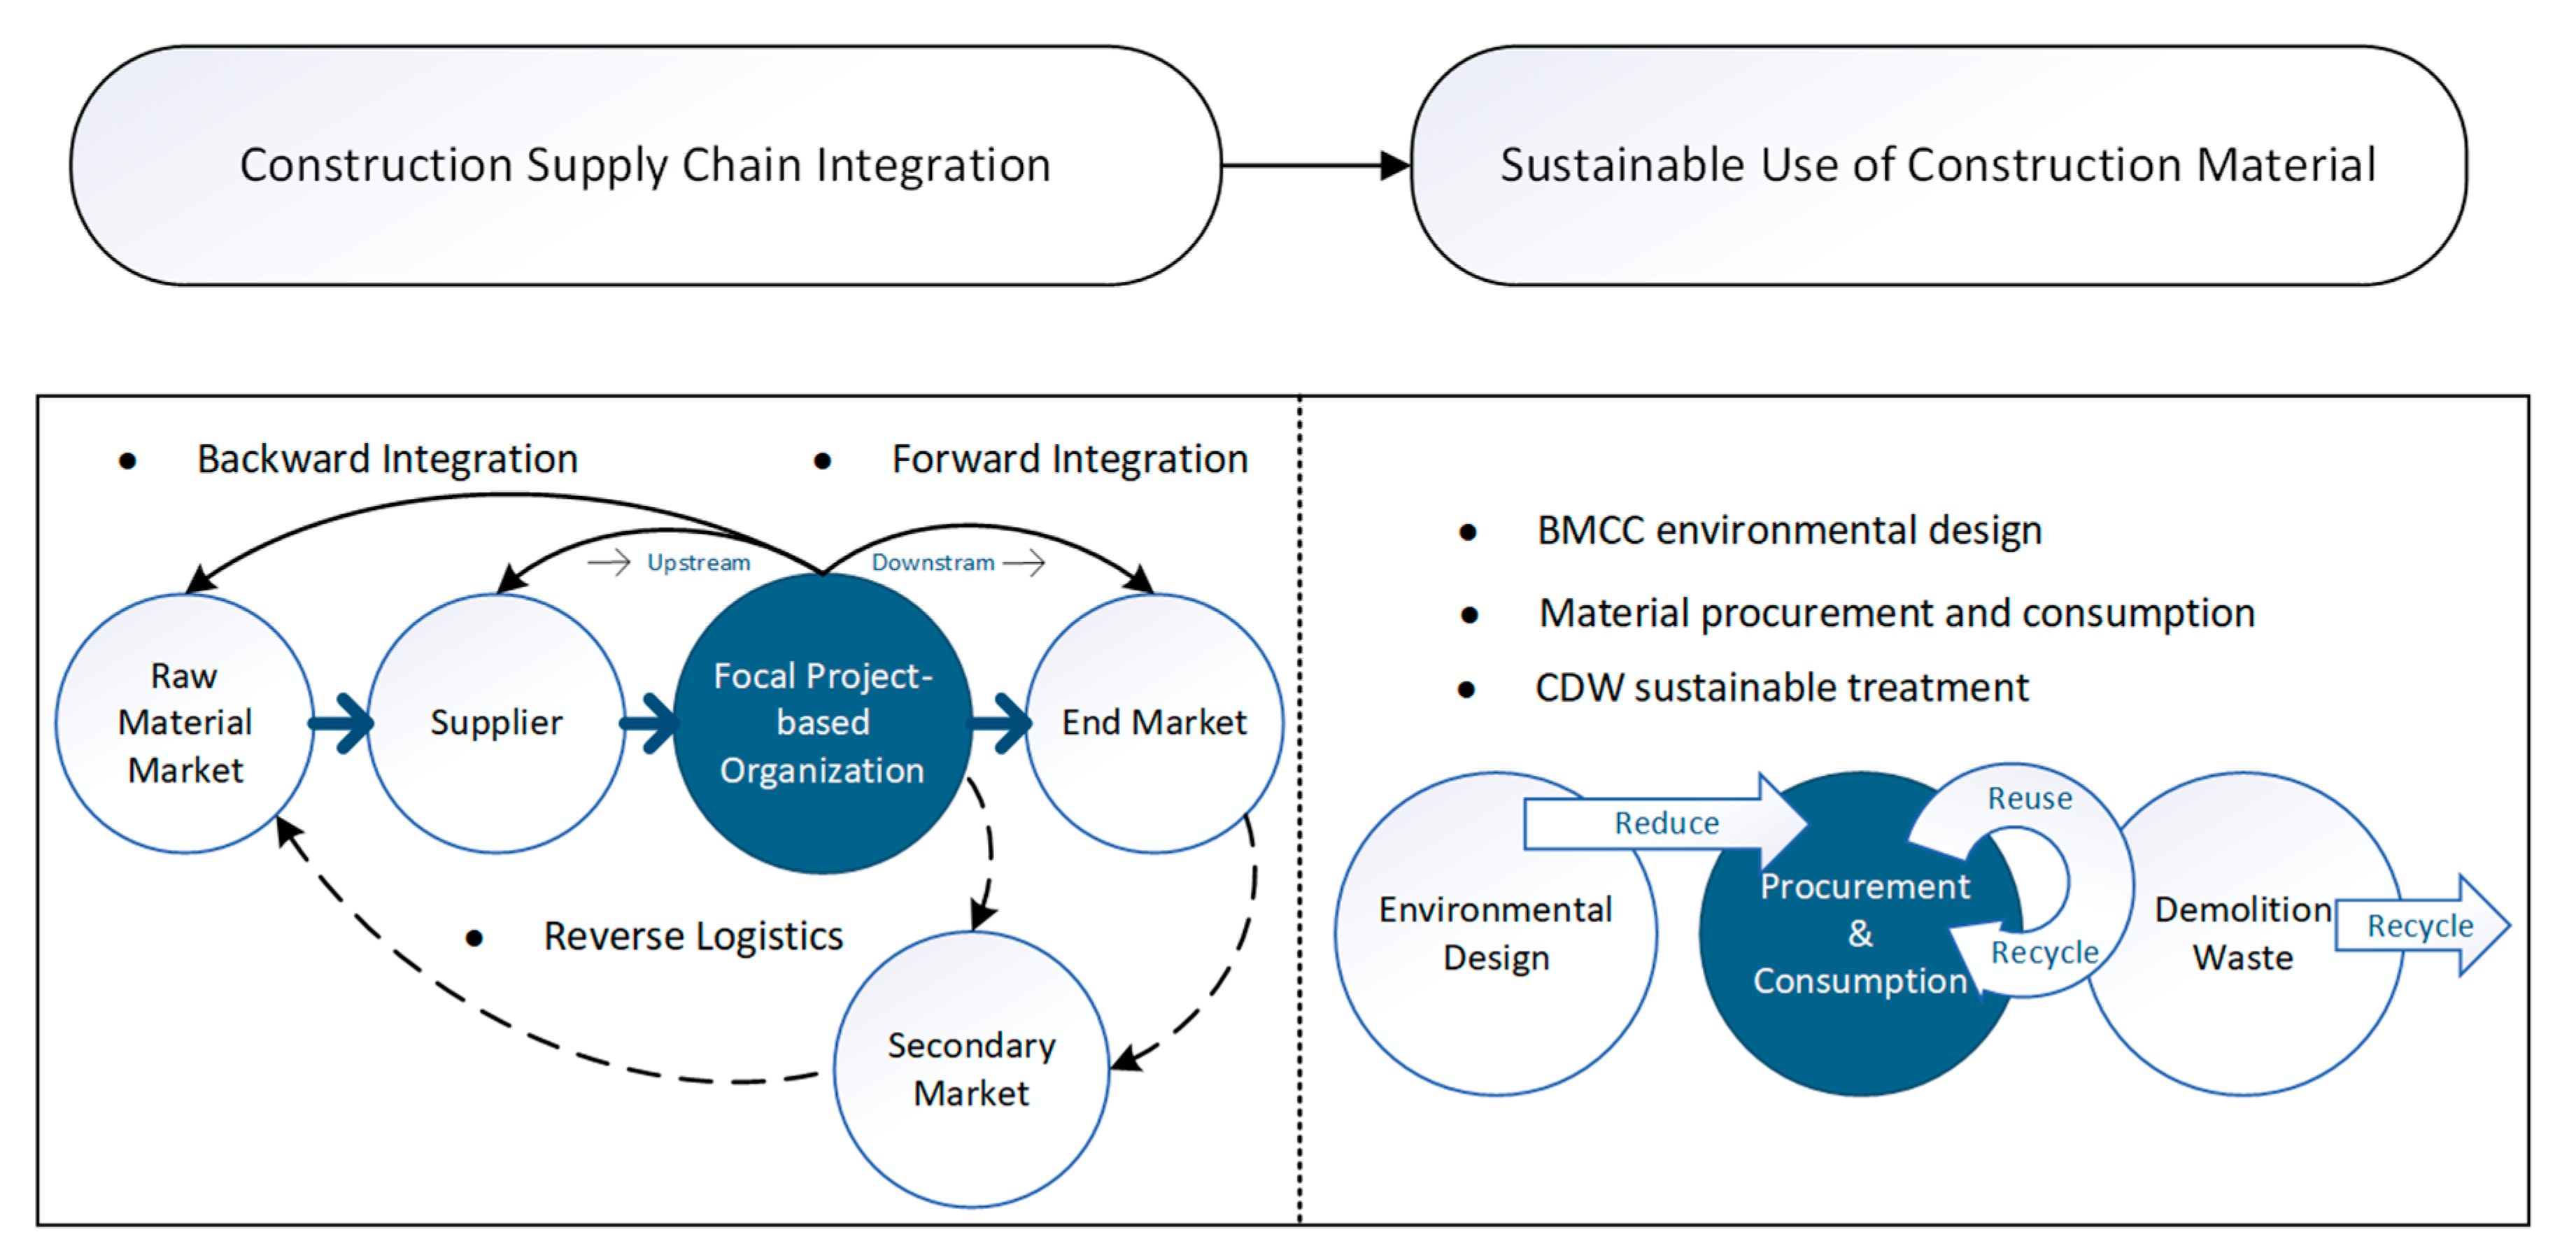
2.1. Construction Supply Chain Integration (CSCI)

In the strategic management literature, supply chain integration is categorized into two primary dimensions, i.e., vertical and horizontal integration. Vertical integration is defined as a competitive strategy by which a company takes complete control over one or more stages in the production or distribution of a product [26,27]. Relatively, horizontal integration is defined as an acquisition strategy of a similar or a competitive business [28,29]. Vertical integration considers both the transaction relationship and physical logistics, while the horizontal integration turns to the effectiveness and efficiency of capital [28,29]. Strategic integration in the construction field focuses on vertical integration rather than horizontal integration [16,30,31] because the essence of vertical integration of a construction project related organization is to hold more parts of the whole supply chain.
The dimensionality of supply chain integration is essential to reflect how the individual dimensions operate and function together [32]. One stream of supply chain integration literature investigated the vertical integration as a unidimensional construct [33,34], while others divided it into internal and external dimensions [35]. Multiple dimensions come from various perspectives, e.g., flows of materials, information, and transactions/finances [36]. However, there is arguably a great deal of overlap or ambiguity among them, making it difficult to untangle their relationships. Thus, a topological approach from the focal organization to the extended supply chain is suggested for vertical integration dimensional development [27,32]. Some research followed this logic and developed three integration dimensions of the general manufacturing supply chain: customer, supplier and internal integration [32,37]. To extend the range of application to other peculiar supply chains, another stream literature redefined extended parts as forward integration (from the focal organization to the point of consumption) and backward integration (from the focal organization to the point of origin) [38,39,40].
In the construction supply chain, customer integration is limited to describing the downstream relationships, because the client (e.g., government) may not be the end-users (e.g., householders). Therefore, the expression of the forward integration is more appropriate for CSCI. Accordingly, this paper adopts the backward integration instead of the supplier integration. Under the requirements of the sustainability in construction, backward integration is vital to construct a visible, economical, and continuous material flow from off-site chains to on-site construction [41,42]. Backward integration is concerned with the material flows from multi-levels of suppliers to the construction site, emphasizing the leading role of on-site construction activities and the supporting role of off-site upstream logistics [16,41,43,44]. It is essential to adopt the backward integration to improve project-based focal construction organization, and further to elevate current project-based practices to supply chain management. Vrijhoef and Koskela distinguished four specific practice paradigms of supply chain management in construction based on a series of case studies [41]: (1) improving the interface between the supply chain and the construction site; (2) improving the supply chain upstream; (3) transferring activities from the construction site to the supply chain; and (4) integrated management of the construction supply chain. These paradigms belong to the backward integration and are taken in this paper to measure the degree to which a focal construction organization takes measures with its upstream partners to guarantee and manage production, transportation, and construction activities. We redefine these descriptions of four paradigms and adapt them into observable variables.
In the manufacturing industry, the forward integration is mainly concerned with the supply chain downstream distribution channels and marketing sales to the end-users [39,40]. It is applicable for some types of the construction project, e.g., residential housing to adopt the forward integration to be involved in a more flexible terminal market. It is meaningful to acquire more precise information about the rigid housing demand through the forward integration, to control the non-rational growing market demand [45,46]. Depending on the degree of control exercised by the clients and end-users [47], and construction sites over the contribution and supply activities, forward integration can be broadly classified into four categories: (1) the clients and end-users exercise control over the contribution activity while the construction site exercises control over the supply activity; (2) the construction site has complete control over both the activities; (3) the construction site has control over the contribution activity while the clients and end-users exercises control over the supply activity; and (4) the clients and end-users exercise complete control over both of the activities.
Reverse logistics (RL) in the construction supply chain recently is widely discussed. RL aims to build a circulation from the point of consumption (i.e., construction site) to the point of origin (e.g., raw material market and secondary market) [18,48]. In the construction industry, the destination for the material resource is less but has much in common. Hosseini et al. summarized the commonness and provided a standard RL procedure for construction, i.e., creating three critical RL channels: (1) channel between deconstruction and secondary markets; (2) channel between raw material markets and secondary markets; (3) channel between secondary markets and the construction site [48].
The backward integration, forward integration, and reverse logistics discussed above are three essential forms of the CSCI. This paper extracts measurement items from the literature as components to constitute these three integration forms, as shown in Table 1.

2.2. Sustainable Use of Construction Material (SUCM)

The implication of sustainability is broad, including dimensions of environmental, economic, social, cities, development, construction, etc. [50]. Various tools have been developed and adapted in the construction field to assess sustainability from different perspectives and for a variety of users. The life cycle assessment (LCA) established by the European Union (EU) is widely used to evaluate the environmental performance of construction products and processes [7,51,52]. However, the building process is less standardized than other mature industrial processes—e.g., manufacturing industry—and quantitative information about the environmental impacts of the production and manufacturing of construction materials is limited [53,54]. Therefore, conducting an efficient LCA in the construction industry is still a challenging task.
Ortiz et al. summarized two ways of applying LCA for the building material and component combinations (BMCC) and the whole process of the construction (WPC) [55]. This paper focuses on exploring the impact of CSCI on the BMCCs rather than WPC, which has a broader scope. Environmental product declarations (EPD) is a strategy adopted for reducing the environmental impact of BMCCs, while Green Public Procurement (GPP) is developed to improve construction procurement especially for the public sector [7,55]. Additionally, several tools have been developed specifically for the construction sector such as Leadership in Energy & Environmental Design Building Rating System (LEED), which provides measurement ratings for green buildings [54]. LEED and the other guidelines such as Waste Framework Directive (WFD) provided by the EU address C&D waste management [7].
Along with the above policies and standards, a literature review is conducted to identify indicators to assess the sustainable use of construction materials, from raw material extraction to production, consumption, and finally, waste treatment. Some literature presented case studies—e.g., recycled aggregate as a sustainable construction material [6]—while others explored critical factors contributing to sustainability in construction materials [56]. As shown in Table 2, a total of nine factors of sustainable use of construction material are extracted from the literature and sorted into three groups. BMCC environmental design and C&D waste sustainable treatment are coded as BED and CST.
Table 2 also shows the frequency the literature mentioned of each factor to indicate the attention it has attracted. These factors are hypothesized to be critical in improving sustainable performance in construction material extraction, production, consumption, and waste treatment.

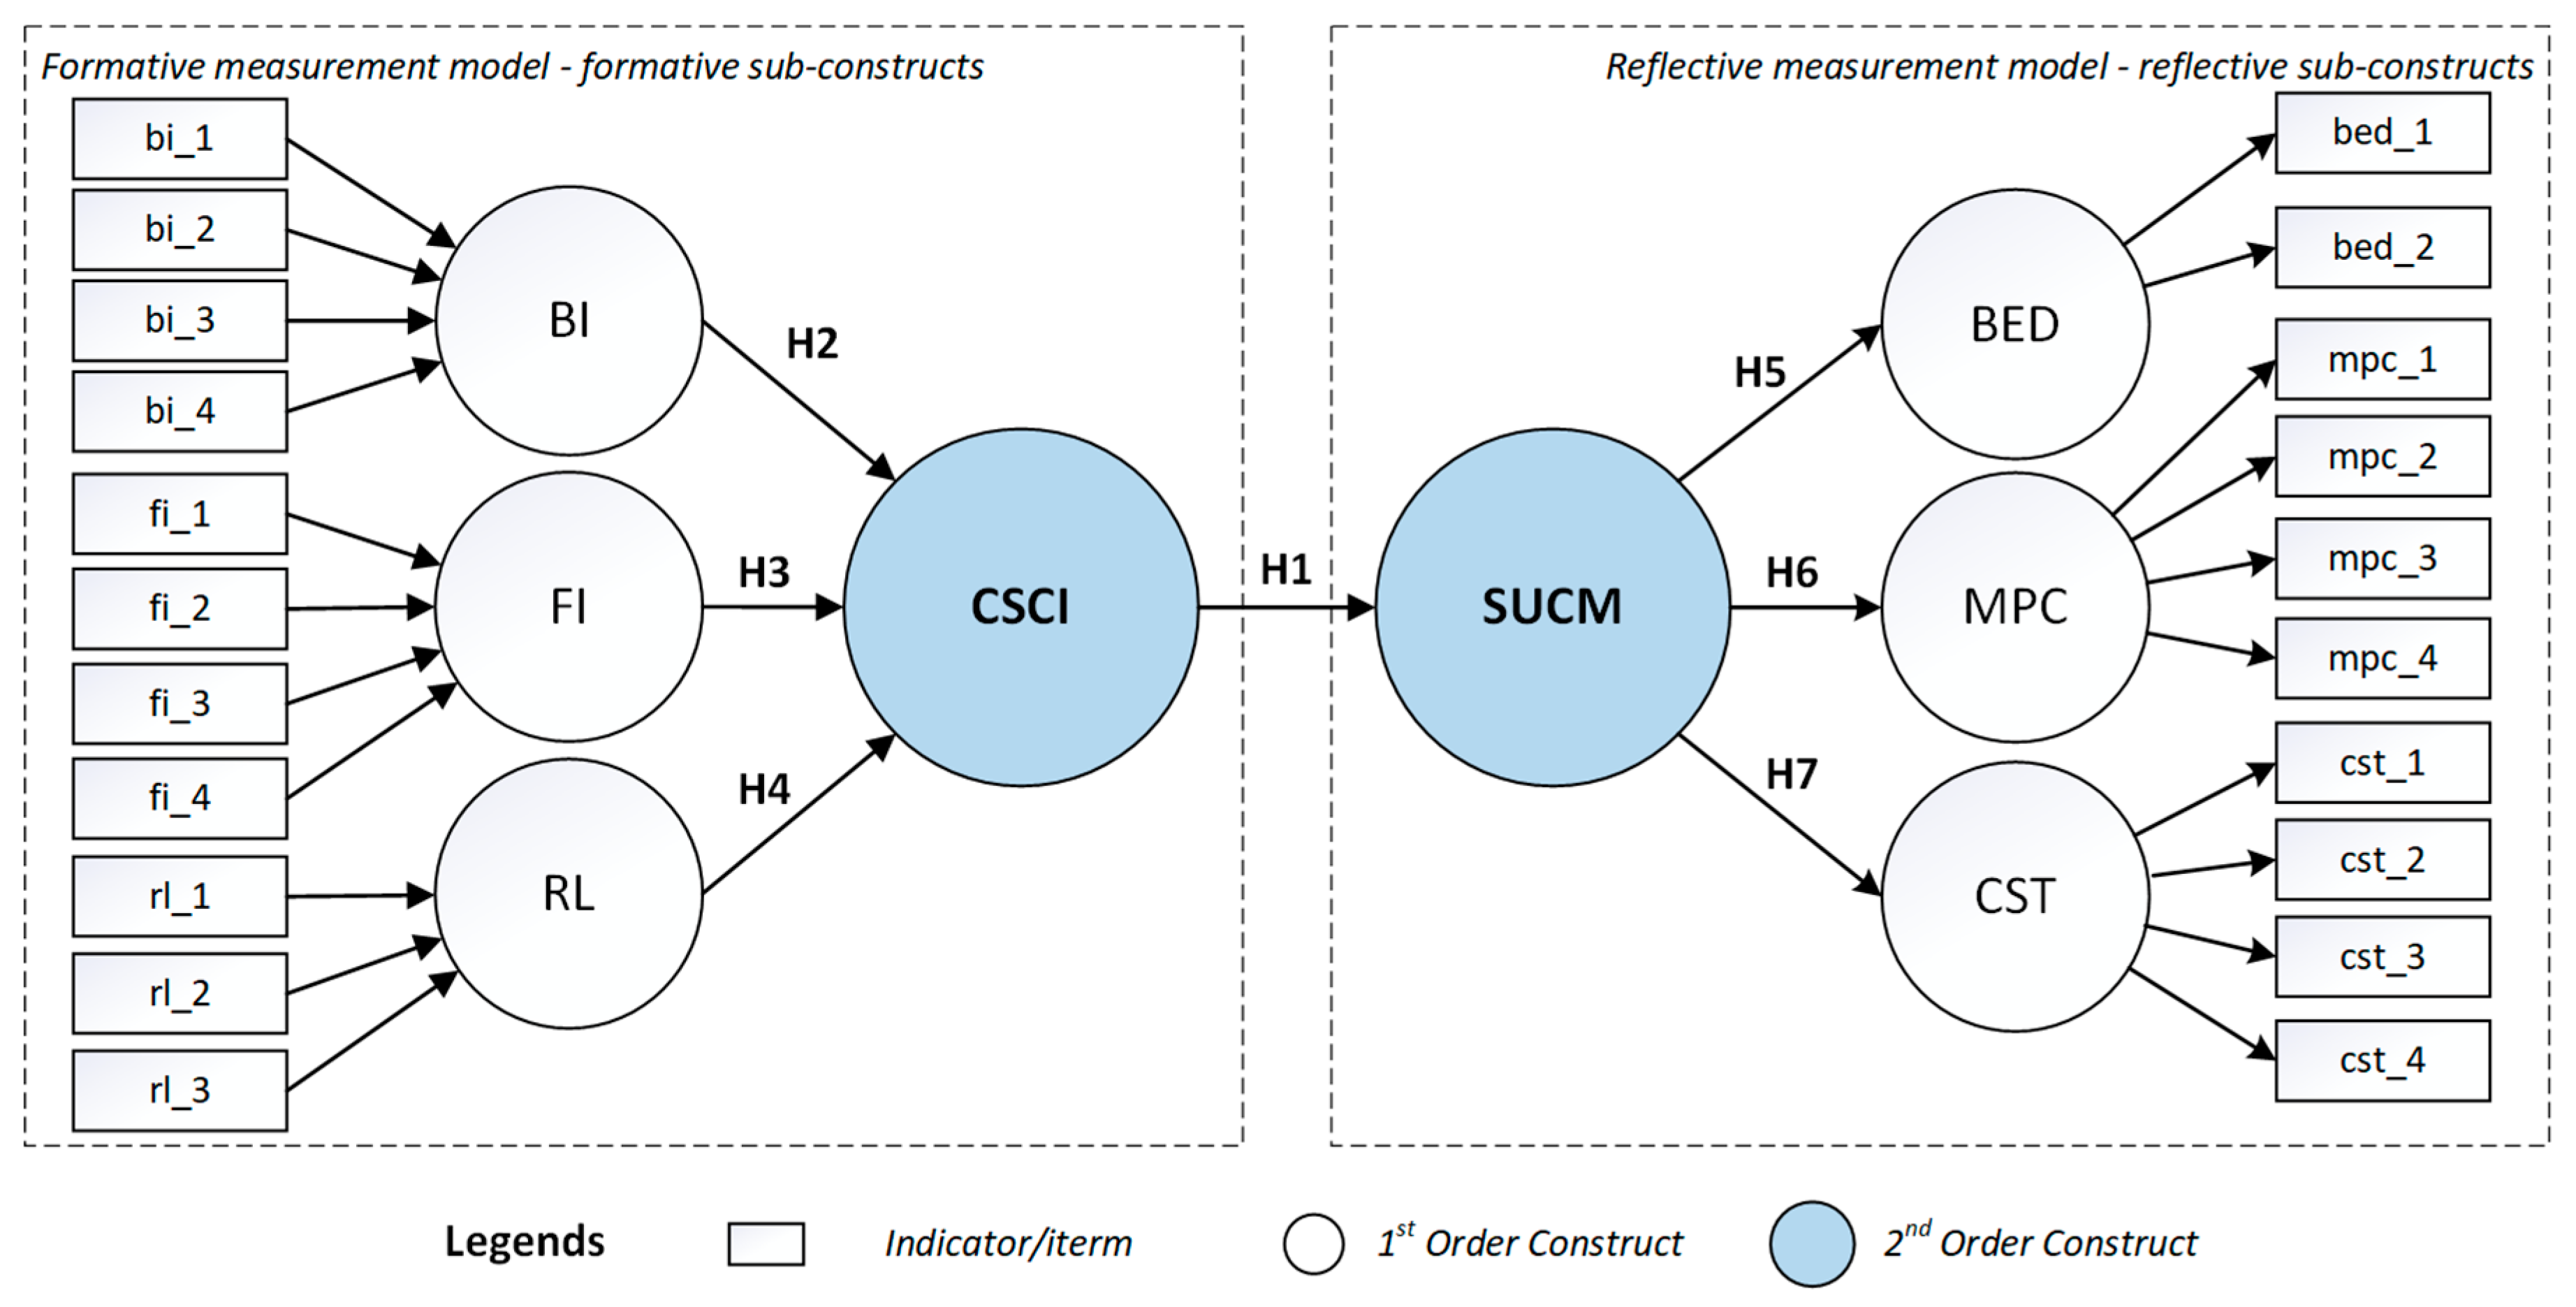
3. Hypothesis Development

According to the literature review, an initial research conceptual framework is presented in Figure 1. CSCI represents a capability that can be leveraged as a source of sustainable performance in construction material extraction, production, consumption, and waste treatment.
It is difficult to directly investigate and measure CSCI and SUCM. Therefore, this paper treats them as the second order (higher order) latent constructs in the research model. The first order (lower order) constructs are summarized and extracted from the literature in Section 2, and they are sub-constructs of these two second-order constructs. Meanwhile, practical experiences are considered through interviews during the research model development. The construct definition is described in Table 3, including the higher order latent constructs and their sub-constructs.
As shown in Figure 2, the exogenous variable CSCI is considered as a higher order construct with three formative sub-constructs—i.e., BI, FI, and RL—which are measured by a series of formative observable variables. SUCM is treated as an endogenous variable, also as a higher order construct with three reflective sub-constructs—i.e., BED, MPC, and CST—which are measured by reflective observable variables.
According to the research framework and research model, the hypothesis about higher-order constructs that SUCM is positively correlated with CSCI is proposed as H1. Meanwhile, there are a series of hypotheses, i.e., H2 to H7 between the first order constructs and their higher-order construct. The following set of hypotheses (labeled as H1–H7) is proposed:
  • Hypothesis 1 (H1).High degree of the construction supply chain integration is likely to improve sustainable use of construction materials.
  • Hypothesis 2 (H2).High degree of the backward integration is likely to enhance construction supply chain integration.
  • Hypothesis 3 (H3).High degree of the forward integration is likely to enhance construction supply chain integration.
  • Hypothesis 4 (H4).High degree of the reverse logistics application is likely to enhance construction supply chain integration.
  • Hypothesis 5 (H5).The sustainable use of construction material is positively associated with BMCC environmental design.
  • Hypothesis 6 (H6).The sustainable use of construction material is positively associated with material procurement and consumption.
  • Hypothesis 7 (H7).The sustainable use of construction material is positively associated with C&D waste sustainable treatment.

4. Method

In this research, a five-step approach to questionnaire instrument development and data collection is employed:
  • Initial questionnaire design: a questionnaire with 25 questions was designed for data collection according to the literature. In the questionnaire, the first three questions were designed to exclude invalid data provided by respondents without sufficient expertise.
  • Interview for questionnaire improvement: the content was validated by interviewing five project managers with over five years of experience from three owner organizations and two contractors. They were invited to modify items in the scale that were unclear or incorrectly expressed.
  • Pre-test for questionnaire improvement: a pre-test with 39 valid samples was conducted.
  • Formal questionnaire survey: After the interview for questionnaire improvement and pre-test, two questions about CSCI in the questionnaire were substantially modified and combined into one question. Consequently, in the initial research model, observable variables bi_2 and bi_3 were altered into one observable variable as off-site process monitoring, as shown in Table 4. The modified questionnaire includes 24 questions. A formal questionnaire survey was conducted to collect a larger sample.
  • Interviews were carried out alongside the model evaluation.
A five-point Likert type scale [63] was adopted to measure variables associated with proposed constructs. Respondents were asked to state their agreement with a given statement on a scale that ranges from ‘strongly disagree’ (score 1) to ‘strongly agree’ (score 5) with its midpoint, i.e., score 3 anchored as ‘uncertain, neither agree nor disagree’, and score 2 and 4 respectively represent ‘uncertain, but probably disagree’ and ‘uncertain, but probably agree’. Respondents were asked to consider the focal construction organization’s primary material(s) or material flow(s) while responding to the questions on these constructs.
Data of the formal investigation were collected by an online questionnaire survey conducted in China. The data collection process occurred between 15 May and 10 August 2018. The initial contacts came from leading players in the Chinese construction market, including real estate developers such as China Overseas Land & Investment Limited, Vanke and Jiangsu Future Land, and contractors such as China State Construction Engineering Corporation and Sinohydro. Then a snowball sampling technique was used for contact names at other candidate firms. In total 102 questionnaires with a 34% response rate were returned and collected. Target respondents for the survey were considered to be professionals with basic understanding and relevant work experience of supply chain management and sustainable construction in their projects. Twelve respondents replied that they did not have the related experience or basic knowledge, so their returned questionnaires were removed from our sample. Besides, 20 returned questionnaires were excluded because of unqualified data. The final list consisted of 70 valid respondents. The details of the respondents are shown in Table 5.
The PLS-SEM was undertaken to validate the research model, using the SmartPLS software package [64]. We selected this method because it is able to cope with the small sample size and suitable for explorative studies [21].

5. Results

5.1. Measurement Model Evaluation

PLS-SEM develops a series of empirical test criteria to evaluate the reflective and formative measurement model respectively [21,65]. In this research model, all the first order constructs of CSCI—i.e., BI, FI, RL, and CSCI itself—belong to the formative constructs. Table 6 shows the formative measurement model evaluation results.
As shown in Table 6, the absolute indicator contribution to the constructs, i.e., indicator’s weights, and their significance levels are given. Only the indicator weight of bi_1 to BI is nonsignificant. Other indicators’ weights are significant. Another important criterion is the indicator’s variance inflation factor (VIF), and the rule of thumb of VIF is lower than 5 generally or lower than 3.3 for the formative indicator [21]. In the measurement model, all the formative indicators’ VIF values are lower than 3.3, which means strictly satisfying the requirement of multicollinearity.
Meanwhile, an evaluation of the reflective indicators in the research model is required. For the reflective measurement model, the indicator reliability, internal consistency reliability, convergent validity, and discriminant validity should be evaluated [21,66]. All the first order constructs of SUCM—i.e., BED, MPC, CST, and SUCM itself—belong to the reflective constructs. Table 7 provides the evaluation results of the indicator reliability, internal consistency reliability, and convergent validity.
The indicator reliability can be evaluated by the factor loadings, which are empirically suggested to be more than 0.7 [21]. In the exploratory research, an acceptable minimum value of factor loading is 0.60 to 0.70. In the reflective measurement model, in total four indicators’ loadings are lower than 0.6. For the internal consistency reliability, Cronbach’s α represents the most conservative criterion while CR is a more liberal one. Cronbach’s α values are required higher than 0.7, and CR values of 0.60 to 0.70 in the exploratory research are regarded as satisfactory [21,67]. All the reflective indicators represent good internal consistency reliability. The average variance extracted (AVE) of measured constructs are assessed for convergent validity [68,69], and the acceptable minimum value of AVE is 0.36 to 0.5 [21,68,70]. All the reflective indicators represent a good convergent validity. In conclusion, the formative measurement model has qualified internal consistency reliability and convergent validity, but four indicators failed to show the indicator reliability.
In addition, the Fornell–Larcker criterion [68] and cross-loadings are suggested as two main measures to evaluate the discriminant validity of reflective indicators [21]. Table 8 and Table 9 shows the results of the discriminant validity evaluation.
As shown in Table 9, the square root of each latent construct’s AVE should be higher than its highest correlation with other latent constructs [21,67]. Meanwhile, an indicator loading with its associated latent construct should be higher than its loadings with all the remaining constructs [21,67] (see Table 8). In conclusion, the formative measurement model has qualified discriminant validity.

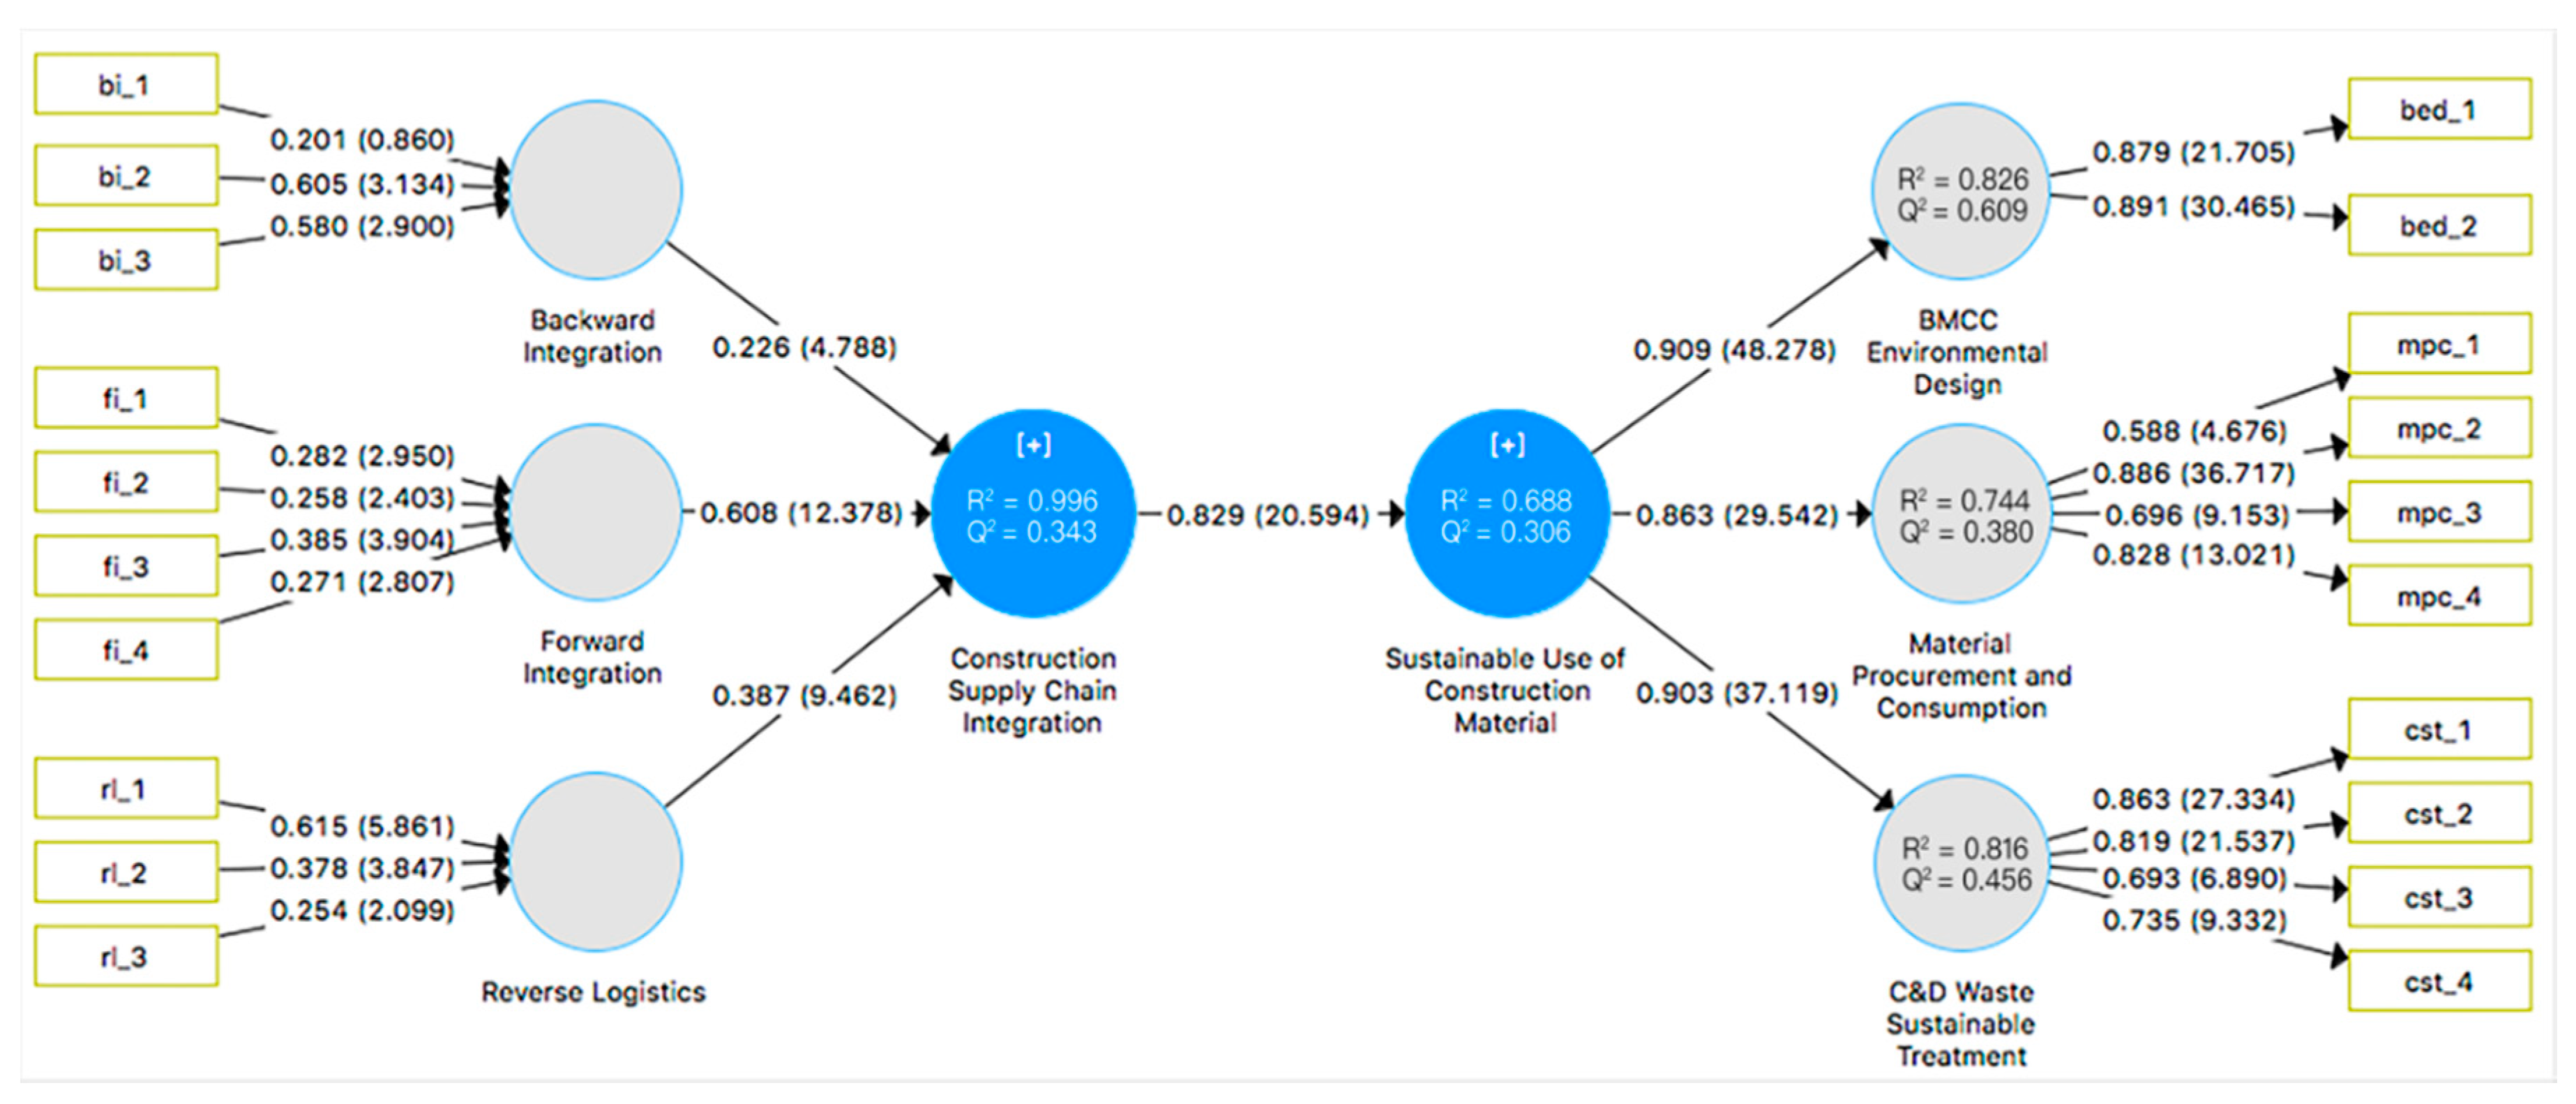
5.2. Structural Model Evaluation

To estimate the significance of path coefficients and test the hypotheses, a bootstrapping using 5000 bootstrap subsamples is conducted in SmartPLS. The path coefficients, the significance of path coefficients, the coefficient of determination (R2) and its effect size f2, cross-validated redundancy (Q2) are given in Table 10.
All the path coefficients are significant (p < 0.001) with t-values larger than 2.58 (see Figure 3). The R2 value of CSCI is nearly 1.00 because it is a higher order construct, and other constructs’ R2 values are acceptable according to the rule of thumb with a minimum value of 0.50. The effect size f² is also given to assess how strongly one exogenous construct contributes to explaining a certain endogenous construct regarding R2 [71]. Q2 values are suggested from 0.02, 0.15, and 0.35 respectively representing weak, moderate, and strong effect level of predictive relevance [72], and most of the constructs have enough effect of predictive relevance for this exploratory study.
As shown in Table 11, the hypothesis H1 about higher order constructs that SUCM is positively correlated with CSCI in construction projects is supported (β = 0.829, p < 0.001, R2 =0.688). As formative components of CSCI, high degree of BI (β = 0.226, p < 0.001), FI (β = 0.608, p < 0.001), and RL (β = 0.387, p < 0.001) are likely to enhance CSCI. However, not all the measurement model evaluation criteria of BI are satisfied, and H2 is thus loosely supported. As reflective sub-constructs of SUCM, BED (β = 0.909, p < 0.001), MPC (β = 0.863, p < 0.001), and CST (β = 0.903, p < 0.001) are positively associated with SUCM. The measurement model evaluation of MPC’ indicators reports unqualified loading value, therefore, H6 is loosely supported.

6. Discussion and Implications

According to PLS-SEM reporting results, most of the statistical indicators were found to be acceptable, which validated the hypotheses developed in the study. The research model results suggested that the construction supply chain integration has an obvious positive correlation with sustainable use of construction material. The results also represented that FI has a significant correlation with its higher-order construct, i.e., CSCI. BED, MPC, and CST are also highly correlated with SUCM.

6.1. Stakeholder-Driven Integration and Sustainability

Though SUCM significantly correlates with CSCI, BI and RL have not shown their greater potential than FI to enhance the degree of integration. Forward integration is mainly driven by project stakeholders, while backward integration and reverse logistics are objectively about material flows, which stakeholders may do not pay attention. The stakeholder’s ideas actively lead the project implementation rather than the demands of the whole supply chain. Regarding improving sustainability in construction by reaching a higher degree of supply chain integration, the most crucial task is to cultivate a positive attitude of project stakeholders towards supply chain backward integration and reverse logistics [73,74].
Among the formative indicators of BI and RL, off-site process monitoring (bi_2), transfer partial on-site activities into off-site (bi_3), and purchase permit of recycled materials (rl_1) received high indicator weights (0.605, 0.580, 0.615). Stakeholders’ decisions can influence if the off-site process should be adequately monitored [75] and if pre-fabrication is adopted in the project [76]. The purchase permit of recycled materials may be issued by the industry alliance or the government, but project stakeholders also have a strong voice. Therefore, project stakeholders should understand the contribution of supply chain integration to the sustainability in the construction field, and further develop strategies to support backward integration and reverse logistics.
As a new concept [27], supply chain integration can enhance the implementation of strategies such as the construction industrialization. This can be further accelerated by stakeholders. It adds to the body of knowledge of stakeholder management for sustainability.

6.2. Supply Chain Integration for Early Environmental Design

BED had the highest factor loading (0.909) on its higher order construct, i.e., SUCM. This finding is supported by the literature [1,77], indicating that effective communications among designers, clients, environmental professionals, and relevant governmental staff to ensure all environmental requirements are critical for a life cycle design. However, external team members—e.g., suppliers and sub-contractors—should also involve in the environmental design. For example, EU developed the environmental product declarations as a strategy adopted for external communication and it is committed to reducing the environmental impact of a product [55].
From a collaborative perspective, environmental targets early setting (bed_2, loading = 0.891) requires early involvement of suppliers, and opinions from designers and environmental professionals are beneficial to suppliers’ product and business strategy development. Observing the industrial chain structure of the project, from the architecture and engineering design to construction and from material supply to construction are most of time independent paths [78]. However, for the engineer-to-order products—e.g., curtain wall—the engineering design, and material design are highly correlated [79]. It would be a good entry point for early environmental design.
These findings will have a significant impact on how construction companies and suppliers manage their relationship in the front end project management. Their interaction in the early stages can greatly improve the sustainable use of material performance.

6.3. C&D Waste Treatment and Reverse Logistics

Compared with BED, CST also received high factor loading as 0.903. Previous research pointed out that C&D waste problem was serious in construction projects [2]. Efforts have been made to conduct C&D waste management mainly from two aspects. One is improving awareness in the industry by developing policies and regulations [2,7], and another is establishing channels to reuse and recycle waste, e.g., reverse logistics [48]. Purchase permit of recycled materials (rl_1) had the highest weight (0.615) among indicators of reverse logistics. It is clear that increased levels of reverse logistics can improve C&D. According to the interview results, it is important for both the construction of MPC and CST. Project stakeholders and the government have a positive attitude to adopt qualified recycled materials, but the recycle channels are now well established yet [80]. A series of top-down policies may be required in the future, and supply chain integration can also play an essential role in the progress.

7. Conclusions

To examine relationships between the construction supply chain integration and sustainable use of construction materials, an empirical investigation was conducted. An exploratory research model with eight latent constructs was designed through a comprehensive literature review and evaluated by PLS-SEM. Results supported the hypothesis that the construction supply chain integration had a positive correlation with the sustainable use of construction materials. This finding confirms that it is indeed worth investing in construction supply chain integration for sustainability.
The nature of the construction supply chain is argued as a significant barrier to implementing supply chain strategies for construction material and waste management [16], e.g., the downstream is unobvious and upstream material flows are often invisible. Analysis results showed that construction supply chain integration could be decomposed into backward integration, forward integration, and reverse logistics, which have different features and are suitable to adopt respective strategies. At the current stage, a project stakeholder-driven forward integration is important according to the analysis results, and the backward integration and reverse logistics requires more efforts from external participants besides project stakeholders. Our research has implications for both on-site and off-site management.
Analysis results also showed that BMCC environmental design, material procurement, and consumption, and C&D waste sustainable treatment are critical indicators of the sustainable use of construction materials. According to the path coefficients and factor loadings, the factor of setting environmental targets early and adoption of sustainable/green material are essential. An integrated construction supply chain can make a contribution to these two aspects. Combining the PLS-SEM outcomes and interview results, the reverse logistics is a valuable approach to improve C&D waste sustainable management. The influence on the sustainable use of material from construction supply chain integration requires the consistent involvement of both project stakeholders and relevant construction supply chain participants.
This paper represents an exploratory research outcome, which is limited to the sample size. Efforts have been made in designing and revisioning questionnaires, collecting feedback from interviewees, and evaluating the structural model strictly to explore these proposed hypotheses. However, more data and a more significant sample will be collected for the future research. For the initial model regarding the sustainability in construction, more issues should be considered in the next step research work. For example, the transportation factor plays a role in the supply chain, and energy consumption is also an essential factor for the sustainability.

Author Contributions

N.Z. and Y.L. contributed to the research concepts, methods, investigation, data collection, formal analysis, manuscript writing, and editing. C.M. and M.K. provided the investigation support and research advice. All authors were involved in the preparation and validation of the manuscript.

Funding

This study is supported by Chongqing University through the Special Social Science Research Program of the Central Universities Fundamental Research Foundation (grant no. 2017CDJSK03XK14), and by Chongqing Science & Technology Commission through the funding of technology innovation and application program (grant no. cstc2018jscx-msybX0311).

Acknowledgments

The authors are grateful to the editors and four anonymous reviewers for their comments throughout the review process. The authors would like to thank all the respondents who have contributed to the survey.

Conflicts of Interest

The authors declare no conflict of interest.

References

  1. Khasreen, M.M.; Banfill, P.F.G.G.; Menzies, G.F. Life-cycle assessment and the environmental impact of buildings: A review. Sustainability 2009, 1, 674–701. [Google Scholar] [CrossRef] [Green Version]
  2. Tam, V.W.Y. Comparing the implementation of concrete recycling in the Australian and Japanese construction industries. J. Clean. Prod. 2009, 17, 688–702. [Google Scholar] [CrossRef]
  3. Durdyev, S.; Zavadskas, E.K.; Thurnell, D.; Banaitis, A.; Ihtiyar, A. Sustainable construction industry in Cambodia: Awareness, drivers and barriers. Sustainability 2018, 10, 1–19. [Google Scholar] [CrossRef]
  4. Serpell, A.; Kort, J.; Vera, S. Awareness, actions, drivers and barriers of sustainable construction in Chile. Technol. Econ. Dev. Econ. 2013, 19, 272–288. [Google Scholar] [CrossRef]
  5. Peng, C. Calculation of a building’s life cycle carbon emissions based on Ecotect and building information modeling. J. Clean. Prod. 2016, 112, 453–465. [Google Scholar] [CrossRef]
  6. Kisku, N.; Joshi, H.; Ansari, M.; Panda, S.K.; Nayak, S.; Dutta, S.C. A critical review and assessment for usage of recycled aggregate as sustainable construction material. Constr. Build. Mater. 2017, 131, 721–740. [Google Scholar] [CrossRef]
  7. Kylili, A.; Fokaides, P.A. Policy trends for the sustainability assessment of construction materials: A review. Sustain. Cities Soc. 2017, 35, 280–288. [Google Scholar] [CrossRef]
  8. Gan, X.; Zuo, J.; Ye, K.; Skitmore, M.; Xiong, B. Why sustainable construction? Why not? An owner’s perspective. Habitat Int. 2015, 47, 61–68. [Google Scholar] [CrossRef]
  9. Li, H.; Zhang, X.; Ng, S.T.; Skitmore, M. Quantifying stakeholder influence in decision/evaluations relating to sustainable construction in China—A Delphi approach. J. Clean. Prod. 2018, 173, 160–170. [Google Scholar] [CrossRef]
  10. Wang, T.; Wang, J.; Wu, P.; Wang, J.; He, Q.; Wang, X. Estimating the environmental costs and benefits of demolition waste using life cycle assessment and willingness-to-pay: A case study in Shenzhen. J. Clean. Prod. 2018. [Google Scholar] [CrossRef]
  11. Zhang, Z.; Wang, B. Research on the life-cycle CO2emission of China’s construction sector. Energy Build. 2016, 112, 244–255. [Google Scholar] [CrossRef]
  12. Solís-Guzmán, J.; Marrero, M.; Montes-Delgado, M.V.; Ramírez-de-Arellano, A. A Spanish model for quantification and management of construction waste. Waste Manag. 2009, 29, 2542–2548. [Google Scholar] [CrossRef] [PubMed]
  13. Balasubramanian, S. A Hierarchical Framework of Barriers to Green Supply Chain Management in the Construction Sector. J. Sustain. Dev. 2012, 5, 15–27. [Google Scholar] [CrossRef]
  14. Bankvall, L.; Bygballe, L.E.; Dubois, A.; Jahre, M. Interdependence in supply chains and projects in construction. Supply Chain Manag. Int. J. 2010, 15, 385–393. [Google Scholar] [CrossRef]
  15. Kache, F.; Seuring, S. Linking collaboration and integration to risk and performance in supply chains via a review of literature reviews. Supply Chain Manag. Int. J. 2014, 19, 664–682. [Google Scholar] [CrossRef]
  16. Childerhouse, P.; Lewis, J.; Naim, M.; Towill, D.R. Re-engineering a construction supply chain: A material flow control approach. Supply Chain Manag. Int. J. 2003, 8, 395–406. [Google Scholar] [CrossRef]
  17. Dubois, A.; Gadde, L.-E. The construction industry as a loosely coupled system: Implications for productivity and innovation. Constr. Manag. Econ. 2002, 20, 621–631. [Google Scholar] [CrossRef]
  18. Chileshe, N.; Rameezdeen, R.; Hosseini, M.R.; Lehmann, S. Barriers to implementing reverse logistics in South Australian construction organisations. Supply Chain Manag. Int. J. 2015, 20, 179–204. [Google Scholar] [CrossRef]
  19. Bentler, P.M. Multivariate analysis with latent variables: causal modeling. Ann. Rev. Psychol. 1980, 31, 419–456. [Google Scholar] [CrossRef]
  20. Bagozzi, R.P.; Yi, Y. On the evaluation of structural equation models. J. Acad. Mark. Sci. 1988, 16, 74–94. [Google Scholar] [CrossRef]
  21. Hair, J.F.; Ringle, C.M.; Sarstedt, M. PLS-SEM: Indeed a Silver Bullet. J. Mark. Theory Pract. 2011, 19, 139–152. [Google Scholar] [CrossRef]
  22. Chin, W.W.; Peterson, R.A.; Brown, S.P. Structural Equation Modeling in Marketing: Some Practical Reminders. J. Mark. Theory Pract. 2008, 16, 287–298. [Google Scholar] [CrossRef]
  23. Dijkstra, T.K. Latent Variables and Indices: Herman Wold’s Basic Design and Partial Least Squares. In Handbook of Partial Least Squares; Springer: Heidelberg, Germany, 2010; pp. 23–46. ISBN1 978-3-540-32825-4. ISBN2 978-3-540-32827-8. [Google Scholar]
  24. Cerchione, S.; Cerchione, R.; Singh, R.; Centobelli, P.; Shabani, A. Food cold chain management: From a structured literature review to a conceptual framework and research agenda. Int. J. Logist. Manag. 2018, 29, 792–821. [Google Scholar] [CrossRef]
  25. Seuring, S.; Müller, M. From a literature review to a conceptual framework for sustainable supply chain management. J. Clean. Prod. 2008. [Google Scholar] [CrossRef]
  26. Harrigan, K.R. Matching vertical integration strategies to competitive conditions. Strateg. Manag. J. 1986, 7, 535–555. [Google Scholar] [CrossRef]
  27. Vickery, S.K.; Jayaram, J.; Droge, C.; Calantone, R. The effects of an integrative supply chain strategy on customer service and financial performance: An analysis of direct versus indirect relationships. J. Oper. Manag. 2003, 21, 523–539. [Google Scholar] [CrossRef]
  28. Hill, C.W.L.; Jones, G.R.; Schilling, M.A. Strategic Management: Theory: An Integrated Approach; Cengage Learning: Boston, MA, USA, 2014; ISBN 10-1285184491. [Google Scholar]
  29. David, F.R. Strategic Management: Concepts and Cases; Peaeson/Prentice Hall: Upper Saddle River, NJ, USA, 2011; ISBN 0136120989. [Google Scholar]
  30. Koolwijk, J.S.J.; Van Oel, C.J.; Wamelink, J.W.F.; Vrijhoef, R. Collaboration and Integration in Project-Based Supply Chains in the Construction Industry. J. Manag. Eng. 2018, 34, 4018001. [Google Scholar] [CrossRef]
  31. Doran, D.; Giannakis, M. An examination of a modular supply chain: a construction sector perspective. Supply Chain Manag. Int. J. 2011, 16, 260–270. [Google Scholar] [CrossRef]
  32. Flynn, B.B.; Huo, B.; Zhao, X. The impact of supply chain integration on performance: A contingency and configuration approach. J. Oper. Manag. 2010, 28, 58–71. [Google Scholar] [CrossRef]
  33. Marquez, A.C.; Bianchi, C.; Gupta, J.N.D. Operational and financial effectiveness of e-collaboration tools in supply chain integration. Eur. J. Oper. Res. 2004, 159, 348–363. [Google Scholar] [CrossRef]
  34. Rosenzweig, E.D.; Roth, A.V.; Dean, J.W. The influence of an integration strategy on competitive capabilities and business performance: An exploratory study of consumer products manufacturers. J. Oper. Manag. 2003, 21, 437–456. [Google Scholar] [CrossRef]
  35. Zhao, X.; Huo, B.; Selen, W.; Yeung, J.H.Y. The impact of internal integration and relationship commitment on external integration. J. Oper. Manag. 2011, 29, 17–32. [Google Scholar] [CrossRef]
  36. Rai, A.; Patnayakuni, R.; Seth, N. Firm Performance Impacts of Digitally Enabled Supply Chain Integration Capabilities. MIS Q. 2006, 30, 225. [Google Scholar] [CrossRef] [Green Version]
  37. Ataseven, C.; Nair, A. Assessment of supply chain integration and performance relationships: A meta-analytic investigation of the literature. Int. J. Prod. Econ. 2017, 185, 252–265. [Google Scholar] [CrossRef]
  38. Prajogo, D.; Olhager, J. Supply chain integration and performance: The effects of long-term relationships, information technology and sharing, and logistics integration. Int. J. Prod. Econ. 2012, 135, 514–522. [Google Scholar] [CrossRef]
  39. Mentzer, J.T.; Keebler, J.S.; Nix, N.W.; Smith, C.D.; Zacharia, Z.G. Defining Supply Chain Management. J. Bus. Logist. 2001, 22, 1–25. [Google Scholar] [CrossRef]
  40. Lin, Y.T.; Parlaktürk, A.K.; Swaminathan, J.M. Vertical integration under competition: Forward, backward, or no Integration? Prod. Oper. Manag. 2014, 23, 19–35. [Google Scholar] [CrossRef]
  41. Vrijhoef, R.; Koskela, L. The four roles of supply chain management in construction. Eur. J. Purch. Supply Manag. 2000, 6, 169–178. [Google Scholar] [CrossRef] [Green Version]
  42. Sacks, R. What constitutes good production flow in construction? Constr. Manag. Econ. 2016, 34, 641–656. [Google Scholar] [CrossRef]
  43. Love, P.E.D.; Edwards, D.J. A seamless supply chain management model for construction. Supply Chain Manag. Int. J. 2004, 9, 43–56. [Google Scholar] [CrossRef]
  44. Segerstedt, A.; Olofsson, T. Supply chains in the construction industry. Supply Chain Manag. Int. J. 2010, 15, 347–353. [Google Scholar] [CrossRef]
  45. Chen, A. China’s urban housing: privatization and market integration. In Urbanization and Social Welfare in China; Routledge: Abingdon, UK, 2018; pp. 77–100. [Google Scholar]
  46. Chiu, R.L.H. Planning, land and affordable housing in Hong Kong. Hous. Stud. 2007, 22, 63–81. [Google Scholar] [CrossRef]
  47. OHern, M.S.; Rindfleisch, A. Customer Co-Creation. In Review of Marketing Research; Emerald Group Publishing Limited: Bingley, UK, 2010; pp. 84–106. ISBN 978-0-7656-2127-6. [Google Scholar]
  48. Hosseini, M.R.; Rameezdeen, R.; Chileshe, N.; Lehmann, S. Reverse logistics in the construction industry. Waste Manag. Res. 2015, 33, 499–514. [Google Scholar] [CrossRef] [PubMed] [Green Version]
  49. Klein, S.; Frazier, G.L.; Roth, V.J. A Transaction Cost Analysis Model of Channel Integration in International Markets. J. Mark. Res. 1990. [Google Scholar] [CrossRef]
  50. Kuhlman, T.; Farrington, J. What is sustainability? Sustainability 2010, 2, 3436–3448. [Google Scholar] [CrossRef]
  51. Cabeza, L.F.; Rincón, L.; Vilariño, V.; Pérez, G.; Castell, A. Life cycle assessment (LCA) and life cycle energy analysis (LCEA) of buildings and the building sector: A review. Renew. Sustain. Energy Rev. 2014, 29, 394–416. [Google Scholar] [CrossRef]
  52. Seco, A.; Omer, J.; Marcelino, S.; Espuelas, S.; Prieto, E. Sustainable unfired bricks manufacturing from construction and demolition wastes. Constr. Build. Mater. 2018, 167, 154–165. [Google Scholar] [CrossRef]
  53. Ramesh, T.; Prakash, R.; Shukla, K.K. Life cycle energy analysis of buildings: An overview. Energy Build. 2010, 42, 1592–1600. [Google Scholar] [CrossRef]
  54. Buyle, M.; Braet, J.; Audenaert, A. Life cycle assessment in the construction sector: A review. Renew. Sustain. Energy Rev. 2013, 26, 379–388. [Google Scholar] [CrossRef]
  55. Ortiz, O.; Castells, F.; Sonnemann, G. Sustainability in the construction industry: A review of recent developments based on LCA. Constr. Build. Mater. 2009, 23, 28–39. [Google Scholar] [CrossRef]
  56. Shen, L.Y.; Hao, J.L.; Wing, V.; Tam, Y.; Yao, H. A checklist for assessing sustainability performance of construction projects. J. Civ. Eng. Manag. 2007, 13, 273–281. [Google Scholar] [CrossRef]
  57. Harris, D.J. A quantitative approach to the assessment of the environmental impact of building materials. PERGAMON Build. Environ. 1999, 34, 75–758. [Google Scholar] [CrossRef]
  58. Edum-Fotwe, F.T.; Price, A.D.F. A social ontology for appraising sustainability of construction projects and developments. Int. J. Proj. Manag. 2009, 27, 313–322. [Google Scholar] [CrossRef]
  59. Berardi, U. Sustainability assessment in the construction sector: Rating systems and rated buildings. Sustain. Dev. 2012, 20, 411–424. [Google Scholar] [CrossRef]
  60. Gilbert Silvius, A.J.; Kampinga, M.; Paniagua, S.; Mooi, H. Considering sustainability in project management decision making; An investigation using Q-methodology. Int. J. Proj. Manag. 2017, 35, 1133–1150. [Google Scholar] [CrossRef]
  61. Vazquez, E.; Rola, S.; Martins, D.; Alves, L.; Freitas, M.; Rosa, L.P. Sustainability in civil construction: Application of an environmental certification process (leed) during the construction phase of a hospital enterprise-rio de janeiro/Brazil. Int. J. Sustain. Dev. Plan. 2013, 8, 1–19. [Google Scholar] [CrossRef]
  62. Gámez-García, D.C.; Gómez-Soberón, J.M.; Corral-Higuera, R.; Saldaña-Márquez, H.; Gómez-Soberón, M.C.; Arredondo-Rea, S.P. A cradle to handover life cycle assessment of external walls: Choice of materials and prognosis of elements. Sustainability 2018, 10, 2748. [Google Scholar] [CrossRef]
  63. Allen, I.E.; Seaman, C.A. Likert scales and data analyses. Qual. Prog. 2007, 40, 64. [Google Scholar]
  64. Ringle, C.M.; Wende, S.; Will, A. SmartPLS (Release 2.0 M3). University of Hamburg, Hamburg, 2005. Available online: http://www.smartpls.de (accessed on 15 August 2018).
  65. Ringle, C.M.; Sarstedt, M.; Straub, D. A critical look at the use of PLS-SEM in MIS Quarterly. MIS Q. 2012, 36, iii–xiv. [Google Scholar] [CrossRef]
  66. Bagozzi, R.P.; Yi, Y. Specification, evaluation, and interpretation of structural equation models. J. Acad. Mark. Sci. 2012, 40, 8–34. [Google Scholar] [CrossRef]
  67. Ringle, C.M.; Sarstedt, M.; Mitchell, R.; Gudergan, S.P. Partial least squares structural equation modeling in HRM research. Int. J. Hum. Resour. Manag. 2018, 5192, 1–27. [Google Scholar] [CrossRef]
  68. Fornell, C.; Larcker, D.F. Evaluating structural equation models with unobservable variables and measurement error. J. Mark. Res. 1981, 18, 39–50. [Google Scholar] [CrossRef]
  69. Comrey, A.L. A First Course in Factor Analysis; Psychology Press: London, UK, 1993; ISBN 1317844076. [Google Scholar]
  70. Hair, J.F.; Sarstedt, M.; Hopkins, L.; Kuppelwieser, V.G. Partial least squares structural equation modeling (PLS-SEM): An emerging tool in business research. Eur. Bus. Rev. 2014, 26, 106–121. [Google Scholar] [CrossRef]
  71. Cohen, J. Statistical Power Analysis for the Behavioral Sciences, 2nd ed.; Routledge: Abingdon, UK, 1988. [Google Scholar]
  72. Chin, W.W. How to write up and report PLS analyses. In Handbook of Partial Least Squares; Springer: Berlin, German, 2010; pp. 655–690. [Google Scholar]
  73. Lenferink, S.; Tillema, T.; Arts, J. The potential of a life-cycle approach for improving road infrastructure planning in the Netherlands. In Colloquium Vervoersplanologisch Speurwerk; CVS: Santpoort, The Netherlands, 2008. [Google Scholar]
  74. Álvarez-Gil, M.J.; Berrone, P.; Husillos, F.J.; Lado, N. Reverse logistics, stakeholders’ influence, organizational slack, and managers’ posture. J. Bus. Res. 2007. [Google Scholar] [CrossRef] [Green Version]
  75. Mao, C.; Shen, Q.; Pan, W.; Ye, K. Major Barriers to Off-Site Construction: The Developer’s Perspective in China. J. Manag. Eng. 2015. [Google Scholar] [CrossRef]
  76. Li, C.Z.; Hong, J.; Xue, F.; Shen, G.Q.; Xu, X.; Mok, M.K. Schedule risks in prefabrication housing production in Hong Kong: A social network analysis. J. Clean. Prod. 2016. [Google Scholar] [CrossRef]
  77. Butt, A.; Naaranoja, M.; Savolainen, J. Project change stakeholder communication. Int. J. Proj. Manag. 2016. [Google Scholar] [CrossRef]
  78. Baiden, B.K.; Price, A.D.F.; Dainty, A.R.J. The extent of team integration within construction projects. Int. J. Proj. Manag. 2006. [Google Scholar] [CrossRef]
  79. Gosling, J.; Naim, M.M. Engineer-to-order supply chain management: A literature review and research agenda. Int. J. Prod. Econ. 2009, 122, 741–754. [Google Scholar] [CrossRef]
  80. Simpson, D. Use of supply relationships to recycle secondary materials. Int. J. Prod. Res. 2010. [Google Scholar] [CrossRef]
Figure 1. Conceptual research framework.
Sustainability 10 03581 g001
Figure 2. Initial research model.
Sustainability 10 03581 g002
Figure 3. Testing results of the research model. Note: The label of a path represents the path coefficient/loading/weight and its significance level (t-value).
Sustainability 10 03581 g003
Table 1. Components of CSCI.
CodeForm/ItemReference
BIBackward integration[16,41]
bi_1Source control
bi_2Bring influence to the off-site process
bi_3Off-site process monitoring
bi_4Transfer partial on-site activities into off-site, e.g., prefabrication
FIForward integration[47,49]
fi_1Acceptance of ideas proposed by clients or end-users
fi_2Improvement based on ideas from clients or end-users
fi_3Joint decision-making
fi_4Joint decision-driven implementation
RLReverse logistics[18,48]
rl_1Purchase permit of recycled materials
rl_2Recycle C&D waste to the secondary market
rl_3Recycle C&D waste to the raw material market
Table 2. Factors of sustainable use of construction material from the literature.
CodeFactorReferencesSum
ABCDEFGHIJKLM
BEDBMCC environmental design
bed_1Alternative of non-renewable resources ×××××××× ××××12
bed_2Environmental targets early setting ××××××××××× 11
MPCMaterial procurement and consumption
mpc_1Accurate quantity estimation ×× ×× ××××8
mpc_2Adoption of sustainable/green material×××××××× ××××12
mpc_3Green procurement (e.g., GPP) ×××××××××× ×11
mpc_4Material using strategies ×× ×××××× ×××11
CSTC&D waste sustainable treatment
cst_1Recycling technology ×××××× ×××××11
cst_2Re-use of site-recycled BMCC ×× ××××× ××× 10
cst_3Approval of qualified recycled BMCC × × × ×× 5
cst_4Raw material extraction from demolition ×××× × ××× 8
Note: References are A [57], B [56], C [58], D [55], E [2], F [53], G [59], H [51], I [6], J [7], K [60], L [61] and M [62].
Table 3. Definition of research constructs.
ConstructCodeDefinition
Second OrderConstruction supply chain integrationCSCIThe degree to which a focal construction organization has integrated its upstream and downstream and reverse logistics partners along the supply chain.
First OrderBackward integration BIThe degree to which a focal construction organization takes measures with its upstream partners to guarantee and manage production, transportation, and construction activities.
Forward integration FIThe degree to which a focal construction organization takes measures with its downstream partners to access end-markets.
Reverse logistics RLThe extent of the material circulation from the point of consumption, i.e., construction sites to the point of origin, i.e., material markets and salvaged buildings.
Second OrderSustainable use of construction materialSUCMThe extent of improving the efficient use of construction materials, minimizing waste generation, and creating channels to transform waste into the material resource.
First OrderBMCC environmental design BEDThe extent of source control and materials optimization through design, to set up environmental targets and find alternatives to non-renewable resources.
Material procurement and consumptionMPCThe extent of process control and material using regulation, including accurate material quantity estimation, green procurement, and appropriate material use strategies.
C&D waste sustainable treatmentCSTThe extent of re-using and recycling construction and demolition waste with corresponding regulations, standards, and technologies.
Table 4. Adjusted measurement Items of CSCI.
CodeItemIntervieweeSumAdjustment
12345
BIBackward integration
bi_1Source control×× ××4
bi_2Bring influence to the off-site process 0Delete
bi_3Off-site process monitoring×××××5renumbered as bi_2
bi_4Transfer partial on-site activities into off-site, e.g., prefabrication×××××5renumbered as bi_3
FIForward integration
fi_1Acceptance of ideas proposed by clients or end-users××× ×4
fi_2Improvement based on ideas from clients or end-users×××××5
fi_3Joint decision-making× ×××4
fi_4Joint decision-driven implementation× ×××4
RLReverse logistics
rl_1Purchase permit of recycled materials× ×××4
rl_2Recycle C&D waste to the secondary market××× ×4
rl_3Recycle C&D waste to the raw material market×××××5
Table 5. Respondent details.
Personal AttributeCategorizationNumber of RespondentsPercentage (%)
Organization typeContractor2532.89
Owner3242.11
Material Supplier45.27
Consulting67.89
Designer911.84
Investment scale (RMB, the Chinese currency)<1 million45.26
1 million–10 million79.21
10 million–100 million810.53
100 million–1000 million2634.21
1000 million–10,000 million2431.58
>10,000 million79.21
Table 6. Evaluation of the formative measurement model.
ConstructIndicatorAbsolute Indicator ContributionSignificance of WeightMulticollinearity
WeightMeanStd Devt-ValueSignificanceVIF
BIbi_10.2010.1770.2390.839-1.195
bi_20.6050.5800.1923.156p < 0.011.207
bi_30.5800.5540.1992.919p < 0.011.042
FIfi_10.2820.2810.0952.959p < 0.011.847
fi_20.2580.2480.1072.406p < 0.052.338
fi_30.3850.3950.0983.913p < 0.0012.350
fi_40.2710.2660.0952.861p < 0.011.669
RLrl_10.6150.6090.1055.866p < 0.0011.317
rl_20.3780.3740.0983.866p < 0.0011.382
rl_30.2540.2560.1192.135p < 0.051.379
CSCIbi_10.0660.0640.0361.814p < 0.101.384
bi_20.1200.1160.0323.771p < 0.0011.430
bi_30.1190.1160.0274.476p < 0.0011.217
fi_10.1850.1830.0209.132p < 0.0012.200
fi_20.1870.1850.0219.043p < 0.0012.835
fi_30.1990.1970.02010.046p < 0.0012.781
fi_40.1640.1600.0217.742p < 0.0011.921
rl_10.1910.1890.0209.672p < 0.0011.739
rl_20.1640.1620.0208.176p < 0.0011.967
rl_30.1480.1480.0255.923p < 0.0011.739
Table 7. Evaluation of the reflective measurement model.
ConstructIndicatorIndicator ReliabilityInternal Consistency ReliabilityConvergent Validity
Loadingt-ValueSignificanceCronbach’s αCRAVE
BEDbed_10.87921.059p < 0.0010.7230.8780.783
bed_20.89129.857p < 0.001
MPCmpc_10.5884.657p < 0.0010.7460.8410.575
mpc_20.88635.494p < 0.001
mpc_30.6969.017p < 0.001
mpc_40.82813.256p < 0.001
CSTcst_10.86327.089p < 0.0010.7840.8610.609
cst_20.81922.001p < 0.001
cst_30.6936.964p < 0.001
cst_40.7359.152p < 0.001
SUCMbed_10.78515.543p < 0.0010.8820.9050.495
bed_20.82325.192p < 0.001
mpc_10.4903.548p < 0.001
mpc_20.75913.123p < 0.001
mpc_30.72311.763p < 0.001
mpc_40.5856.098p < 0.001
cst_10.79815.121p < 0.001
cst_20.76513.053p < 0.001
cst_30.5515.185p < 0.001
cst_40.6747.677p < 0.001
Table 8. Cross-loading analysis for discriminant validity evaluation.
IndicatorBIFIRLBEDMPCCST
bi_10.5280.2050.1170.0270.2700.141
bi_20.7890.2550.3430.3460.2810.416
bi_30.7200.2110.3450.4330.4090.346
fi_10.2670.8080.4280.5460.6800.430
fi_20.2770.8550.4590.5440.5320.476
fi_30.2510.8930.5460.5250.5800.519
fi_40.2750.7700.4140.4680.4500.377
rl_10.3520.5410.8800.5130.5510.591
rl_20.3210.3980.7540.5960.3450.623
rl_30.3670.3060.6860.5150.4260.507
bed_10.2880.5520.6440.8790.5430.718
bed_20.5300.5500.5460.8910.6850.673
mpc_10.3080.4050.3880.3690.5880.332
mpc_20.4030.6690.5680.6190.8860.516
mpc_30.3820.3690.4240.6150.6960.628
mpc_40.2830.5820.3380.4440.8280.287
cst_10.3370.4700.5480.7630.5080.863
cst_20.4290.4580.5800.6530.5550.819
cst_30.2440.3290.4950.4400.3030.693
cst_40.4780.4300.6540.5490.4850.735
Note: The own construct loadings (in bold) should be greater than cross-loadings.
Table 9. Fornell–Larcker criterion (latent variable correlations) for discriminant validity evaluation.
AVEBIFIRLBEDMPCCST
BIN.A.N.A.
FIN.A.0.318N.A.
RLN.A.0.4310.561N.A.
BED0.7830.4650.6230.6710.885 *
MPC0.5750.4610.6740.5770.6950.758 *
CST0.6090.4800.5460.7270.7850.6040.780 *
Note: * The square root of AVE; N.A. formative indicators’ AVE value not available.
Table 10. Structural model evaluation and key criteria.
PathPath CoefficientThe Significance of Path CoefficientCoefficient of DeterminationCross-Validated Redundancy
βMeanStd Devt-ValueSignificanceR2f2Q2
BI → CSCI0.2260.2180.0474.753p < 0.0010.9969.9410.343
FI → CSCI0.6080.5960.04912.325p < 0.00160.780
RL → CSCI0.3870.3810.0409.592p < 0.00122.261
CSCI → SUCM0.8290.8320.04120.131p < 0.0010.6882.2000.306
SUCM → BED0.9090.9120.01948.122p < 0.0010.8264.7350.609
SUCM → MPC0.8630.8670.03028.780p < 0.0010.7442.9080.380
SUCM → CST0.9030.9040.02438.371p < 0.0010.8164.4210.456
Table 11. Summary of hypothesis tests.
Path HypothesisConstruct OrderResult
CSCI → SUCMH12 → 2Supported
BI → CSCIH21 → 2Loosely supported *
FI → CSCIH31 → 2Supported
RL → CSCIH41 → 2Supported
SUCM → BEDH52 → 1Supported
SUCM → MPCH62 → 1Loosely supported *
SUCM → CSTH72 → 1Supported
Note: * All the structural model evaluation criteria are satisfied, but not all the measurement model evaluation criteria are satisfied.

