Article

Synthesis of Climate, Soil Factors, and Nitrogen Management Practices Affecting the Responses of Wheat Productivity and Nitrogen Use Efficiency to Nitrogen Fertilizer in China

1
College of Agronomy, Northwest A&F University, No. 3 Taicheng Road, Yangling 712100, Shaanxi, China
2
Key Laboratory of Crop Physi-ecology and Tillage Science in Northwestern Loess Plateau, Ministry of Agriculture, Northwest A&F University, Yangling 712100, Shaanxi, China
*
Authors to whom correspondence should be addressed.
Sustainability 2018, 10(10), 3533; https://doi.org/10.3390/su10103533
Submission received: 28 August 2018 / Revised: 28 September 2018 / Accepted: 30 September 2018 / Published: 1 October 2018

Abstract

:
The reported effects of nitrogen (N) fertilizer on wheat yield and nitrogen use efficiency (NUE) vary greatly, due to differences in climate, soil factors, and N management practices in different regions of China. We collected literature published during 1950–2017 that reported the yield and NUE for wheat in China, under N application and control treatments, and analyzed the data therein. A significant increase in yield was observed with N application, and varied with climate, soil factors, and N management practices in different regions. A larger increase in yield was observed under an average annual temperature of 13–15 °C, an average annual precipitation of >800 mm, respectively. Greater yield-increasing effects were observed in soil with a coarse soil texture, lower soil total N, available N, and a soil pH of ≤7 and >8, respectively. In Northwest China, the yield increase was greater under multiple coated urea applications after anthesis, while the higher NUE was observed under single coated urea application before anthesis. In North China, the yield and NUE were greater under multiple coated urea applications before anthesis. In South China, the yield and NUE were greater under multiple N applications. Consequently, to improve wheat yield and NUE, site-specific N management practices should be adopted.

Graphical Abstract

1. Introduction

Chinese farmers often apply nitrogen (N) fertilizer as an “insurance” against low yields, and this practice is successful in terms of maximizing yield [1]. Recently, many field experiments have been conducted to examine the effects of N fertilizers on wheat production in China; the reported effects of N fertilizer on wheat yield and nitrogen use efficiency (NUE) were found to vary greatly due to several factors. First, the optimum N fertilization rate was uncertain, due to differences in the production regions. To obtain the highest wheat yield in the parts of China with an arid climate and sandy soil, the 160 kg N ha−1 should be applied to spring wheat [2]. In comparison, the optimum N fertilization rates for rain-fed wheat in arid and semiarid regions were 45, 135, and 180 kg N ha−1 in dry, normal, and wet years, respectively [3]. The application of less than 160 kg N ha−1 maintained a relatively high grain yield for winter wheat in the dryland area of the Loess Plateau [4]. In North China, the winter wheat yield did not increase significantly at N rates above 200 kg N ha−1 [5].
The yield and NUE results varied by N fertilizer type. A study showed no significant difference in wheat yield with the use of nitrate versus ammonium N [6]. The use of a new polymer-coated fertilizer to reduce N loss to the Danjiangkou Reservoir of China produced a higher wheat yield, resulting in a high NUE [7]. The grain, straw, and biomass yield with coated urea treatment were 9.09–15.06, 13.11–14.96, and 11.73–14.99% higher than those with standard urea, respectively [8]. Grain yields with irrigation plus NH4NO3 application and irrigation plus NH4HCO3 application were 148.0 and 163.6% higher, respectively, than that of a no-irrigation, no-fertilizer treatment [9]. A study showed an increase in crop yields, NUE, and profits with the use of mixtures of coated controlled-release and uncoated urea in a wheat-maize system [10].
Results also differ by the number and time of N applications. For cereals, N fertilization is commonly applied three or four times during the growing season, although a study showed that a single N application in the period between tillering and stem elongation was enough to achieve a high yield and high quality of winter wheat, with no increased risk of nitrate leaching [11]. However, split application of N had a favorable effect on grain yield, particularly under conditions of severe water-logging and a high N rate [12]. With the same overall amount of N applied, three split applications improved the grain yield and enhanced NUE compared with two applications [13].
However, based on these various results, it becomes evident that several factors (i.e., climate, soil factors, and management practices) likely varied greatly between studies. A previous analysis that examined the effects of N fertilization on wheat grain protein in Argentina concluded that foliar N fertilization after heading is more likely to increase the wheat grain protein content than early application of N [14], while a global meta-analysis showed that the effectiveness of urease and nitrification inhibitors for increasing crop productivity and NUE was dependent on environmental and management factors [15]. A meta-analysis of the effect of N fertilization on annual cereal–legume intercrop production showed that N fertilization had a non-significant effect on the average land equivalent ratio and average yield ratio, although the inter-study variability of these effects was large [16]. Also, a meta-analysis showed that yield and nitrogen use efficiency were improved through alternative fertilization options for rice in China [17].
The effects of N fertilizer on the yield of wheat have not been quantified in China across a range of agro-ecological conditions. Wheat studies were mainly located in northwest, north, and south China (Figure 1), and the optimal N management practices are not clear in the three regions. To solve these problems, we hypothesized that using multiple N applications and applying coated urea after anthesis would improve the yield and NUE of wheat in Northwest China, a region with limited rainfall and no irrigation; in north China, an area with irrigation, the optimal N management practices would involve multiple coated urea applications before anthesis; finally, the multiple coated urea applications before anthesis would be the best N management practice in south China, which is a region that experiences high rainfall during the wheat growth stage (Figure 2).
As site-specific field experiments often show variability, a meta-analysis can be used to summarize the results of numerous independent experiments examining the effects of N fertilizer on wheat in China [18]. Therefore, the main objectives of this study were to (1) investigate how the yield of wheat is affected by N fertilizer use in China; (2) to determine how the effects vary by environmental and management factors; and (3) to clarify the optimal N management practices in Northwest, North, and South China, via a meta-analysis of published studies.

2. Materials and Methods

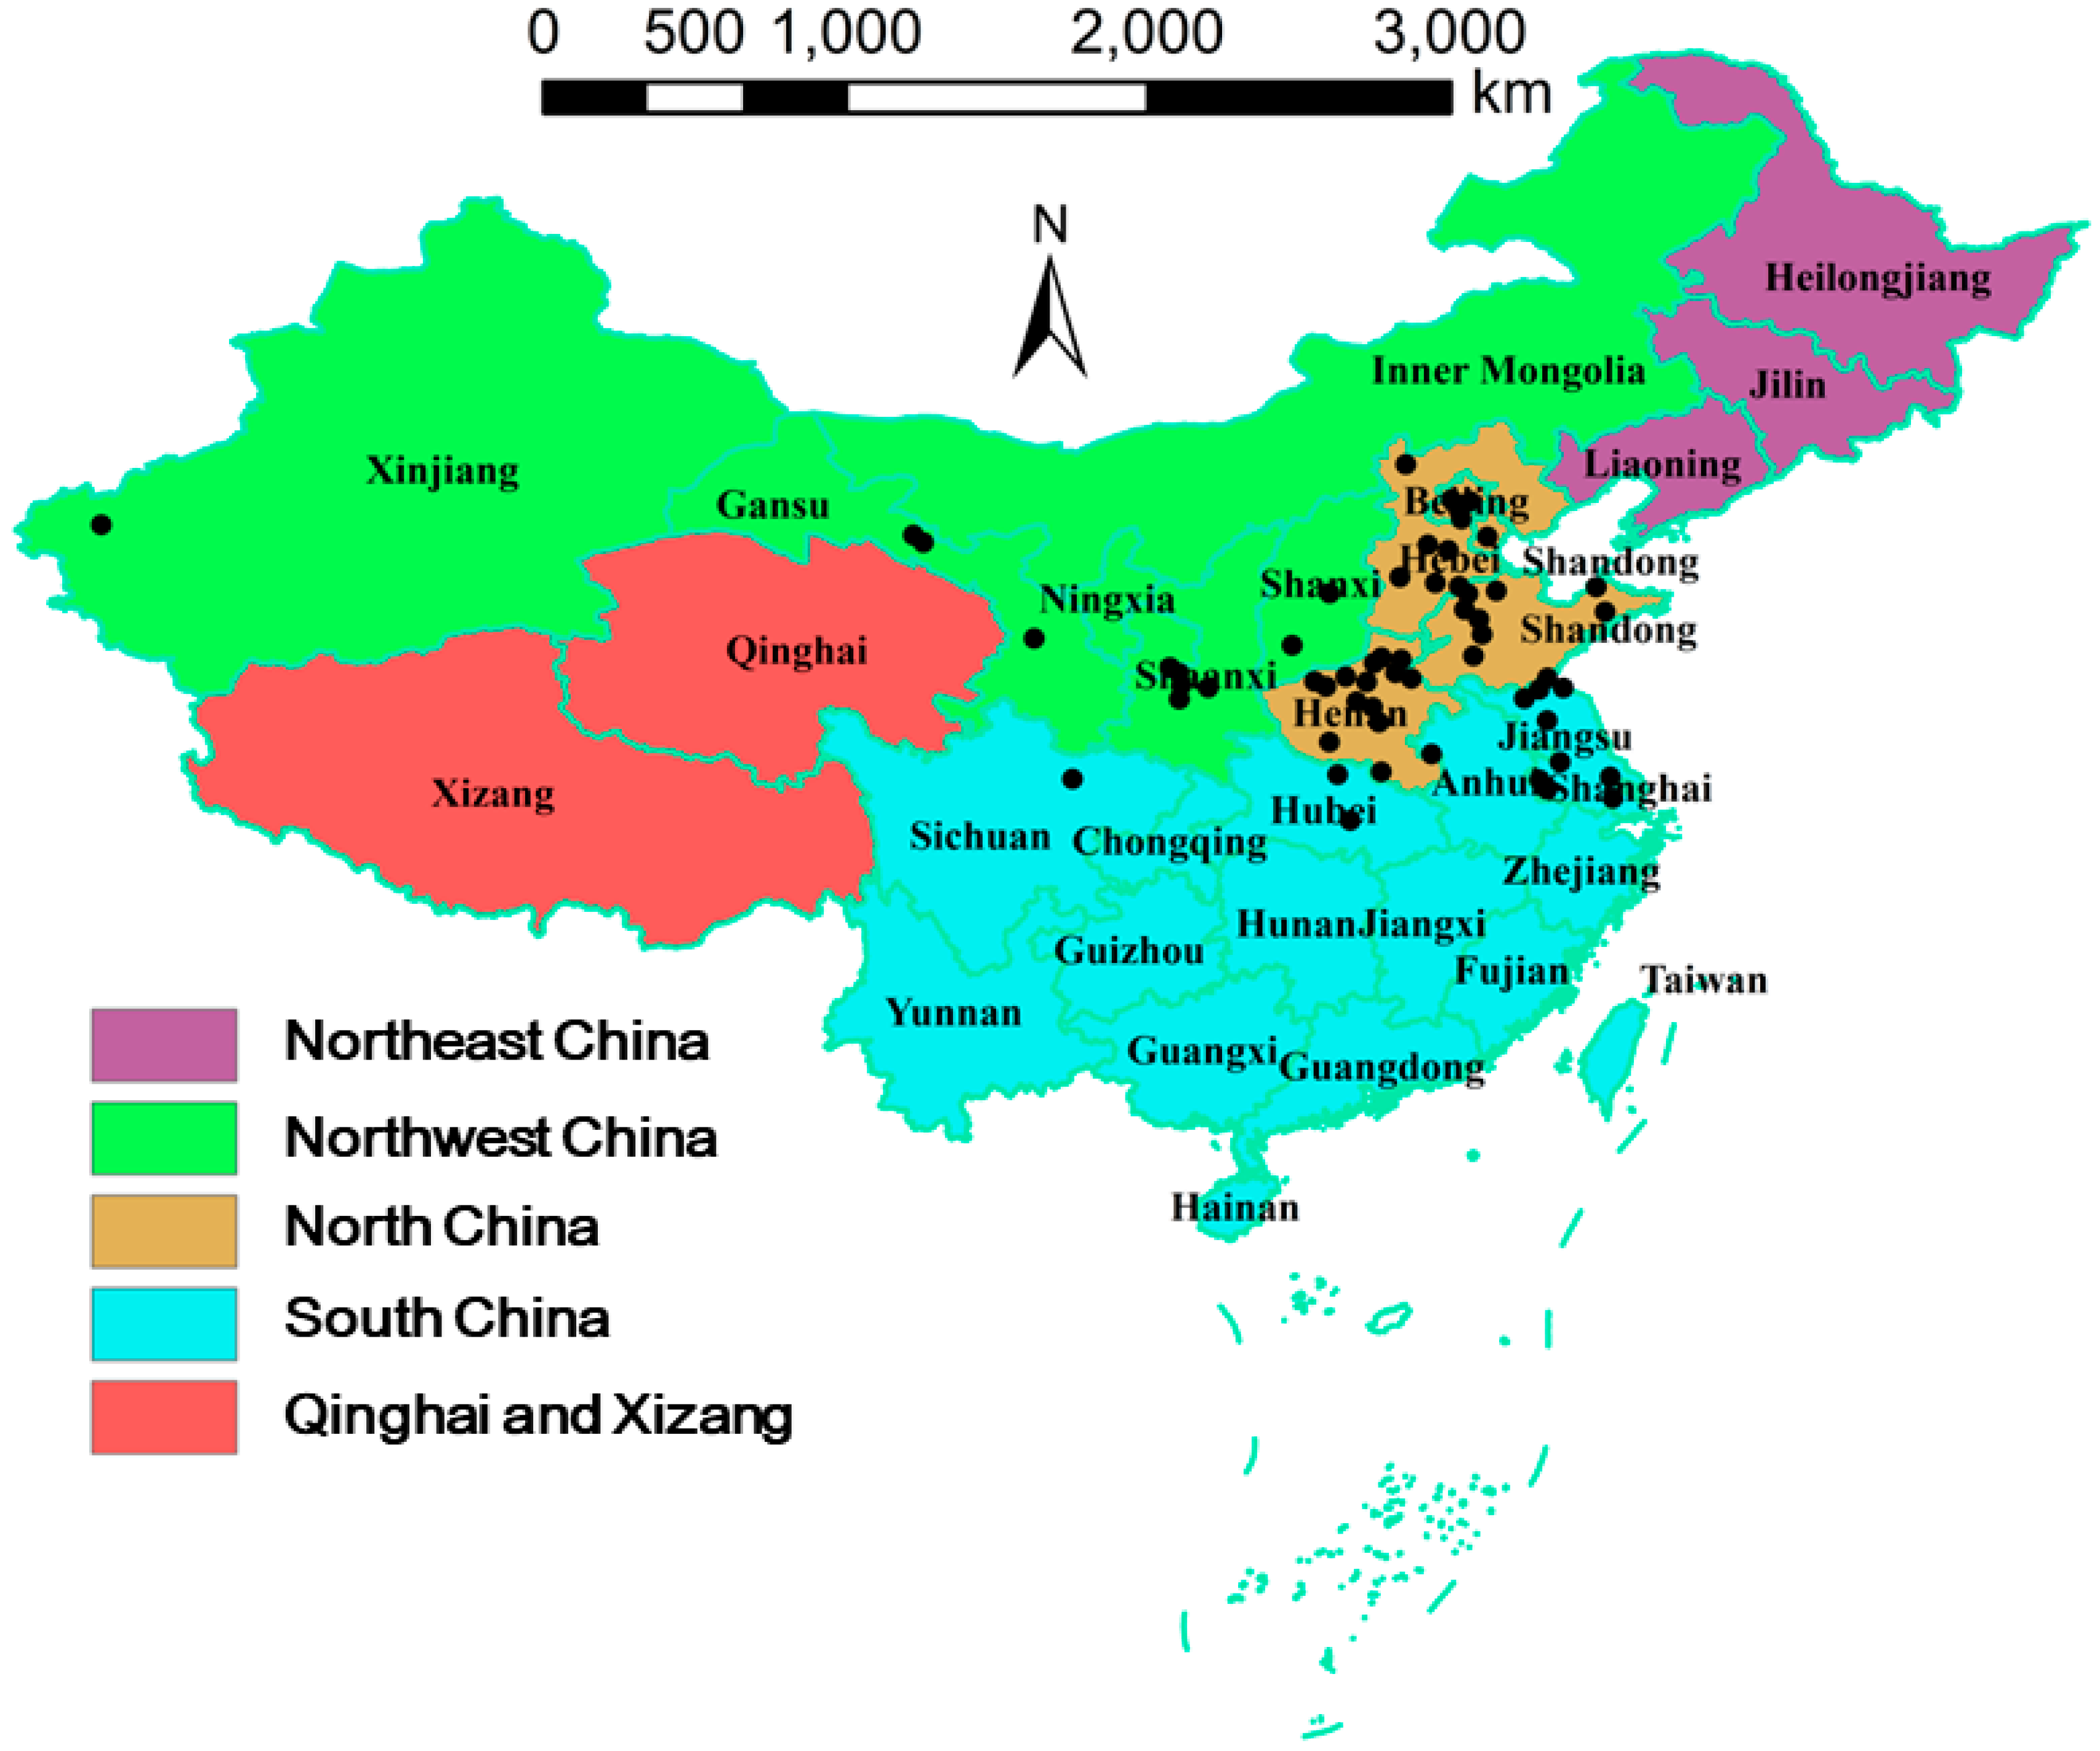
2.1. Data Collection

Beginning in June 2017, we searched the China National Knowledge Infrastructure and Web of Science for articles published during 1950–2017 on the effects of N fertilizer on wheat yield in China, with the following keywords: (i) wheat, N fertilizer, yield, and field or (ii) wheat, N, yield, and field.
The articles included in the database met the following criteria: the studies were monoculture cereals of wheat (i.e., bread wheat; Triticum aestivum L.) sown under field conditions (excluding plot studies and greenhouse experiments) in China. A total of 5636 references were identified through Web of Science and China National Knowledge Infrastructure, but no additional records were identified through other sources (n > 5000). Thus, 680 references were screened based on article title. Of these references, 260 were excluded because they did not fit with the criteria used in the study. Then, 334 full-text articles were excluded from 420 references because they did not fit with the criteria used in the study, resulting in 86 references (Supplementary Information) used in the meta-analysis. The research in these articles was carried out in 13 provinces or municipalities (Xinjiang, Gansu, Shaanxi, Shanxi, Beijing, Tianjin, Hebei, Shandong, Henan, Anhui, Hubei, Jiangsu, and Sichuan) (Figure 1). The distribution of the study locations was generated using ArcGIS software (ver. 10.2; ESRI, Redlands, CA, USA).

2.2. Building the Datasets

In this study, the ratio of yield under N treatment to N application rate was defined as the NUE [19]. Data (yield, ear number, kernel number per ear, thousand-kernel weight, N application rate, and NUE) were generated from the text, tables, and figures of the published papers where control treatments (CK, only P2O5 and K2O applied without N) could be compared to the paired N treatment in China. When the data were presented in the form of graphs, the numerical data were extracted from the figures through the DataThief III program [20]. When only yield and N application rate data were provided in articles without NUE data, the NUE was calculated with the formula NUE = yield under N treatment/N application rate [19].
Data were grouped to maximize in-group homogenization. The studies evaluated were conducted in northwest, north, and south China (Figure 1). The annual average precipitation (AP) was divided into five classes: 0–500, 500–600, 600–700, 700–800, and >800 mm. The annual average air temperature (AT) was divided into four classes: ≤10 °C, 10–13 °C, 13–15 °C, and >15 °C. Soil texture was grouped into three basic classes (coarse, medium, and fine) in a soil layer with a depth of 0–20 cm, according to Daryanto et al. (2015) [21]. The soil total N contents were divided into four classes (0–0.5, 0.5–1.0, 1.0–1.5, and ˃1.5 g kg−1). The soil available N was divided into four classes (0–50, 50–100, 100–150, and ˃150 mg kg−1). The soil pH was categorized into three ranges: ≤7, 7–8, and ˃8. The irrigation pattern was categorized as rainfed or irrigated. The number of N applications was categorized as single or multiple times. The time of N application was categorized as no N after anthesis or N after anthesis. The N fertilizer types were categorized as common urea or coated urea.

2.3. Meta-Analysis

To characterize the response of wheat yield, ear number, kernel number per ear, and thousand-kernel weight to N fertilizer, a random-effects meta-analysis was used. We used the natural log of the response ratio (lnR) as a measure of effect size:
ln R = ln ( X t / X c ) = ln X t ln X c
where Xt and Xc are the measured values of the response variable under N and CK, respectively [18]. Generally, not all of observations are weighted by the inverse of the variance, supposing that individuals with a lower variance should be weighted more highly. The sampling variance (e.g., the standard deviation) was not presented in some of the collected studies in our database, but the sample size was reported in all the studied articles. As a result, the lnR was weighted by sample size, i.e.,
W n = n c n t / ( n c + n t )
where nc and nt are the sample sizes for the control and treatment groups, respectively [22]. The higher weighting is given to well-replicated studies with larger sample sizes under these conditions [22].
To avoid assigning relatively high weights to those studies for multiple years, the weight of each effect size was divided by the number of years the data from the corresponding study [23]. The mean effect sizes were estimated as follows:
ln R ¯ = ( ln R n × W n ) / W n
where lnRn is the effect size of the i comparison and Wn.
The Stata software package (ver. 12.0; Stata Corp., College Station, TX, USA) was used to calculate mean effect sizes and generate bias-corrected 95% confidence intervals (CIs) for each mean effect size with a metan procedure. If the 95% bootstrap CIs values did not overlap with zero, a significant N fertilizer response was considered. Otherwise, N fertilizer was considered to have no significant impact on yield under those factors [18]. To simplify the interpretation, the effect size (ES, %) was expressed as the percentage change, which was estimated as follows:
ES = ( R 1 ) × 100 %
A negative (or positive) percentage change indicated a decrease (or increase) in the response variable under N relative to CK.

2.4. Regression Analysis

The regression analysis was applied with Sigma Plot 12.5 (Systat Software Inc., San Jose, CA, USA) to test the relationships between the lnR of the yield and the AT, AP, total N, available N, soil pH in the 0–20-cm soil layer.

3. Results

3.1. Overview of the Wheat N Application Rate, Yields, and NUE

The variation among studies in wheat N application rate, yield, and NUE was large (Figure 3), mainly because the studies were conducted in different regions, with different soils and N management practices. The wheat N rate ranged from 50 to 550 kg N ha−1 (Figure 3A). Yields ranged from 1000 to 11,000 kg ha−1 (Figure 3B), and the NUE ranged from 10 to 250 kg kg−1 (Figure 3C). The median and mean N rates in Northwest China (155.3 and 150.0kg N ha−1) were higher than in north (120.0 and 157.8 kg N ha−1) and South China (120.8 and 124.1 kg N ha−1) (Figure 4A). The median and mean yields in Northwest China (4905.8 and 4797.2 kg ha−1) were also lower than in North (6811.5 and 6790.0 kg ha−1) and South (6833.4 and 6710.1 kg ha−1) China (Figure 4B). The median and mean NUEs in northwest China were the lowest, with the highest values being in North China (Figure 4C). North China had relatively high median and mean N rates and yield, and showed a tendency toward a relatively high NUE.

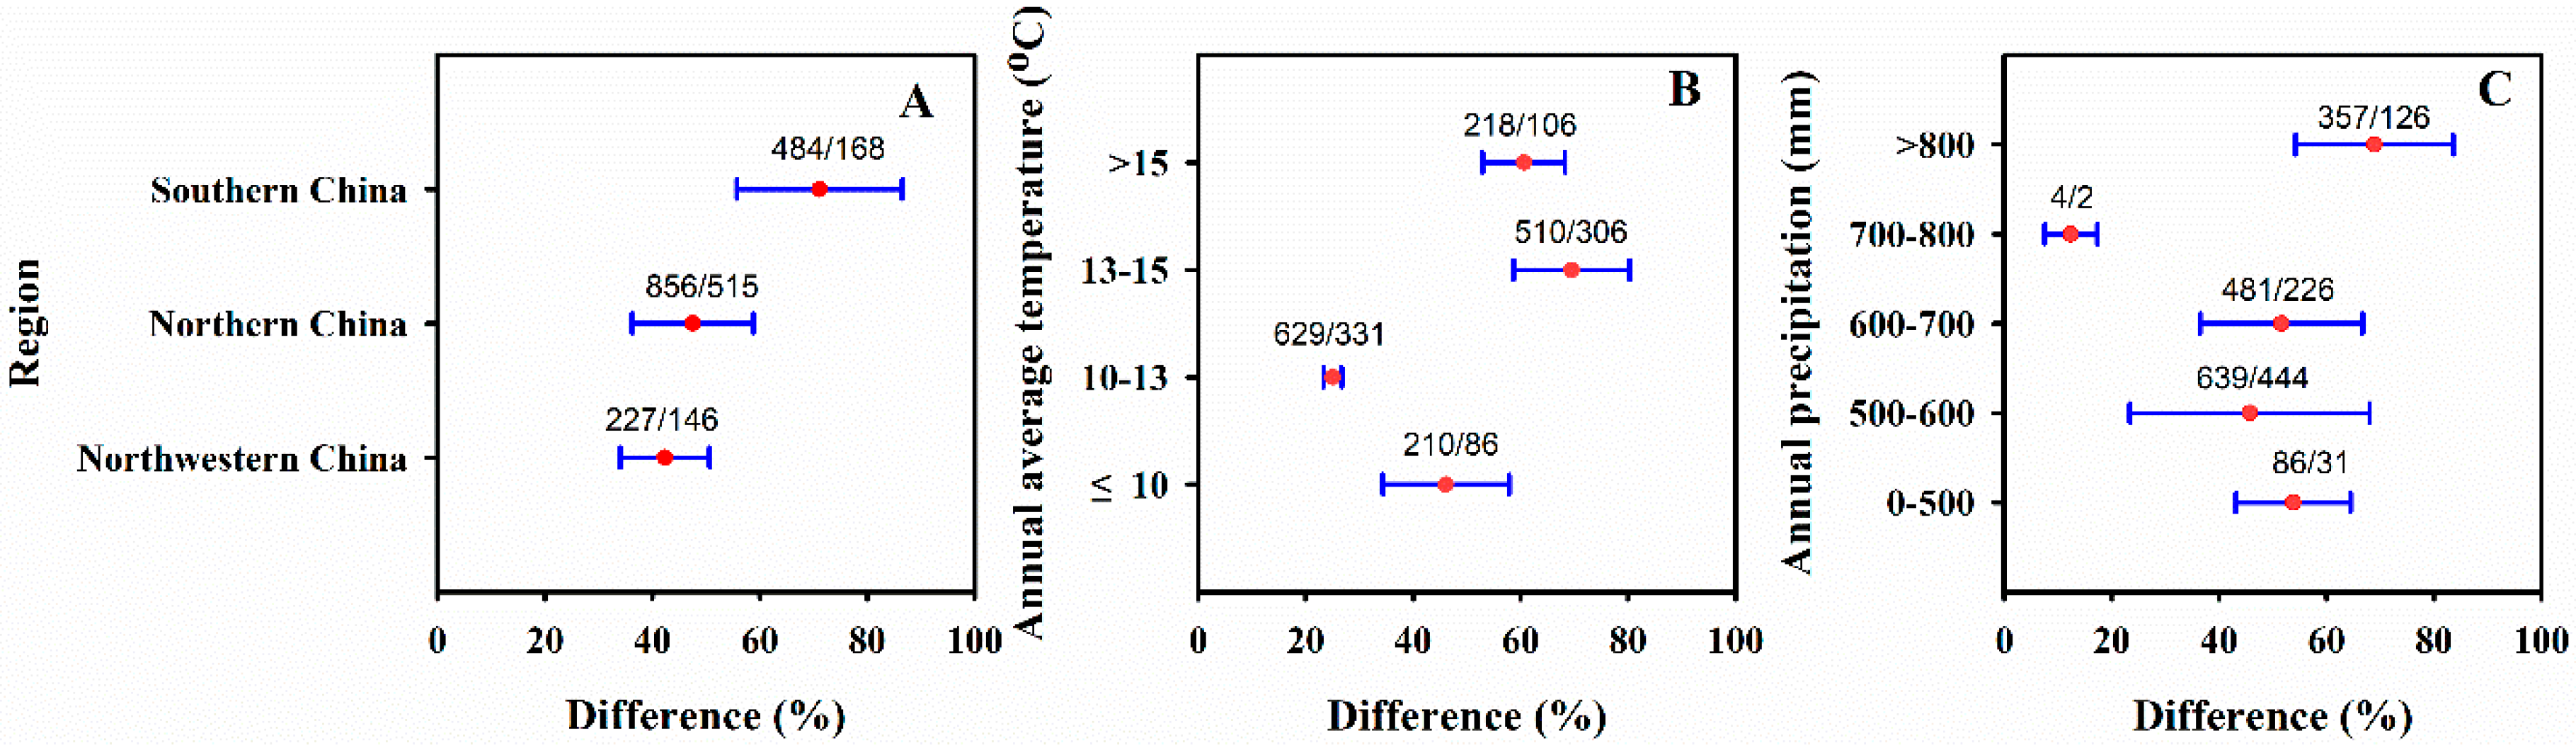
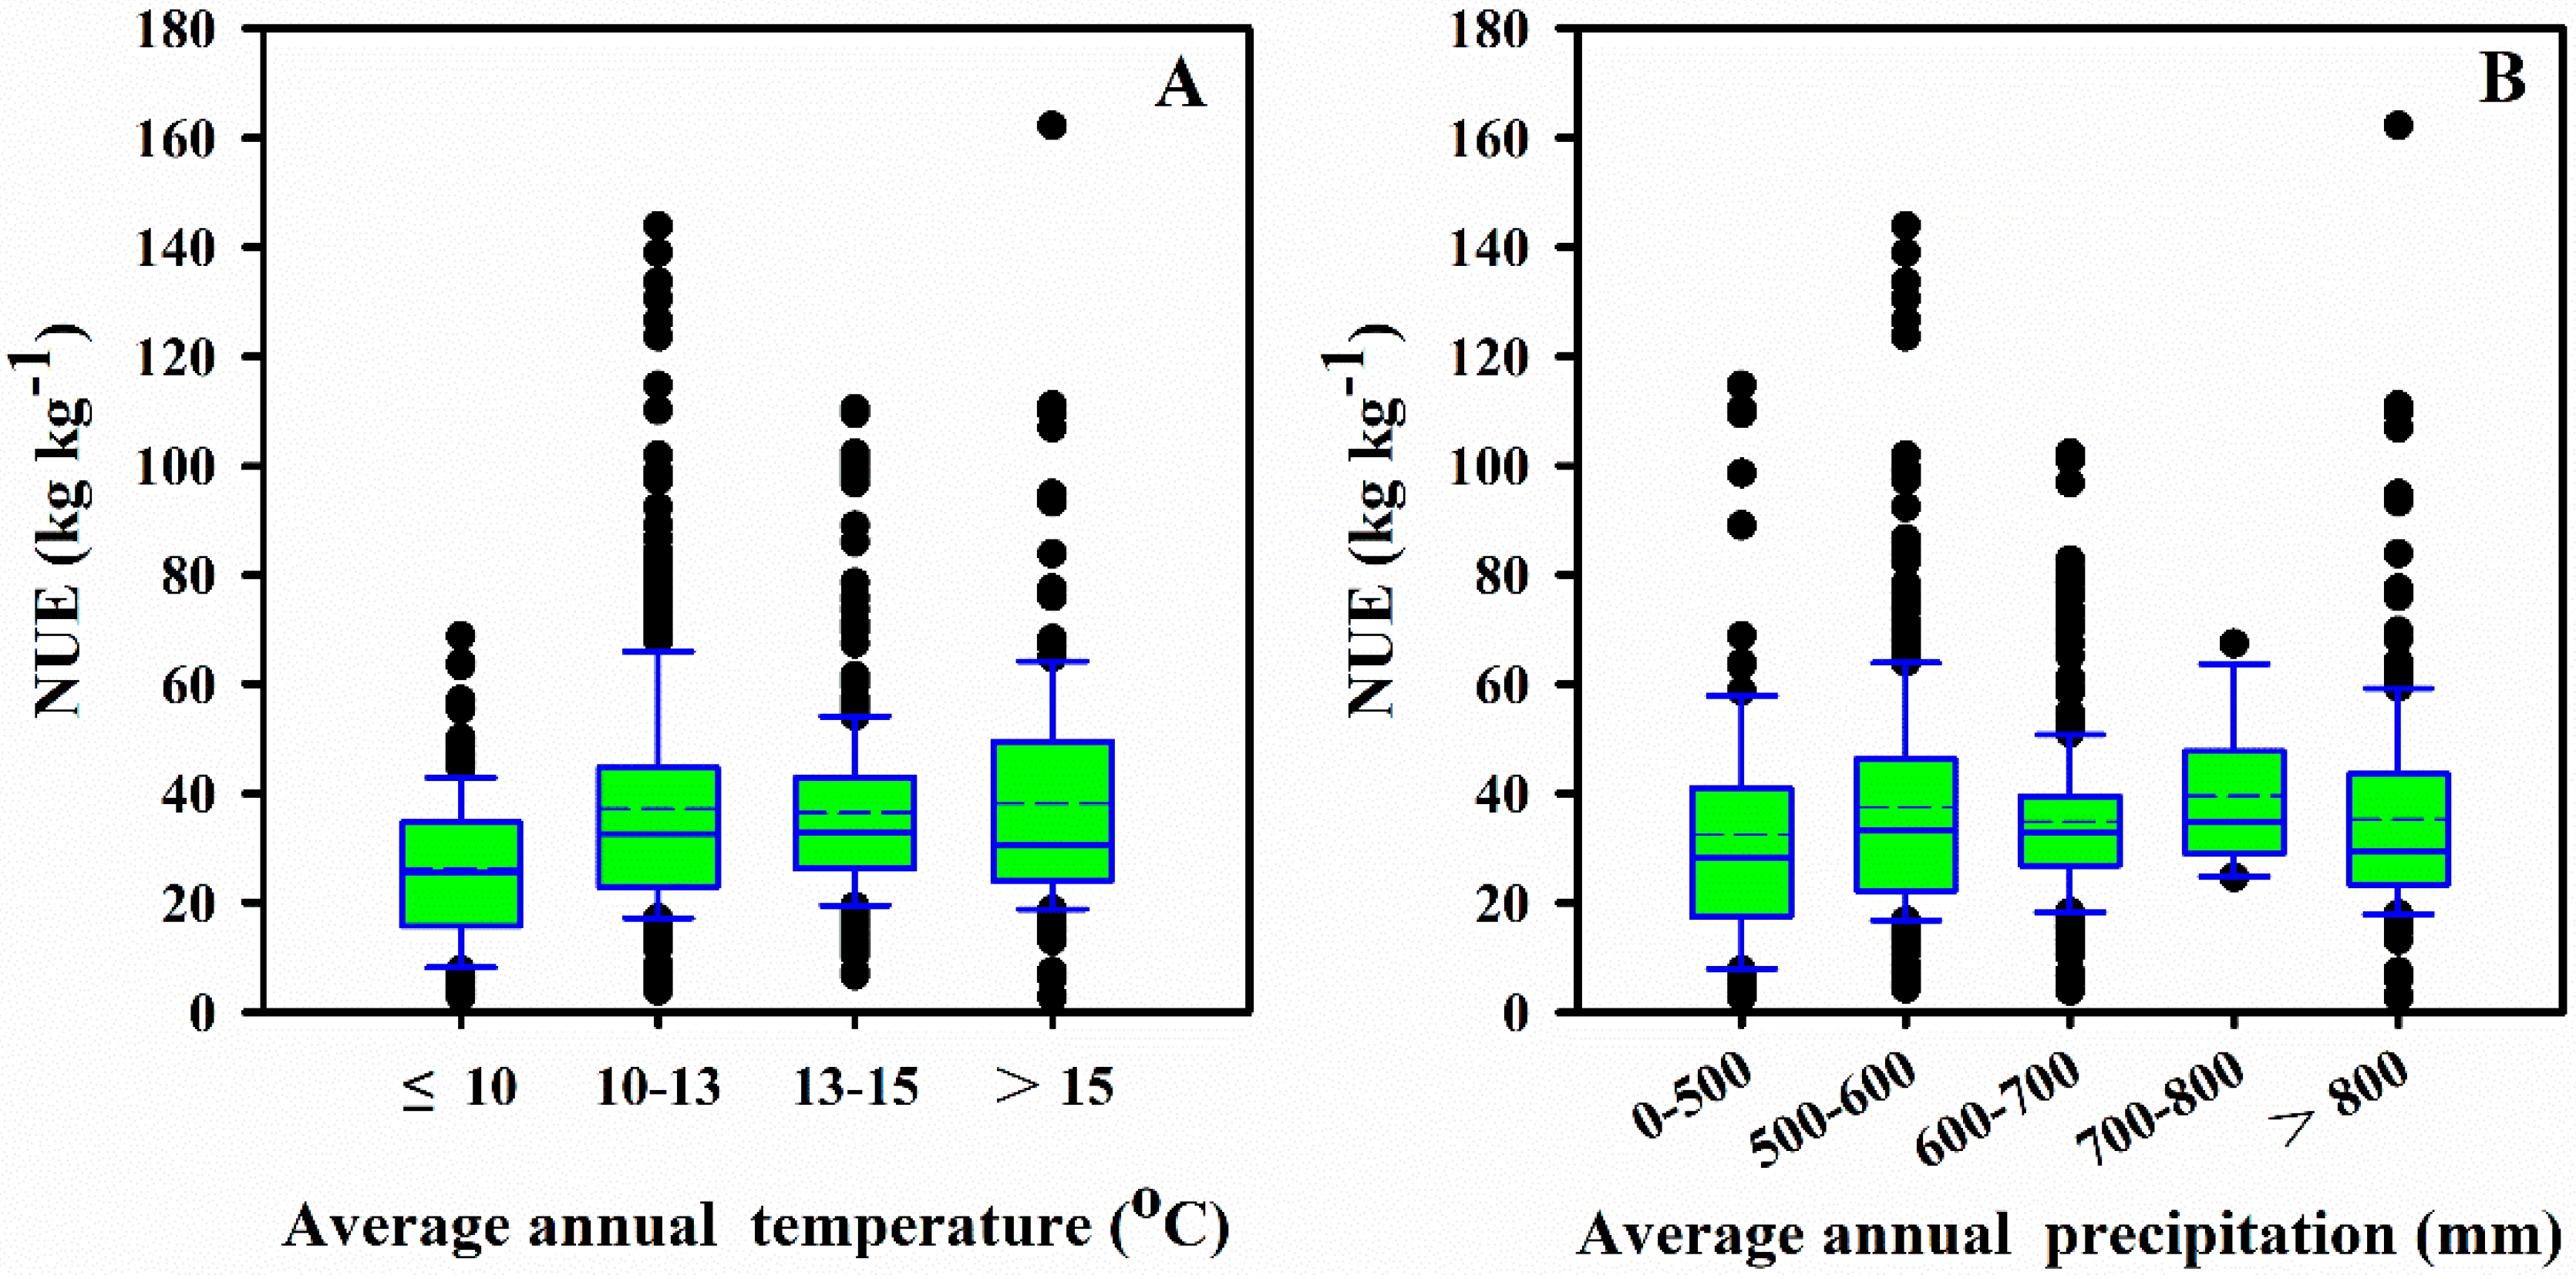
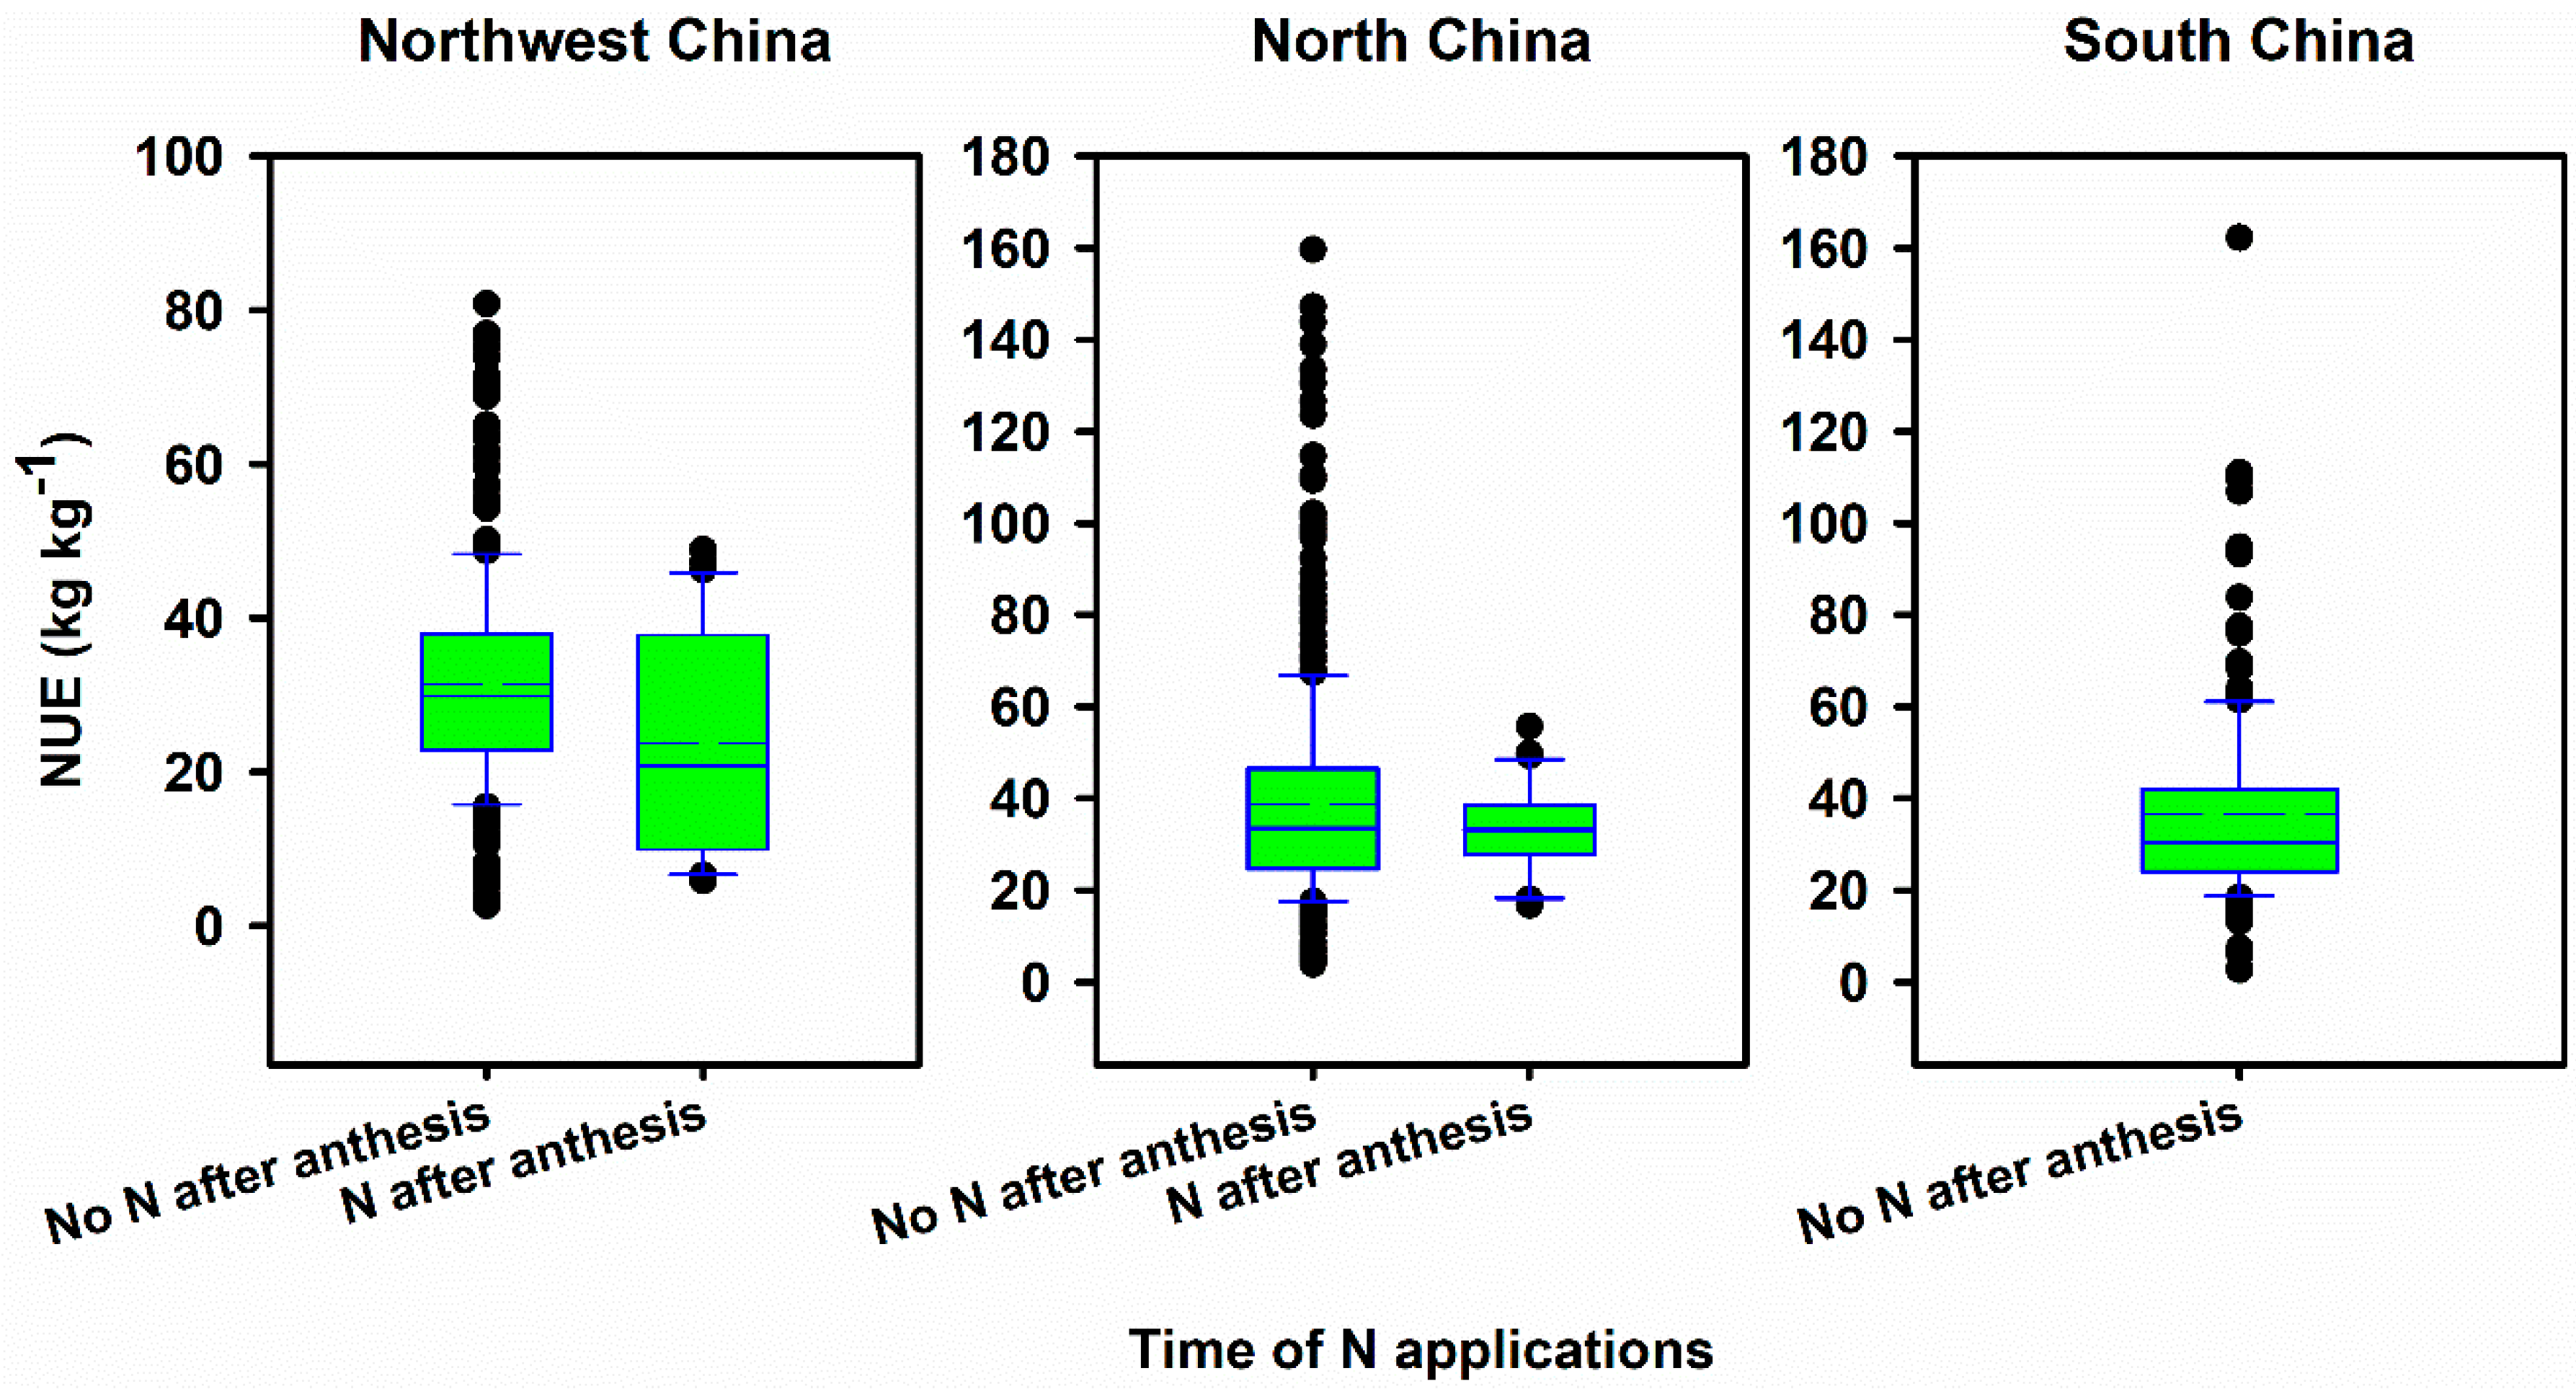
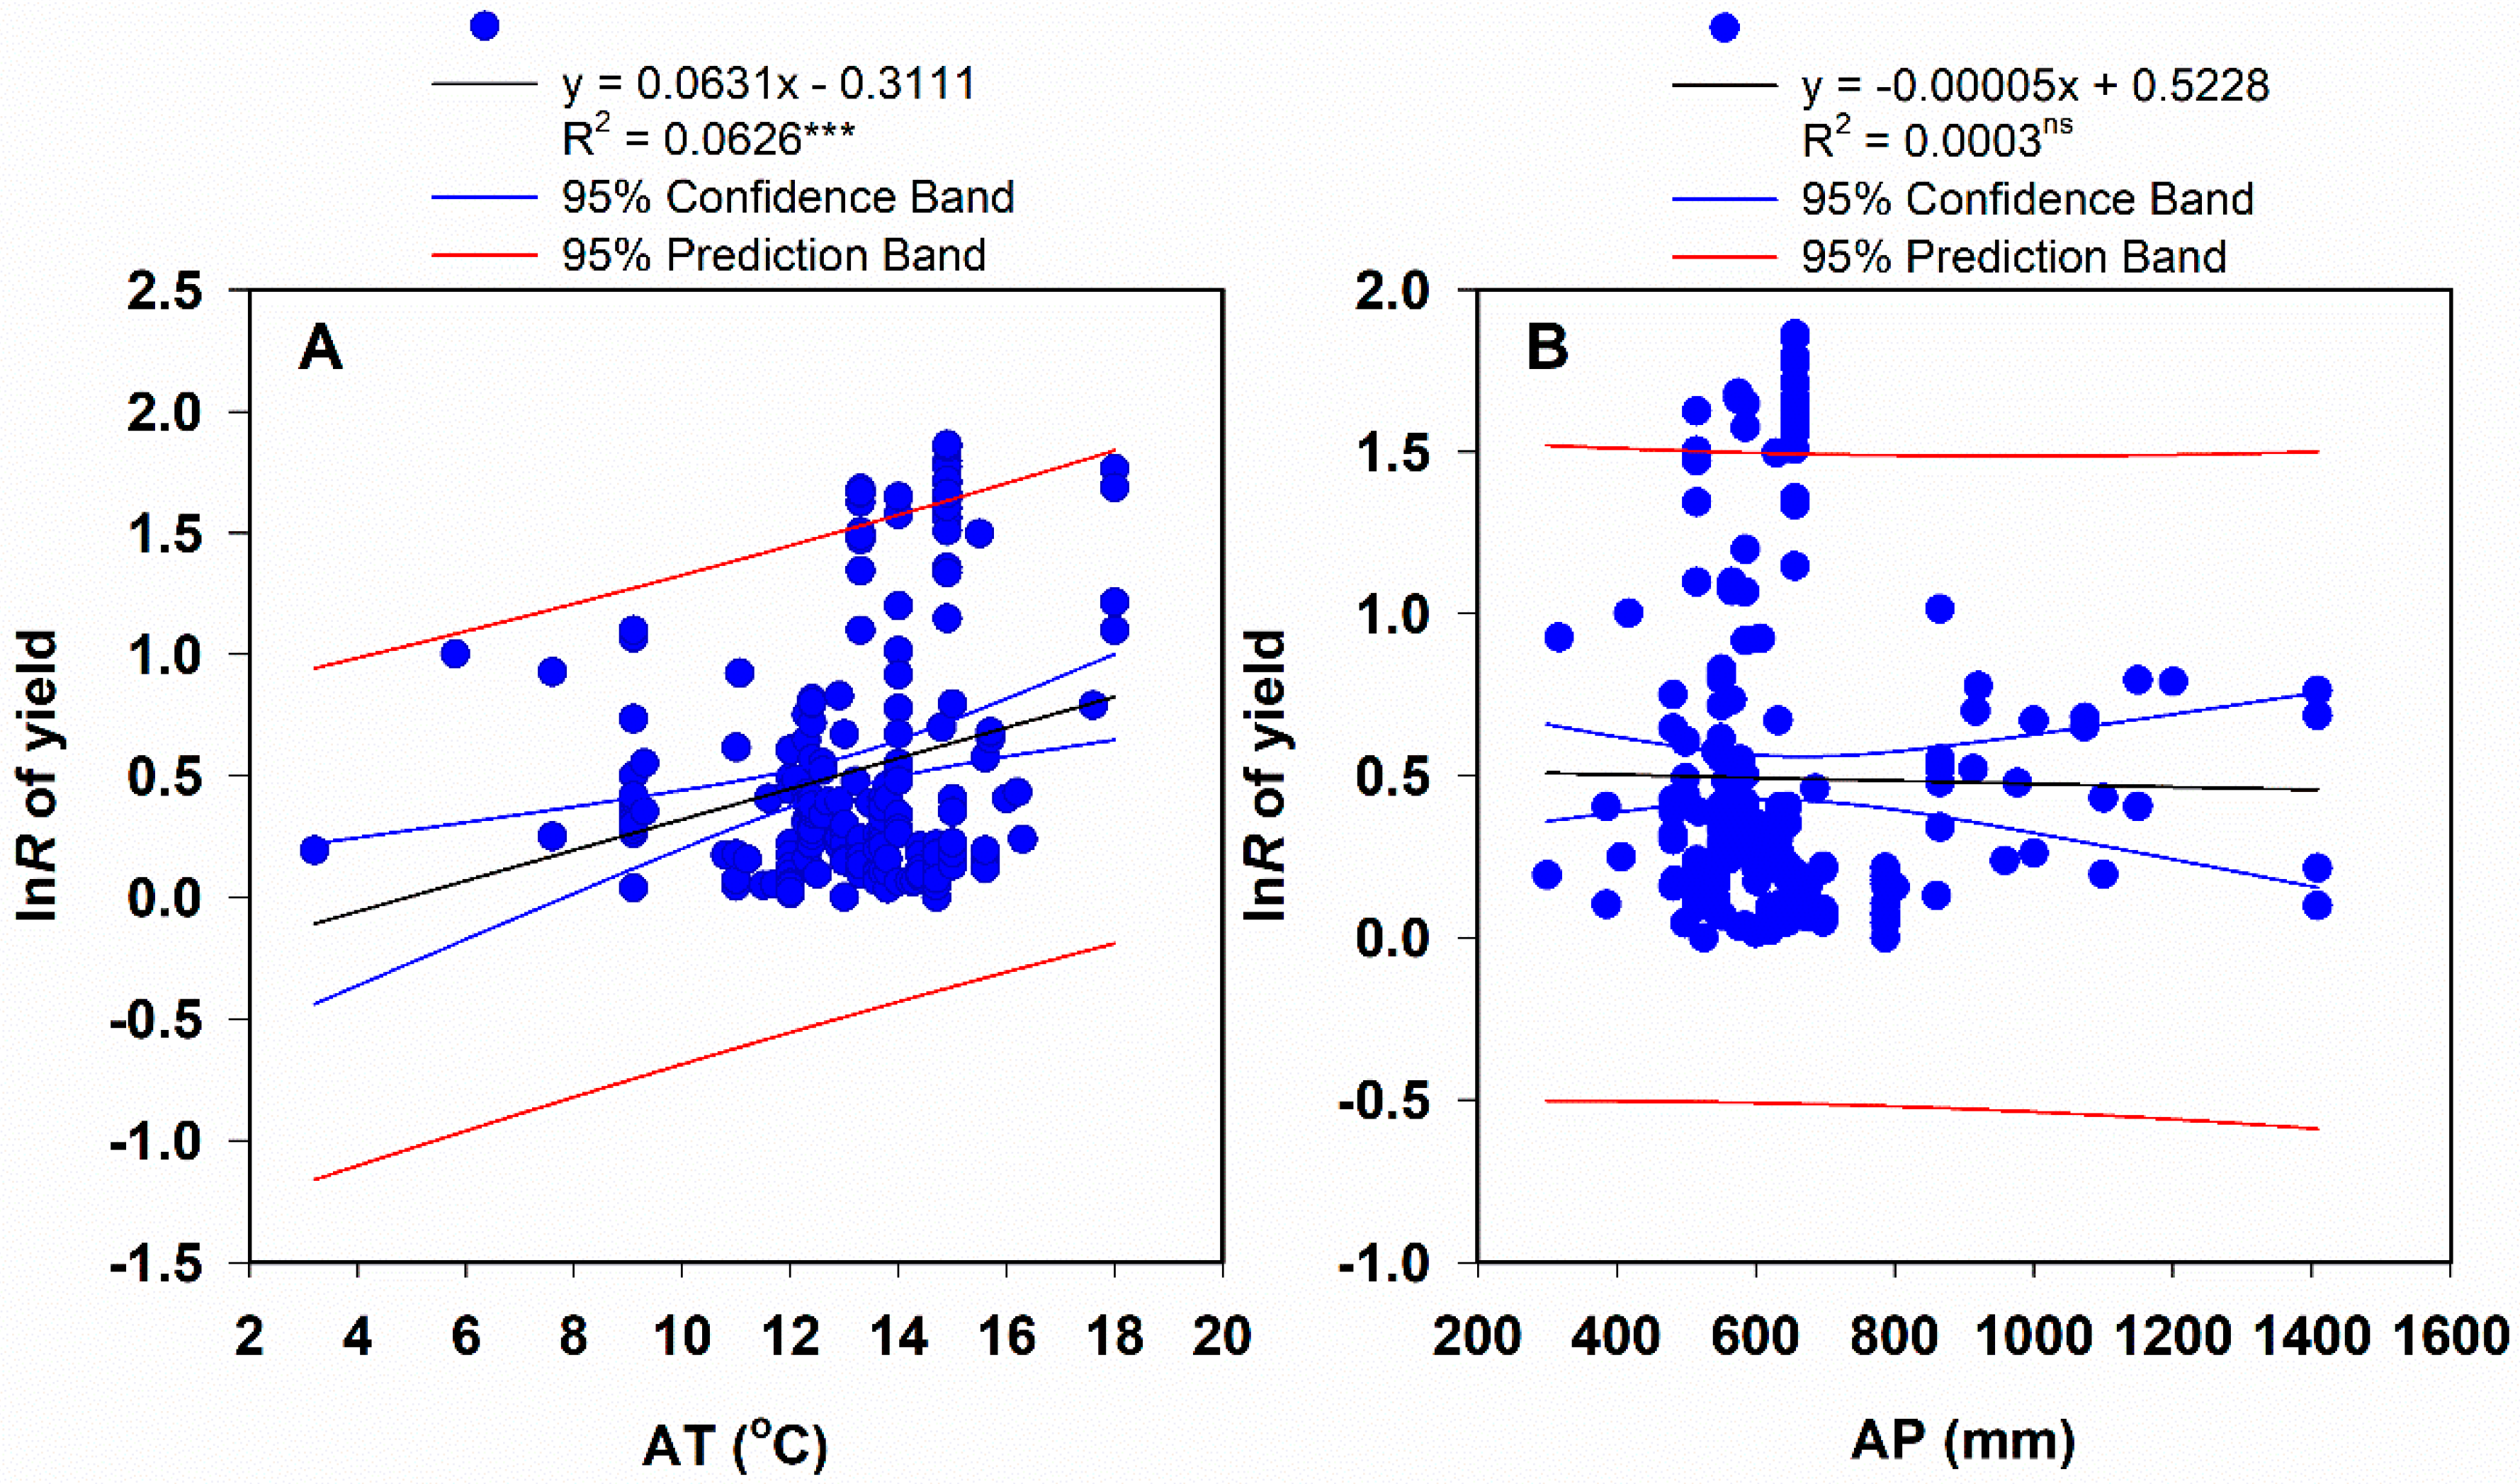
3.2. Yield and NUE by Region and Climate

Nitrogen fertilizer significantly increased the wheat yield compared with the control treatment; the ES varied by region, average annual temperature, and average annual precipitation (Figure 5). The percentage increase in yield in northwest China was 42.3%, while in north and south China it was 47.5 and 71.1%, respectively (Figure 5A). The increase in yield was higher under temperatures of 13–15 °C (69.6%) than under temperatures of ≤10 °C, 10–13 °C, and >15 °C (46.1%, 25.0%, and 60.6%, respectively) (Figure 5B). There was a 53.8% increase in yield under a precipitation amount of 0–500 mm, and N fertilizer significantly increased the yield by 45.7%, 51.6%, 12.4%, and 68.9% under precipitation amounts of 500–600, 600–700, 700–800, and >800 mm, respectively, compared with the control (Figure 5C). The wheat NUE varied with the average annual temperature and annual precipitation (Figure 6). The median and mean NUEs under a temperature of ≤10 °C (25.5 and 26.2 kg kg−1, respectively) were lower than those under a temperature of >10 °C (30.6–32.9 and 36.5–38.2 kg kg−1) (Figure 6A). The median and mean NUEs were lower under a precipitation amount of 0–500 mm (28.4 and 32.5 kg kg−1, respectively) than under a precipitation amount of >500 mm (29.5–34.8 and 34.8–39.5 kg kg−1, respectively) (Figure 6B).

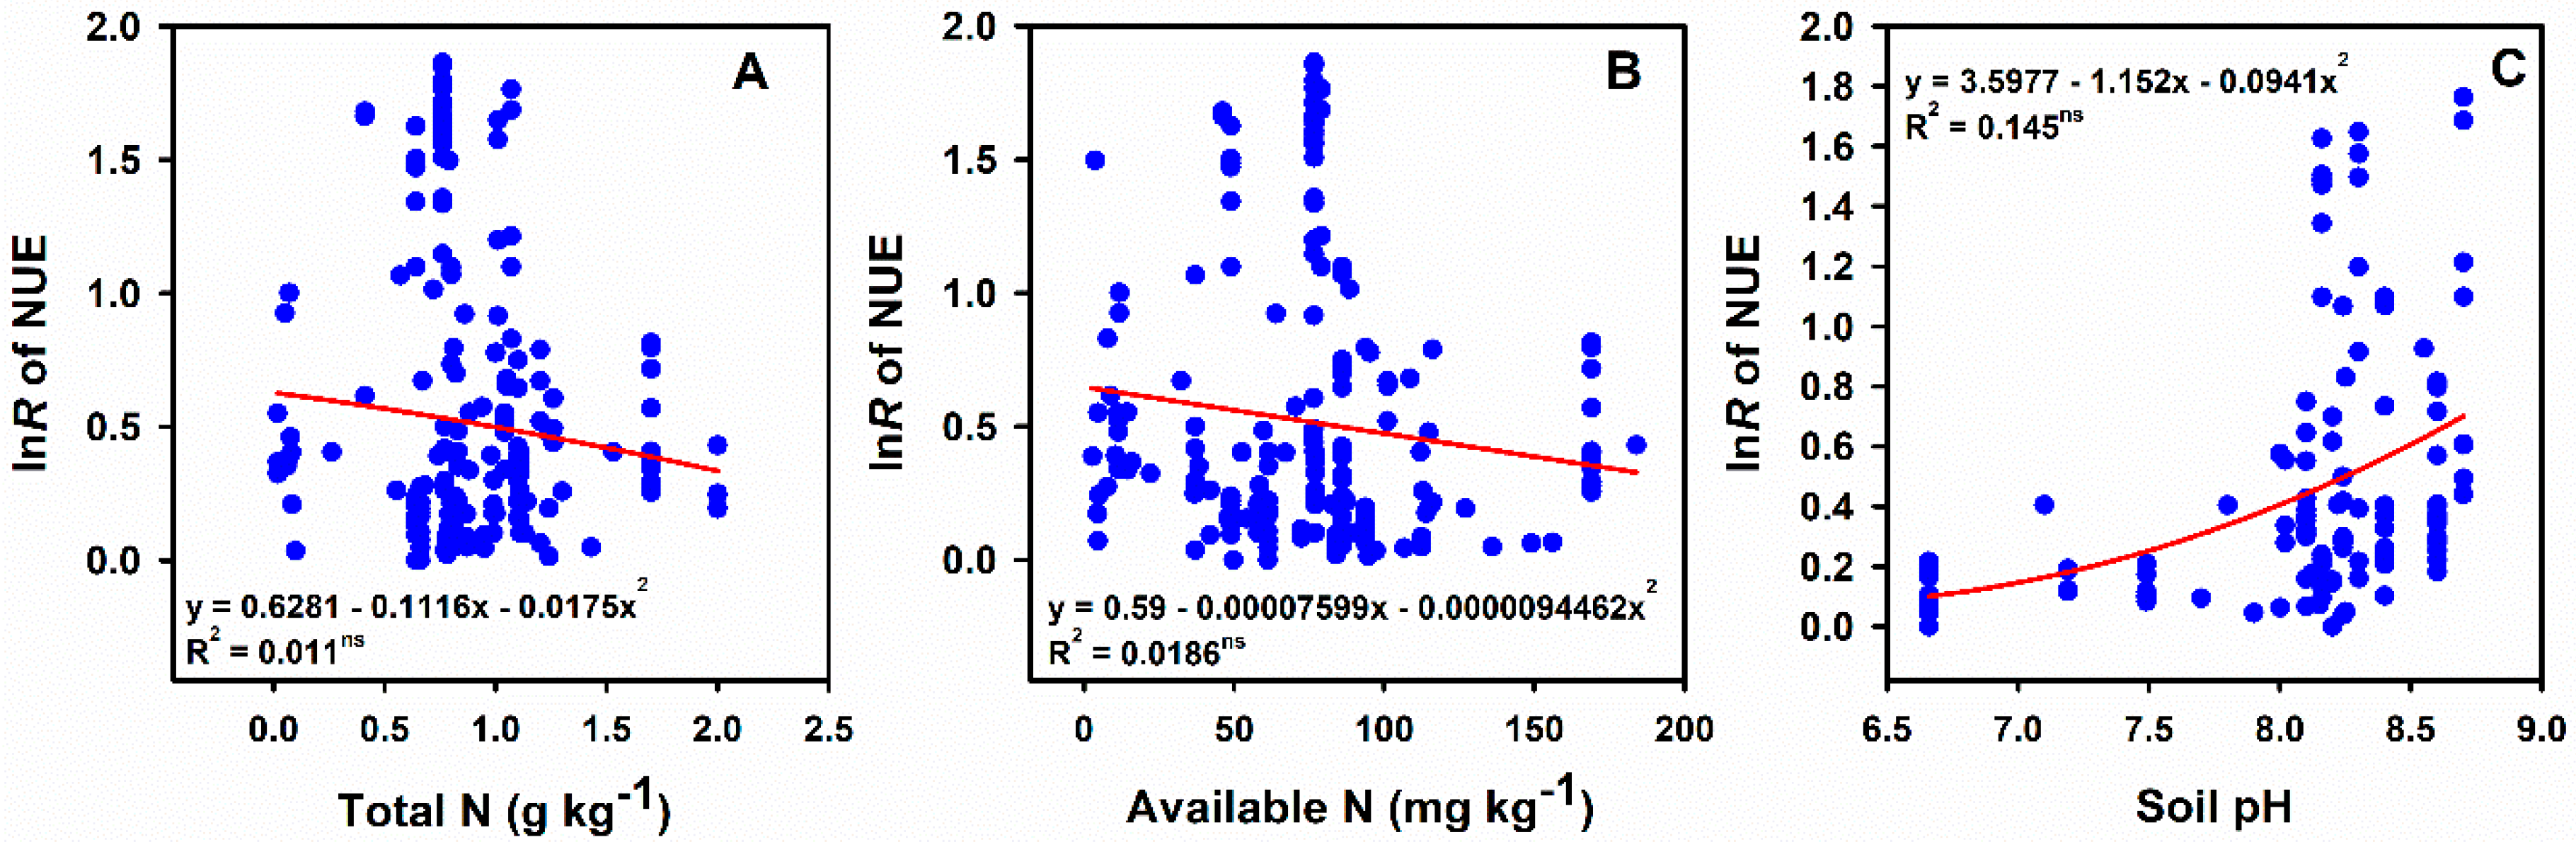
3.3. Impact of Soil Texture, Total N, Available N, and pH

The positive effects of N fertilizer on yield varied by soil texture, total N, available N, and pH (Figure 7). N fertilizer significantly increased the wheat yield by 16.8%, 44.4%, and 71.2.8% for fine, medium, and coarse soil textures, respectively, compared with the control (Figure 7A). A greater increase in yield was observed under 0–0.5 g kg−1 total N (68.8%), which was higher than under >0.5 g kg−1 (43.6–58.8%) (Figure 7B). There was a 55.8% increase in yield under 0–50 mg kg−1 available N, and N fertilizer significantly increased the yield by 58.8%, 12.1%, and 45.0% under 50–100, 100–150, and >150 mg kg−1, respectively, compared with the control (Figure 7C). A 13.2% increase in wheat yield was observed with a soil pH of 7–8, which was lower than that for pH ≤7 and pH >8 (47.6 and 51.6%, respectively) (Figure 7D). The wheat NUE varied with soil texture, total N, available N, and pH (Figure 8). The median and mean NUEs were lowest with a fine soil texture (29.2 and 32.6 kg kg−1, respectively), and highest with a coarse soil texture (32.9 and 37.0 kg kg−1, respectively) (Figure 8A). The median and means NUE were lower under 0–0.5 g kg−1 total N (29.6 and 29.9 kg kg−1, respectively) than under 0.5–1.0 g kg−1 (32.3 and 36.3 kg kg−1, respectively), 1.0–1.5 g kg−1 (30.7 and 35.2 kg kg−1, respectively), and >1.5 g kg−1 total N (36.4 and 45.6 kg kg−1, respectively) (Figure 8B). The median and mean NUEs were the highest under 150–200 mg kg−1 available N, followed by 100–150, 50–100, 0–50, and >200 mg kg−1 available N (Figure 8C). The median and mean NUEs were higher under a soil pH of 7–8 than under soil pH levels of ≤7 and >8 (Figure 8D).

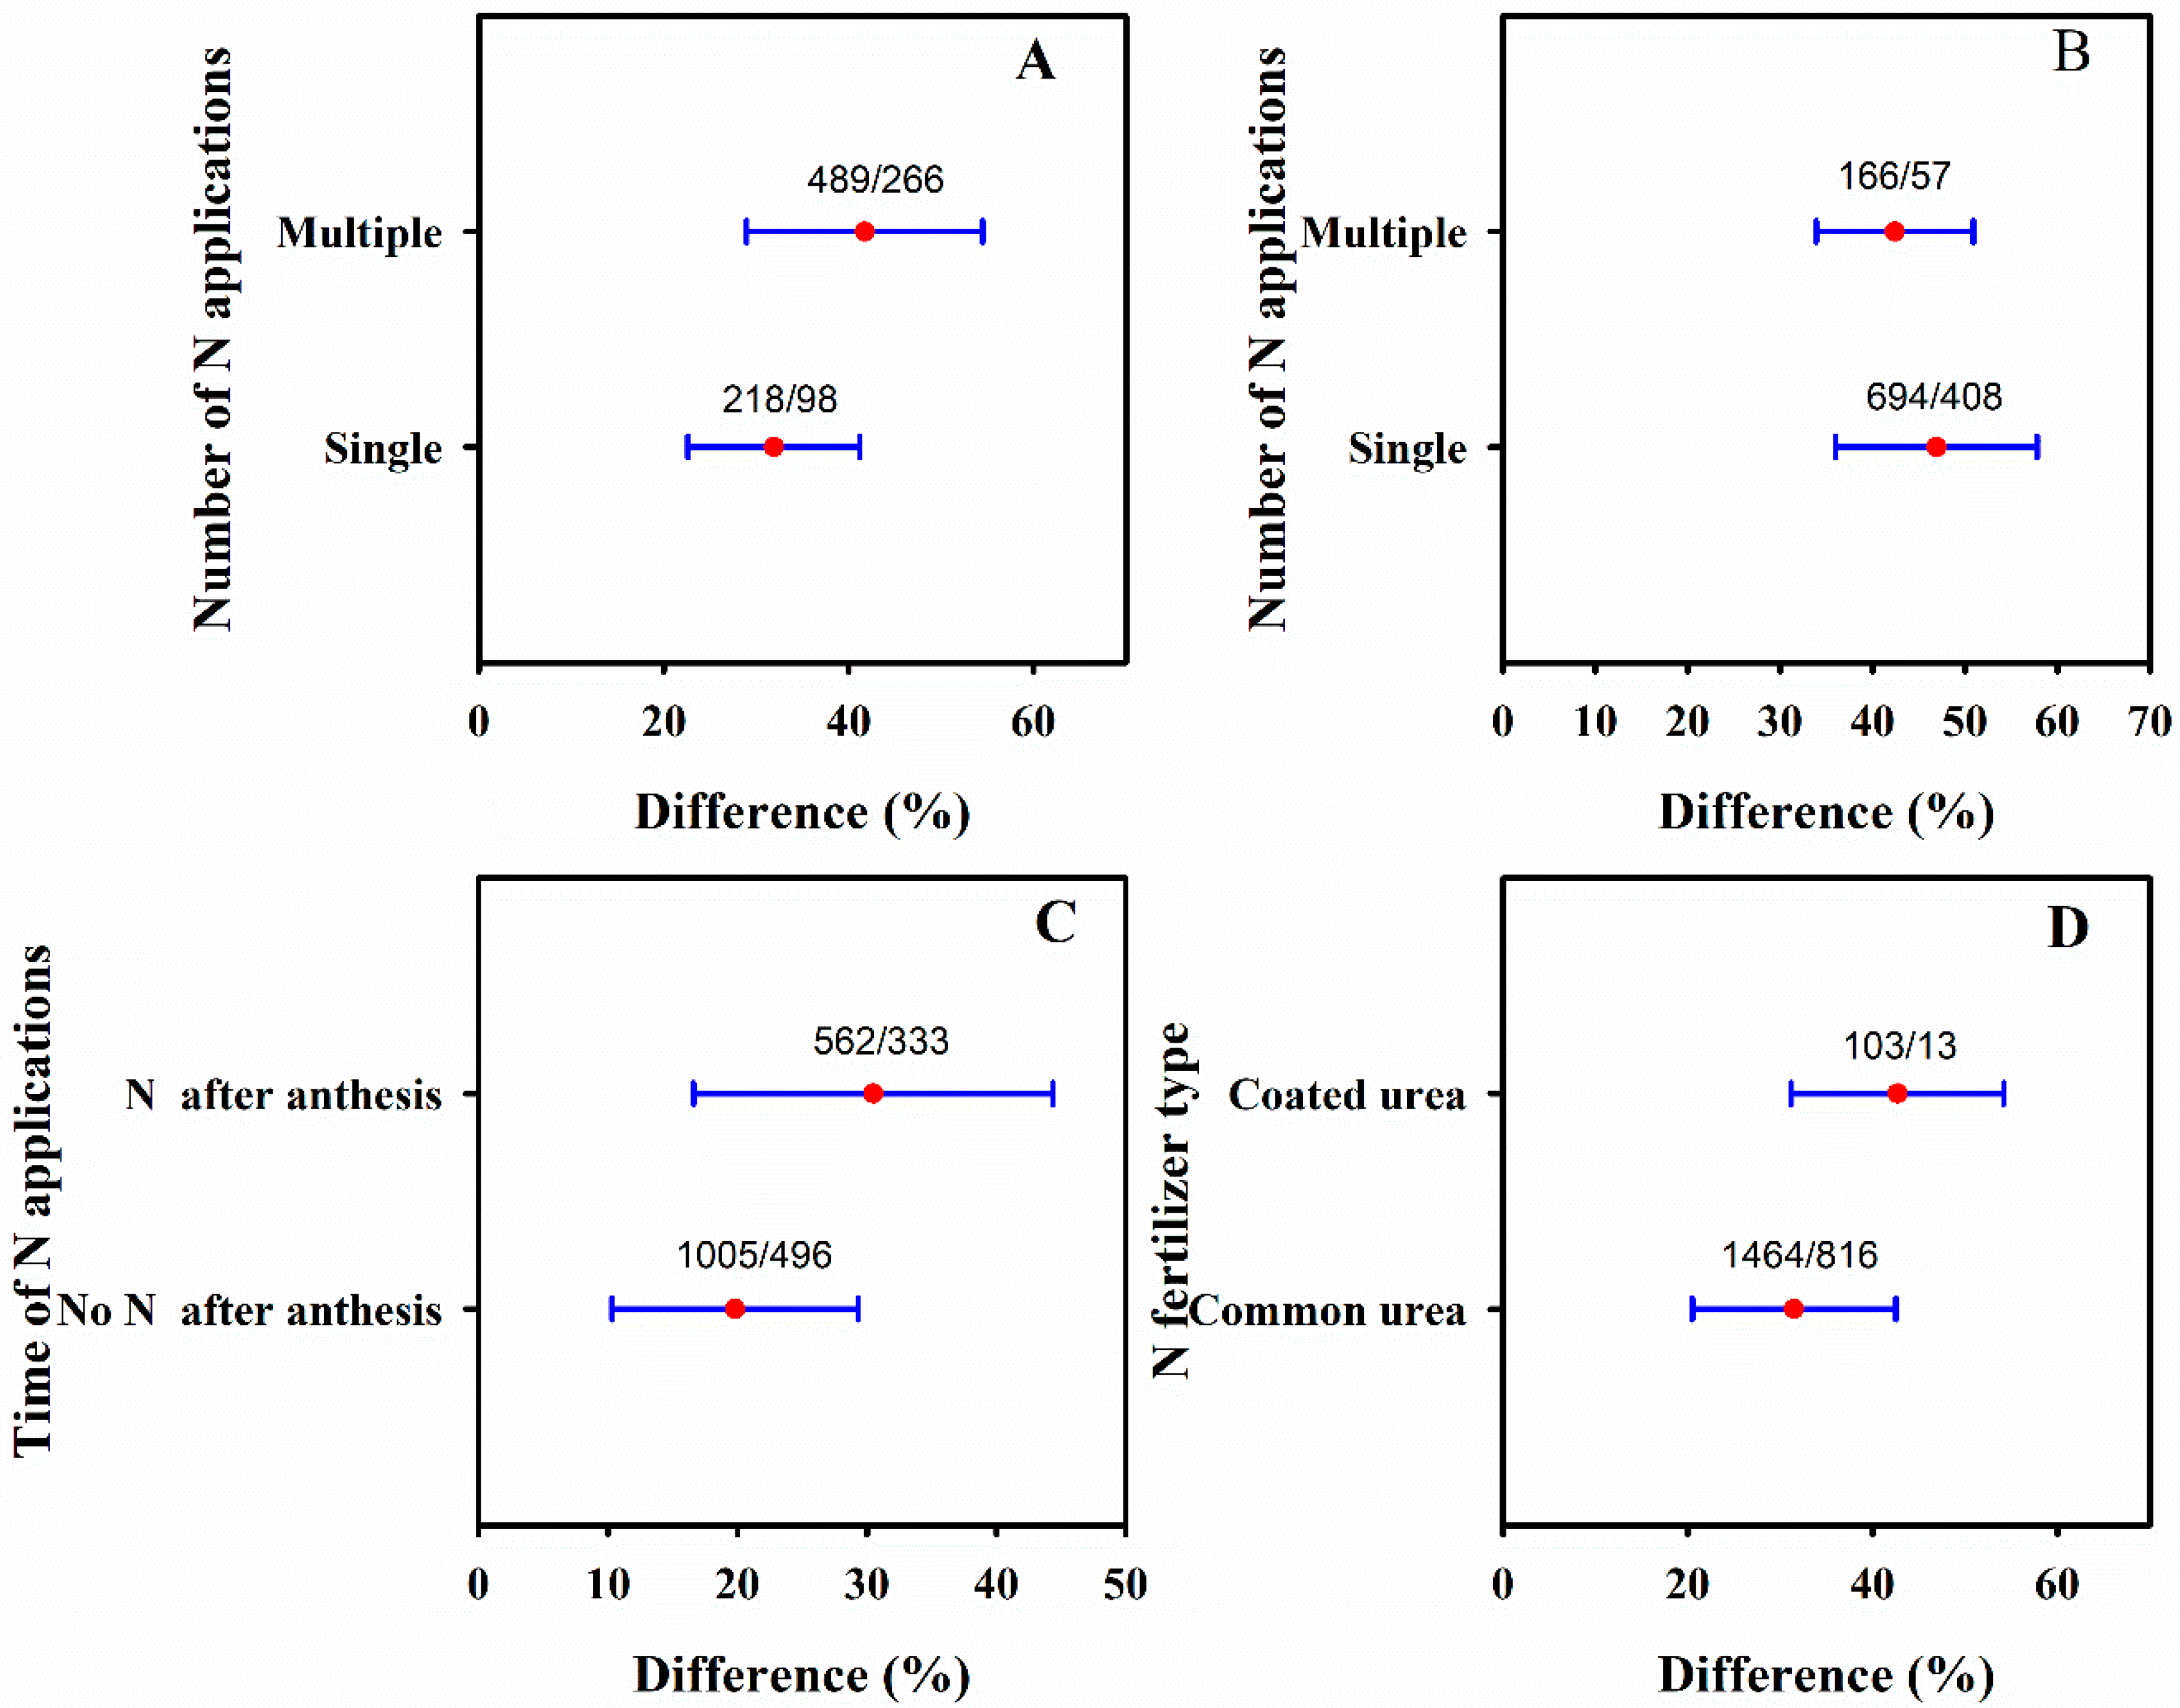
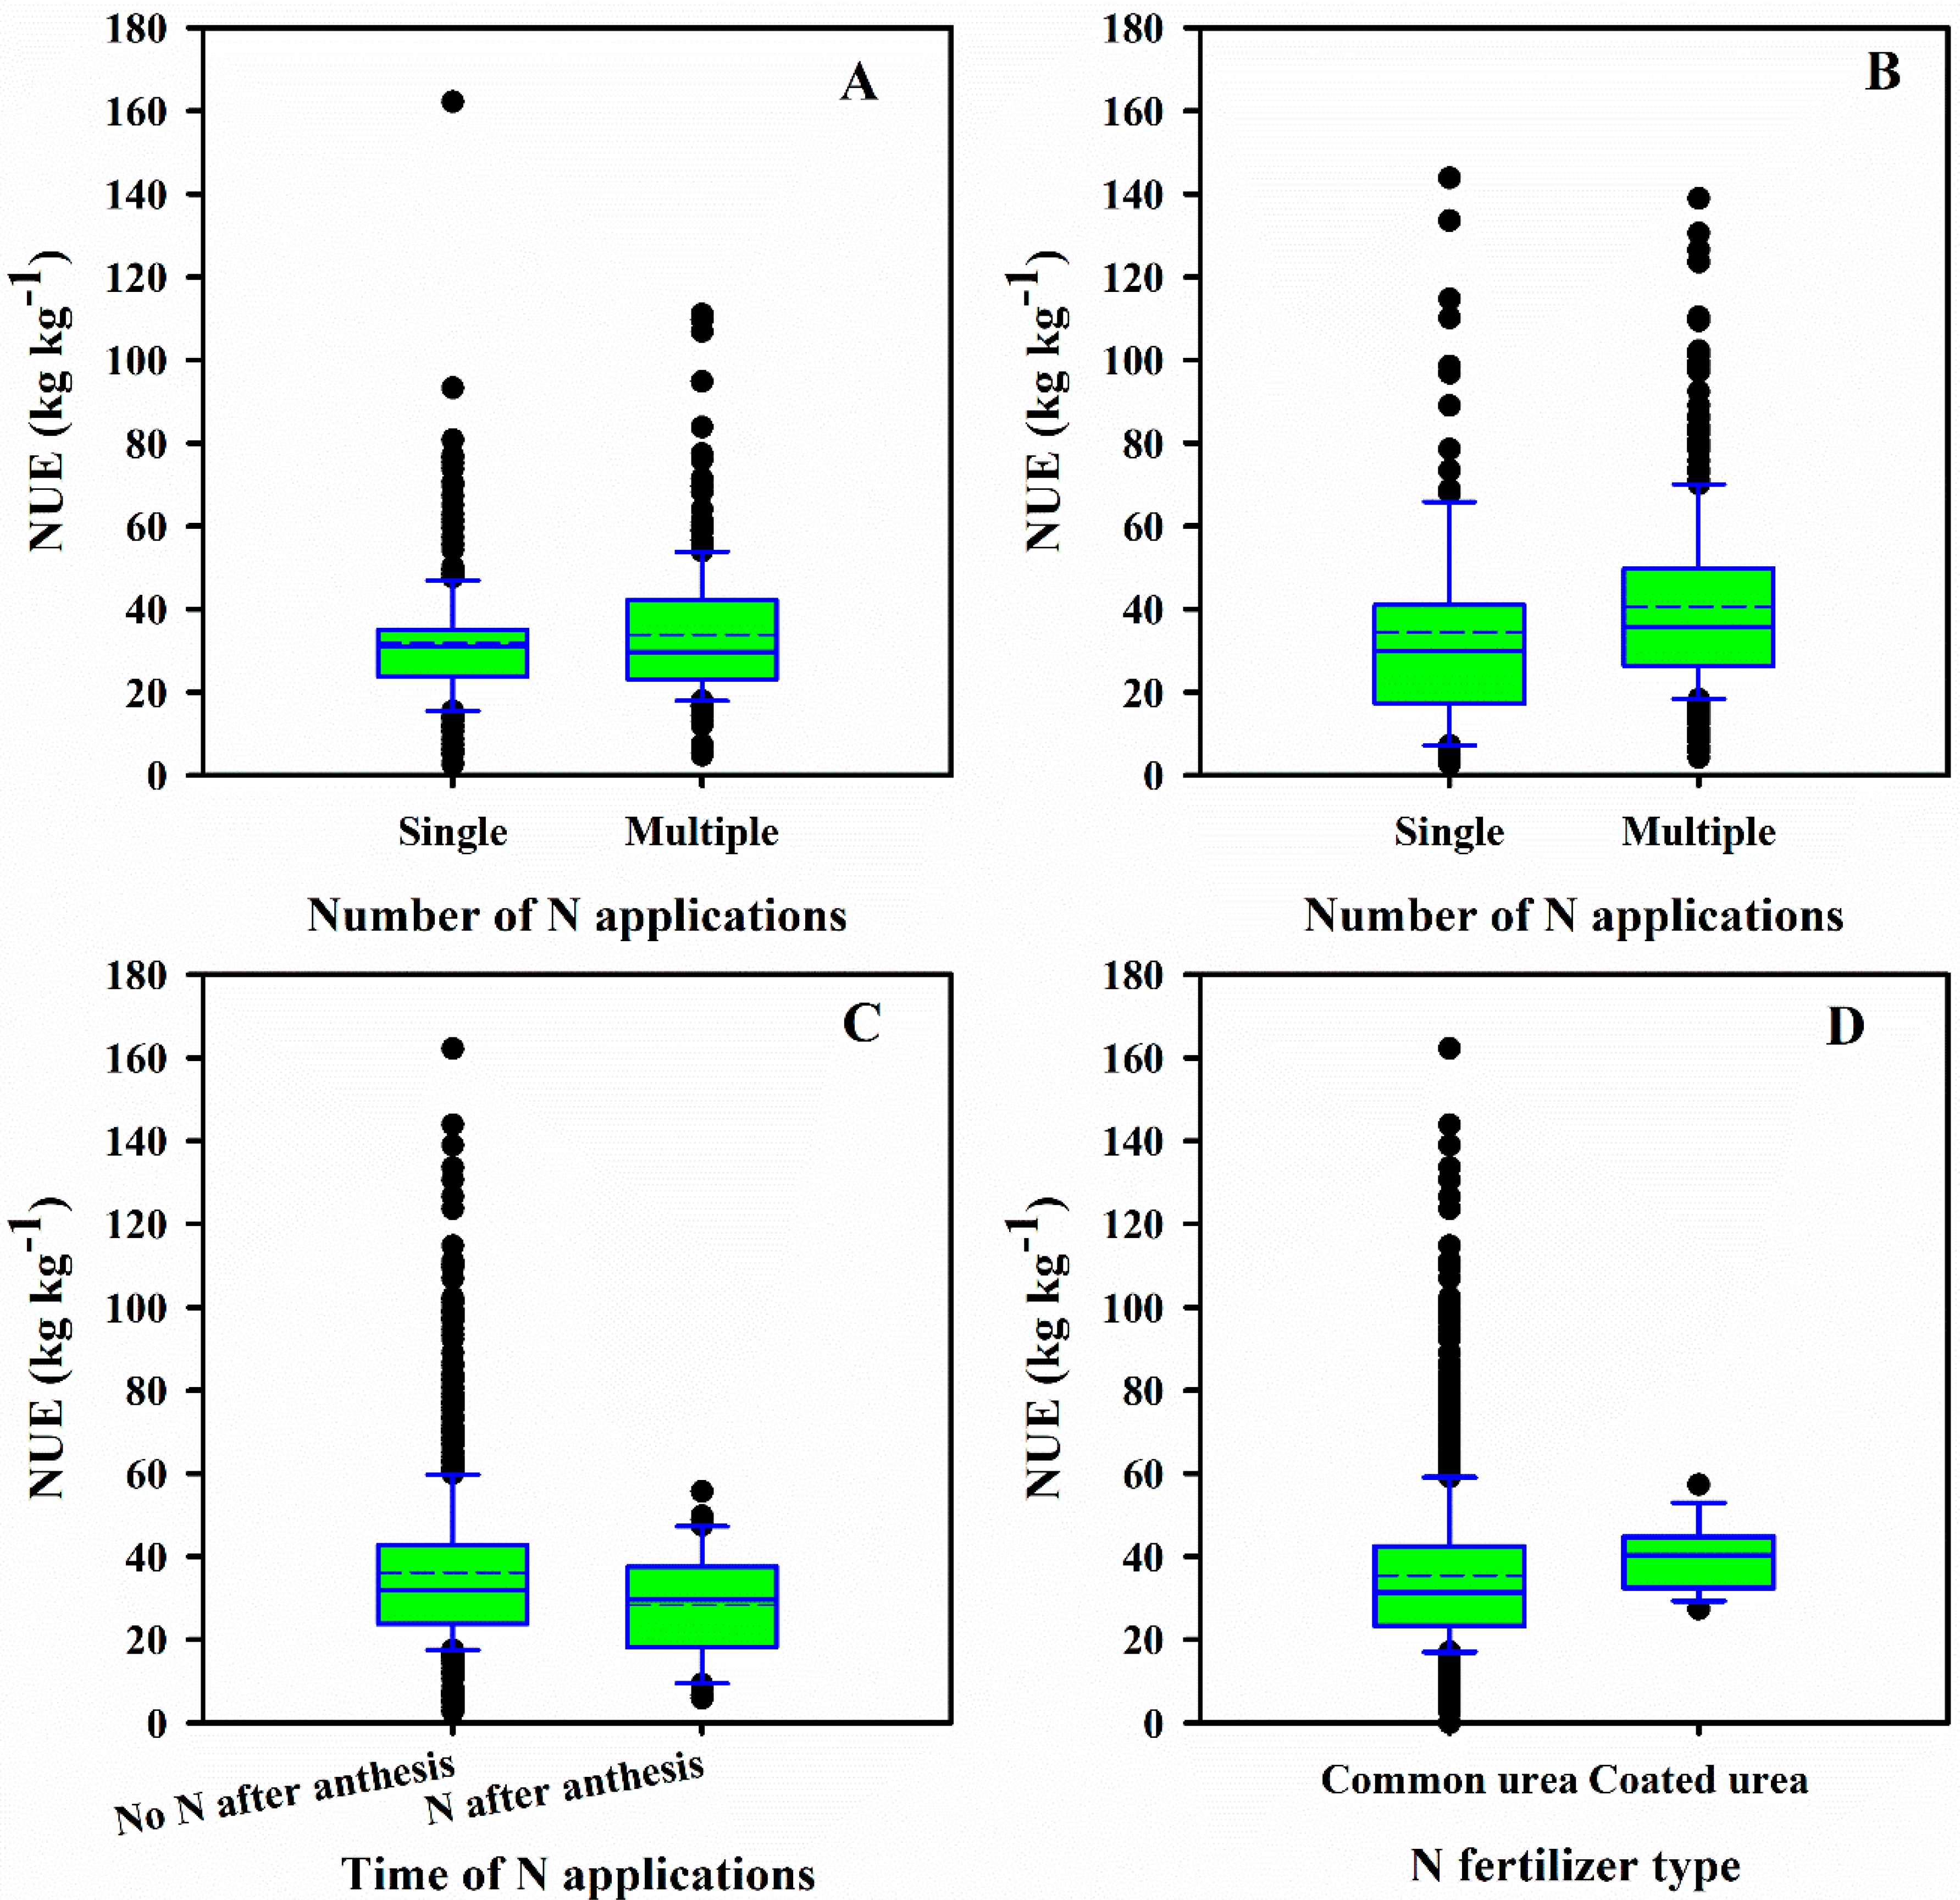
3.4. Impact of N Management Practices

The response of yield to N fertilizer treatment differed according to whether there was one, or multiple N applications under rainfed and irrigated conditions in different regions (Figure 9A,B, Table 1). The increase in yield associated with a single N application was less than that associated with multiple N applications under rainfed conditions (Figure 9A), while the increase in yield was greater with a single N application than with multiple N applications under irrigated conditions (Figure 9B). The greater increase in yield under multiple N applications compared to a single N application was also detected in Northwest, North, and South China (Table 1). The single N application increased ear number in Northwest China, while the multiple N applications increased ear number in South China (Table 1). The increase in yield associated with a single N application was less than that associated with multiple N applications in North China (Table 1). The single and multiple N applications increased kernel number per ear in all three regions (Table 1). The single and multiple N applications significantly decreased thousand-kernel weight in Northwest and South China, while they significantly increased thousand-kernel weight in north China (Table 1).
Averaged across all geographic locations, the yields were higher under N application after anthesis than under no N application after anthesis (Figure 9C). In Northwest China, the increase in yield was greater under N application after anthesis than under no N application after anthesis, whereas the increase in yield was greater under no N application after anthesis than under N application after anthesis in North China (Table 1). The no N application after anthesis increased yield, ear number, and kernel number per ear, but decreased thousand-kernel weight in northwest and South China (Table 1). The increase in ear number and kernel number per ear was greater under no N application after anthesis than under N application after anthesis, and the no N after anthesis increased thousand-kernel weight in North China (Table 1).
There was a 42.7%, 44.9%, and 45.2% increase in wheat yield using coated urea versus a 31.5%, 31.6%, and 38.6% increase using standard urea in averaged across all geographic locations, Northwest, and North China, respectively (Figure 9D, Table 1). The increase in ear number was higher with common urea than coated urea, while the increase in kernel number per ear was lower with common urea than coated urea in North China (Table 1). The common urea increased thousand-kernel weight (Table 1).
The wheat NUE varied with the number of N applications, the time of N application, and N fertilizer type in Northwest, North, and South China (Figure 10, Figure 11, Figure 12 and Figure 13). The mean NUE was higher with multiple N applications than with a single N application under rainfed conditions (Figure 10A), the median and mean NUEs were higher with multiple N applications than with a single N application under irrigated conditions, averaged across all geographic locations (Figure 10B). The mean and median NUEs were higher with a single N application than with multiple N applications in Northwest China, while the mean and median NUEs were lower with a single N application than with multiple N applications in North China (Figure 11). The mean NUE was higher with a single N application than with multiple N applications in South China, while the median NUE was lower with a single N application than with multiple N applications in south China (Figure 11).
Averaged across all geographic locations, non-application of N after anthesis resulted in higher median and mean NUE values compared with N application after anthesis (Figure 10C); similar results were found in Northwest and North China (Figure 12). The median and mean NUEs were higher with coated urea application versus standard urea application when averaged across all geographic locations (Figure 10D), as well as in the northwest and north regions of China (Figure 13).

4. Discussion

4.1. Climate

Wheat N fertilizer is influenced by weather such as the temperature as well as the amount and frequency of rainfall during the growing season [24]. Wheat is one of the most sensitive crops to high temperature [25]. The upper optimum temperature limit for wheat during anthesis and grain-filling has been reported to be around 34 °C [26], and temperature higher than this seriously reduces grain yield [27] because the rising temperature above 25–35 °C would shorten the grain-filling period and reduce wheat yield [28]. These results showed that yield-increasing effects were higher under the average annual temperature of >15 °C than <13 °C, and lower than 13–15 °C (Figure 5B). In addition, a positive and significant (p < 0.001) linear relation was detected between the lnR of yield and AT (Figure 14A). Rainfall is another important factor that regulates wheat growth. The sensitive growth stage of wheat to water stress is from elongation to booting, followed by anthesis and grain-filling [29]. The effect of N fertilizer on wheat yield varied with the variability of average annual precipitation in this meta-analysis (Figure 5C). The wheat yield variability was explained by rainfall amount during the period of flowering [30]. In addition, when wheat faces a shortage of water in China, the yield depends on both in-season rainfall and the amount of soil water stored in the soil before the growing season [31,32], and thus the yield fluctuated according to the rainfall. In addition, there was linear relationship between the lnR of yield and AP (Figure 14B).

4.2. Soil Factors

Soil texture, total N, available N, and pH, are key factors modulating the effect of N fertilizer on wheat yield. Soil texture is an important soil parameter that affects crop productivity, due to its significant influence on N mineralization [33], soil organic matter storage [34], crop N requirements [35], and microbial biomass [36]. Our results showed that there was a greater increase in yield under conditions of coarse soil texture versus fine and medium soil textures (Figure 7A). A study also showed that N fertilization and soil textural group effects were significant on all measured parameters and their interaction was significant on grain protein content, thousand-kernel weight, test weight, and chlorophyll meter readings [24]. Soil N also influenced effects of N fertilizer on crop yield, and the lnR was found to decrease with the increase soil total N and available N (Figure 15A,B). The application of N fertilizer or the incorporation of legumes greatly improves the N economy of cereal cropping systems and enhances crop productivity in soils with a soil low N content [37]; this is consistent with our results in Figure 7C. A study also showed that long-term N application at high rates increased soil total N and available N in the surface of soils with low soil N, resulting in a greater yield [38]. In addition, soil pH was an important factor affecting the increasing yield effects of N fertilizer. These results showed that the increase in wheat yield was lower under a soil pH of 7–8 than under soil pH levels of ≤7 and >8 (Figure 7D). The most likely mechanism by which soil pH regulated the effect of N fertilizer was by affecting NH3 volatilization [15]. Neutral to alkaline soils incur higher N losses through NH3 volatilization [39], and thus decreases in yield. However, in alkaline soils, applying N fertilizer could offset N losses through NH3 volatilization, resulting in yield increases (Figure 7D). Moreover, lower nitrification rates may reduce soil acidification, which in alkaline soils may result in the prolongation of an elevated pH and a consequent increase in NH3 volatilization [40]. By contrast, a study showed that higher yields and N uptakes were associated with higher soil pH levels in rice systems [41], and a higher increase in yield was also observed under a soil pH of >8 in our analysis (Figure 7D).

4.3. N Management Practices

Apart from climate and soil factors, N fertilizer management practices such as the number and timing of N applications and the type of fertilizer [6,42] also influenced the wheat yield. Increased irrigation enhanced the leaching of soil nitrate–nitrogen [43]. Our results showed that the increased yield associated with a single N application was less than that associated with multiple applications under rainfed conditions (Figure 9A), while the yield was higher with a single versus multiple N applications under irrigated conditions (Figure 9B). Under rainfed conditions, crop responses to N fertilization depend heavily on soil water availability, in turn related to the amount and distribution of rainfall during the crop cycle; a split N application coinciding with rain distribution produced a greater effect on yield than a single N application [44], and similar results were observed in Northwest and South China. Similarly, under irrigation, more nitrates may be leached with single versus split N application. In addition, the accumulation of nitrate–nitrogen in the 0–200-cm soil layers in much of China’s farmland is the result of a long period of uninhibited use of N fertilizers [45], and thus irrigation easily increased the risk of N leaching [46]. Applying N after anthesis produces a greater effect on yield in the Northwest China (Figure 9C, Table 1), while a study indicated that late nitrogen uptake is less associated with yield improvements [47], and no N application after anthesis significantly increased wheat yield as compared with N application after anthesis (Table 1). It is considered that grain nitrogen (and therefore protein) yield is more source-limited than dry matter yield during grain growth [48]. As a result, the difference in effects of applying N after anthesis on wheat yield between this study and other studies may be related to the experimental environments. The controlled-release urea improved the yield in several production systems [49], and this is consistent with our results (Figure 9D, Table 1), as are reports on rice yield [50].

4.4. Limitations

Although many variations were discussed in the present study, effects of N fertilizer on wheat yield are impacted by several factors that were not considered here as result of insufficient information. First, because grain yield responses to N fertilizer varied greatly from year to year, resulting from the variability in weather conditions, the interaction among all factors (e.g., climate, soil factors, and N management practices) should be examined. Second, the overuse of N fertilizer often results in the occurrence of lodging, pests, and diseases, which affect the yield-increasing effect of N fertilizer. Finally, it is necessary to note the importance of experimental site-dependent controls and site-specific effects.

5. Conclusions

In this study, we evaluated a range of agronomic and environmental factors affecting wheat yield and NUE under N fertilizer application in China. Our results indicated that N fertilizer had significant effects on the yield and NUE of wheat. The responses of wheat yield and NUE to N fertilizer varied by climate (i.e., precipitation and temperature), soil factors (soil texture, total N, available N, and pH), irrigation patterns, and N management practices in different regions of China. Consequently, a combination of approaches should be considered to promote N fertilizer use. This meta-analysis quantified the impact on wheat yield of N fertilizer based on the available scientific data, providing a basis for conducting synthesis analyses to support the development and improvement of N fertilizer wheat management under various conditions in China. Our results may be used as a basis for modeling the interactions among agronomic inputs, to quantify productivity gains and production costs for wheat, and to determine the optimum N fertilizer management practices.

Supplementary Materials

The following are available online at https://www.mdpi.com/2071-1050/10/10/3533/s1. Supplementary Information S1: References for publications used in the meta-analysis, Table S1: Characteristics of the researches used in the meta-analysis.

Author Contributions

Conceptualization by Y.W., R.Z., and Z.J.; Y.W. and J.Y. collected the meta-analysis source data; Y.W. analyzed the data; Y.W. wrote the paper.

Funding

This research was funded by the Doctoral Scientific Research Foundation of Northwest A&F University, grant number Z109021711.

Acknowledgments

We were grateful for the constructive comments on this manuscript from the anonymous reviewers and editors. My wife also gave me much encouragement in the process of writing the paper.

Conflicts of Interest

The authors declare no conflicts of interest.

References

  1. Cui, Z.; Zhang, F.; Chen, X.; Dou, Z.; Li, J. In-season nitrogen management strategy for winter wheat: Maximizing yields, minimizing environmental impact in an over-fertilization context. Field Crops Res. 2010, 116, 140–146. [Google Scholar] [CrossRef]
  2. Zhou, X.; Wang, H.; Chen, Q.; Ren, J. Coupling effects of depth of film-bottomed tillage and amount of irrigation and nitrogen fertilizer on spring wheat yield. Soil Tillage Res. 2007, 94, 251–261. [Google Scholar] [CrossRef]
  3. Guo, S.; Zhu, H.; Dang, T.; Wu, J.; Liu, W.; Hao, M.; Li, Y.; Syers, J.K. Winter wheat grain yield associated with precipitation distribution under long-term nitrogen fertilization in the Semiarid Loess Plateau in China. Geoderma 2012, 189–190, 442–450. [Google Scholar] [CrossRef]
  4. Dai, J.; Wang, Z.; Li, M.; He, G.; Li, Q.; Cao, H.; Wang, S.; Gao, Y.; Hui, X. Winter wheat grain yield and summer nitrate leaching: Long-term effects of nitrogen and phosphorus rates on the Loess Plateau of China. Field Crops Res. 2016, 196, 180–190. [Google Scholar] [CrossRef]
  5. Fang, Q.; Yu, Q.; Wang, E.; Chen, Y.; Zhang, G.; Wang, J.; Li, L. Soil nitrate accumulation, leaching and crop nitrogen use as influenced by fertilization and irrigation in an intensive wheat–maize double cropping system in the North China Plain. Plant Soil 2006, 284, 335–350. [Google Scholar] [CrossRef] [Green Version]
  6. Wang, Z.H.; Miao, Y.F.; Li, S.X. Effect of ammonium and nitrate nitrogen fertilizers on wheat yield in relation to accumulated nitrate at different depths of soil in drylands of China. Field Crops Res. 2015, 183, 211–224. [Google Scholar] [CrossRef]
  7. Liu, R.; Kang, Y.; Pei, L.; Wan, S.; Liu, S.; Liu, S. Use of a new controlled-loss-fertilizer to reduce nitrogen losses during winter wheat cultivation in the Danjiangkou Reservoir Area of China. Commun. Soil Sci. Plant Anal. 2016, 47, 1137–1147. [Google Scholar] [CrossRef]
  8. Fan, X.; Li, F.; Liu, F.; Kumar, D. Fertilization with a new type of coated urea: Evaluation for nitrogen efficiency and yield in winter wheat. J. Plant Nutr. 2004, 27, 853–865. [Google Scholar] [CrossRef]
  9. Li, W.; Han, X.; Zhang, Y.; Li, Z. Effects of elevated CO2 concentration, irrigation and nitrogenous fertilizer application on the growth and yield of spring wheat in semi-arid areas. Agric. Water Manag. 2007, 87, 106–114. [Google Scholar] [CrossRef]
  10. Zheng, W.; Liu, Z.; Zhang, M.; Shi, Y.; Zhu, Q.; Sun, Y.; Zhou, H.; Li, C.; Yang, Y.; Geng, J. Improving crop yields, nitrogen use efficiencies, and profits by using mixtures of coated controlled-released and uncoated urea in a wheat-maize system. Field Crops Res. 2017, 205, 106–115. [Google Scholar] [CrossRef]
  11. Schulz, R.; Makary, T.; Hubert, S.; Hartung, K.; Gruber, S.; Donath, S.; Döhler, J.; Weiβ, K.; Ehrhart, E.; Claupein, W.; et al. Is it necessary to split nitrogen fertilization for winter wheat? On-farm research on luvisols in south-west Germany. J. Agric. Sci. 2015, 153, 575–587. [Google Scholar] [CrossRef]
  12. Geleto, T.; Tanner, D.G.; Mamo, T.; Gebeyehu, G. Response of rainfed bread and durum wheat to source, level, and timing of nitrogen fertilizer on two ethiopian vertisols. 1. yield and yield components. Commun. Soil Sci. Plant. Anal. 2008, 26, 1773–1794. [Google Scholar] [CrossRef]
  13. Yi, Q.; He, P.; Zhang, X.Z.; Yang, L.; Xiong, G.Y. Optimizing fertilizer nitrogen for winter wheat production in Yangtze River region in China. J. Plant Nutr. 2015, 38, 1639–1655. [Google Scholar] [CrossRef]
  14. Miguez, F.H.; Pérez, A.A.; Frasco, J.A.; Zapiola, M.L. Meta-analysis of nitrogen fertilization effects on wheat grain protein in Argentina. Open Sci. Repos. Agric. 2013, e70081981. [Google Scholar] [CrossRef]
  15. Abalos, D.; Jeffery, S.; Sanz-Cobena, A.; Guardia, G.; Vallejo, A. Meta-analysis of the effect of urease and nitrification inhibitors on crop productivity and nitrogen use efficiency. Agric. Ecosyst. Environ. 2014, 189, 136–144. [Google Scholar] [CrossRef]
  16. Pelzer, E.; Hombert, N.; Jeuffroy, M.; Makowski, D. Meta-analysis of the effect of nitrogen fertilization on annual cereal–legume intercrop production. Agron. J. 2015, 106, 1775–1786. [Google Scholar] [CrossRef]
  17. Ding, W.; Xu, X.; He, P.; Ullah, S.; Zhang, J.; Cui, Z.; Zhou, W. Improving yield and nitrogen use efficiency through alternative fertilization options for rice in China: A meta-analysis. Field Crops Res. 2018, 227, 11–18. [Google Scholar] [CrossRef]
  18. Hedges, L.V.; Gurevitch, J.; Curtis, P.S. The meta-analysis of response ratios in experimental ecology. Ecology 1999, 80, 1150–1156. [Google Scholar] [CrossRef]
  19. Dobermann, A.R. Nitrogen Use Efficiency—State of the Art. Agronomy & Horticulture—Faculty Publications. 2005. Available online: http://digitalcommons.unl.edu/agronomyfacpub/316 (accessed on 20 September 2018).
  20. Tummers, B. DataThief III. 2006. Available online: http://datathief.org/ (accessed on 20 August 2017).
  21. Daryanto, S.; Wang, L.; Jacinthe, P.A. Global synthesis of drought effects on food legume production. PLoS ONE 2015, 10, e0127401. [Google Scholar] [CrossRef] [PubMed] [Green Version]
  22. Adams, D.C.; Gurevitch, J.; Rosenberg, M.S. Resampling tests for meta-analysis of ecological data. Ecology 1997, 78, 1277–1283. [Google Scholar] [CrossRef]
  23. Wang, Y.; Zhang, Y.; Zhou, S.; Wang, Z. Meta-analysis of no-tillage effect on wheat and maize water use efficiency in China. Sci. Total Environ. 2018, 635, 1372–1382. [Google Scholar] [CrossRef] [PubMed]
  24. Nyiraneza, J.; Cambouris, A.N.; Ziadi, N.; Tremblay, N.; Nolin, M.C. Spring wheat yield and quality related to soil texture and nitrogen fertilization. Agron. J. 2012, 104, 589–599. [Google Scholar] [CrossRef]
  25. Satorre, E.H.; Slafer, G.A. (Eds.) Wheat: Ecology and Physiology of Yield Determination; Food Products Press: New York, NY, USA, 1999; p. 503. [Google Scholar]
  26. Farooq, M.; Bramley, H.; Palta, J.A.; Siddique, K.H.M. Heat stress in wheat during reproductive and grain-filling phases. Crit. Rev. Plant Sci. 2011, 30, 491–507. [Google Scholar] [CrossRef]
  27. Ferris, R.; Ellis, R.H.; Wheeler, T.R.; Hadley, P. Effect of high temperature stress at anthesis on grain yield and biomass of field-grown crops of wheat. Ann. Bot. 1998, 82, 631–639. [Google Scholar] [CrossRef]
  28. Hatfield, J.L.; Boote, K.J.; Kimball, B.A.; Ziska, L.H.; Izaurralde, R.C.; Ort, D.; Thomson, A.M.; Wolfe, D. Climate impacts on agriculture: Implications for crop production. Agron. J. 2011, 103, 351–370. [Google Scholar] [CrossRef]
  29. Zhang, H.; Oweis, T. Water–yield relations and optimal irrigation scheduling of wheat in the Mediterranean region. Agric. Water Manag. 1999, 38, 195–211. [Google Scholar] [CrossRef]
  30. Takashima, N.E.; Rondanini, D.P.; Puhl, L.E.; Miralles, D.J. Environmental factors affecting yield variability in spring and winter rapeseed genotypes cultivated in the southeastern argentine pampas. Eur. J. Agron. 2013, 48, 88–100. [Google Scholar] [CrossRef]
  31. Unger, P.W.; Payne, W.A.; Peterson, G.A. Water conservation and efficient use. In Dryland Agriculture; Peterson, G.A., Unger, P.W., Payne, W.A., Eds.; Agronomy Monograph 23; American Society of Agronomy, Crop Science Society of America, Soil Science Society of America: Madison, WI, USA, 2006; pp. 39–86. [Google Scholar]
  32. Schillinger, W.F.; Schofstoll, S.E.; Alldredge, J.R. Available water and wheat grain yield relations in a Mediterranean climate. Field Crops Res. 2008, 109, 45–49. [Google Scholar] [CrossRef]
  33. Meyer, N.; Welp, G.; Rodionov, A.; Borchard, N.; Martius, C.; Amelung, W. Nitrogen and phosphorus supply controls soil organic carbon mineralization in tropical topsoil and subsoil. Soil Biol. Biochem. 2018, 119, 152–161. [Google Scholar] [CrossRef]
  34. Zinn, Y.L.; Andrade, A.B.; Araujo, M.A.; Lal, R. Soil organic carbon retention more affected by altitude than texture in a forested mountain range in Brazil. Soil Res. 2018, 56, 284–295. [Google Scholar] [CrossRef]
  35. Shah, G.A.; Shah, G.M.; Rashid, M.I.; Jcj, G.; Traore, B.; Lantinga, E.A. Bedding additives reduce ammonia emission and improve crop N uptake after soil application of solid cattle manure. J. Environ. Manag. 2018, 209, 195–204. [Google Scholar] [CrossRef] [PubMed]
  36. D’Hose, T.; Molendijk, L.; Vooren, L.V.; Berg, W.V.D.; Hoek, H.; Runia, W.; van Evert, F.; ten Berge, H.; Spiegel, H.; Sandèn, T.; et al. Responses of soil biota to non-inversion tillage and organic amendments: An analysis on European multiyear field experiments. Pedobiologia 2018, 66, 18–28. [Google Scholar] [CrossRef]
  37. Pandiaraj, T.; Selvaraj, S.; Ramu, N. Effects of crop residue management and nitrogen fertilizer on soil nitrogen and carbon content and productivity of wheat (Triticum aestivum L.) in two cropping systems. J. Agric. Sci. Technol. 2018, 17, 249–260. [Google Scholar]
  38. Aula, L.; Macnack, N.; Omara, P.; Mullock, J.; Raun, W. Effect of fertilizer nitrogen (N) on soil organic carbon, total N, and soil pH in long-term continuous winter wheat (Triticum aestivum L.). Commun. Soil Sci. Plant Anal. 2016, 47, 1–11. [Google Scholar] [CrossRef]
  39. Singh, J.; Bolan, N.S.; Saggar, S.; Zaman, M. The role of inhibitors in controlling the bioavailability and losses of nitrogen. In Chemicals Bioavailability in Terres-Trial Environment; Elsevier: Amsterdam, The Netherlands, 2008; pp. 329–362. [Google Scholar]
  40. Kim, D.G.; Saggar, S.; Roudier, P. The effect of nitrification inhibitors on soil ammonia emissions in nitrogen managed soils: A meta-analysis. Nutr. Cycl. Agroecosyst. 2012, 93, 51–64. [Google Scholar] [CrossRef]
  41. Linquist, B.A.; Lijun, L.; van Kessel, C.; van Groenigen, K.J. Enhanced efficiency nitrogen fertilizers for rice systems: Meta-analysis of yield and nitrogen uptake. Field Crops Res. 2013, 154, 246–254. [Google Scholar] [CrossRef]
  42. Fowler, D.B.; Brydon, J.; Darroch, B.A.; Entz, M.H.; Johnston, A.M. Environment and genotype influence on grain protein concentration of wheat and rye. Agron. J. 1990, 82, 655–664. [Google Scholar] [CrossRef]
  43. Behera, S.K.; Panda, R.K. Effect of fertilization and irrigation schedule on water and fertilizer solute transport for wheat crop in a sub-humid sub-tropical region. Agric. Ecosyst. Environ. 2009, 130, 141–155. [Google Scholar] [CrossRef]
  44. Basso, B.; Cammarano, D.; Troccoli, A.; Chen, D.; and Ritchie, J.T. Long-term wheat response to nitrogen in a rainfed Mediterranean environment: Field data and simulation analysis. Eur. J. Agron. 2010, 33, 132–138. [Google Scholar] [CrossRef]
  45. Gooding, M.J.; Davies, W.P. Foliar urea fertilization of cereals: A review. Fertil. Res. 1992, 32, 209–222. [Google Scholar] [CrossRef]
  46. Hu, H.Y.; Ning, T.Y.; Li, Z.J.; Han, H.F.; Zhang, Z.Z.; Qin, S.J.; Zheng, Y.H. Coupling effects of urea types and subsoiling on nitrogen-water use and yield of different varieties of maize in northern China. Field Crops Res. 2013, 142, 85–94. [Google Scholar] [CrossRef]
  47. Guo, Z.; Zhang, Y.; Zhao, J.; Shi, Y.; Yu, Z. Nitrogen use by winter wheat and changes in soil nitrate nitrogen levels with supplemental irrigation based on measurement of moisture content in various soil layers. Field Crops Res. 2014, 164, 117–125. [Google Scholar] [CrossRef]
  48. Martre, P.; Porter, J.P.; Jamieson, P.D.; Triboi, E. Modelling grain nitrogen accumulation and protein composition to understand the sink/source regulation of nitrogen remobilisation for wheat. Plant Physiol. 2003, 133, 1959–1967. [Google Scholar] [CrossRef] [PubMed]
  49. Grant, C.A.; Wu, R.; Selles, F.; Harker, K.N.; Clayton, G.W.; Bittman, S.; Zebarth, B.J.; Lupway, N.Z. Crop yield and nitrogen concentration with controlled release urea and split applications of nitrogen as compared to non-coated urea applied at seeding. Field Crops Res. 2012, 127, 170–180. [Google Scholar] [CrossRef]
  50. Li, P.; Lu, J.; Wang, Y.; Wang, S.; Hussain, S.; Ren, T.; Cong, R.; Li, X. Nitrogen losses, use efficiency, and productivity of early rice under controlled-release urea. Agric. Ecosyst. Environ. 2018, 251, 78–87. [Google Scholar] [CrossRef]
Figure 1. Locations of the studies included in the meta-analysis. The map was generated using ArcGIS software (ver. 10.2; ESRI).
Sustainability 10 03533 g001
Figure 2. Schematic illustration of the optimal nitrogen management practices for wheat in northwest, north, and south China.
Sustainability 10 03533 g002
Figure 3. Frequency distributions of the wheat N rate (A), yield (B), and nitrogen use efficiency (NUE), (C) based on the entire dataset.
Sustainability 10 03533 g003
Figure 4. Overview of the wheat N rate (A), yield (B), and NUE (C) in different regions of China. Box-plots show the median (horizontal solid line inside the box) and mean (horizontal dashed line inside the box) values as well as the 25th (lower end of the box) and 75th (upper end of the box) percentiles; whiskers show the 5th and 95th percentiles, and the dots indicate outliers.
Sustainability 10 03533 g004
Figure 5. Percentage difference in yield between the N application treatment and control treatment in different regions of China (A), under different average annual average temperatures (B), and average annual precipitation amounts (C). Error bars are the 95% confidence intervals (CIs). The number of observations is indicated over the CIs.
Sustainability 10 03533 g005
Figure 6. Overview of the wheat NUE under different average annual temperatures (A) and average annual precipitation amounts (B). Box-plots show the median (horizontal solid line inside the box) and mean (horizontal dashed line inside the box) values as well as the 25th (lower end of the box) and 75th (upper end of the box) percentiles; whiskers show the 5th and 95th percentiles, and the dots indicate outliers.
Sustainability 10 03533 g006
Figure 7. Percentage difference in yield between the N application treatment and control treatment under different soil textures (A), total N (B), available N (C), and pH (D). Error bars are the 95% confidence intervals (CIs). The number of observations is indicated over the CIs.
Sustainability 10 03533 g007
Figure 8. An overview of the wheat NUE under different soil textures (A), soil total N (B), available N (C), and pH (D). Box-plots show the median (horizontal solid line inside the box) and mean (horizontal dashed line inside the box) values as well as the 25th (lower end of the box) and 75th (upper end of the box) percentiles; whiskers show the 5th and 95th percentiles, and the dots indicate outliers.
Sustainability 10 03533 g008
Figure 9. Percentage difference in yield between the N application and control treatments according to the number of N applications under rainfed (A) and irrigated (B) conditions, and according to the time of N application (C) and N fertilizer type (D). Error bars are the 95% confidence intervals (CIs). The number of observations is indicated over the CIs.
Sustainability 10 03533 g009
Figure 10. Overview of the wheat NUE according to the number of N applications under rainfed (A) and irrigated (B) conditions, and according to the time of N application (C) and N fertilizer type (D). Box-plots show the median (horizontal solid line inside the box) and mean (horizontal dashed line inside the box) values as well as the 25th (lower end of the box) and 75th (upper end of the box) percentiles; whiskers show the 5th and 95th percentiles, and the dots indicate outliers.
Sustainability 10 03533 g010
Figure 11. Overview of the wheat NUE according to the number of N applications in Northwest, North, and South China. Box-plots show the median (horizontal solid line inside the box) and mean (horizontal dashed line inside the box) values as well as the 25th (lower end of the box) and 75th (upper end of the box) percentiles; whiskers show the 5th and 95th percentiles, and the dots indicate outliers.
Sustainability 10 03533 g011
Figure 12. Overview of the wheat NUE according to the time of N application in Northwest, North, and South China. Box-plots show the median (horizontal solid line inside the box) and mean (horizontal dashed line inside the box) values as well as the 25th (lower end of the box) and 75th (upper end of the box) percentiles; whiskers show the 5th and 95th percentiles, and the dots indicate outliers.
Sustainability 10 03533 g012
Figure 13. Overview of the wheat NUE according to different N fertilizer types in Northwest and North China. Box-plots show the median (horizontal solid line inside the box) and mean (horizontal dashed line inside the box) values as well as the 25th (lower end of the box) and 75th (upper end of the box) percentiles; whiskers show the 5th and 95th percentiles, and the dots indicate outliers.
Sustainability 10 03533 g013
Figure 14. Relationships between the lnR of yield and annual average air temperature (AT), annual average precipitation (AP). *** indicates significance at p < 0.001. ns: not significant at p < 0.05.
Sustainability 10 03533 g014
Figure 15. Relationships between the lnR of yield and total N, available N, soil pH in the 0–20 cm soil layer. ns: not significant at p < 0.05.
Sustainability 10 03533 g015
Table 1. Meta-analysis of yield, ear number, kernel number per ear, and thousand-kernel weight of wheat under different N management practices in Northwest, North, and South China.
RegionsN Management PracticesYieldEar NumberKernel Number per EarThousand-Kernel Weight
ES95% CIES95% CIES95% CIES95% CI
Northwest ChinaNumber of N applicationsSingle0.43735.7–51.70.19214.4–23.90.20613.7–27.4−0.375−61.6–−13.4
Multiple0.49842.0–57.60.009−1.0–2.70.18414.3–22.6−0.042−8.0–−0.4
Time of N application No N after anthesis0.42936.7–49.10.0946.1–12.80.16815.0–18.7−0392−55.1–−23.3
N after anthesis0.64445.8–82.9NANANANANANA
N fertilizer typeCommon urea0.31615.5–47.7NANANANANANA
Coated urea0.44915.6–74.2NANANANANANA
North ChinaNumber of N applicationsSingle0.31127.0–35.10.23112.9–33.20.1107.4–14.70.1756.7–28.2
Multiple0.33030.4–35.70.18216.2–20.20.16815.7–17.90.0231.1–3.5
Time of N applicationNo N after anthesis0.33130.7–35.40.19912.7–27.00.16014.0–18.00.19912.7–27.0
N after anthesis0.24417.9–30.90.16512.7–20.30.0866.2–11.10.012−2.7–5.1
N fertilizer typeCommon urea0.38630.1–47.10.26921.7–32.20.1082.3–19.30.007−2.6–4.1
Coated urea0.45236.2–54.10.24621.0–28.30.1718.1–26.00.0440.5–8.3
South ChinaNumber of N applicationsSingle0.25219.9–30.50.190−5.3–43.20.16412.2–20.6−0.053−6.6–−4.0
Multiple0.61857.6–66.00.43240.8–45.70.19818.0–21.7−0.022−4.2–−0.2
Time of N applicationNo N after anthesis0.58954.7–63.20.40438.1–42.70.19617.8–21.3−0.025−4.4–−0.5
N after anthesisNANANANANANANANA
N fertilizer typeCommon ureaNANANANANANANANA
Coated ureaNANANANANANANANA
ES, effect size; 95% CI, 95% confidence interval; NA, not available. The 95% CIs that do not go across the zero line indicate significant difference between the N application and the control treatment.

