Introduction of Smart Grid Station Configuration and Application in Guri Branch Office of KEPCO


Abstract
:1. Introduction
2. SGS Concept and Features
3. Components Description
3.1. DERs and Operation System
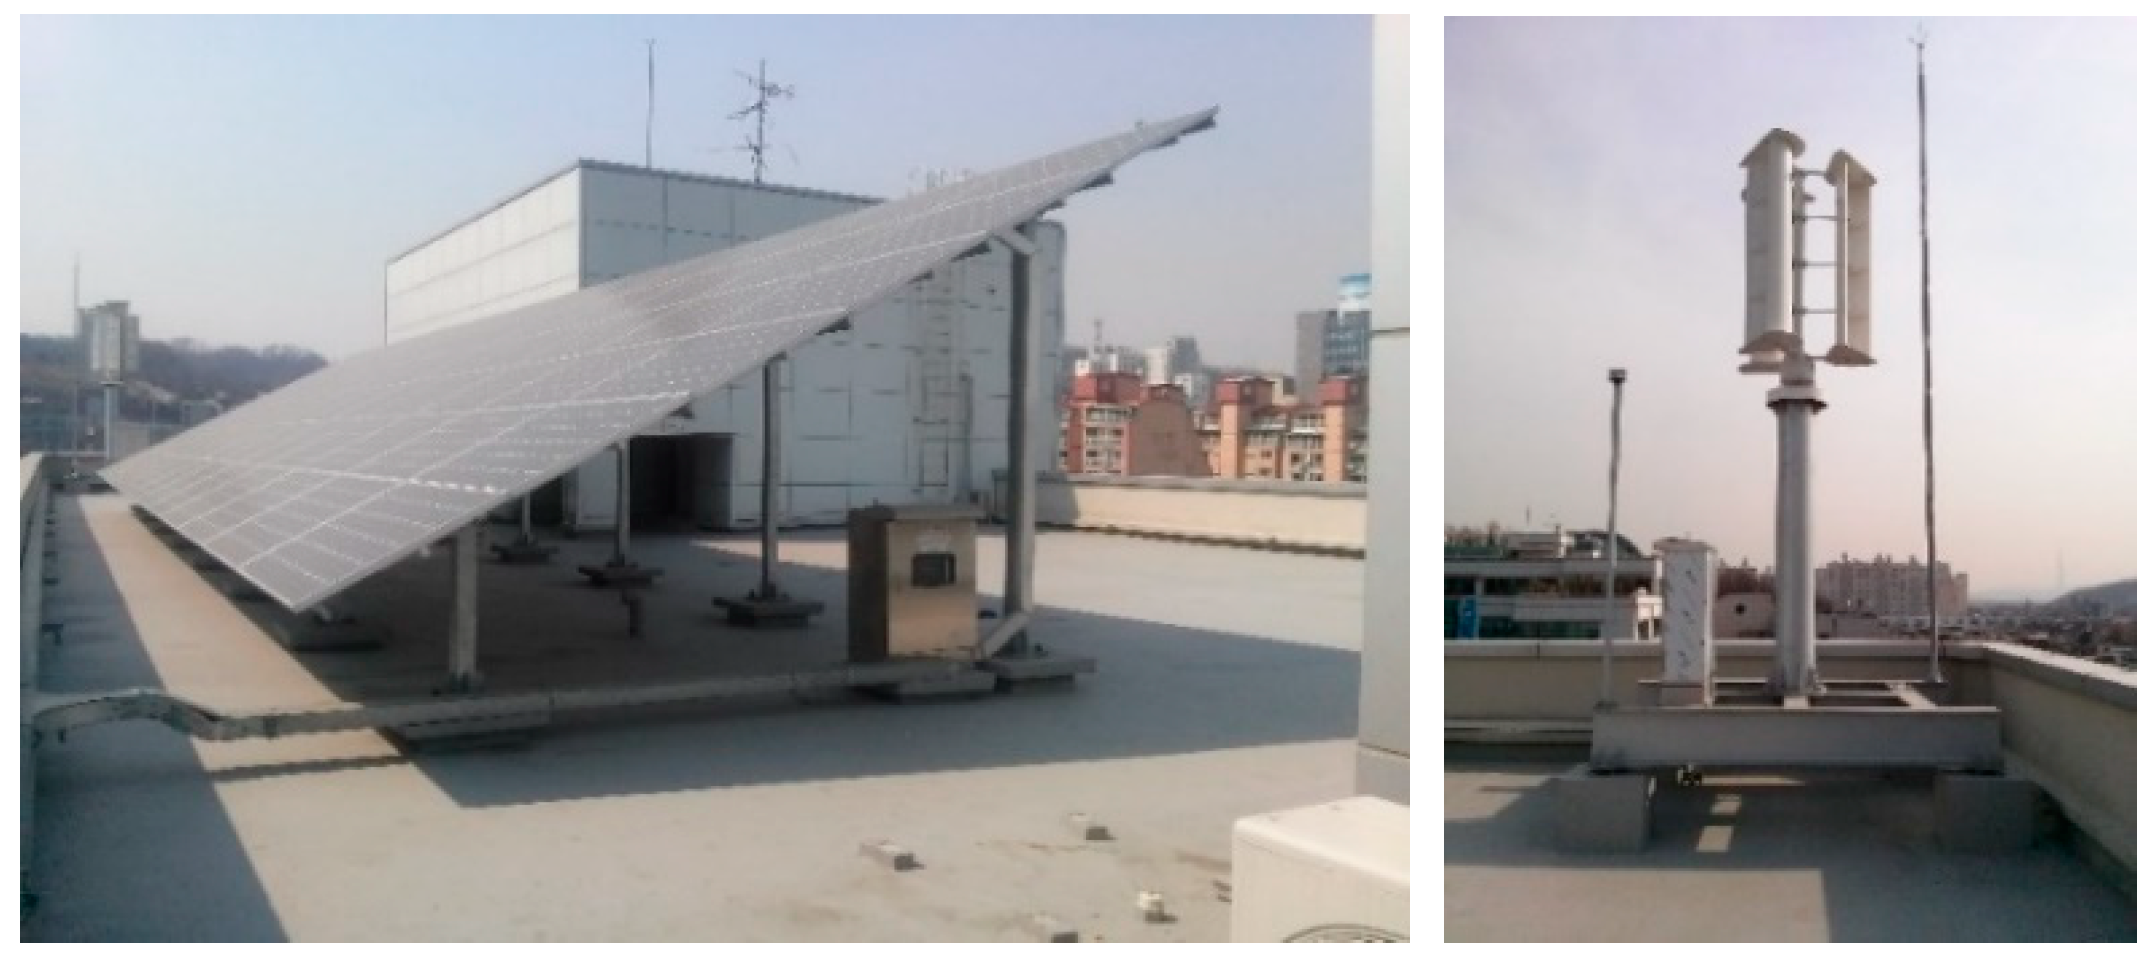
3.1.1. Photovoltaic
3.1.2. Wind Turbine
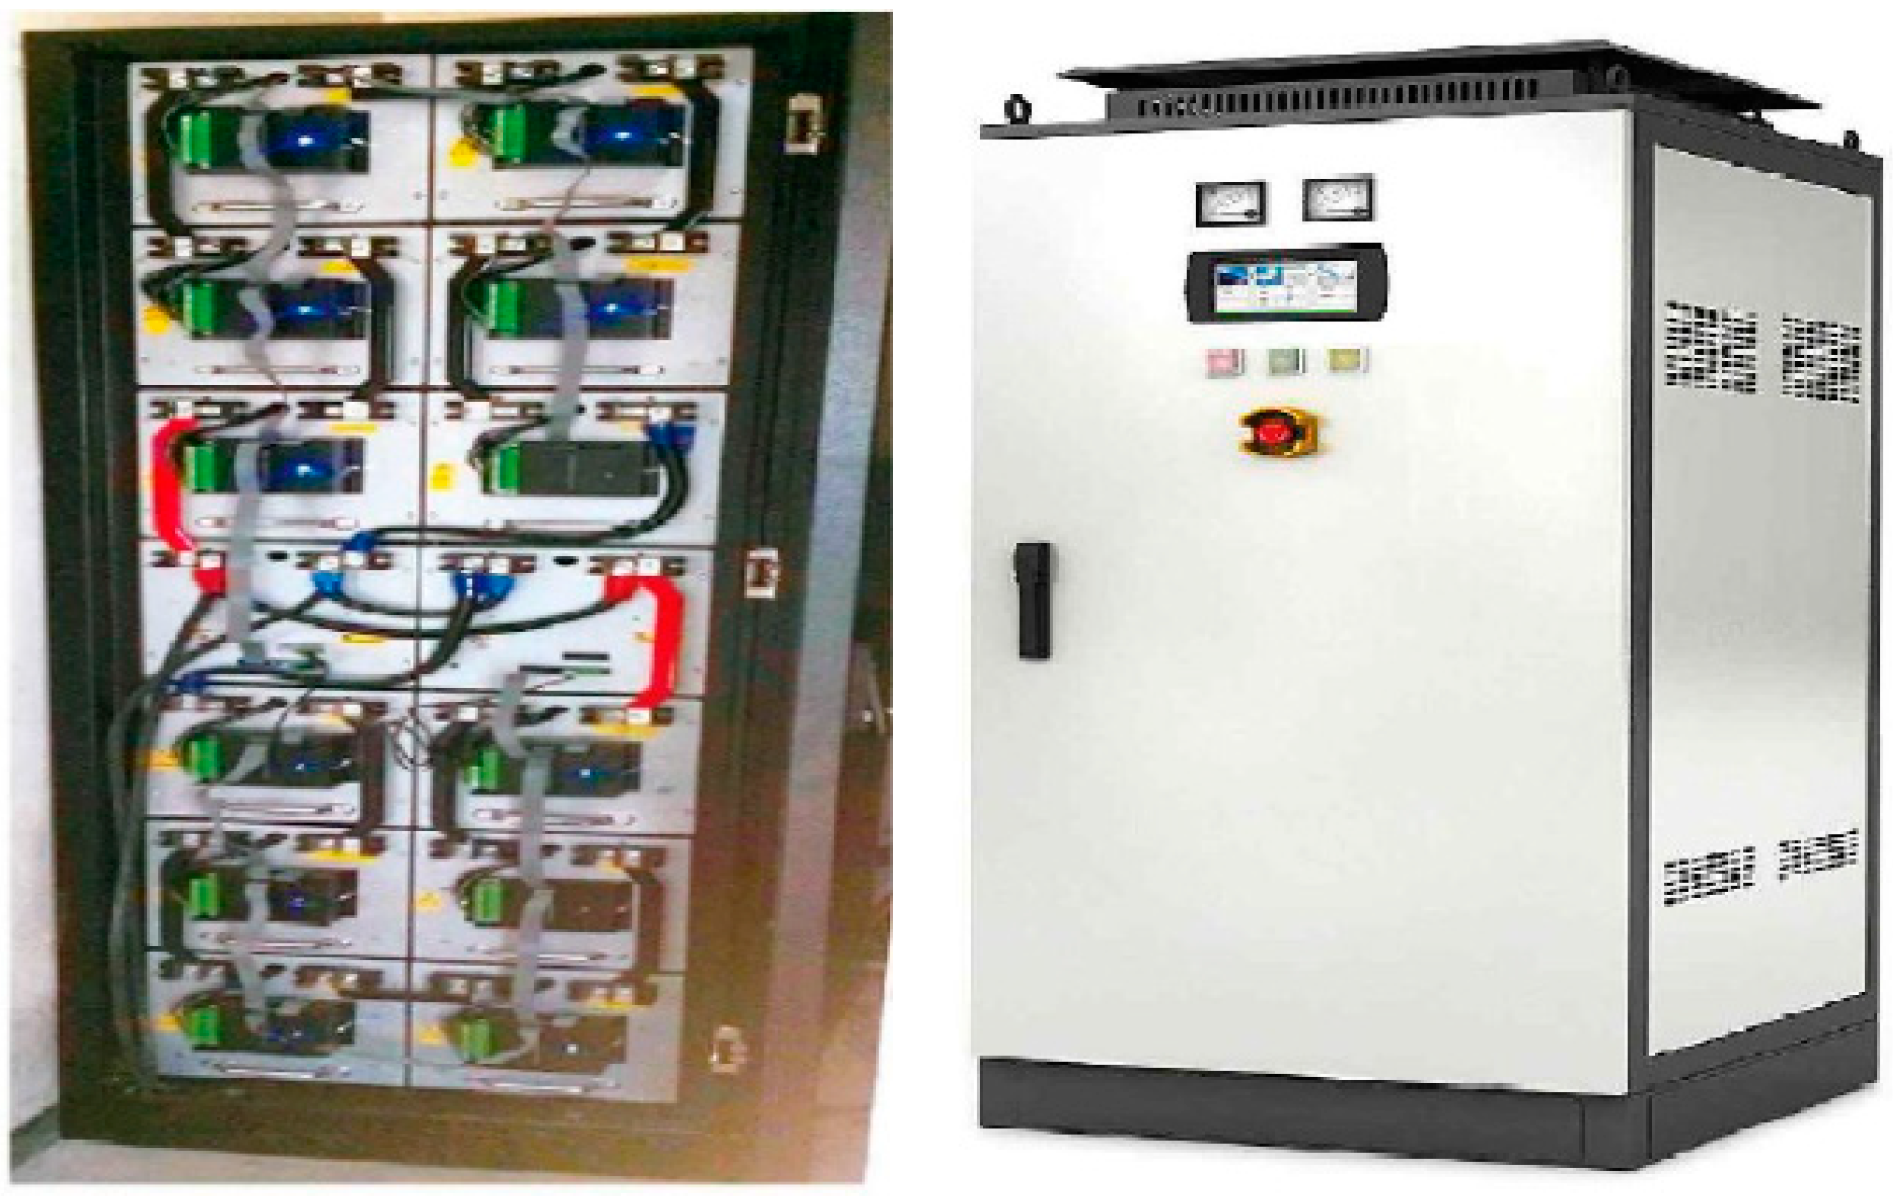
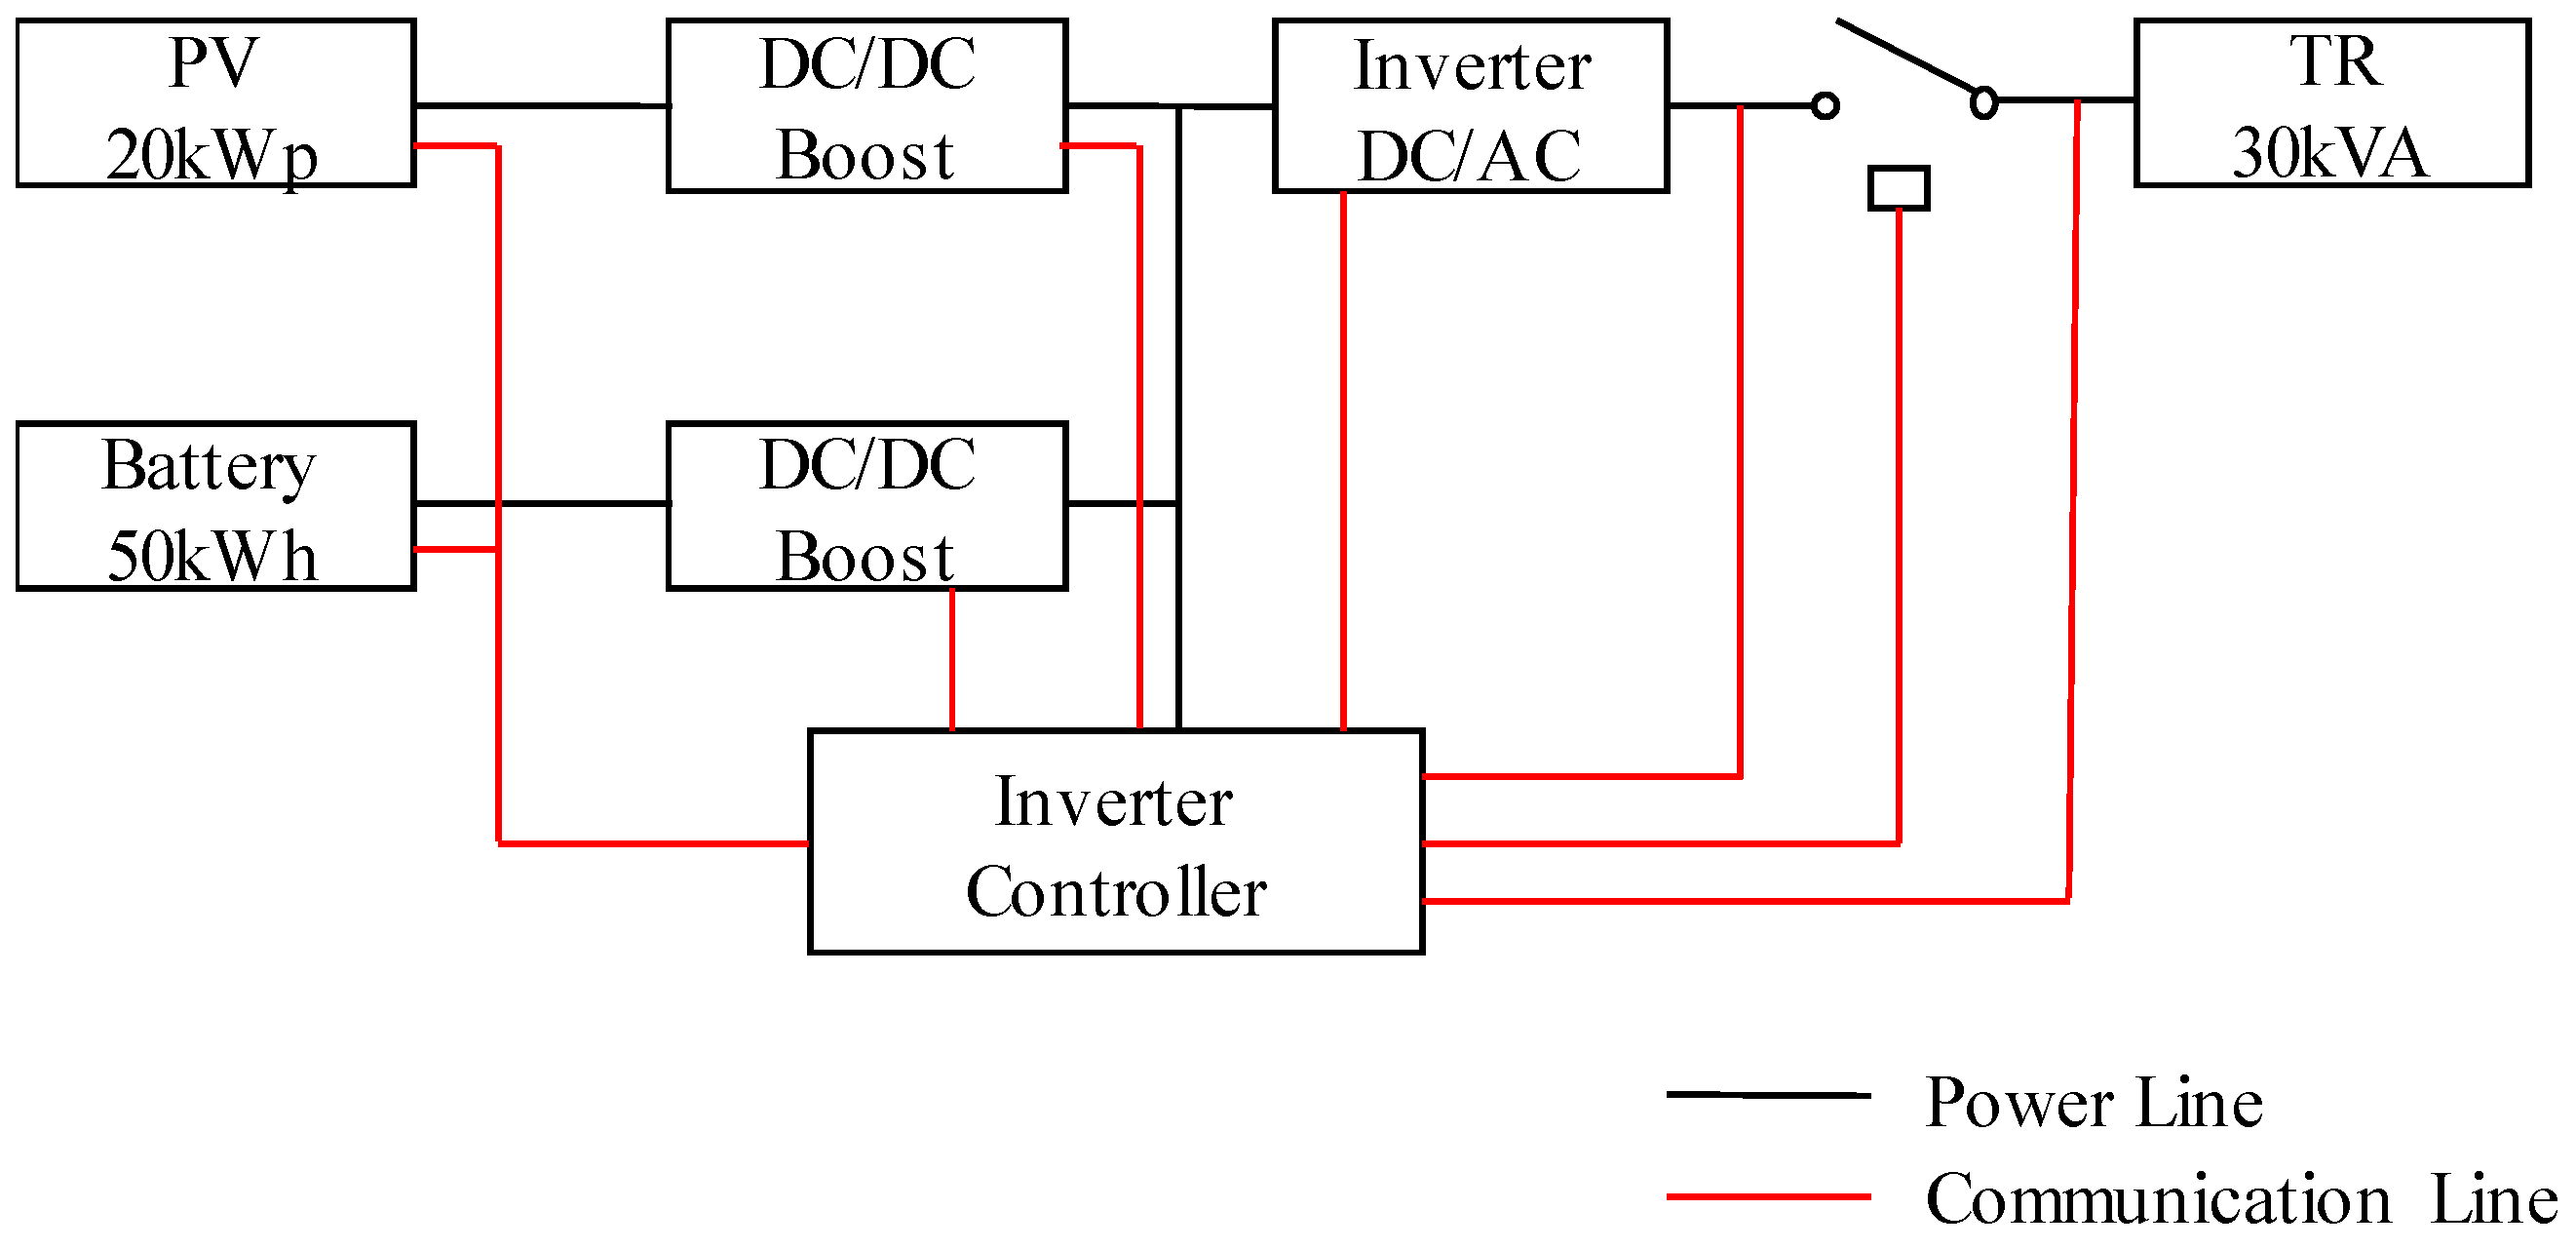
3.1.3. Energy Storage System
- Uniform discharge: discharges a uniform amount of power from the battery during peak and mid-load times continuously;
- Continuous differential discharge: continuously discharges during peak and mid-load times, but the amount is different during peak load time;
- Non-continuous differential discharge: discharges non-continuously during peak and mid-load times, and the amount is different during peak-load time.
3.1.4. SGS Operation System
3.2. Other Ancillary Equipment
3.2.1. Advanced Metering Infrastructure
3.2.2. Electric Vehicle Chargers
3.2.3. Building Automation System
4. Performance Evaluation
4.1. Peak Shaving
4.2. Consumption Reduction
4.3. Saved Electricity Fee
5. Economic Analysis of Smart Grid Station
5.1. Saved Electricity Fees by PV Generation
5.2. Running Cost Reduction by EV
5.3. Saved Fee by ESS Scheduling
5.4. Economic Feasibility on Investment Cost
6. Discussion
7. Conclusions
Author Contributions
Funding
Acknowledgments
Conflicts of Interest
Nomenclature
| GHG | Greenhouse Gas |
| SG | Smart Grid |
| PV | Photovoltaic |
| WT | Wind Turbine |
| AMI | Advanced Metering Infrastructure |
| BAS | Building Automation System |
| SGS | Smart Grid Station |
| RE | Renewable Energy |
| HVAC | Heating, Ventilation and Air Conditioning |
| VFD | Variable Frequency Drive |
| TOU | Time of Use |
| PSR | Peak Shaving Ratio |
| CRR | Consumption Reduction Ratio |
| SFR | Saved Fee Ratio |
| SDC | Saved Demand Charge |
| SEC | Saved Energy Charge |
| RC | Running Cost |
| FR | Fee Reduction |
References
- UNFCCC. Adoption of the Paris Agreement; UNFCCC: Paris, France, 2015. [Google Scholar]
- Enhanced Actions on Climate Change. Available online: http://www4.unfccc.int/Submissions/INDC/Submission%20Pages/submissions.aspx (accessed on 20 March 2018).
- Submission by Latvia and the European Commission on Behalf of the European Union and Its Member States. Available online: http://www4.unfccc.int/Submissions/INDC/Submission%20Pages/submissions.aspx (accessed on 20 March 2018).
- Submission of Japan’s Intended Nationally Determined Contribution. Available online: http://www4.unfccc.int/Submissions/INDC/Submission%20Pages/submissions.aspx (accessed on 20 March 2018).
- Submission by the Republic of Korea Intended Nationally Determined Contribution. Available online: http://www4.unfccc.int/Submissions/INDC/Submission%20Pages/submissions.aspx (accessed on 20 March 2018).
- Ock, J.; Issa, R.R.A.; Flood, I. Smart building energy management systems (BEMS) simulation conceptual framework. In Proceedings of the 2016 Winter Simulation Conference, Arlington, VA, USA, 11–14 December 2016; pp. 3237–3245. [Google Scholar]
- Ferro, G.; Laureri, F.; Minciardi, R.; Robba, M. Optimal Integration of Interconnected Buildings in a Smart Grid: A Bi-Level Approach. In Proceedings of the 2017 UKSim-AMSS 19th International Conference on Computer Modelling & Simulation (UKSim), Cambridge, UK, 5–7 April 2017; pp. 155–160. [Google Scholar]
- Borlase, S. Smart Grid Technologies. In Smart Grids Infrastructure, Technology, and Solutions; CRC Press: Boca Raton, FL, USA, 2015; pp. 79–125. [Google Scholar]
- Kolokosta, D. The role of smart grids in the building sector. Energy Build. 2016, 116, 703–708. [Google Scholar]
- Wurtz, F.; Delinchant, B. Smart buildings integrated in “smart grids”: A key challenge for the energy transition by using physical models and optimization with a “human-in-the-loop” approach. C. R. Phys. 2017, 18, 428–444. [Google Scholar] [CrossRef]
- Sidid, S.; Gaur, S. Smart Grid Building Automation Based on Internet of Things. In Proceedings of the International Conference on Innovations in Power and Advanced Computing Technologies, Vellore, India, 21–22 April 2017; pp. 1–4. [Google Scholar]
- Kim, S.; Lim, H. Reinforcement Learning Based Energy Management Algorithm for Smart Energy Buildings. Energies 2018, 11, 2010. [Google Scholar] [CrossRef]
- Barbato, A.; Bolchini, C.; Geronazzo, A.; Quintarelli, E.; Palamarciuc, A.; Pitì, A.; Rottondi, C.; Verticale, G. Energy Optimization and Management of Demand Response Interactions in a Smart Campus. Energies 2016, 9, 398. [Google Scholar] [CrossRef] [Green Version]
- Cabrera, D.F.M.; Zareipour, H. Data association mining for identifying lighting energy waste patterns in educational institutes. Energy Build. 2013, 62, 210–216. [Google Scholar] [CrossRef]
- Ragheb, M. Vertical Axis Wind Turbines; University of Illinois at Urbana-Champaign: Champaign, IL, USA, 2011. [Google Scholar]
- Soedibyo, J.F.; Ashari, M. Performance Comparison of Vertical Axis and Horizontal Axis Wind Turbines to Get Optimum Power Output. In Proceedings of the 2017 15th International Conference on Quality in Research: International Symposium on Electrical and Computer Engineering, Bali, Indonesia, 24–27 July 2017; pp. 429–433. [Google Scholar]
- Mohd, A.; Ortjohann, E.; Schmelter, A.; Hamsic, N.; Morton, D. Challenges in Integrating Distributed Energy Storage Systems into Future Smart Grid. In Proceedings of the IEEE ISIE, Cambridge, UK, 30 June–2 July 2008; pp. 1627–1632. [Google Scholar]
- Alegria, E.; Brown, T.; Minear, E.; Laseter, R.H. CERTS Migcrogrid Demonstration with Large-Scale Energy Storage and Renewable Generation. IEEE Trans. Smart Grid 2014, 5, 937–943. [Google Scholar] [CrossRef]
- Lee, K.; Lee, Y.; Seo, J.; Lee, S.; Seo, D. Case study on Smart Grid Station using IEC 61850. In Proceedings of the KIEE Summer Conference, Pyeongchang, Korea, 13–15 July 2016; pp. 24–25. [Google Scholar]
- ABB. 650 Series IEC 61850 Communication Protocol Manual; ABB: Vasteras, Sweden, 2011. [Google Scholar]
- Communication Networks and Systems for Power Utility Automation—Part 7-420. Available online: https://infostore.saiglobal.com/preview/is/en/2009/i.s.en61850-7-420-2009.pdf?sku=1138048 (accessed on 9 May 2018).
- Communication Networks and Systems for Power Utility Automation—90-7. Available online: https://webstore.iec.ch/preview/info_iec61850-90-7%7Bed1.0%7Den.pdf (accessed on 9 May 2018).
- Tan, K.M.; Ramachandaramurthy, V.K.; Yong, J.Y. Integration of electric vehicles in smart grid: A review on vehicle to grid technologies and optimization techniques. Renew. Sustain. Energy Rev. 2016, 53, 720–732. [Google Scholar] [CrossRef]
- KEPCO General Service Electricity Rate Table. Available online: http://cyber.kepco.co.kr/ckepco/front/jsp/CY/E/E/CYEEHP00202.jsp (accessed on 9 May 2018).
- Fu, R.; Feldman, D.; Margolis, R.; Woodhouse, M.; Ardani, K. U.S. Solar Photovoltaic System Cost Benchmark: Q1 2017; NREL: Golden, CO, USA, 2017. [Google Scholar]
- Curry, C. Lithium-ion Battery Costs and Market; Bloomberg New Energy Finance Report; BNEF: New York, NY, USA, 2017. [Google Scholar]


| Countries | Goals |
|---|---|
| China | To lower carbon dioxide emissions per unit of GDP by 60–65% from the 2005 level |
| EU | At least 40% domestic reduction in GHG emissions by 2030 compared to 1990 |
| Japan | At the level of GHG emission reductions of 26% by 2030 compared to 2013 |
| South Korea | GHG emission reduction by 37% from the business as usual (BAU) level by 2030 |
| Objective | Reducing Consumption and Saving on Electricity Fees by Optimizing Usage in a Building |
|---|---|
| Expected Effects |
|
| Features |
|
| Device | Monocrystalline silicon |
| Max Power | 250 Wp (60 cells) |
| Max Voltage | 497.6 V (31.1 V × 16) |
| Efficiency | 15.7% |
| Capacity | 20 kWp (6 by 14, 84 modules, 4 dummies) |
| Connection | 16 series by 5 parallel |
| Type | Vertical axis |
| Size | 1400 mm × 1800 mm |
| Rated power | 1.2 kW at 15 m/s |
| Cut-in wind speed | 3 m/s |
| Extreme wind speed | 52.5 m/s |
| Input | Rated voltage | 430 VDC |
| Voltage range | 60–600 VDC | |
| Output | Max capacity | 3kW (single phase) |
| Rated voltage | 220 VAC (±10%) | |
| Rated frequency | 60 Hz (±0.5 Hz) | |
| Efficiency | 98% | |
| Power factor | 99% |
| PCS | Capacity | 30 kW/30 kVA, 60 Hz |
| Control system | PWM converter (Pulse Width Modulation) | |
| Max efficiency | 90% | |
| Power factor | Over 95% | |
| Max input voltage | 800 VDC from Battery | |
| 450–850 VDC from PV | ||
| Output | 45 A | |
| BAT | Capacity | 50 kWh (25 kWh × 2) |
| Charge–discharge efficiency | 95% | |
| Cell voltage | 3.2 V, 20 Ah | |
| Rack voltage | 422.4 V (11 modules, 396 cells) | |
| Nominal voltage | 422.4 V (369.6–468.6 V) |
| Status | Mode | Description |
|---|---|---|
| Charge | Full charge | Full Charge by PV + grid |
| Only PV Charge | Charge only by PV | |
| Discharge | Full discharge | Supply power to loads by PV + BAT |
| Fixed PCS output |
| |
| Fixed BAT output |
| |
| Only PV discharge | Supply power to loads only by PV | |
| Concurrent | Fixed BAT charge |
|
| Fixed PCS output |
|
| Potential transformer | AC 10–452 V/110 V |
| Current transformer | 0.05–6 A (rated 5 A) |
| Measurement | Voltage, current, freq., etc. |
| Installation Date | Items | Capacity (kW) | Hours Used | Consumption | ||||
|---|---|---|---|---|---|---|---|---|
| Per a Day of Weekday | Per a Day of Weekend | Aug (kWh) | Sept (kWh) | Total (kWh) | ||||
| SCADA | 2014 10.30 | Media rack | 0.72 | 24 | 24 | 10,460.6 | 10,123.2 | 20,583.8 |
| Audio rack | 0.5 | |||||||
| 6 DLP 1 Cube | 1.32 | |||||||
| 4 LED TVs | 0.52 | |||||||
| Humidifier | 11 | |||||||
| Temp. office | 2015 03.24 | Lights | 1.8 | 10 | - | 378 | 360 | 738 |
| 13 Computers (400 W) | 5.2 | 10 | - | 1092 | 1040 | 2132 | ||
| 13 Computers (300 W) | 3.9 | 10 | - | 819 | 780 | 1599 | ||
| 21 Monitors (170 W) | 3.7 | 10 | - | 777 | 740 | 1517 | ||
| Hot & cold dispenser | 0.85 | 24 | 24 | 632.4 | 612 | 1244.4 | ||
| Air handling unit | 12.5 | 10 | - | 2625 | 2500 | 5125 | ||
| 10 Cooling fans | 0.3 | 6 | - | 37.8 | 36 | 73.8 | ||
| 4 Printers (700 W) | 2.8 | 1 | - | 58.8 | 56 | 114.8 | ||
| Ice storage AC sys. | 15 | 10 | - | 3150 | 3000 | 6150 | ||
| Total consumption (kWh) | 20,030.6 | 19,247.2 | 39,277.8 | |||||
| The number of weekdays in each month | 21 days | 20 days | ||||||
| The number of weekends in each month | 10 days | 10 days | ||||||
| Usage Hours | Note | |||
|---|---|---|---|---|
| Off-Peak Load | Mid-Load | Peak Load | ||
| SCADA | 6 | 8 | 10 | All days |
| Office facilities 1 | 6 | 3.5 | 0.5 | 08:30–18:30 on Weekdays |
| Hot & cold dispenser | 6 | 8 | 10 | All days |
| Ice storage AC system | - | - | 10 | Weekdays |
| Printers | 1 | - | - | Weekdays |
| Cooling fans | 5 | 1 | - | Weekdays |
| Day Peak (kW) | Evening Peak (kW) | Max Peak (kW) | |
|---|---|---|---|
| 2015.08 | 285.12 | 294.24 | 294.24 |
| 2015.09 | 255.84 | 213.12 | |
| 2014.08 | 271.08 | 259.56 | 271.08 |
| 2014.09 | 255.96 | 237.24 |
| Consumption (kWh) | ||||
|---|---|---|---|---|
| Off-Peak Load | Mid-Load | Peak Load | Total | |
| 2015.08 | 24,299 | 20,703 | 19,128 | 123,807 |
| 2015.09 | 27,478 | 17,619 | 14,580 | |
| 2014.08 | 7844 | 21,322 | 18,891 | 99,686 |
| 2014.09 | 17,695 | 19,343 | 14,591 | |
| Load Time | Summer | Spring/Fall | Winter |
|---|---|---|---|
| Off-peak load time | 23:00–09:00 | 23:00–09:00 | |
| Mid-load Time | 09:00–10:00 12:00–13:00 17:00–23:00 | 09:00–10:00 12:00–17:00 20:00–22:00 | |
| Peak load Time | 10:00–12:00 13:00–17:00 | 10:00–12:00 17:00–20:00 22:00–23:00 | |
| Demand Charge | $8.32/kW | |||
|---|---|---|---|---|
| Energy charge ($/kWh) | Time Period | Off-Peak Load | Mid-Load | Peak Load |
| Summer (1 Jun–31 Aug) | $0.0561 | $0.109 | $0.1911 | |
| Spring/Fall (1 Mar–31 May/1 Sep–31 Oct) | $0.0561 | $0.0786 | $0.1093 | |
| Winter (1 Nov–28 Feb) | $0.0631 | $0.1092 | $0.1667 | |
| Date | Consumption (kWh) | Fee (USD) | Total (USD) |
|---|---|---|---|
| 2015.08 | 64,130 | $8659 | $15,924 |
| 2015.09 | 59,677 | $7265 | |
| 2014.08 | 48,057 | $6424 | $13,128 |
| 2014.09 | 51,629 | $6704 |
| Month | Max Peak | Demand Charge | Charged Fee |
|---|---|---|---|
| Aug. | 37.8 kW | $8.32/kW | $314.496 |
| Sept. | 37.8 kW | $8.32/kW | $314.496 |
| 2015 | Consumption (kWh) | Fee 1 (USD) | |
|---|---|---|---|
| Aug. | Off-peak Load | 7744 | $304.041 |
| Mid-load | 5481.4 | $387.755 | |
| Peak load | 6021.0 | $761.778 | |
| Total | 19,247.2 | $1453.574 | |
| Sept. | Off-peak Load | 8056.7 | $406.783 |
| Mid-load | 5695.8 | $558.758 | |
| Peak load | 6278.2 | $1079.785 | |
| Total | 20,030.7 | $2045.326 | |
| Month | Mileage | EV Charge Amount (kWh) | Price of 1 kWh ($/kWh) | Price of Gasoline 1 ($/L) |
|---|---|---|---|---|
| Aug | 470 km | 105.8 | $0.109 | $1.56 |
| Sept | 345 km | 68.4 | $0.0786 | $1.59 |
| Investment | Expectation | Measured Amount | Saved Fee (USD) | |
|---|---|---|---|---|
| PV generation | $51,000 USD | 25,200 kWh | 27,296 kWh | $6376 |
| ESS discharge | $10,500 USD (PCS) | 12,540 kWh | 8430 kWh | |
| $30,000 USD (BAT) |
| Peak | Consumption | Electricity Fee | |
|---|---|---|---|
| Early target | 5.0% | 9.6% | - |
| Performance | 5.40% | 11.26% | 10.15% |
© 2018 by the authors. Licensee MDPI, Basel, Switzerland. This article is an open access article distributed under the terms and conditions of the Creative Commons Attribution (CC BY) license (http://creativecommons.org/licenses/by/4.0/).
Share and Cite
Whang, J.; Hwang, W.; Yoo, Y.; Jang, G. Introduction of Smart Grid Station Configuration and Application in Guri Branch Office of KEPCO. Sustainability 2018, 10, 3512. https://doi.org/10.3390/su10103512
Whang J, Hwang W, Yoo Y, Jang G. Introduction of Smart Grid Station Configuration and Application in Guri Branch Office of KEPCO. Sustainability. 2018; 10(10):3512. https://doi.org/10.3390/su10103512
Chicago/Turabian StyleWhang, Jaehong, Woohyun Hwang, Yeuntae Yoo, and Gilsoo Jang. 2018. "Introduction of Smart Grid Station Configuration and Application in Guri Branch Office of KEPCO" Sustainability 10, no. 10: 3512. https://doi.org/10.3390/su10103512
APA StyleWhang, J., Hwang, W., Yoo, Y., & Jang, G. (2018). Introduction of Smart Grid Station Configuration and Application in Guri Branch Office of KEPCO. Sustainability, 10(10), 3512. https://doi.org/10.3390/su10103512