Potentially Replaceable Car Trips: Assessment of Potential Modal Change towards Active Transport Modes in Vitoria-Gasteiz


Abstract
1. Introduction
2. Data and Methods
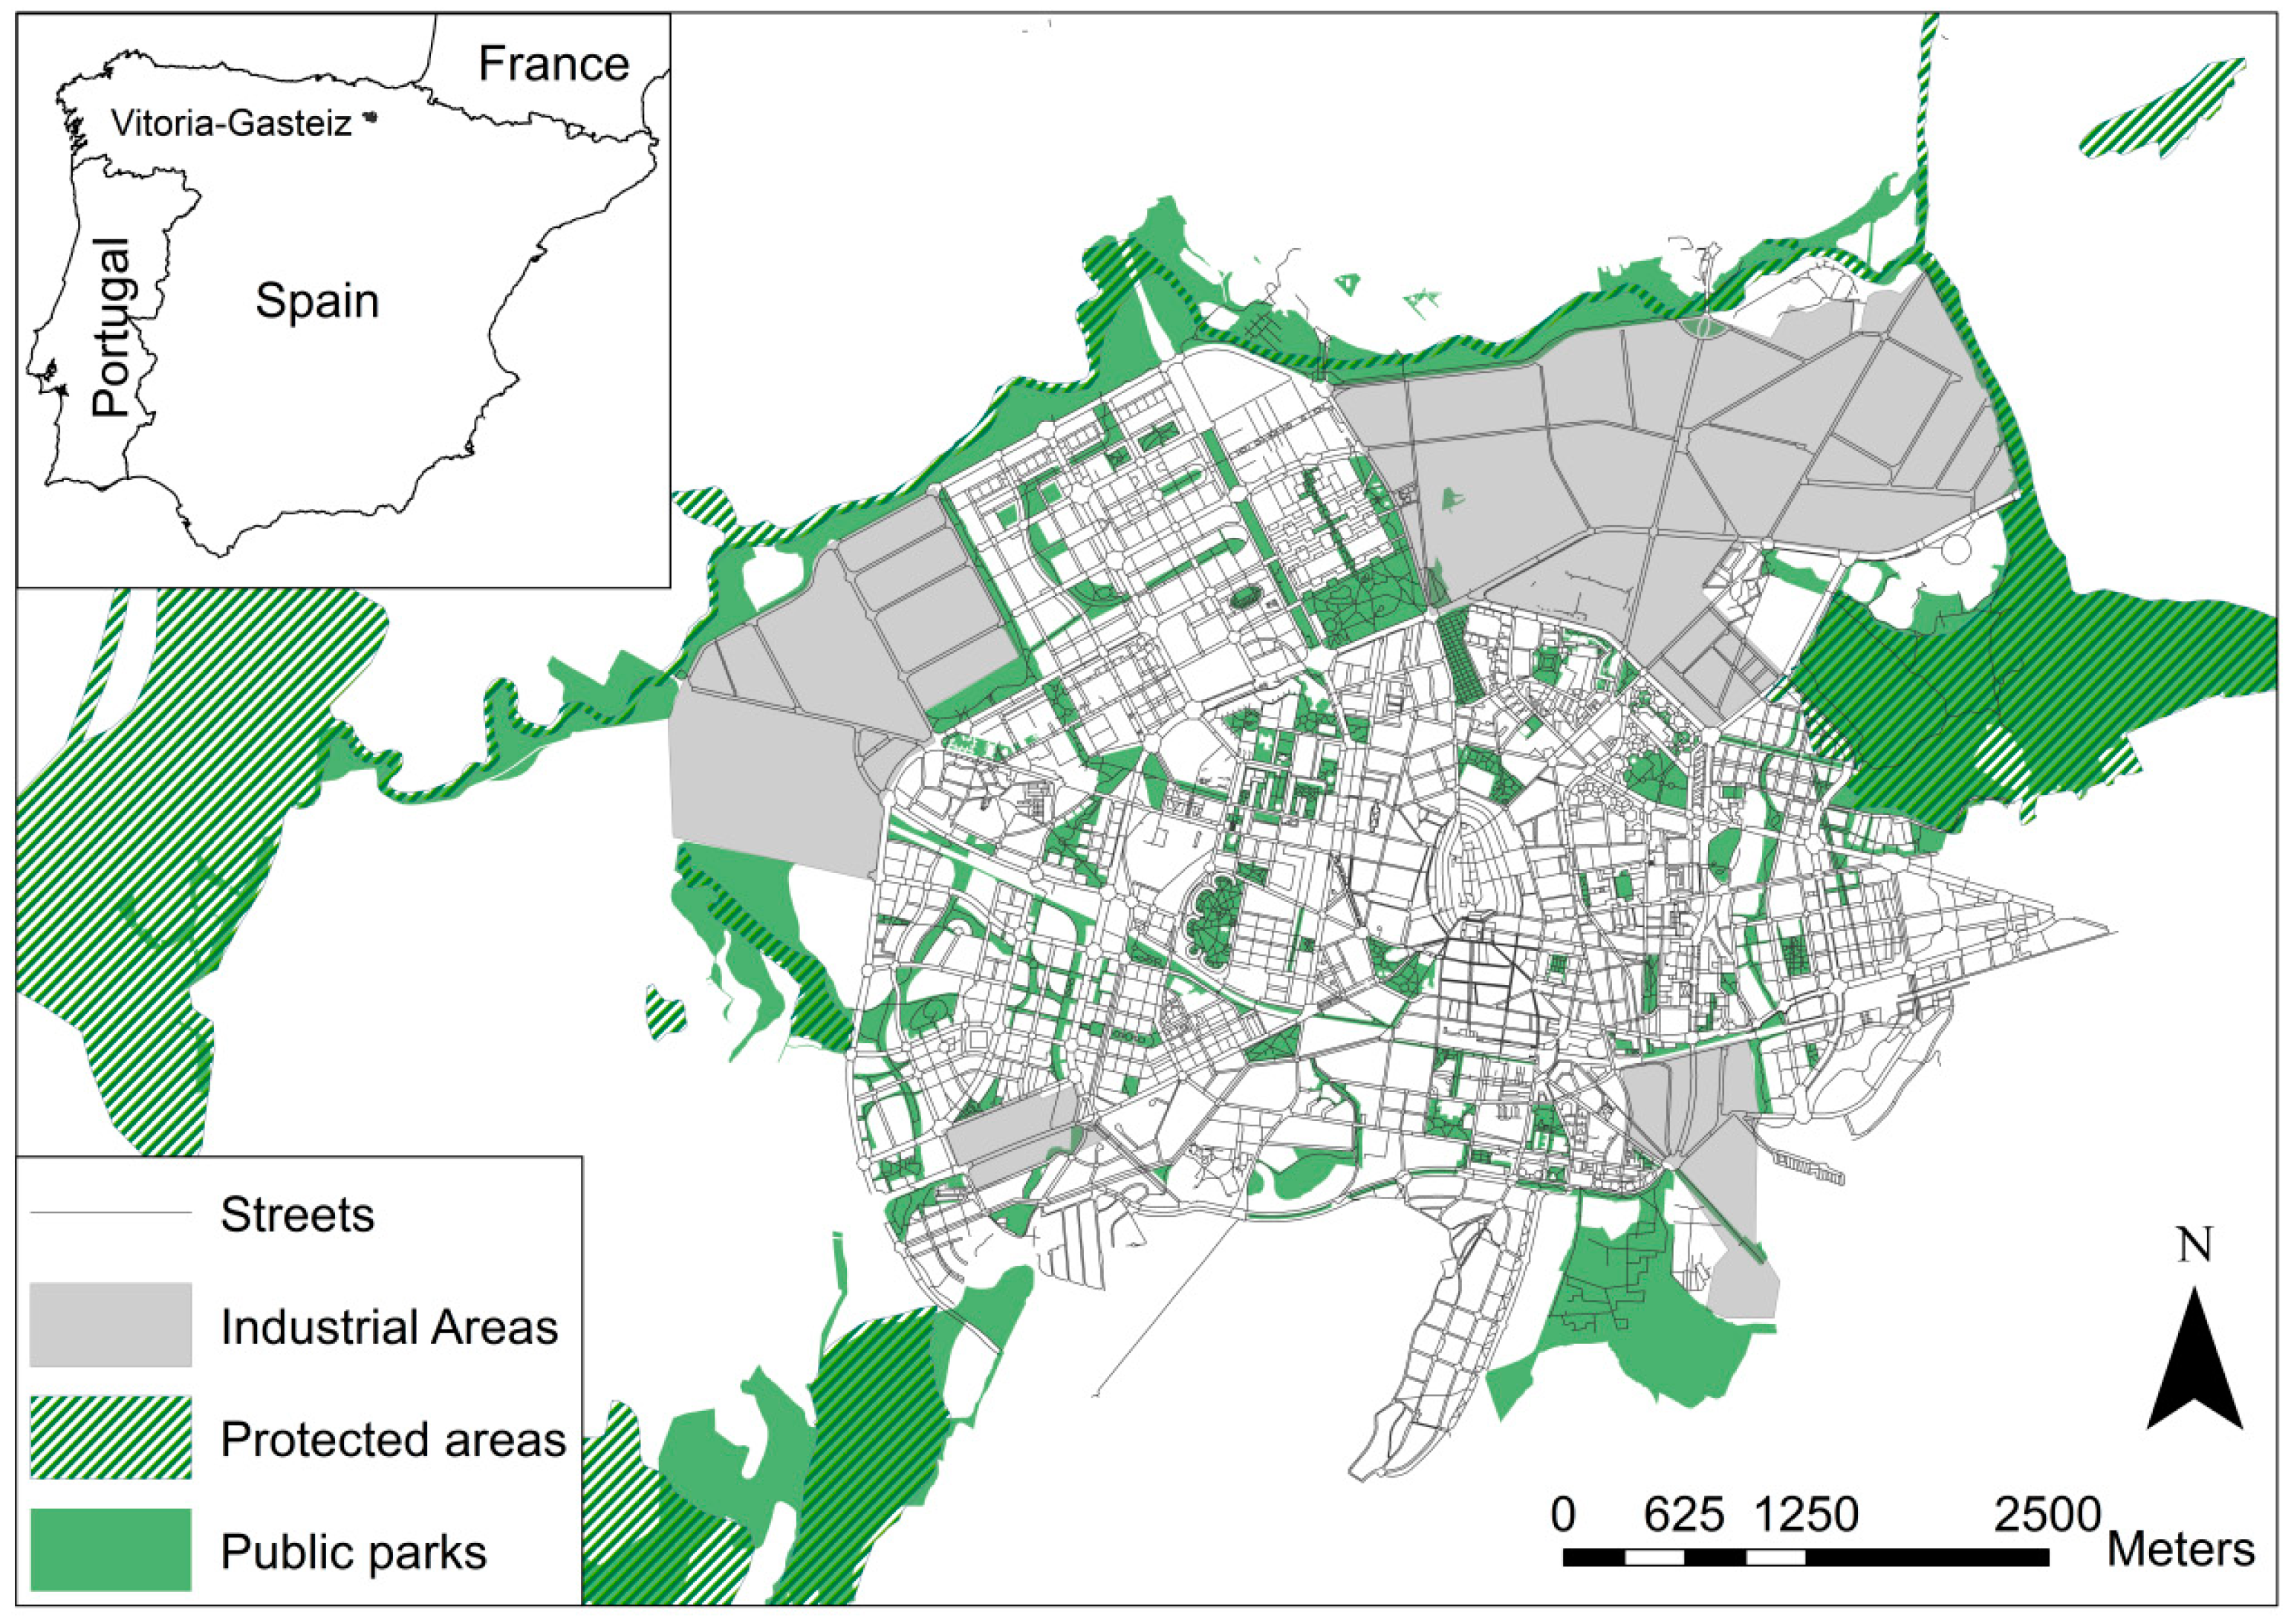
2.1. Context and Data
2.2. Methods
2.2.1. Analysing the Potential Replacement of SCT by Active Modes
2.2.2. Analysing the Barriers to Cycling
3. Results
3.1. Distance and Time Thresholds for the Potential Replacement of SCT by Active Modes
3.2. Perceived Barriers to Cycling
4. Discussion
5. Conclusions
Author Contributions
Funding
Acknowledgments
Conflicts of Interest
References
- Rueda, S. La Supermanzana, Nueva Célula Urbana para la Construcción de un Nuevo Modelo Funcional y Urbanístico de Barcelona; BCN Ecologia: Barcelona, Spain, 2006; Available online: http://bcnecologia.net/sites/default/files/proyectos/la_supermanzana_nueva_celula_poblenou_salvador_rueda.pdf (accessed on 15 March 2018).
- European Environmental Agency. Transitions towards a More Sustainable Mobility System. TERM 2016: Transport Indicators Tracking Progress towards Environmental Targets in Europe. European Environmental Agency Report. 2016. No. 34/2016. Available online: https://www.eea.europa.eu//publications/term-report-2016 (accessed on 10 January 2018).
- European Commission. Links between Noise and Air Pollution. Science for Environment Policy. In-depth Report 13. 2016. Available online: http://ec.europa.eu/environment/integration/research/newsalert/pdf/air_noise_pollution_socioeconomic_status_links_IR13_en.pdf (accessed on 18 February2018).
- Mueller, N.; Rojas-Rueda, D.; Basagaña, X.; Cirach, M.; Cole-Hunter, T.; Dadvand, P.; Donaire-Gonzalez, D.; Foraster, M.; Gascon, M.; Martinez, D.; et al. Urban and Transport Planning Related Exposures and Mortality: A Health Impact Assessment for Cities. Environ. Health Perspect. 2017, 125, 89–96. [Google Scholar] [CrossRef] [PubMed]
- Sugiyama, T.; Merom, D.; Van der Ploeg, H.P.; Corpuz, G.; Bauman, A.; Owen, N. Prolonged sitting in cars: Prevalence, socio-demographic variations, and trends. Prev. Med. 2012, 55, 315–318. [Google Scholar] [CrossRef] [PubMed]
- Morency, C.; Demers, M.; Poliquin, E. Shifting short motorized trips to walking: The potential of active transportation for physical activity in Montreal. J. Transp. Health 2014, 1, 100–107. [Google Scholar] [CrossRef]
- Beckx, C.; Broekx, S.; Degraeuwe, B.; Beusen, B.; Int Panis, L. Limits to active transport substitution of SCT. Transp. Res. D. Transp. Environ. 2013, 22, 10–13. [Google Scholar] [CrossRef]
- André, J.-M.; Joumard, R. Modelling of Cold Start Excess Emissions for Passenger Cars. INRETS Report LTE. 2005. Available online: https://hal.archives-ouvertes.fr/hal-00917071/document (accessed on 15 March 2018).
- Favez, J.Y.; Weilenmann, M.; Stilli, J. Cold start extra emissions as a function of engine stop time: Evolution over the last 10 years. Atmos. Environ. 2009, 43, 996–1007. [Google Scholar] [CrossRef]
- Hanson, S. Gender and mobility: New approaches for informing sustainability. Gend. Place Cult. 2010, 17, 5–23. [Google Scholar] [CrossRef]
- Cole, R.; Turrell, G.; Koohsari, M.J.; Owen, N.; Sugiyama, T. Prevalence and correlates of walkable short car trips: A cross-sectional multilevel analysis. J. Transp. Health 2017, 4, 73–80. [Google Scholar] [CrossRef]
- Ye, X.; Pendyala, R.M.; Gottardi, G. An exploration of the relationship between mode choice and complexity of trip chaining patterns. Transp. Res. B. Meth. 2007, 41, 96–113. [Google Scholar] [CrossRef]
- Badland, H.; Schofield, G. Perceptions of replacing car journeys with non-motorized travel: Exploring relationships in a cross-sectional adult population sample. Prev. Med. 2006, 43, 222–225. [Google Scholar] [CrossRef] [PubMed]
- Geus, B.; De Bourdeaudhuij, I.; Jannes, C.; Meeusen, R. Psychosocial and environmental factors associated with cycling for transport among a working population. Health Educ. Res. 2008, 23, 697–708. [Google Scholar] [CrossRef] [PubMed]
- Handy, S.; Van Wee, B.; Kroesen, M. Promoting cycling for transport: research needs and challenges. Transp. Rev. 2014, 34, 4–24. [Google Scholar] [CrossRef]
- Barberán, A.; Monzón, A. How did bicycle share increase in Vitoria-Gasteiz? In Proceedings of the XII Conference on Transport Engineering, CIT, Valencia, Spain, 7–9 June 2016. [Google Scholar]
- Bauman, A.; Rissel, C.; Garrard, J.; Ker, I.; Speidel, R.; Fishman, E. Cycling: Getting Australia Moving—Barriers, Facilitators and Interventions to Get More Australians Physically Active through Cycling; 31st Australasian Transport Research Forum; Cycling Promotion Fund: Melbourne, Australia, 2008; pp. 593–601. [Google Scholar]
- Fraser, S.D.S.; Lock, K. Cycling for transport and public health: A systematic review of the effect of the environment on cycling. Eur. J. Public Health 2011, 21, 738–743. [Google Scholar] [CrossRef] [PubMed]
- Parkin, J.; Wardman, M.; Page, M. Models of perceived cycling risk and route acceptability. Accid. Anal. Prev. 2007, 39, 364–371. [Google Scholar] [CrossRef] [PubMed]
- Michelle, D.; Chris, R.; Beverley, L.L. All Dressed Up and Nowhere to Go?: A Qualitative Research Study of the Barriers and Enablers to Cycling in Inner Sydney. Road Transp. Res. J. Aust. N. Z. Res. Pract. 2007, 16, 42–52. [Google Scholar]
- Piatkowski, D.P.; Marshall, W.E. Not all prospective bicyclists are created equal: The role of attitudes, socio-demographics, and the built environment in bicycle commuting. Travel Behav. Soc. 2015, 2, 166–173. [Google Scholar] [CrossRef]
- Mandic, S.; Hopkins, D.; García Bengoechea, E.; Flaherty, C.; Williams, J.; Sloane, L.; Spence, J.C. Adolescents’ perceptions of cycling versus walking to school: Understanding the New Zealand context. J. Transp. Health 2017, 4, 294–304. [Google Scholar] [CrossRef]
- Muñoz, B.; Rondinella, G. Informe de Evaluación del Plan de Movilidad Sostenible y Espacio Público y del Plan Director de Movilidad Ciclista de Vitoria-Gasteiz; Centro de Estudios Ambientales: Vitoria-Gasteiz, Spain, 2017; Available online: http://www.vitoria-gasteiz.org/wb021/http/contenidosEstaticos/especial/2017/0406/PMSEP_evaluacion_2017.pdf (accessed on 3 September 2018). (In Spanish)
- Vitoria-Gasteiz. Análisis de los resultados de la encuesta de movilidad 2014 de Vitoria-Gasteiz realizada por TRANSyT (Universidad Politécnica de Madrid) para el Centro de Estudios Ambientales (CEA). 2014. Available online: https://blogs.vitoria-gasteiz.org/medios/files/2015/01/an%25C3%25A1lisis-encuesta-movilidad-2014.pdf (accessed on 10 December 2017).
- Rondinella, G. Considering Cycling for Commuting: The Role of Mode Familiarity: An Exploration on the (Circular) Relation between Cycling Behaviours and Attitudes toward Cycling in Vitoria-Gasteiz. Ph.D. Dissertation, Universidad Politécnica de Madrid, Madrid, Spain, July 2015. [Google Scholar]
- Muñoz López, B. Integrating Bicycle Option in Mode Choice Models through Latent Variables. Ph.D. Dissertation, Universidad Politécnica de Madrid, Madrid, Spain, July 2016. [Google Scholar]
- Google Maps API. Terms of Use. 2018. Available online: http://www.google.com/apis/maps/terms.html (accessed on 15 June 2018).
- Scheepers, C.E.; Wendel-Vos, G.C.W.; den Broeder, J.M.; van Kempen, E.E.M.M.; van Wesemael, P.J.V.; Schuit, A.J. Shifting from car to active transport: A systematic review of the effectiveness of interventions. Transp. Res. Part A 2014, 70, 264–280. [Google Scholar] [CrossRef]
- Peña, D. Fundamentos de Estadistica; Alianza Editorial: Madrid, Spain, 2010; ISBN 978-84-206-8380-5. [Google Scholar]
- Cramér, H. Mathematical Methods of Statistics; Princeton University Press: Princeton, NJ, USA, 1946. [Google Scholar]
- Goodman, A. Walking, Cycling and Driving to Work in the English and Welsh 2011 Census: Trends, Socio-Economic Patterning and Relevance to Travel Behaviour in General. PLoS ONE 2013, 8, e71790. [Google Scholar] [CrossRef] [PubMed]
- Simons, D.; De Bourdeaudhuij, I.; Clarys, P.; de Geus, B.; Vandelanotte, C.; Van Cauwenberg, J.; Deforche, B. Choice of Transport Mode in Emerging Adulthood: Differences Between Secondary School Students, Studying Young Adults and Working Young Adults and Relations with Gender, Ses and Living Environment. Transp. Res. Part A Policy Pract. 2017, 103, 172–184. [Google Scholar] [CrossRef]
- Gates, T.; Noyce, D.; Bill, A.; Van Ee, N. Recommended walking speeds for pedestrian clearance timing based on pedestrian characteristics. Transp. Res. Rec. 2006, 1982, 38–47. [Google Scholar] [CrossRef]
- Pucher, J.; Buehler, R. Integrating bicycling and public transport in North America. J. Public Transp. 2009, 12, 79–104. [Google Scholar] [CrossRef]
- Rabl, A.; De Nazelle, A. Benefits of shift from car to active transport. Transp. Policy 2012, 19, 121–131. [Google Scholar] [CrossRef]


| Code | Question | Answer Type |
|---|---|---|
| How far do/would the following facts limit your regular trips by bicycle? | ||
| B1 | Lack of cycle lane | 7-point Likert scale a |
| B2 | Long distances | 7-point Likert scale a |
| B3 | Lack of safe parking | 7-point Likert scale a |
| B4 | Slope | 7-point Likert scale a |
| B5 | Riding a bicycle in traffic | 7-point Likert scale a |
| B6 | Lack of showers or lockers | 7-point Likert scale a |
| B7 | Safety when manoeuvring | 7-point Likert scale a |
| B8 | Your physical condition | 7-point Likert scale a |
| B9 | Repairing a puncture | 7-point Likert scale a |
| B10 | Helmet use | 7-point Likert scale a |
| Rate the following statements: | ||
| A1 | In the next six months I will increase the use of the bicycle on my habitual trips | 7-point Likert scale b |
| A2 | Travelling by bicycle in Vitoria-Gasteiz is efficient, convenient and safe | 7-point Likert scale b |
| Age | Sex | Freq. Walking Trips [n] | Average API Time [min] | Average Perceived Time [min] | Threshold (80th Percentile) [km] | Chain Trip Threshold [km] |
|---|---|---|---|---|---|---|
| All (18–84) | M | 2435 | 13.30 | 17.38 | 1.81 | 6.38 |
| F | 4835 | 12.36 | 16.57 | 1.62 | 5.93 | |
| 18–34 | M | 425 | 13.76 | 14.21 | 1.65 | 5.26 |
| F | 686 | 13.76 | 15.85 | 1.73 | 5.07 | |
| 35–49 | M | 657 | 12.81 | 14.97 | 1.66 | 5.38 |
| F | 1708 | 12.45 | 15.83 | 1.60 | 6.09 | |
| 50–64 | M | 586 | 13.61 | 18.27 | 1.83 | 6.60 |
| F | 1400 | 12.61 | 16.61 | 1.68 | 6.43 | |
| 65–84 | M | 767 | 13.16 | 20.47 | 2.04 | 7.86 |
| F | 1041 | 10.95 | 18.23 | 1.60 | 6.00 |
| Age | Sex | Freq. Cycling Trips [n] | Average Times (API) [min] | Perceived Time [min] | Threshold (80th Percentile) [km] |
|---|---|---|---|---|---|
| All (18–84) | M | 725 | 9.65 | 16.44 | 3.70 |
| F | 618 | 8.61 | 16.47 | 3.23 | |
| 18–34 | M | 338 | 9.63 | 16.50 | 3.56 |
| F | 275 | 8.81 | 16.65 | 3.45 | |
| 35–49 | M | 258 | 10.7 | 16.51 | 4.41 |
| F | 263 | 8.91 | 16.07 | 3.28 | |
| 50–64 | M | 97 | 7.51 | 15.30 | 3.53 |
| F | 58 | 6.75 | 15.29 | 2.71 | |
| 65–84 | M | 32 | 7.43 | 18.50 | 3.58 |
| F | 22 | 6.51 | 22 | 3.56 |
| Age | Sex | Car Trips (Total) [N] | SCTs Transferable to Walking [N (%)] | Short Car Trips below the Cycling Threshold [N (%)] | Short Car Trips Transferable to Cycling [N (%)] | Short Car Trips Transferable to Active Modes (Total) [N (%)] |
|---|---|---|---|---|---|---|
| All (18–84) | M | 1436 | 293 (20.40) | 894 (62.25) | 452 (31.47) | 602 (41.92) |
| F | 1837 | 380 (20.68) | 1101 (59.93) | 353 (19.21) | 621 (33.80) | |
| 18–34 | M | 363 | 50 (13.77) | 224 (61.70) | 150 (41.32) | 161 (44.35) |
| F | 356 | 63 (17.69) | 212 (59.55) | 101 (28.37) | 134 (37.64) | |
| 35–49 | M | 643 | 100 (15.55) | 445 (69.20) | 252 (39.19) | 294 (45.72) |
| F | 1036 | 216 (20.84) | 637 (61.48) | 216 (20.84) | 372 (35.90) | |
| 50–64 | M | 226 | 45 (19.91) | 145 (64.15) | 37 (16.37) | 86 (38.05) |
| F | 308 | 76 (24.67) | 162 (52.59) | 28 (9.09) | 89 (28.89) | |
| 65–84 | M | 161 | 46 (28.57) | 92 (57.14) | 17 (10.55) | 51 (31.67) |
| F | 96 | 25 (26.04) | 70 (72.91) | 0 (0) | 25 (26.04) |
| Reclassification of Barriers | |||||||
|---|---|---|---|---|---|---|---|
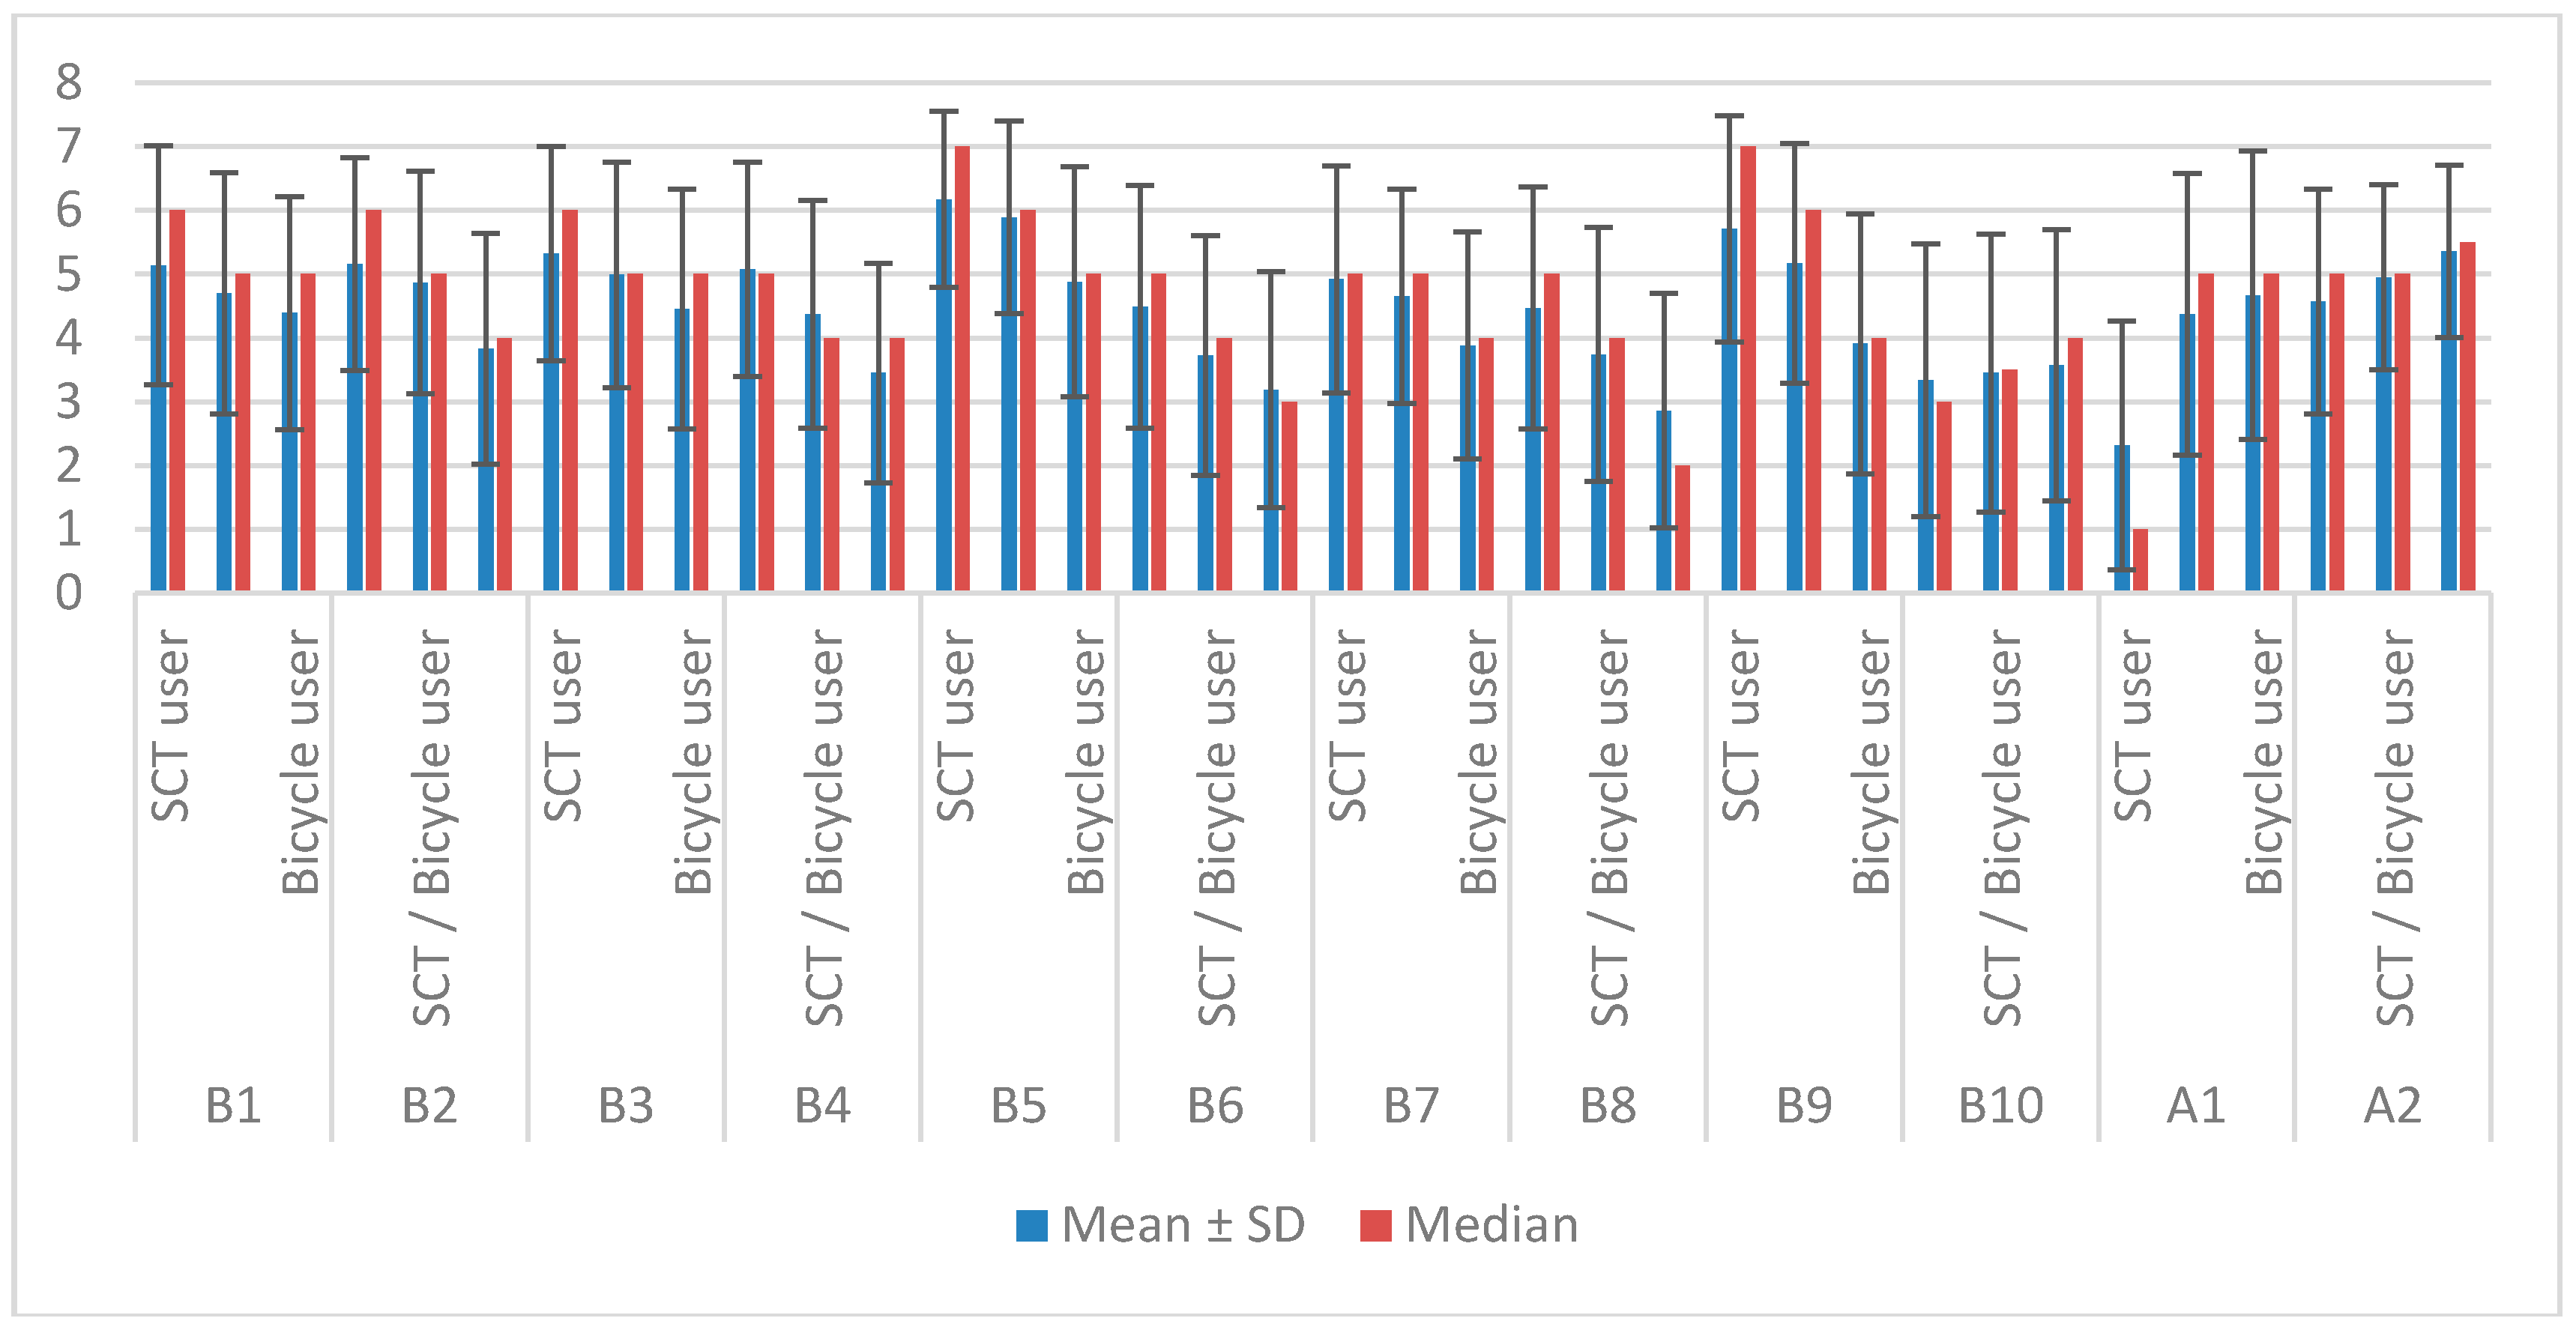
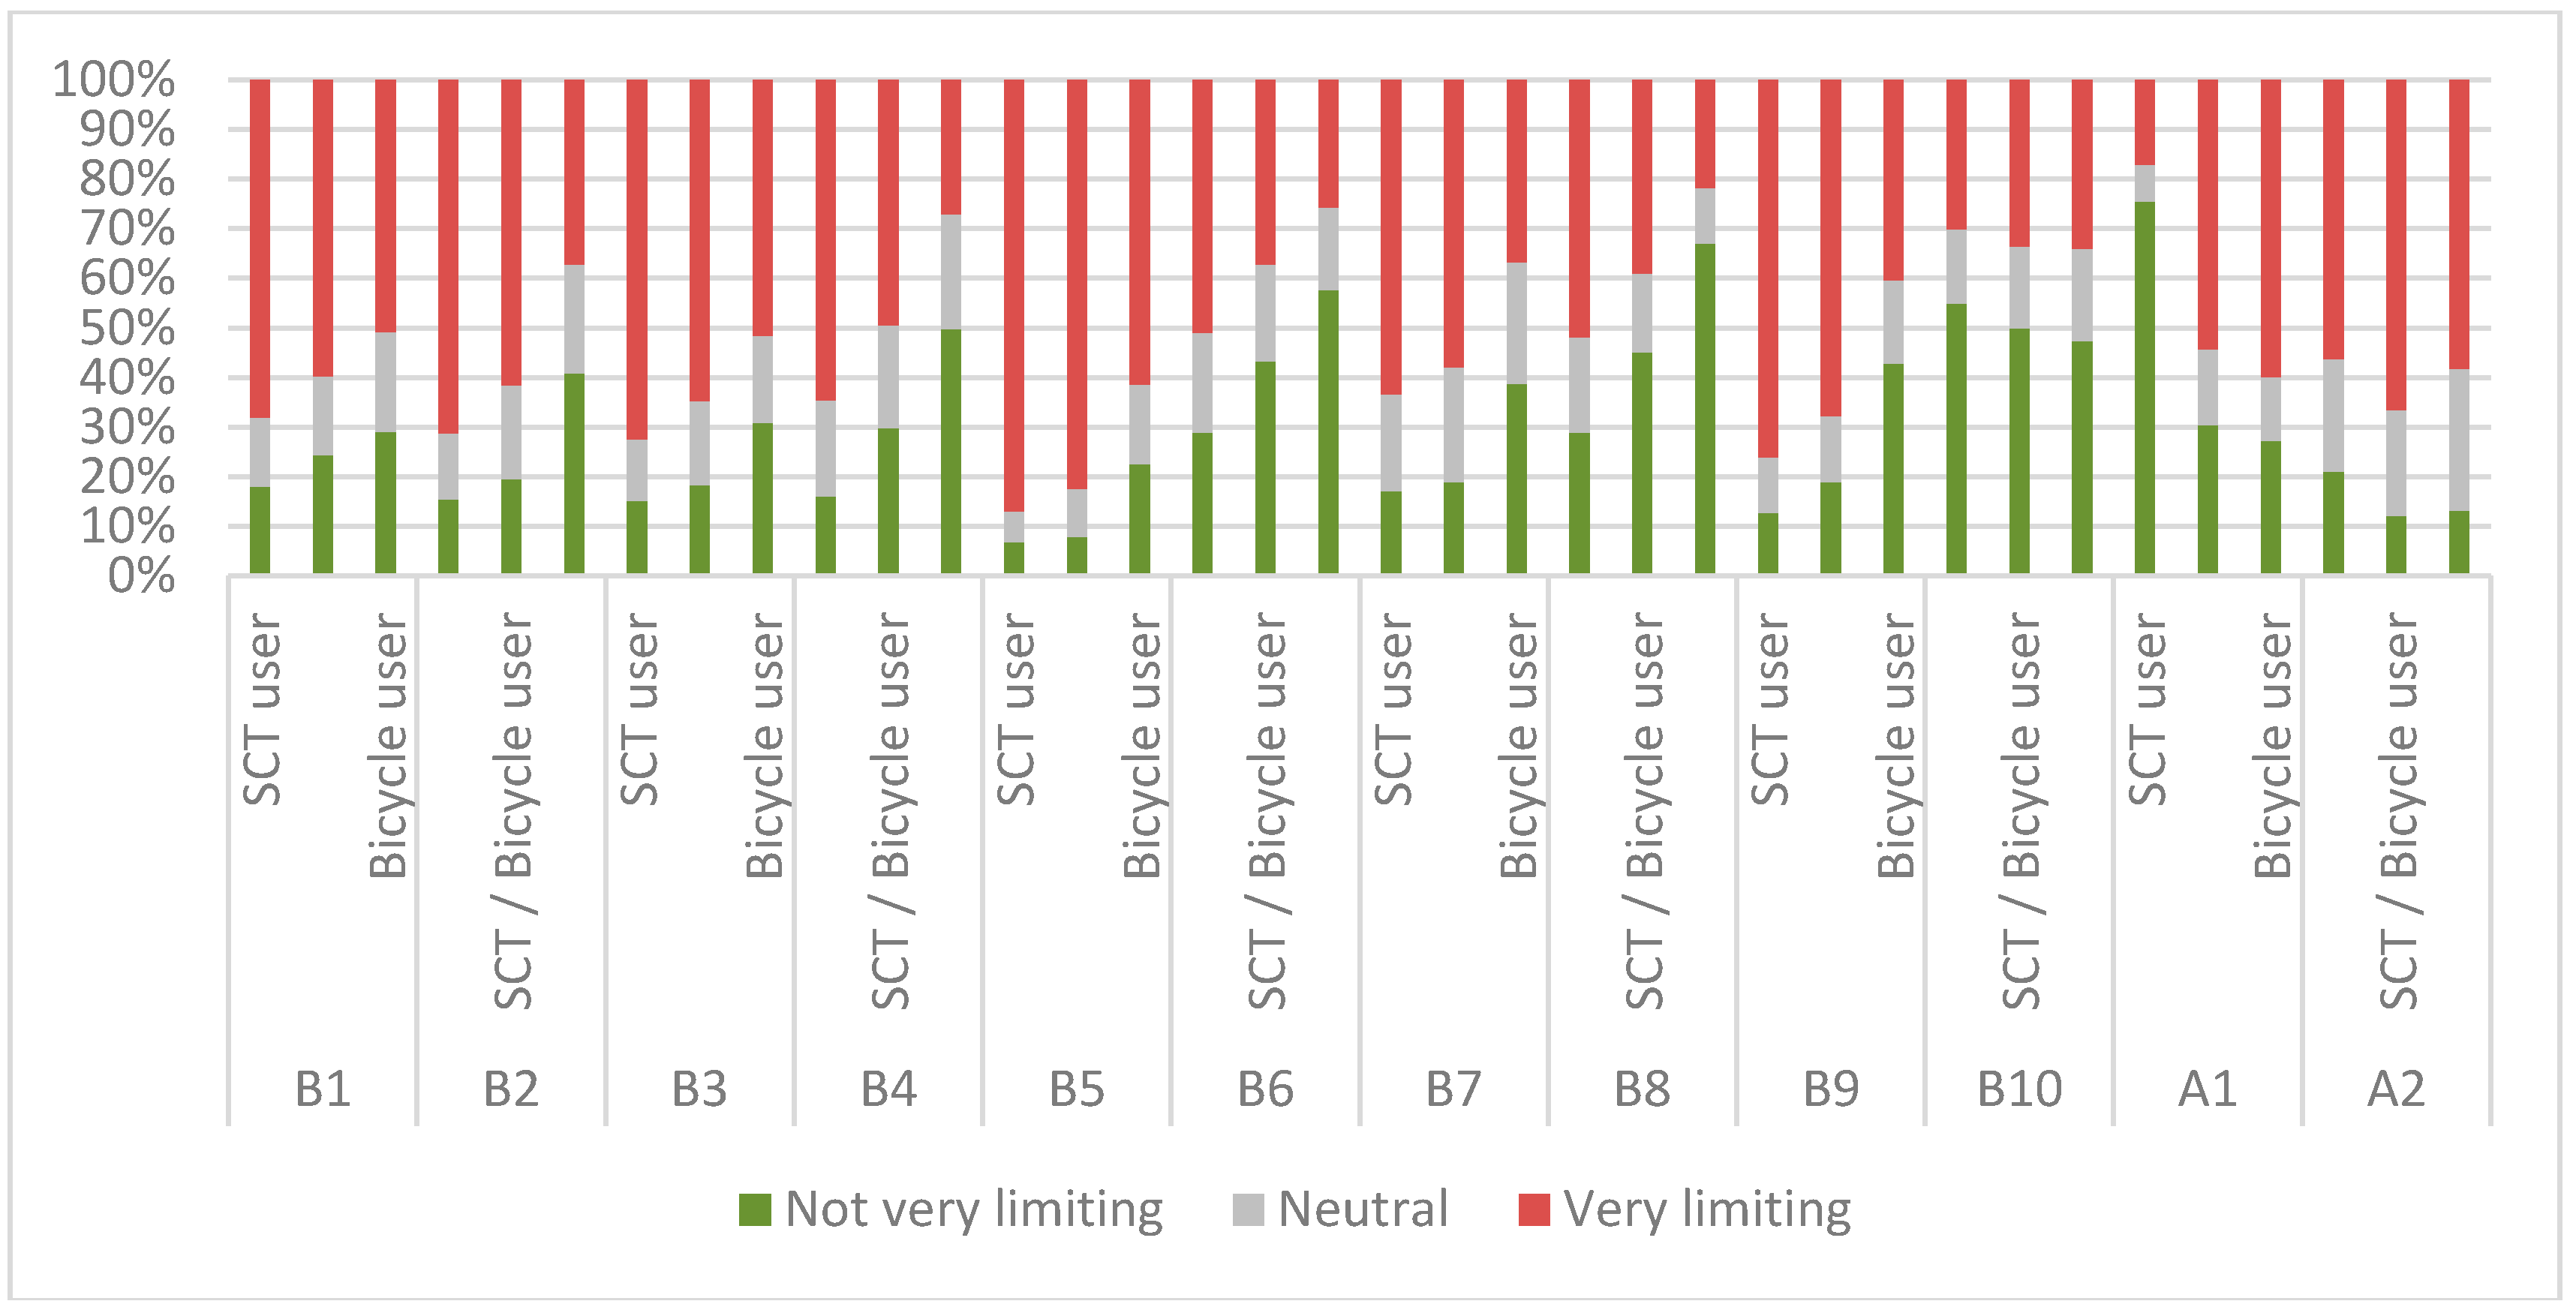
| Barrier | User Groups | Mean (±SD) | Median | Not very Limiting [n (%)] | Neutral [n (%)] | Very Limiting [n (%)] | Cramér’s V |
| B1 | SCT user c | 5.14 (±1.87) | 6 | 58 (18.01) | 45 (13.97) | 219 (68.01) | 0.11 * |
| SCT/Bicycle user d | 4.7 (±1.89) | 5 | 40 (24.39) | 26 (15.85) | 98 (59.75) | ||
| Bicycle user e | 4.39 (±1.83) | 5 | 219 (29.12) | 151 (20.07) | 382 (50.79) | ||
| B2 | SCT user c | 5.16 (±1.67) | 6 | 50 (15.52) | 43 (13.35) | 229 (71.11) | 0.22 * |
| SCT & Bicycle user d | 4.87 (±1.74) | 5 | 32 (19.51) | 31 (18.9) | 101 (61.58) | ||
| Bicycle user e | 3.83 (±1.81) | 4 | 308 (40.95) | 164 (21.8) | 280 (37.23) | ||
| B3 | SCT user c | 5.32 (±1.68) | 6 | 49 (15.21) | 40 (12.42) | 233 (72.36) | 0.14 * |
| SCT & Bicycle user d | 4.99 (±1.77) | 5 | 30 (18.29) | 28 (17.07) | 106 (64.63) | ||
| Bicycle user e | 4.45 (±1.88) | 5 | 232 (30.85) | 132 (17.55) | 388 (51.59) | ||
| B4 | SCT user c | 5.08 (±1.68) | 5 | 52 (16.14) | 62 (19.25) | 208 (64.59) | 0.25 * |
| SCT & Bicycle user d | 4.37 (±1.79) | 4 | 49 (29.87) | 34 (20.73) | 81 (49.39) | ||
| Bicycle user e | 3.45 (±1.72) | 4 | 375 (49.86) | 173 (23) | 204 (27.12) | ||
| B5 | SCT user c | 6.17 (±1.38) | 7 | 22 (6.83) | 20 (6.21) | 280 (86.95) | 0.19 * |
| SCT & Bicycle user d | 5.89 (±1.51) | 6 | 13 (7.92) | 16 (9.75) | 135 (82.31) | ||
| Bicycle user e | 4.88 (±1.8) | 5 | 170 (22.6) | 121 (16.09) | 461 (61.3) | ||
| B6 | SCT user c | 4.49 (±1.9) | 5 | 93 (28.88) | 65 (20.18) | 164 (50.93) | 0.18 * |
| SCT & Bicycle user d | 3.73 (±1.88) | 4 | 71 (43.29) | 32 (19.51) | 61 (37.19) | ||
| Bicycle user e | 3.19 (±1.85) | 3 | 433 (57.57) | 126 (16.75) | 193 (25.66) | ||
| B7 | SCT user c | 4.92 (±1.78) | 5 | 55 (17.08) | 63 (19.56) | 204 (63.35) | 0.19 * |
| SCT & Bicycle user d | 4.65 (±1.68) | 5 | 31 (18.9) | 38 (23.17) | 95 (57.92) | ||
| Bicycle user e | 3.88 (±1.78) | 4 | 292 (38.82) | 184 (24.46) | 276 (36.7) | ||
| B8 | SCT user c | 4.47 (±1.9) | 5 | 93 (28.88) | 62 (19.25) | 167 (51.86) | 0.24 * |
| SCT & Bicycle user d | 3.74 (±1.99) | 4 | 74 (45.12) | 26 (15.85) | 64 (39.02) | ||
| Bicycle user e | 2.86 (±1.84) | 2 | 504 (67.02) | 84 (11.17) | 164 (21.8) | ||
| B9 | SCT user c | 5.71 (±1.77) | 7 | 41 (12.73) | 36 (11.18) | 245 (76.08) | 0.24 * |
| SCT & Bicycle user d | 5.17 (±1.88) | 6 | 31 (18.9) | 22 (13.41) | 111 (67.68) | ||
| Bicycle user e | 3.91 (±2.04) | 4 | 322 (42.81) | 126 (16.75) | 304 (40.42) | ||
| B10 | SCT user c | 3.34 (±2.14) | 3 | 177 (54.96) | 48 (14.9) | 97 (30.12) | 0.05 |
| SCT & Bicycle user d | 3.45 (±2.18) | 3.5 | 82 (50) | 27 (16.46) | 55 (33.53) | ||
| Bicycle user e | 3.57 (±2.13) | 4 | 357 (47.47) | 139 (18.48) | 256 (34.04) | ||
| Reclassification of Barriers | |||||||
|---|---|---|---|---|---|---|---|
| Barrier | User Groups | Mean (±SD) | Median | Totally Disagree [n (%)] | Neutral [n (%)] | Totally Agree [n (%)] | Cramér’s V |
| A1 | SCT user c | 2.31 (±1.95) | 1 | 243 (75.46) | 24 (7.45) | 55 (17.08) | 0.30 * |
| SCT & Bicycle user d | 4.37 (±2.21) | 5 | 50 (30.48) | 25 (15.24) | 89 (54.26) | ||
| Bicycle user e | 4.67 (±2.26) | 5 | 205 (27.26) | 97 (12.89) | 450 (59.84) | ||
| A2 | SCT user c | 4.57 (±1.76) | 5 | 68 (21.11) | 73 (22.67) | 181 (56.21) | 0.14 * |
| SCT & Bicycle user d | 4.95 (±1.45) | 5 | 20 (12.19) | 35 (21.34) | 109 (66.46) | ||
| Bicycle user e | 5.36 (±1.35) | 5.5 | 60 (7.97) | 129 (17.15) | 56 (34.86) | ||
© 2018 by the authors. Licensee MDPI, Basel, Switzerland. This article is an open access article distributed under the terms and conditions of the Creative Commons Attribution (CC BY) license (http://creativecommons.org/licenses/by/4.0/).
Share and Cite
Delso, J.; Martín, B.; Ortega, E. Potentially Replaceable Car Trips: Assessment of Potential Modal Change towards Active Transport Modes in Vitoria-Gasteiz. Sustainability 2018, 10, 3510. https://doi.org/10.3390/su10103510
Delso J, Martín B, Ortega E. Potentially Replaceable Car Trips: Assessment of Potential Modal Change towards Active Transport Modes in Vitoria-Gasteiz. Sustainability. 2018; 10(10):3510. https://doi.org/10.3390/su10103510
Chicago/Turabian StyleDelso, Javier, Belén Martín, and Emilio Ortega. 2018. "Potentially Replaceable Car Trips: Assessment of Potential Modal Change towards Active Transport Modes in Vitoria-Gasteiz" Sustainability 10, no. 10: 3510. https://doi.org/10.3390/su10103510
APA StyleDelso, J., Martín, B., & Ortega, E. (2018). Potentially Replaceable Car Trips: Assessment of Potential Modal Change towards Active Transport Modes in Vitoria-Gasteiz. Sustainability, 10(10), 3510. https://doi.org/10.3390/su10103510